Article

Influence of Irrigation Water Discharge Frequency on Soil Salt Removal and Rice Yield in a Semi-Arid and Saline-Sodic Area

1
Northeast Institute of Geography and Agroecology, Chinese Academy of Sciences, Changchun, Jilin 130102, China
2
University of Chinese Academy of Sciences, No.19A Yuquan Road, Beijing 100049, China
3
School of Renewable Natural Resources, Louisiana State University Agricultural Center, Baton Rouge, LA 70803, USA
*
Author to whom correspondence should be addressed.
Water 2013, 5(2), 578-592; https://doi.org/10.3390/w5020578
Submission received: 28 February 2013 / Revised: 2 April 2013 / Accepted: 23 April 2013 / Published: 7 May 2013

Abstract

:
Irrigation practice for rice culture can be especially challenging in areas with limited water supply and soil salinization. In this study, we carried out a field experiment to assess the effects of different water discharge frequencies on soil salt content, rice yield and water use efficiency on a saline-sodic soil in a semi-arid region of Northeast China. The experiment comprised of three frequency levels of discharge [9-time (I-9-30), 6-time (I-6-30) and 3-time (I-3-30) discharge, all followed with a 30-mm irrigation] in comparison with the traditional irrigation practice of 2-time discharge followed with an 80-mm irrigation (I-2-80). Our initial hypothesis was that increasing discharge frequency would increase both salt reduction and rice yield. Daily precipitation was recorded by a nearby weather station, and evapotranspiration and soil water percolation rates were measured at experimental sites using soil pits. The measurements were used to establish a water balance for each treatment. Our results showed that soil salt reduction increased with the increasing discharge frequency at a 30-mm irrigation water depth. The 9-time discharge reduced a large amount of soil salt (995.0 kg ha−1) after five months of the study. Rice yield also increased with the increasing discharge frequency with a 30-mm irrigation water depth; however, when compared to the traditional 2-time discharge followed with an 80-mm irrigation, rice yield at the sites with more frequent discharge (i.e., I-9-30, I-6-30 and I-3-30) was 11%–18% lower. Because of this, rice yield and irrigation water use efficiency were significantly higher under the traditional practice of high-irrigation with low-frequency discharge (I-2-80) than under I-9-30, I-6-30 and I-3-30. These results indicate a need for a trade-off amongst salt reduction, rice yield and water use when considering selection of irrigation and discharge schedules.

1. Introduction

Covering approximately 187,000 km2, the Songnen Plain in northeast China is among the country’s most important commodity grain production bases, where much of the rice crop is cultivated [1,2]. With over 17% of the plain’s land being saline-sodic soils and about 200 km2 land becoming salinized each year [3,4], soil degradation resulting from salinization and alkalization is a major threat to agricultural productivity and sustainability [5,6,7,8]. Ameliorating these soils is imperative for supporting long-term productivity, to meet future challenges of food security in China.
Many different ways have been used to ameliorate salt-affected soils over the last 100 years including crop-assisted interventions, tillage operations, chemical amendments, water-related treatments, and electrical currents [9,10,11,12,13]. However, these methods often bring prohibitively high costs for local farmers or are ineffective.
In the recent decade, there is now a general consensus that irrigated rice culture is an effective low-cost amelioration approach to prevent and/or reduce soil salinization [14,15,16]. Ameliorating salt-affected soils by irrigated rice culture can be accomplished through one or more of the following: (1) biological activity, i.e., the biological activity of rice roots can reduce soil exchangeable sodium percentage, increase the percolation rate, and lower soil pH to an extent [17,18,19,20]; (2) leaching, i.e., the standing water in the irrigated rice field can transporting salts downward and blocking capillary rise of salt from the water table to the soil surface [21]; and (3) surface runoff. The first approach is difficult to control, whereas the irrigation and discharge schedule can affect at least the last two of the above three approaches. In fact, due to poor permeability of saline-sodic soil on the Songnen Plain [22,23], the salt losses may mainly depend on surface runoff rather than leaching. However, while effects of different irrigation schedules on soil salt and rice yield were widely reported [24,25,26,27], few field studies exist on the effect of discharge frequency on salt removal of saline-sodic soils under rice culture, a knowledge that is crucial for large-scale rice paddy management on China’s Songnen Plain.
The climate of the Songnen Plain is characterized by semi-arid continental monsoons. Seasonal water shortage and inadequate use (e.g., excess irrigation) have been among the most critical issues in agriculture of this region [28]. With the projected increase of temperature for the region [29], it is essential to develop water saving irrigation strategies or to improve water use efficiency to meet future challenges. There are two prevalent water saving methods, i.e., wet saving and dry saving. Wet saving is achieved by reducing the unproductive water losses by soil water evaporation or evapotranspiration [30,31]. In practice, it can be achieved by growing short duration variety requiring less water [32] and shifting the transplanting date to the period with lower relative evaporative demand [33]. Dry saving is achieved through reduction in irrigation water applied by submergence non-submergence (SNS) technology or intermittent irrigation applied, a few days after water has disappeared from the soil surface [34,35,36]. Liu et al. [25] carried out a field experiment to determine the effect of dry saving on rice yield on a salt-affected soil in a yellow river irrigation area of Ningxia and their results showed that dry saving led to a rise in rice production. However, saline-sodic soil dominated by carbonate and bicarbonate salts in Songnen plain becomes alkaline and the combination of salinity and alkalinity may be more harmful than either alone [37]. Thus, dry saving may not be suitable for this soil as it would cause high salt concentration in root zone and then constrain crop growth and bring about yield loss. This was confirmed by Wang’s [27] study that rice yield performed better at the irrigation water depth of 70 mm than at 40 mm and 10 mm in a saline-sodic soil on the Songnen Plain. Consequently, continual flood irrigation with a proper water layer maybe still need to ameliorate the saline-sodic soil on the Songnen Plain. Now that it is difficult to save water by reducing irrigation amount on the saline-sodic soil, improving irrigation water use efficiency is quite important. The discharge schedule is an important practice in rice cultivation and can affect irrigation water use efficiency. However, little information exists on the effects of discharge frequency on irrigation water use efficiency. The knowledge can be vital to developing effective irrigation water management for rice cultivation on saline-sodic soils.
This study was carried out on a saline-sodic soil in the Qianguo Irrigation District on the Songnen Plain. The study aimed to: (1) assess changes in salt mass of top 20-cm root zone soil before rice transplanting and after rice harvesting under different discharge schedules; (2) examine the effects of discharge schedules on rice yield and yield components; (3) determine water consumption, irrigation water use efficiency (IWUE) and water use efficiency (WUE) under different discharge schedules.

2. Materials and Methods
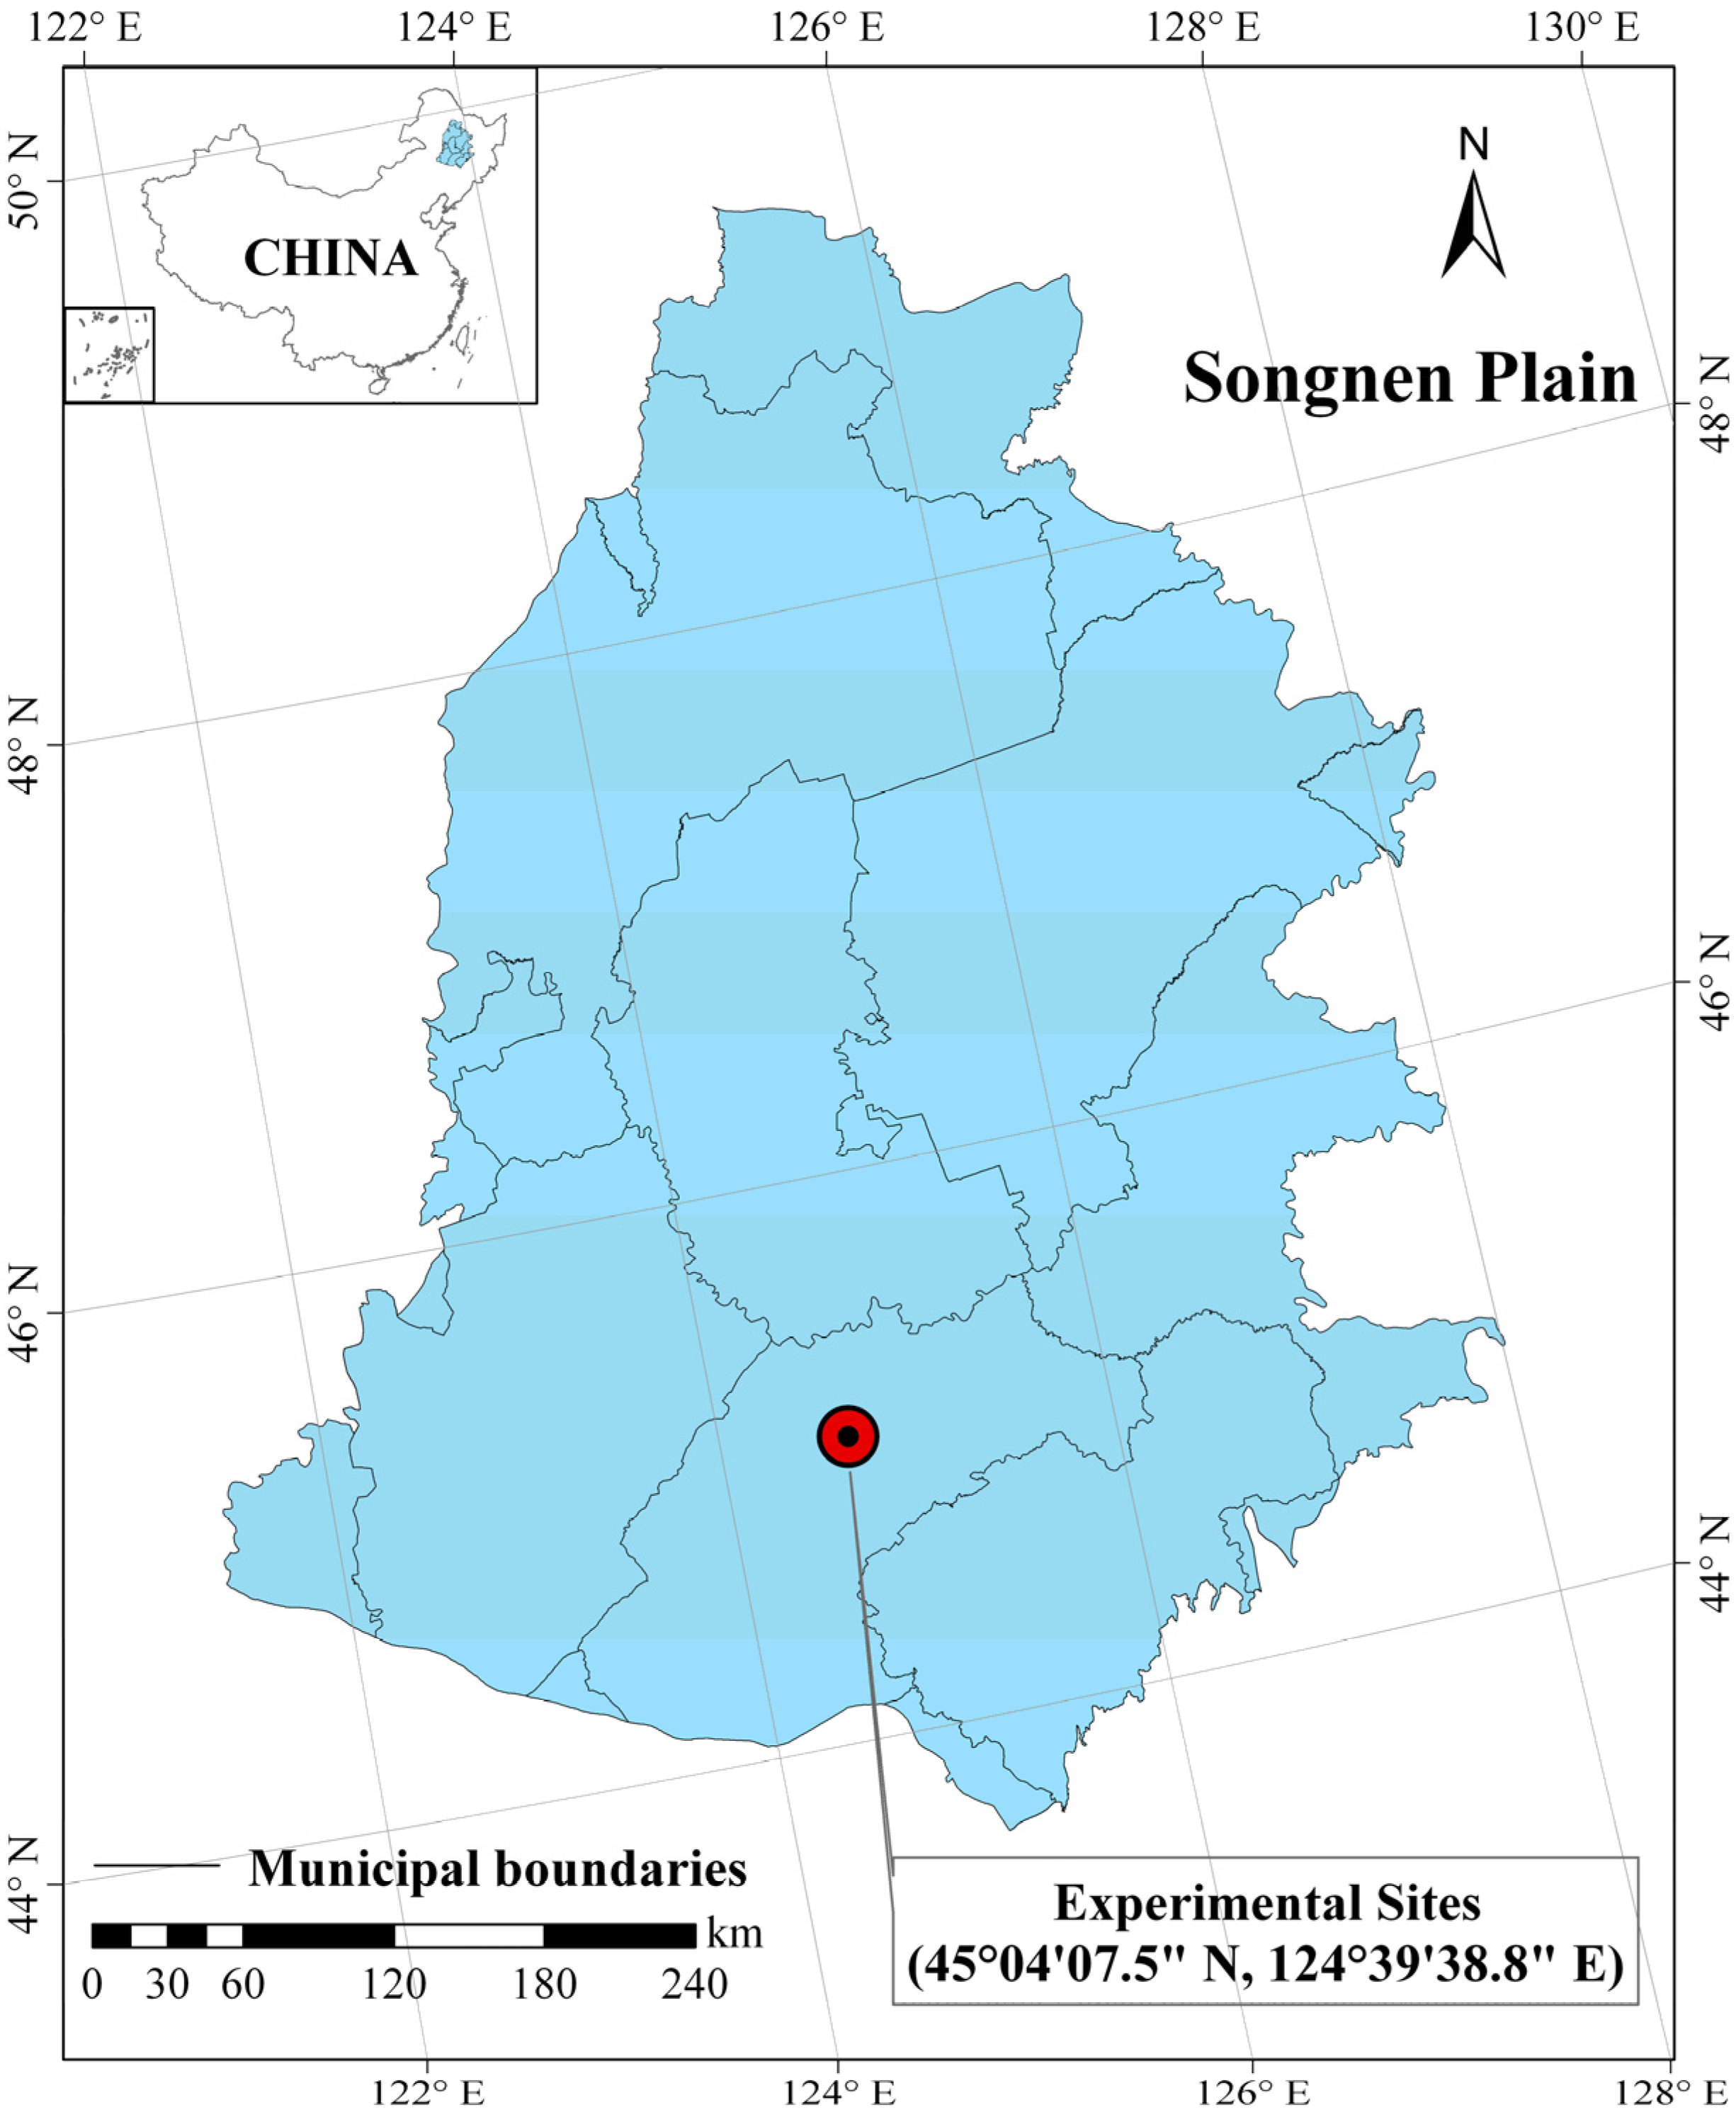
2.1. Study Site

The experiment sites were located in the southern part of the Songnen Plain (latitude 45°04'07.5" N, longitude 124°39'38.8" E, Figure 1). The region has a semi-arid continental monsoon climate with an annual precipitation varying approximately from 350 to 600 mm, an annual temperature of 4.0–5.5 °C, and an annual evaporation rate up to 1100 mm [4]. Precipitation is concentrated in the summer, making approximately 90% of the annual total precipitation during the period from May to October. Major agriculture crops cultivated on the plain include rice, wheat, corn and soybean, with their average grain yield of 5.23, 2.81, 4.36 and 1.82 t ha−1, respectively [4]. Main soil types on the Songnen Plain include paddy soil, black soil, chernozem, meadow soil, swamp soil, halic soil, and sandy soil [4]. In the semiarid regions of China, soil salinity is divided into low (20-cm soil salt content between 1000 mg kg−1 and 2000 mg kg−1), moderate (20-cm soil salt content between 2000 mg kg−1 and 4000 mg kg−1), and high salinity (20-cm top soil salt content between 4000 mg kg−1 and 6000 mg kg−1). 20-cm initial top root zone soils at the study sites were low salinity and were loamy with a composition of Clay:Silt:Sand = 8.5:43.7:47.8. The average salt content, EC1:5, pH value and bulk density of the initial top soils were 1653.9 mg kg−1, 254.0 μS cm−1, 8.9 and 1.3 g cm−3, respectively. The average content of the Na+, Mg2+, K+, Ca2+, CO32−, HCO3, Cl, SO42− in the initial top soils layer were 442.5, 31.4, 12.5, 64.4, 10.5, 901.0, 94.1 and 97.6 mg kg−1, respectively.
Figure 1. Geographical location of the study site in Jilin Province, Northeast China.
Water 05 00578 g001

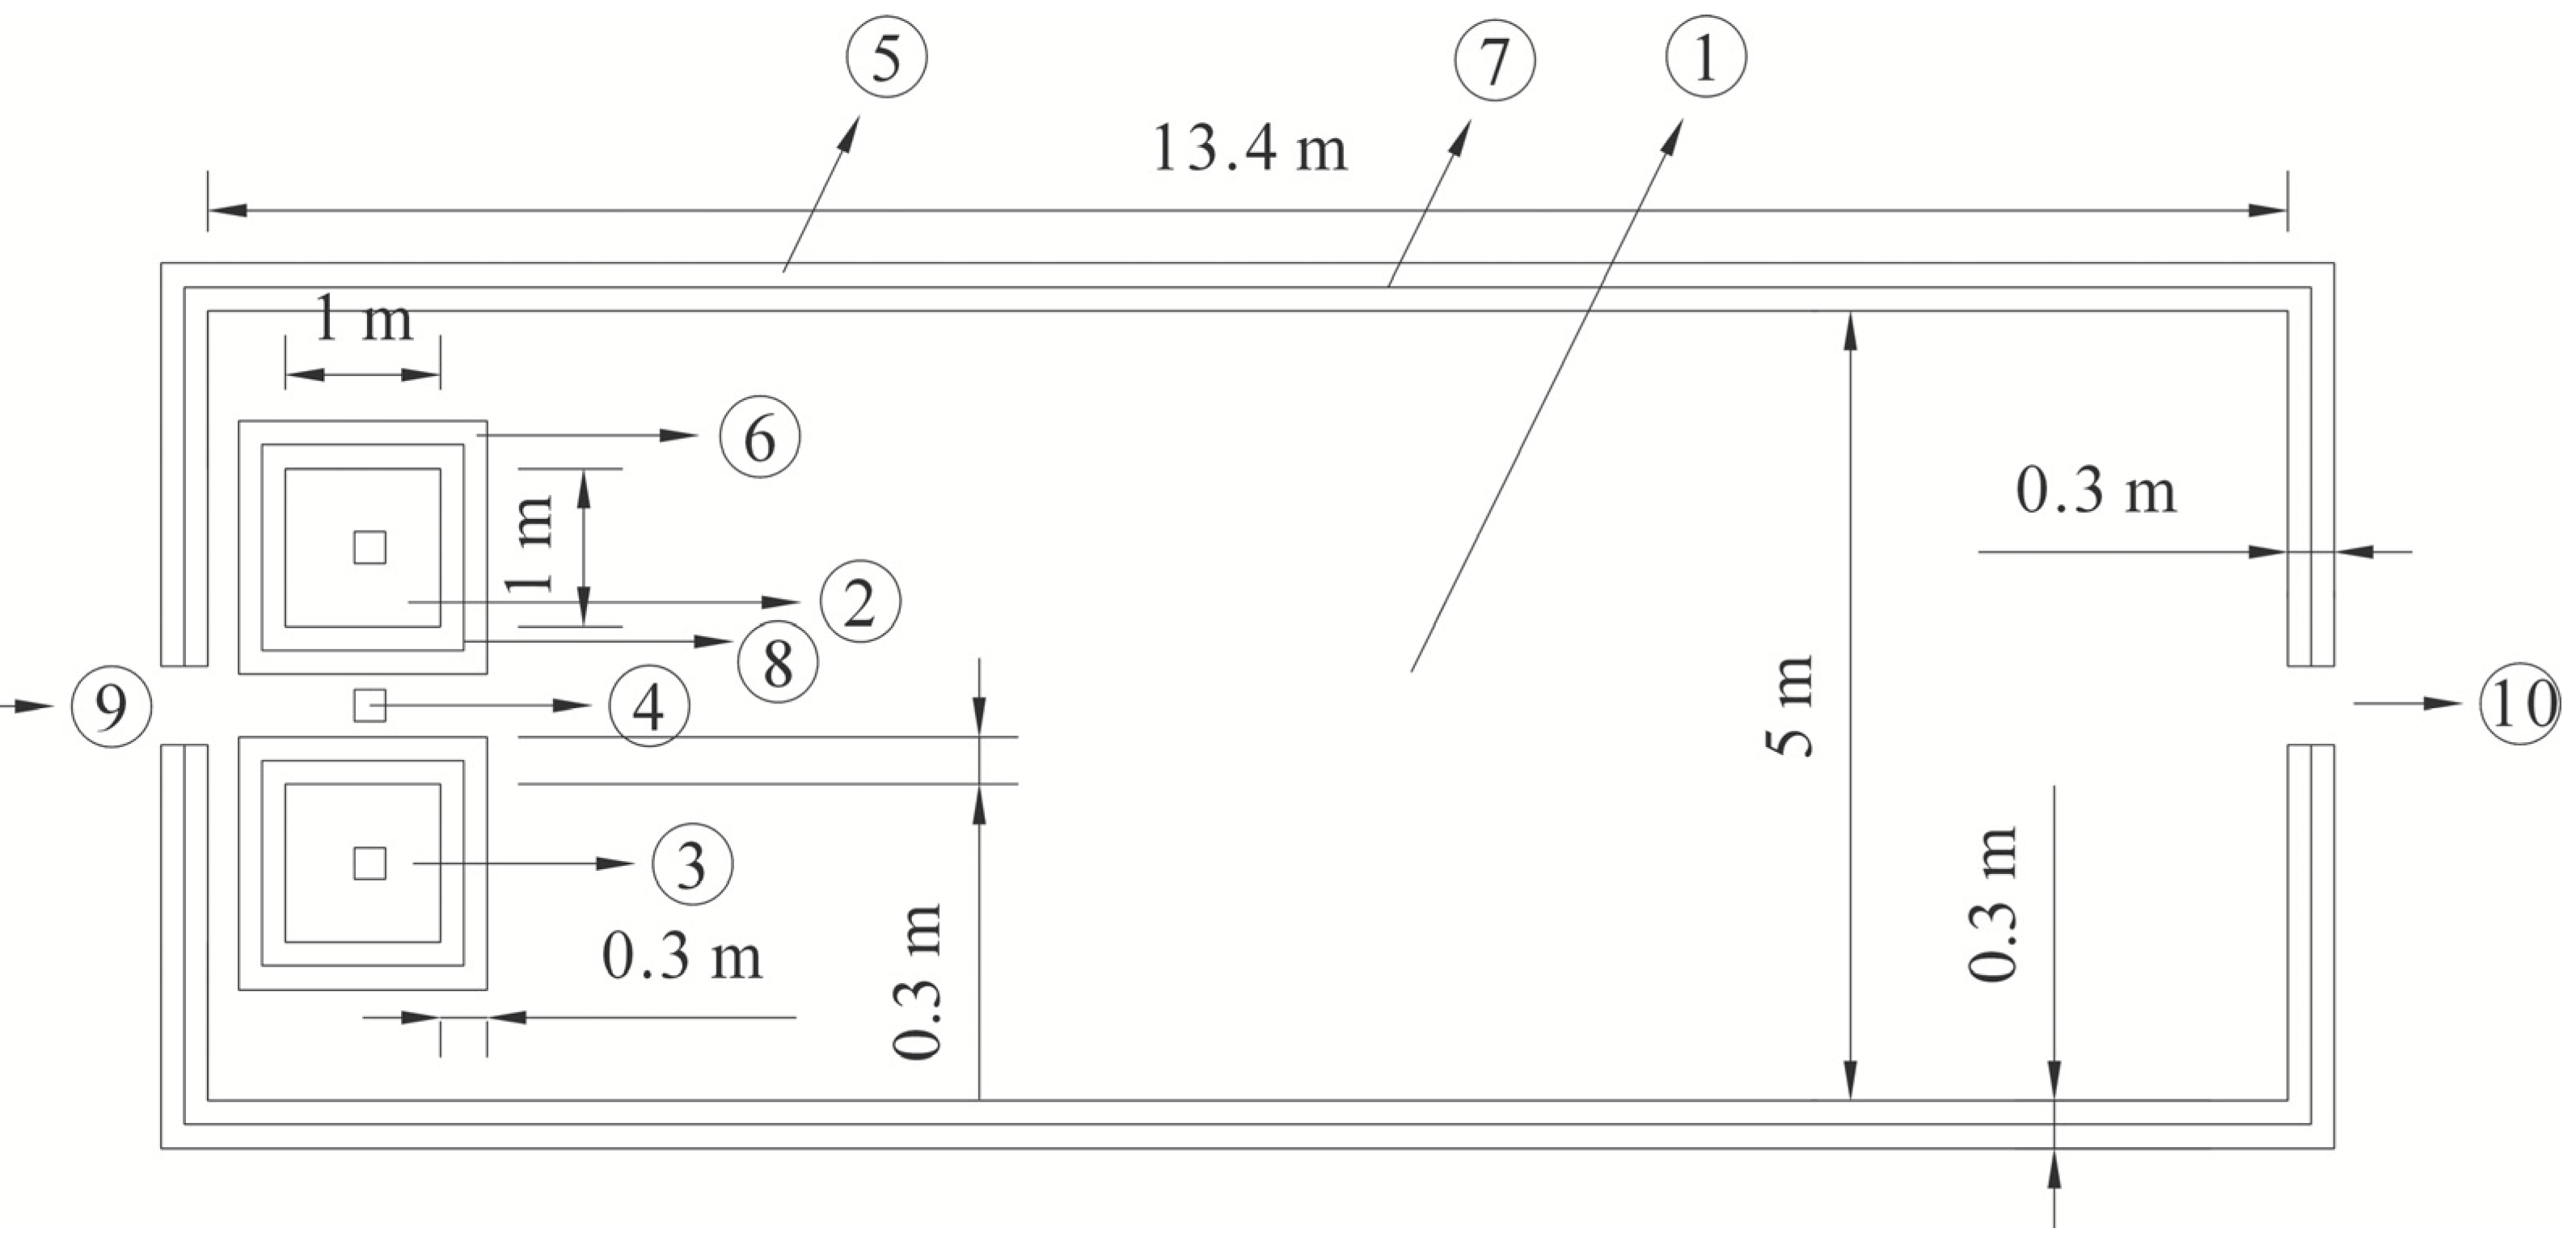
2.2. Experiment Design

This study used a complete randomized plot design with three treatments on a low saline-sodic soil. The treatment plot was rectangular, 13.4 m long and 5 m wide, surrounded on all sides by a 0.3 m × 0.2 m ridge for irrigation flood (Figure 2). To prevent seepage from one plot to another, plastic films were installed uprightly in the middle of the ridges. Four irrigation and discharge treatment schedules were experimented: (1) 30-mm irrigation water depth with 9-time discharge (I-9-30); (2) 30-mm irrigation water depth with 6-time discharge (I-6-30); (3) 30-mm irrigation water depth with 3-time discharge (I-3-30); and (4) 80-mm irrigation water depth with 2-time discharge (I-2-80). The plots under all treatments were first filled with 150 mm of water prior to rice planting; they were then completely drained after 10 days, and were filled again with 20 mm of water at the time of rice transplanting. After that, the I-9-30, I-6-30, I-3-30 and I-2-80 treatments were irrigated to a water depth of 30, 30, 30 and 80 mm, respectively. Irrigation water was applied again under all treatments when water disappeared from the soil surface (Table 1). The irrigation regimes were repeated from returning green stage (RGS) to yellow ripening stage (YRS). The treatment plots under I-9-30 were then discharged eight times, namely on 5 June, 10 June, 20 June, 10 July, 20 July, 10 August, 20 August and 20 September 2011. The treatment plots under I-6-30 were then discharged five times: on 5 June, 10 June, 10 July, 10 August and 20 September. The treatment plots under I-2-80 were then discharged two times on 5 June and 20 September. The treatment plots under I-2-80 were then discharged only one time on 20 September (Table 2). At each discharge, the plots were completely drained and were then irrigated immediately after. Floodwater from precipitation ran out naturally when it exceeded 0.2 m (the height of the plot ridge), and this portion of discharged water was accounted for the total discharged water.
Figure 2. Schematic diagram of the experiment plot. ① Plot; ② Test pits with bottoms; ③ Test pits without bottoms; ④ Staff gauge; ⑤, ⑥ Clay ridge; ⑦, ⑧ Seal with plastic films; ⑨ Water inlet; ⑩ Water outlet.
Water 05 00578 g002
Table 1. Paddy field water depth at different rice growth stage (mm). PTS is pre-transplantation stage, RTS is rice transplantation stage, RGS is returning green stage, TS is tillering stage, JBS is jointing-booting stage, YRS is yellow ripening stage.
TreatmentsPTSRTSRGSTSJBSYRS
I-9-301502030303030
I-6-301502030303030
I-3-301502030303030
I-2-801502080808080
Table 2. Paddy field discharge schedule. PTS is pre-transplantation stage.
TreatmentsPTS5 June10 June20 June10 July20 July10 August20 August20 September
I-9-30111111111
I-6-30111010101
I-3-30110000001
I-2-80100000001
A high-yield rice cultivar, Jijing 88, was used in this study. Seedlings of 40 days were transplanted in the experiment plots on 27 May 2011. The planting spacing was 0.13 m × 0.3 m in and between rows. Before planting a popular basal fertilizer, “Special fertilizer for rice” (Liaoning Northeast Abundant Specific Fertilizer Co., LTD., Tieling, China) with a composition of N:P:K = 18:14:14, was applied at the rate of 500 kg ha−1 for each plot. In addition, the following fertilizers and pesticides were applied at different growing stages: 50 kg ha−1 of urea, 2 kg ha−1 of butachlor and 0.3 kg ha−1 of bensulfuron-methyl were top dressed at the returning green stage; 100 kg ha−1 of urea was top dressed at the beginning of tillering stage; 175 kg ha−1 of urea was top dressed at the maximum tillering stage; and 5 kg ha−1 of isoprothiolane was top dressed at the heading stage. Rice was harvested from all plots on 9 October 2011.

2.3. Measurements

Test pits of 1 m × 1 m × 0.3 m with and without bottom seal with plastic films were constructed for evapotranspiration and soil percolation measurements (Figure 2). Pits with bottoms had bottoms and four side walls fully enclosed by plastic films, whereas pits without bottoms only had four side walls fully enclosed by plastic films. Water consumption in the test pits with bottoms was lost only through evapotranspiration, while water consumption in the test pits without bottoms was considered the total of evapotranspiration and soil percolation. Staff gauges were installed in the experiment plots and test pits to record changes in water depth. Irrigation and drainage waters were measured by the staff gauges.
Rainfall was recorded at a meteorological observation station of the Key Experimental Station of Irrigation Management Bureau of Qianguo Irrigation District, which was approximately 0.4 km south of the experiment plots.
When rice grains were mature, five plants were randomly selected from each plot and harvested to determine yields of different components, including panicle number per plant, spikelet per panicle, seed setting rate and 1000-grain weight. All plots were harvested to determine the final yields.

2.4. Soil and Water Sampling and Analysis

Five composed soil samples were taken from the root zone soil (20-cm top soil) at the corners and center of each plot two-time during the study period: (1) before transplanting (BT) and (2) harvest time (HT). The samples were air dried, from which soil solutions were extracted (1:5 soil:water). The solutions were analyzed for Na+, Mg2+, K+, Ca2+, CO32−, HCO3, Cl, SO42− and EC1:5. CO32− and HCO3 were determined by double indicator-and titration [38]; Cl was determined by nitric acid silver titration [38]; SO42− was determined by an ultraviolet spectrophotometer (UV-2550, Shimadzu Corporation, Kyoto, Japan); and all other elements were determined with an inductively coupled plasma emission spectrometer (ICPS-7500, Shimadzu Corporation, Kyoto, Japan). Salt mass of top 20-cm root zone soil was calculated as the sum of Na+, Mg2+, K+, Ca2+, CO32−, HCO3, Cl and SO42− [38]. EC1:5 was determined by a conductivity meter (DDS-307, Shanghai Leici, Shanghai, China). Soil pH was determined by a pH meter (PHS-3C, Shanghai Leici, Shanghai, China).
Irrigation and discharged waters were sampled each time with three repeats. The water samples were analyzed for the same chemical elements with the same analytical methods as described above for the extracted soil solutions.

2.5. Data Analysis

Mass changes in root zone salt content (ΔS, kg ha−1) before rice transplanting and after rice harvesting was determined as follows:
ΔS = (ISCFSC) × B × A × T
where ISC is the initial salt content of top 20-cm root zone soil (i.e., before transplanting, kg kg−1), FSC is the final salt content of the top 20-cm root zone soil (i.e., harvest time, kg kg−1), B is the bulk density of the top 20-cm root zone soil (kg m−3), A is the land area (A = 10,000 m2), and T is thickness of root zone soil (i.e., T = 0.2 m).
Based on a water balance principle, the change of field surface water depth (ΔW, mm) can be computed by:
ΔW = (P + I) − (ET + DP + D)
where P is precipitation (mm), I is irrigation amount (mm), ET is evapotranspiration (mm), DP is deep percolation (mm) and D is discharge amount (mm). P and I can be considered as water supply, while ET, DP and D can be considered as water consumption during the rice production.
Irrigation water use efficiency (IWUE, kg ha−1 mm−1) may be calculated as units of rice yield per unit land area divided by irrigation quantity:
IWUE = Y/I
where Y is rice yield (kg ha−1), I is irrigation quantity (mm).
Another key parameter for evaluating rice crop system efficiency is the water use efficiency (WUE, kg ha−1 mm−1):
WUE = Y/ET
where Y is rice yield (kg ha−1), ET is evapotranspiration (mm).
A one factor analysis of variance (ANOVA) was performed to determine treatment effects. If significant differences were revealed, Turkey’s multiple range tests (p ≤ 0.05) were used for the separation of means. All statistical procedures were performed using SPSS 18.0 (Version 18.0, SPSS, Chicago, IL, USA).

3. Results and Discussion

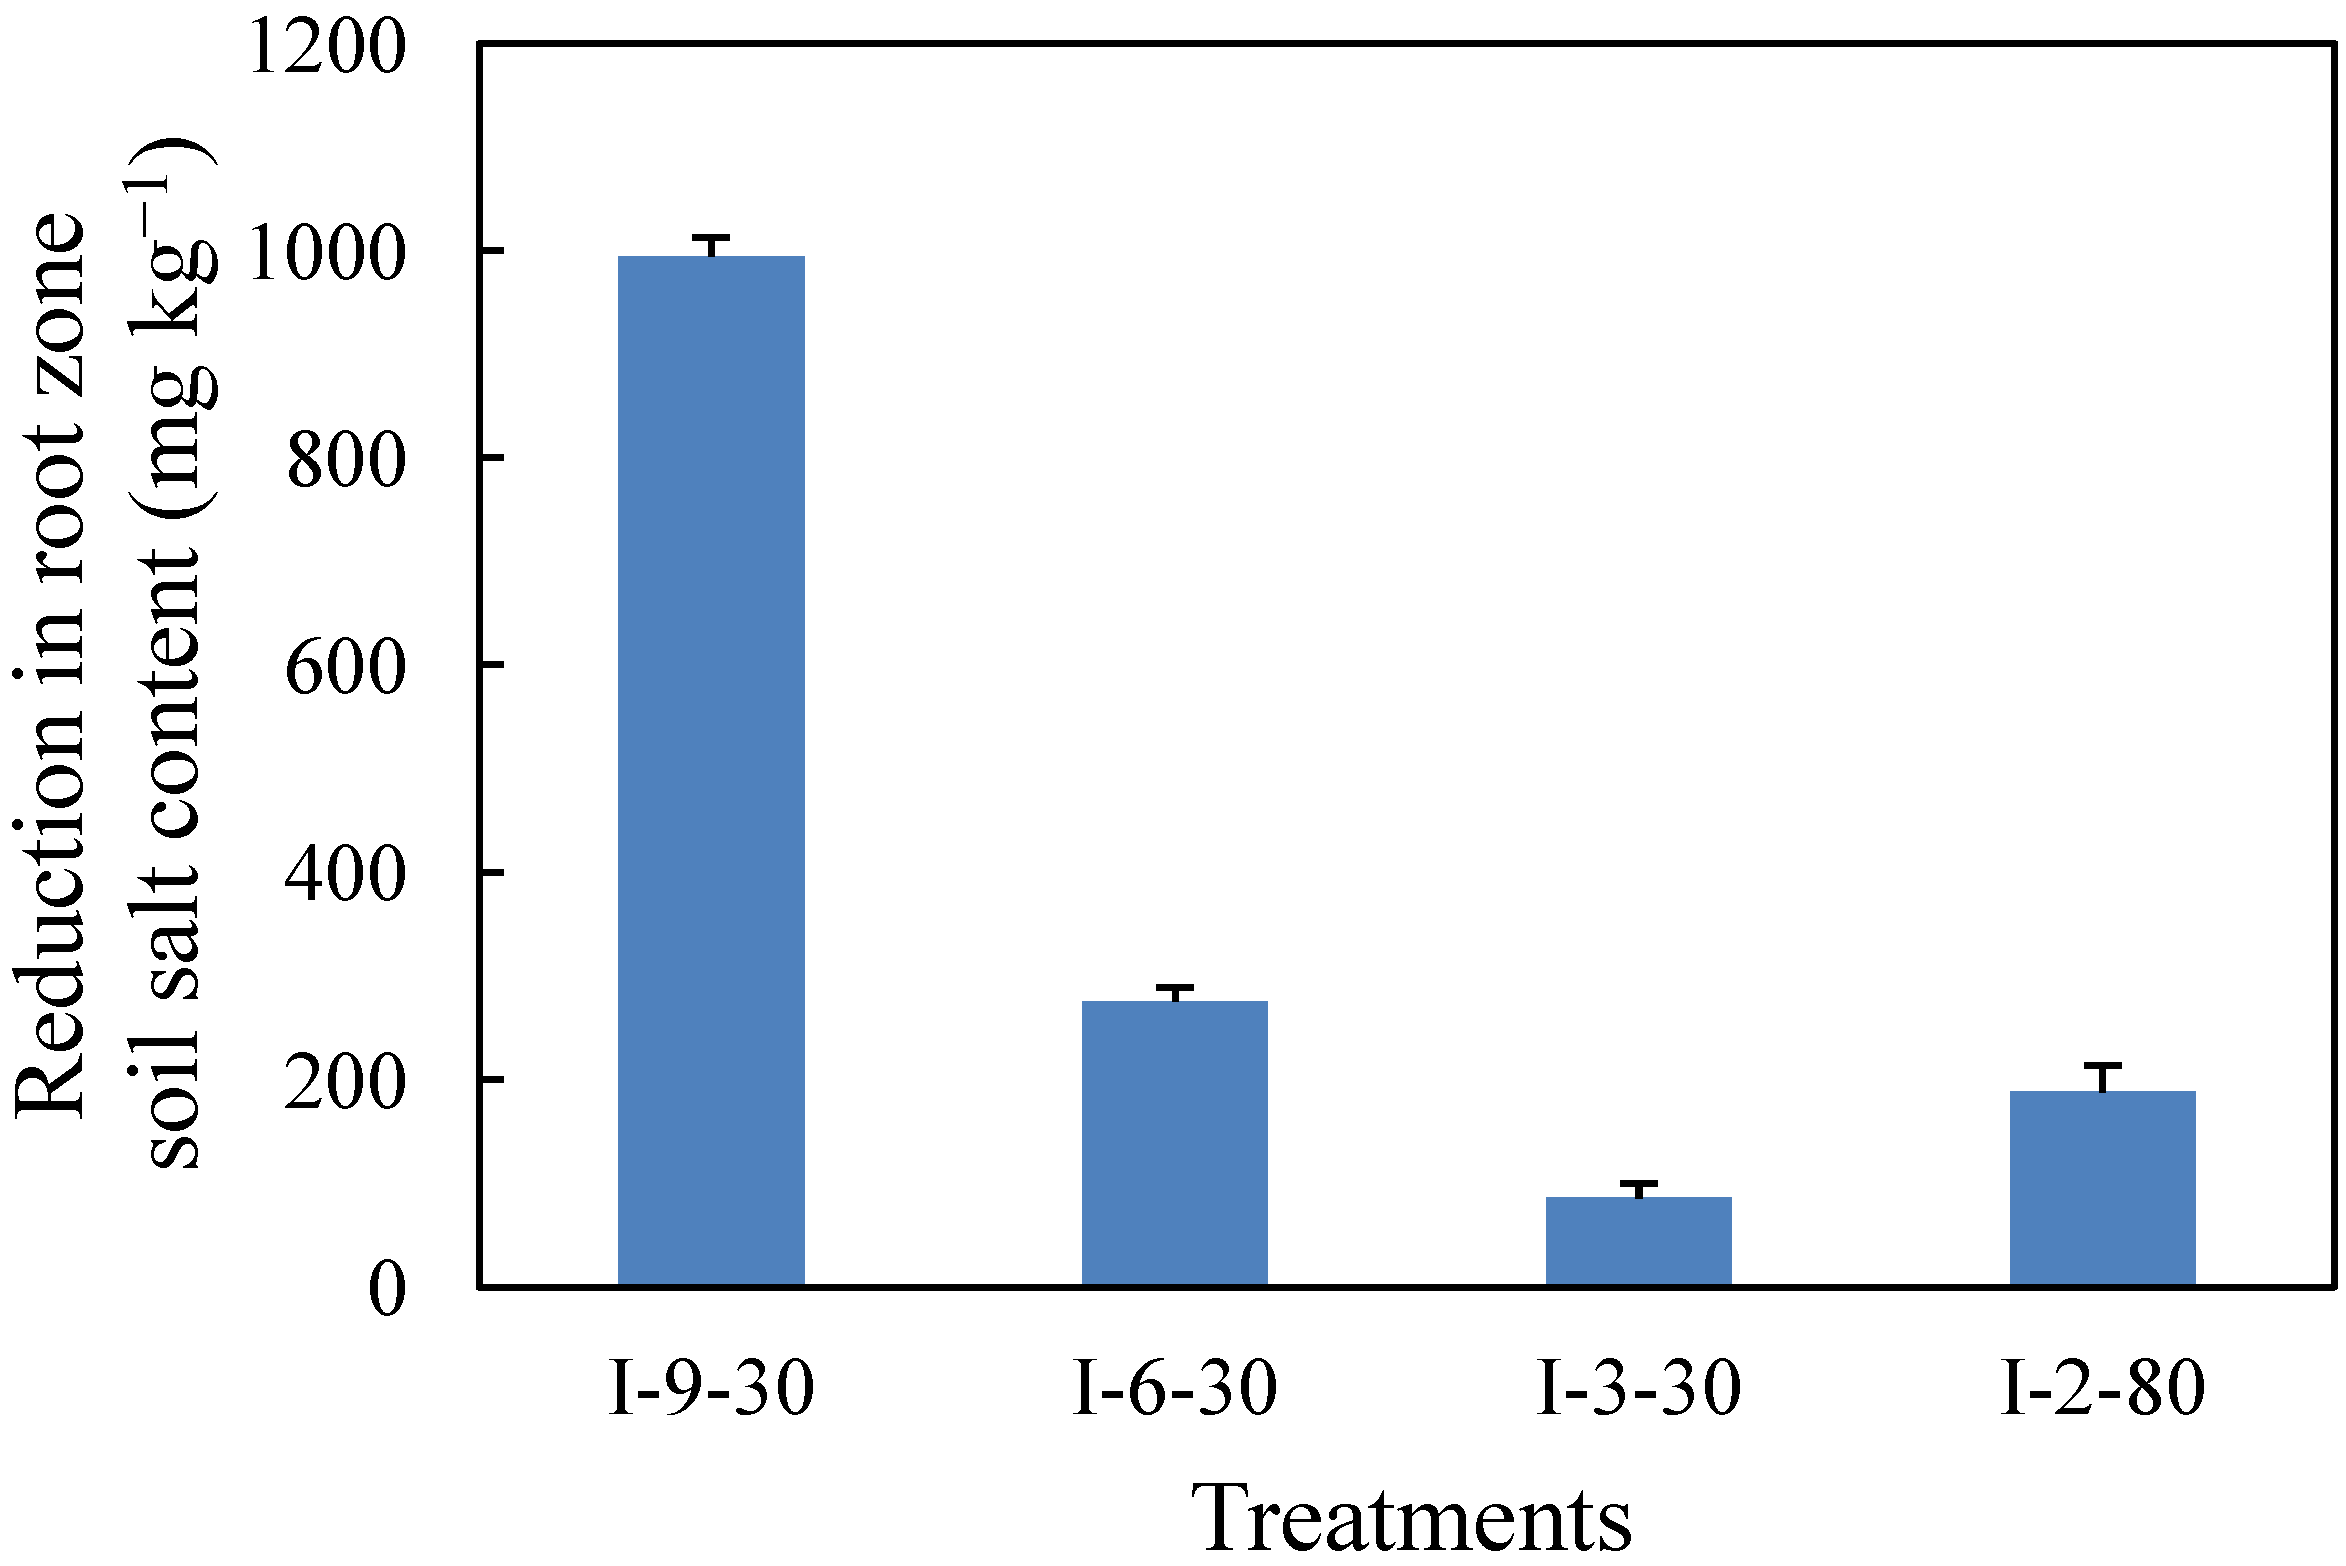
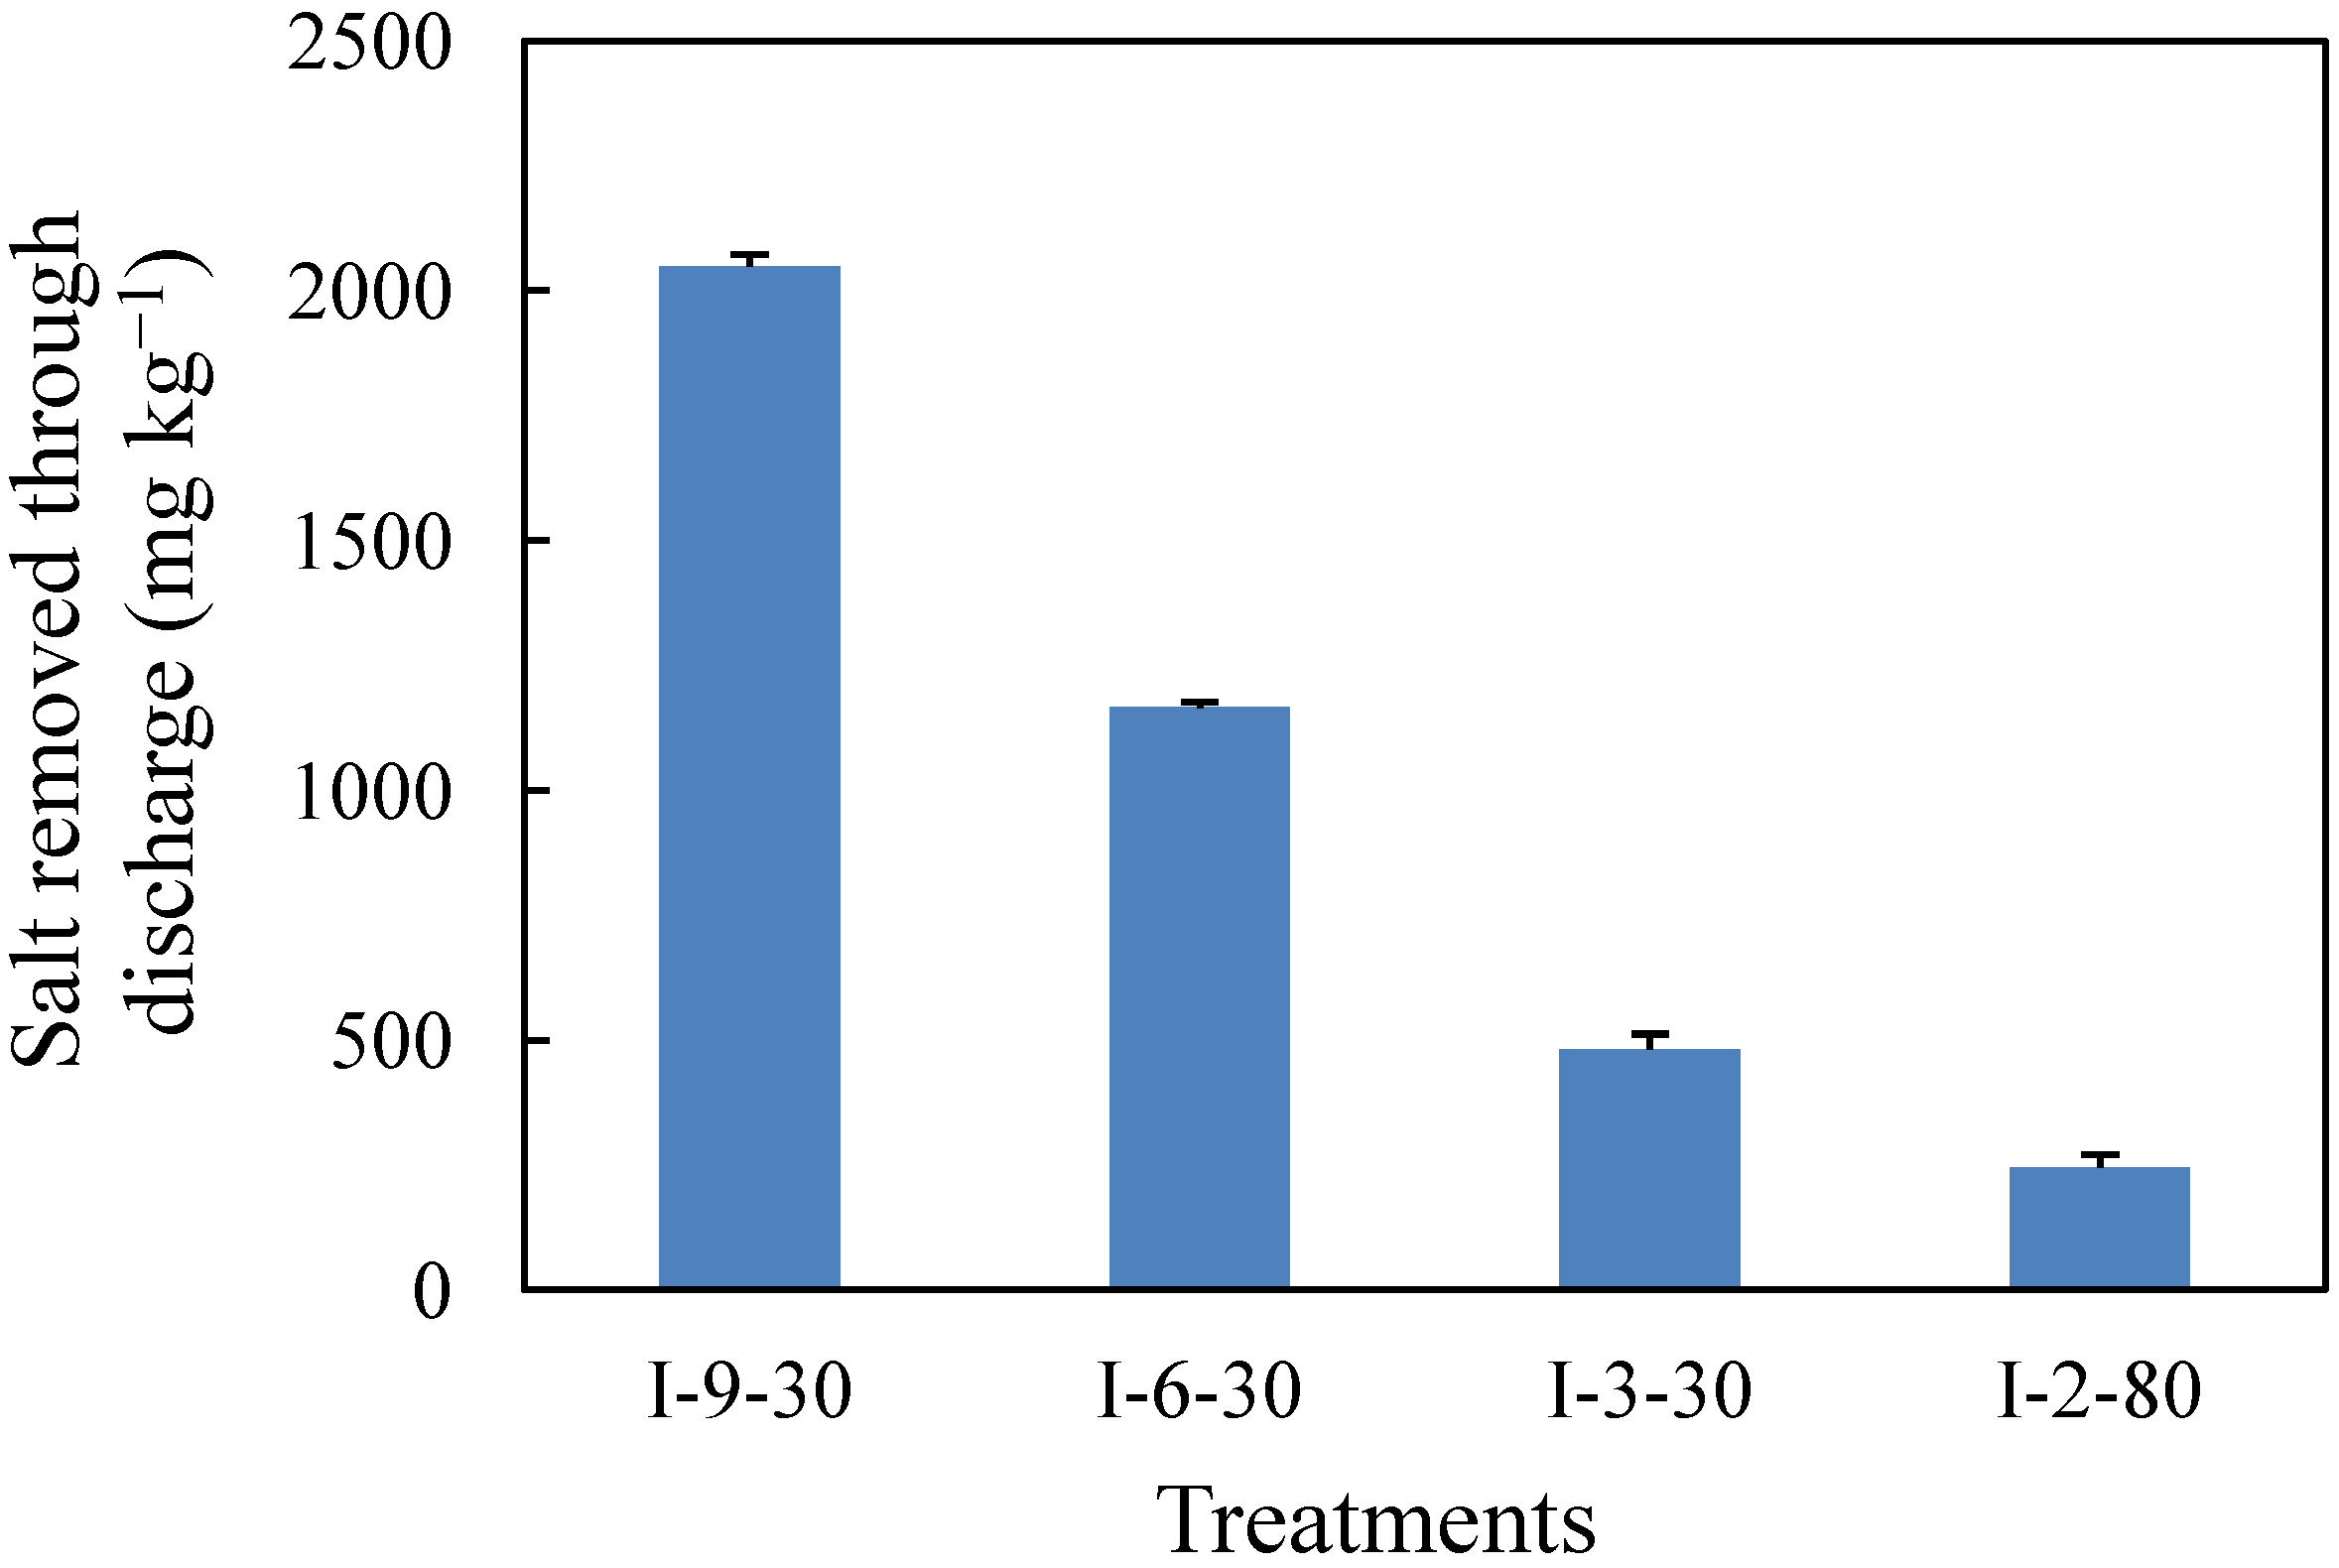
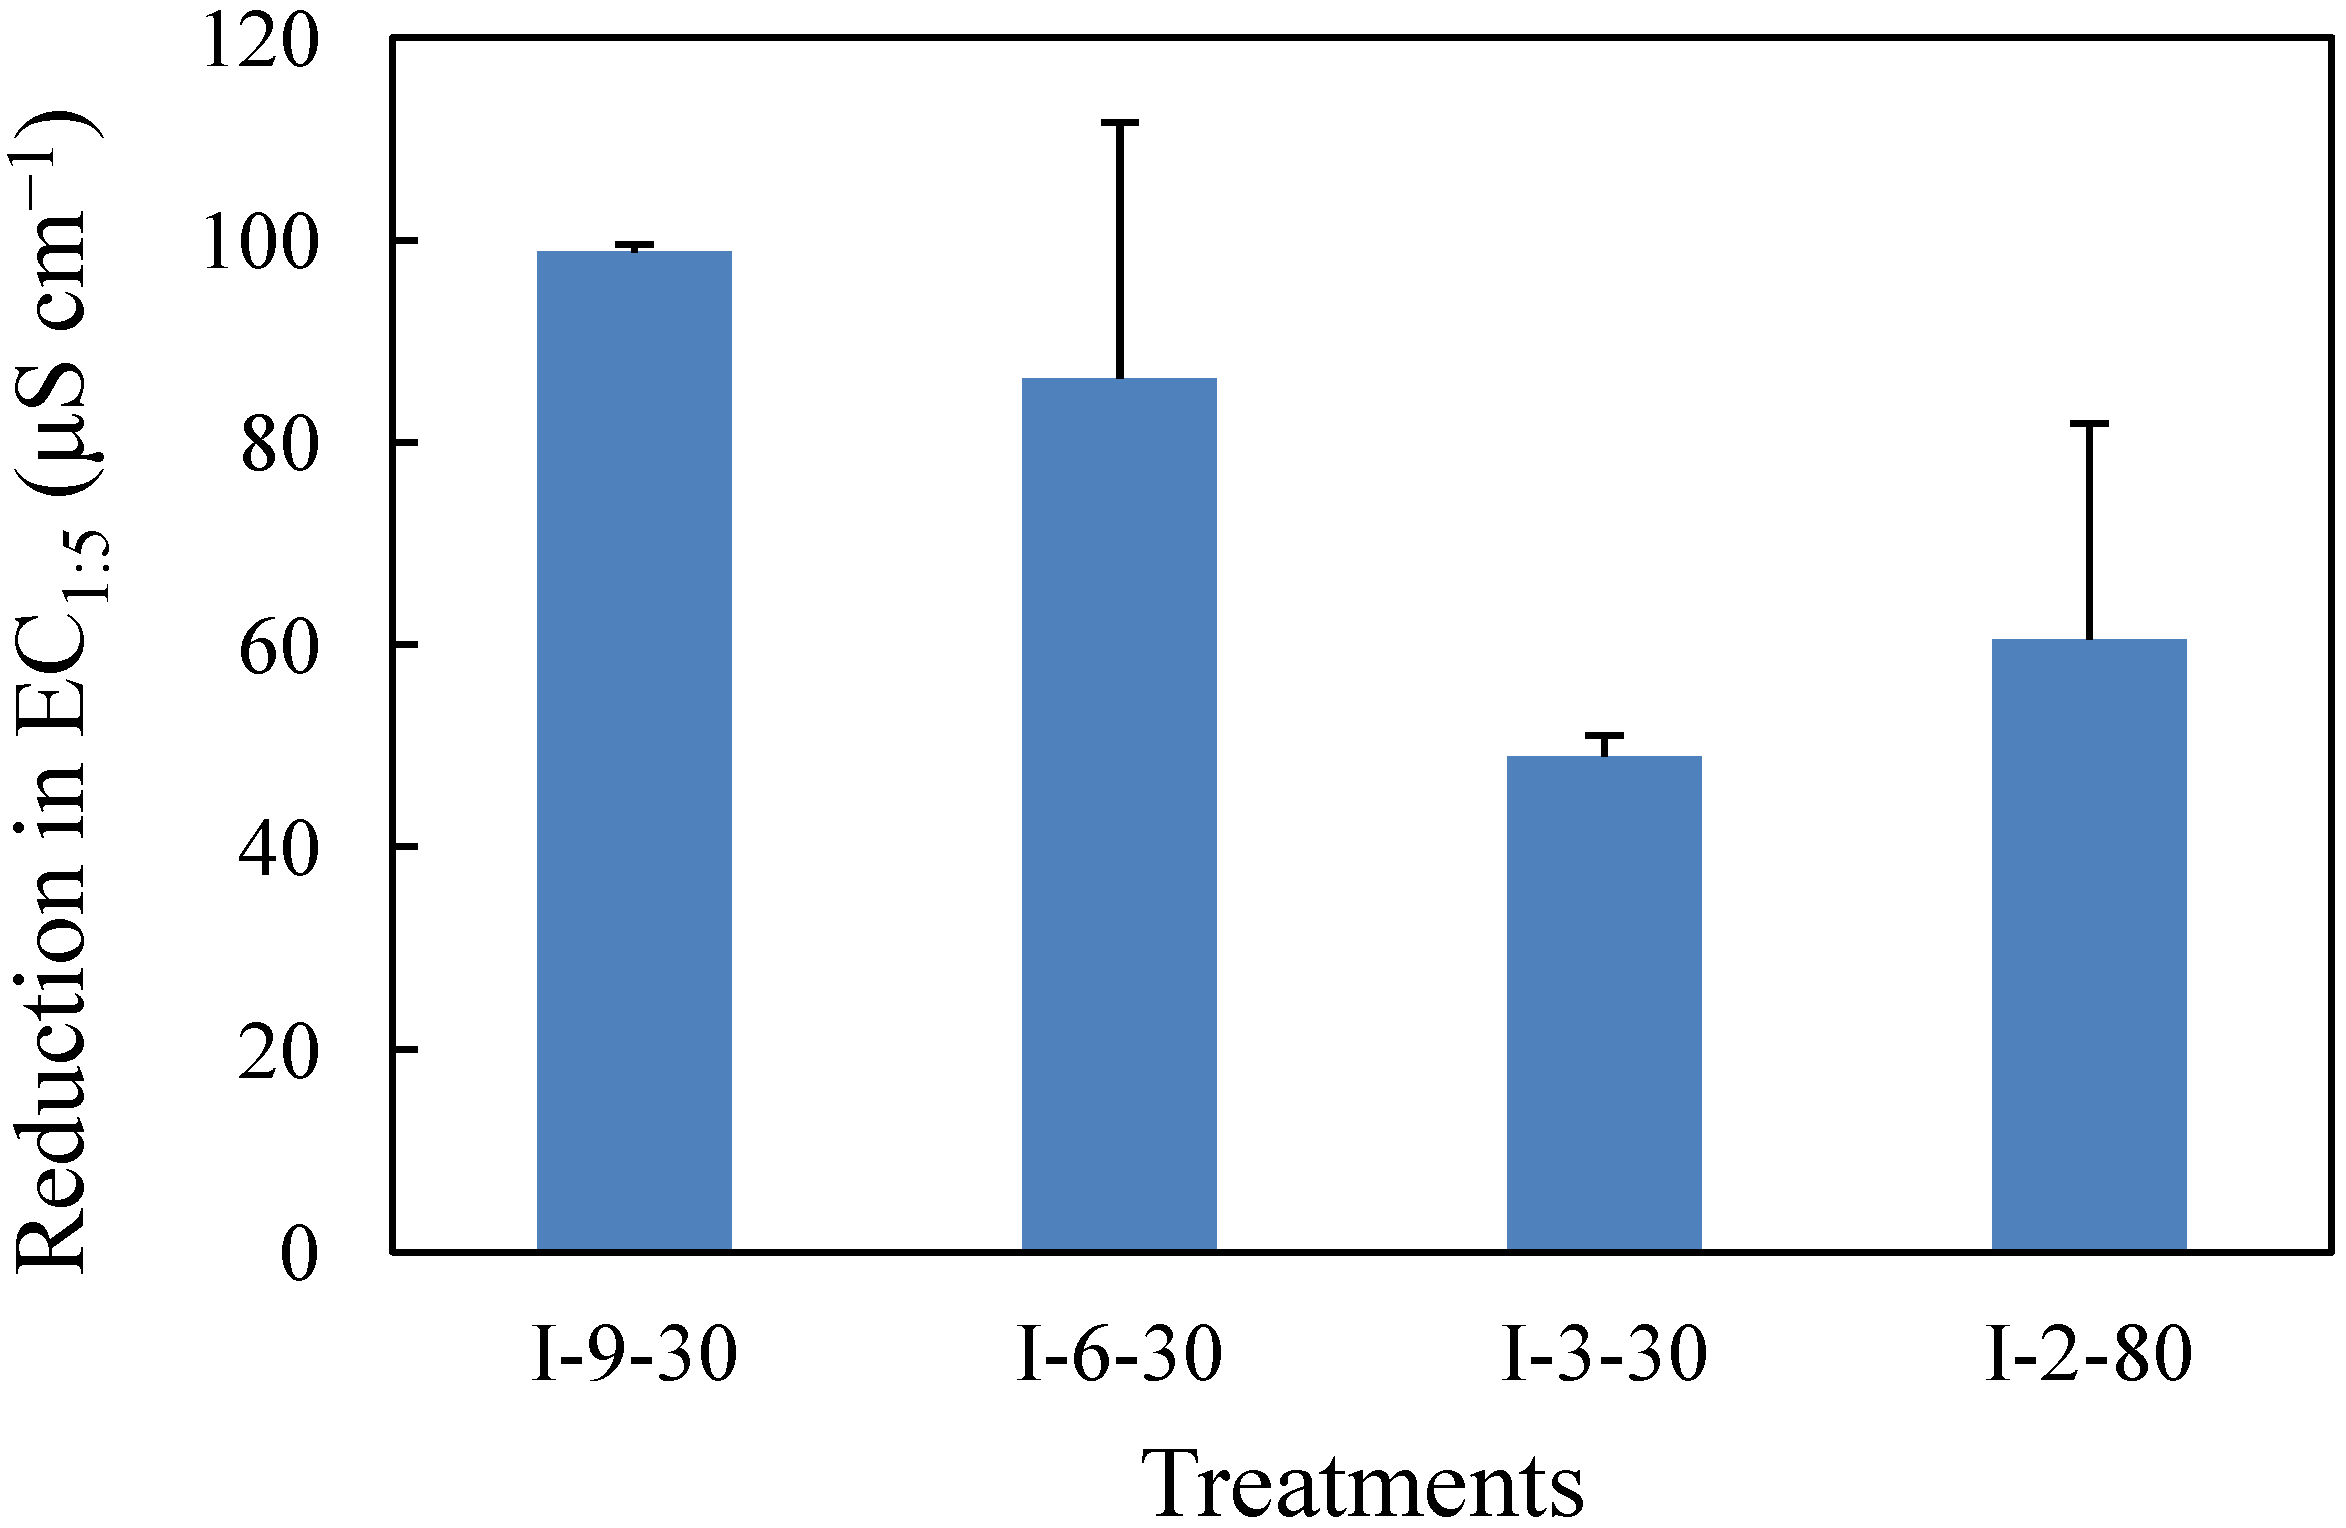
3.1. Soil Salt, Electrical Conductivity and pH

In the saline-sodic soil plots, different reduction in root zone salt content was found before rice transplanting and after rice harvesting: 995.0 kg ha−1 under treatment I-9-30 (30-mm irrigation water depth with 9-time discharge), 275.1 kg ha−1 under treatment I-6-30 (30-mm irrigation water depth with 6-time discharge), 85.3 kg ha−1 under treatment I-3-30 (30-mm irrigation water depth with 3-time discharge), and 187.8 kg ha−1 under treatment I-2-80 (80-mm irrigation water depth with 2-time discharge) (Figure 3). The results showed a declining trend of reduction in root zone salt with decreasing discharge frequency at the same irrigation water depth (30 mm). However, the reduction was remarkably lower under I-3-30 than under I-2-80, although the discharge frequency was slightly higher under I-3-30 than under I-2-80. This may be because the irrigation water depth was notably lower under I-3-30 (30 mm) than under I-2-80 (80 mm) so that less salt was leached into deeper soil layers.
Figure 3. Mass reduction in 20-cm root zone salt content in the saline-sodic soil before rice transplanting and after rice harvesting (mg kg−1). The error bars represent the standard deviation.
Water 05 00578 g003
Total salt input from irrigation water was accounted 632.9 kg ha−1 under I-9-30, 525.14 kg ha−1 under I-6-30, 382.1 kg ha−1 under I-3-30 and 406.0 kg ha−1 under I-2-80, respectively. Total salt input through irrigation was consistent with the amount of irrigation water. Total salt removed through discharge was 2048.7 kg ha−1 under I-9-30, 1166.4 kg ha−1 under I-6-30, 481.3 kg ha−1 under I-3-30 and 245.3 kg ha−1 under I-2-80, respectively (Figure 4). Total salt removed through discharge was decreased with decreasing discharge frequency.
Mean reduction in root zone soil electrical conductivity (EC1:5) before rice transplanting and after rice harvesting was 98.8 μS cm−1 under I-9-30, 86.3 μS cm−1 under I-6-30, 49.0 μS cm−1 under I-3-30, 60.5 μS cm−1 under I-2-80, respectively (Figure 5). The reduction in EC1:5 had the same tendency of changes with reduction in root zone salt content under the four irrigation schedules.
Figure 4. Salt removal by flood water discharge (mg kg−1). The error bars represent the standard deviation.
Water 05 00578 g004
Figure 5. Change in root zone soil EC1:5 before rice transplanting and after rice harvesting (μS cm−1). The error bars represent the standard deviation.
Water 05 00578 g005
The pH value of the 0–20 cm soil profile before rice transplanting and after rice harvesting was 8.6 and 8.5 under I-9-30, 8.9 and 8.9 under I-6-30, 8.4 and 8.7 under I-3-30, and 8.4 and 8.5 under I-2-80. Thus the pH value declined by 0.1 under I-9-30, remained unchanged under I-6-30, whereas increased by 0.3 under I-3-30 and 0.1 under I-2-80. This suggests that the reduction in pH value decreased with the increasing discharge frequency. The changes of pH value were closely related to the changes of the value of (HCO3 + CO32−), as the value of (HCO3 + CO32−) declined by 158.1 mg kg−1 under I-9-30, whereas increased by 96.9 mg kg−1 under I-6-30, 64.1 mg kg−1 under I-3-30 and 5.6 mg kg−1 under I-2-80. The finding also implies that under the irrigation schedule with comparatively low discharge frequency (i.e., I-6-30, I-3-30 and I-2-80), the root zone soil got alkalified in the process of desalinization. The similar phenomenon was observed by Chen et al. [39].
The two main ways to remove salt by irrigated rice cultivation are leaching and discharge. There have been several studies that specifically examined the leaching effect on salt removal. Ceuppens and others [21] reported that irrigated rice cropping without discharge reduced root zone salinity, which was due to the leaching effect of the ponded water layer in irrigated rice field; Study by Liu et al. [25] revealed that soil salt concentration reduced by 51.4% under insufficient irrigation conditions (i.e., soil water content were limited to saturated water content or less) in a yellow river irrigation area of Ningxia, China; Ghafoor et al. [40] explored the impact of tile drain with marginal quality water irrigation on ECe during reclamation of saline-sodic soil on the Indus Plains of Pakistan and found that the ECe of 0–15 cm and 15–30 cm soils reduced by 14%–51% in different years. However, the leached salt was temporarily moved to deeper soil layer during rice growth season and may return to soil surface during the off-season through capillary rise, whereas the discharged salt will never move back. However, few studies focused on how much salt was removed under different discharge schedules. We put forward that the reduction in root zone soil salt increased with increasing discharge frequency and the differences in reduction in root zone salt among different discharge schedules were profound.

3.2. Rice Yield and Yield Components

Under the four different irrigation and discharge treatments, rice yield was found significantly higher under I-2-80 than those under other three schedules: 6864 kg ha−1 under I-9-30, 6709 kg ha−1 under I-6-30, 6328 kg ha−1 under I-3-30, 7687 kg ha−1 under I-2-80 (Table 3). The results showed that although there was a positive relation between rice yield and discharge frequency, no significant differences in rice yield among the treatments I-9-30, I-6-30 and I-3-30 were found. This may be due to much soil nutrient elements (i.e., N and P) ran off for frequent discharge schedules. The results also indicate that rice yield performed better in deep water (i.e., 80-mm under I-2-80) than in shallow water (i.e., 30-mm under I-9-30, I-6-30 and I-3-30). This is in agreement with the findings by Wang et al. [27] that rice yield in a saline-sodic soil on the Songnen Plain performed better at the irrigation water depth of 70 mm than at 40 mm and 10 mm. Whereas Zeng et al. [24] reported that rice yield under salt stress was lower at the water depth above 100 mm than that below 100 mm. These findings revealed that irrigation water depth plays an important role in rice yield, whereas discharge frequency has less effect on rice yield.
Table 3. Rice yield and yield components. Means in the same column followed by the same letter are not significantly different at the 0.05 level.
TreatmentsPanicle number per plantSpikelet per panicleSeed setting rate (%)1000-grain weight (g)Actual yield (kg ha−1)
I-9-3020.7 ± 0.0 a84.7 ± 8.2 b72.7 ± 4.4 a19.2 ± 0.1 a6863.5 ± 57.5 b
I-6-3021.7 ± 1.3 a86.9 ± 6.0 b74.6 ± 0.7 a19.8 ± 0.2 a6709.0 ± 152.0 b
I-3-3019.5 ± 0.5 a97.8 ± 2.1 ab83.3 ± 0.4 a20.0 ± 0.0 a6328.0 ± 502.0 b
I-2-8020.5 ± 1.5 a104.5 ± 3.4 a78.8 ± 7.5 a19.8 ± 1.0 a7686.5 ± 270.5 a
Panicle number per plant was 20.7 under I-9-30, 21.7 under I-6-30, 19.5 under I-3-30, 20.5 under I-2-80, respectively (Table 3). No significant differences in panicle number per plant among the four treatments were found. Spikelet per panicle was 84.7 under I-9-30, 86.9 under I-6-30, 97.8 under I-3-30, 104.5 under I-2-80, respectively. Spikelet per panicle was higher under I-2-80 than under all other three irrigation schedules. No striking discrepancies in spikelet per panicle among the other three irrigation schedules were found. Seed setting rate was 72.7% under I-9-30, 74.6% under I-6-30, 83.3% under I-3-30 and 78.8% under I-2-80, respectively. 1000-grain weight was 19.2 g under I-9-30, 19.8 g under I-6-30, 20.0 g under I-3-30 and 19.8 g under I-2-80, respectively. No significant differences in seed setting rate or 1,000-grain weight among the four treatments were found. These results collectively demonstrated that the I-2-80 treatment increased rice yield mainly by increasing spikelet per panicle compared with the other three treatments. This was partly in accordance with the findings by Wang et al. [27] that deep irrigation water depth (70 mm) increased rice grain yield mainly by increasing rice spikelet per panicle and percent filled spikelet and alleviating the tillering inhibition when compared with shallow irrigation water depth (i.e., 40 mm and 10 mm).

3.3. Water Consumption

Total rainfall, irrigation amounts, Evapotranspiration (ET), deep percolation and discharge amount were shown in Table 4. The results showed that the total inputs of water for I-9-30, I-6-30, I-3-30 and I-2-80 were 996 mm, 906 mm, 886 mm, and 806 mm, respectively; the difference in ET among the four treatments was small; Total amount of water discharged was much higher under I-9-30 and I-6-30 than under I-3-30 and I-2-80.
Table 4. Water balance components (mm). P = precipitation, I = irrigation amount, ET = evapotranspiration, DP = deep percolation, D = dischargeamount, ΔW = change of field surface water depth. Means in the same column followed by the same letter are not significantly different at the 0.05 level.
TreatmentsPIETDPDΔW
I-9-30466.4530.0546.5 ± 37.5 a90.5 ± 2.5 a363.2 ± 40.5 a−3.8
I-6-30466.4440.0533.5 ± 14.5 a93.5 ± 1.5 a285.7 ± 13.0 b−6.3
I-3-30466.4320.0570.0 ± 63.0 a90.0 ± 15.0 a120.7 ± 36.0 c5.7
I-2-80466.4340.0586.5 ± 59.5 a90.5 ± 3.5 a124.4 ± 5.1 c5.0
ET is affected by soil water content. Liu et al. [25] reported that the ET value ranged from 589.1 to 761.5 mm under different insufficient irrigation schedules, which resulted from different water stress. Our study showed there was no relationship between total water input and ET, as well as between total water input and soil percolation under different discharge schedules, indicating that the soil was well watered throughout the study period. Overall, discharge was positively related with total water input, but the difference was marginal between I-3-30 (121 mm) and I-2-80 (124 mm) even though I-3-30 received significantly higher input than I-2-80 (886 mm vs. 806 mm). I-6-30 received higher water input (906 mm) and had a significantly higher discharge than I-3-30 and I-2-80. These results may imply that a total water input of about 900 mm could completely saturate the soil throughout a growing season on the Songnen Plain if weather conditions are similar like the study year.

3.4. Rice Water Use Efficiency

Based on the water consumption and rice yield, irrigation water use efficiency (IWUE) for each plot was computed and the results were shown in Table 5. IWUE was significantly higher under I-2-80 than under I-3-30 and significantly higher under I-3-30 than under I-6-30 as well, whereas no significant difference in IWUE between I-6-30 and I-9-30 was found. This was mainly a result of the much higher total water input to I-9-30 and I-6-30, but relatively small difference in rice yield among the treatments. Calculated by the rice yield and irrigation amount reported by Xi et al. [41], the IWUE value varied from 12.2 to 26.1 kg ha−1 mm−1 under different irrigation schedules in a salt-affected soil on the Songnen Plain. Liu et al. [25] reported that the IWUE value ranged from 12.4 to 17.2 kg ha−1 mm−1 under different insufficient irrigation schedules in a salt-affected soil on a yellow river irrigation area of Ningxia. These findings showed that rice IWUE were quite diverse under different irrigation and discharge schedules.
Based on the ET and rice yield, water use efficiency (WUE) for each plot was computed and the results were shown in Table 5 as well. In general, WUE were lower than those of IWUE under all four treatments. This could be attributed to the ET value was higher than the amount of irrigation water applied under all four treatments. However, unlike the IWUE values, there were no significant differences in the WUE values among the four treatments. This could be due to the gaps in the ET values among the four treatments were small. Despite of that, the mean WUE value was slightly higher under I-2-80 than under all other three treatments.
Table 5. Irrigation water use efficiency (IWUE) and water use efficiency (WUE). Means in the same column followed by the same letter are not significantly different at the 0.05 level.
TreatmentsIWUE (kg ha−1 mm−1)WUE (kg ha−1 mm−1)
I-9-3013.0 ± 0.1 c12.6 ± 0.8 a
I-6-3015.2 ± 0.3 c12.6 ± 0.1 a
I-3-3019.8 ± 1.6 b11.3 ± 2.1 a
I-2-8022.6 ± 0.8 a13.2 ± 0.9 a

4. Conclusions

This study carried out a field irrigation experiment with three discharge frequencies—9 times, 6 times, and 3 times—all of which were followed by an irrigation of 30-mm water depth. Our initial hypothesis was that the increase of discharge frequency would increase both soil salt reduction and rice yield. The hypothesis was proven true in terms of soil salt reduction. In terms of rice yield, however, the study showed mixed results. Rice yield increased slightly with the increase of discharge frequency following a 30-mm irrigation; but, when compared with the traditional deep-water irrigation (80 mm) with 2-time discharge, rice yields in all treatment plots with frequent discharge were 11%–18% lower. This indicates that shallow irrigation may cause rice yield reduction. However, on the other hand, frequent discharge reduces more soil salt. It is a trade-off among salt reduction, rice yield and water use efficiency when considering selection of irrigation and discharge schedules. Further studies are needed to separate the effect between discharge and irrigation depth and to more precisely determine an optimal irrigation-discharge schedule for both rice production and ameliorating the widespread saline-sodic soils on the Songnen Plain.

Acknowledgements

This study was funded by the Knowledge Innovation Program of the Chinese Academy of Sciences (No. KZCX2-YW-Q06-2). We thank the Key Experimental Station of Irrigation Management Bureau of Qianguo Irrigation District for the continuous assistance and support during all the phases of field experiment. We are also grateful to all the members of the Hydrology and Water Resources Research Group at the Northeast Institute of Geography and Agroecology.

References

  1. Zhang, Y.; Zhang, H.Q.; Li, X.B. The changes on quality and production capacity of farmland in the main agricultural regions during recent 20 years [in Chinese]. Geogr. Geo. Inf. Sci. 2011, 27, 52–55. [Google Scholar]
  2. Xiang, H.; Kong, X.B.; Wu, Z.K.; Shi, J.R.; Zhang, Q.P. Spatial distribution characteristics of potential productivity of arable land in main crop production area in China [in Chinese]. Trans. Chin. Soc. Agric. Eng. 2012, 28, 235–244. [Google Scholar]
  3. Li, X.J. The Alkili-saline land and agricultural sustainable development of the Western Songnen Plain in China [in Chinese]. Sci. Geogr. Sin. 2000, 20, 51–55. [Google Scholar]
  4. Zhang, B.; Song, X.F.; Zhang, Y.H.; Han, D.M.; Tang, C.Y.; Yu, Y.L.; Ma, Y. Hydrochemical characteristics and water quality assessment of surface water and groundwater in Songnen plain, Northeast China. Water Res. 2012, 46, 2737–2748. [Google Scholar]
  5. Tanji, K.K. Nature and extent of agricultural salinity. In Agricultural Salinity Assessment and Management; ASCE Manuals and Reports on Engineering Practices NO. 71; Tanji, K.K., Ed.; American Society of Civil Engineers: New York, NY, USA, 1990. [Google Scholar]
  6. Suarez, D.L. Sodic soil reclamation: Modelling and field study. Aust. J. Soil Res. 2001, 39, 1225–1246. [Google Scholar]
  7. Pitman, M.G.; Laüchli, A. Global impact of salinity and agricultural ecosystems. In Salinity: Environment-Plants-Molecules; Laüchli, A., Lüttge, U., Eds.; Kluwer Academic: Dordrecht, The Netherlands, 2002; pp. 3–20. [Google Scholar]
  8. Qadir, M.; Noble, A.D.; Schubert, S.; Thomas, R.J.; Arslan, A. Sodicity-induced land degradation and its sustainable management: Problems and prospects. Land Degrad. Dev. 2006, 17, 661–676. [Google Scholar]
  9. Rasmussen, W.W.; Moore, D.P.; Alban, A.L. Improvement of a solonetzic (slick spot) soil by deep plowing, subsoiling and amendments. Soil Sci. Soc. Am. Proc. 1972, 36, 137–142. [Google Scholar]
  10. Oster, J.D.; Shainberg, I.; Abrol, I.P. Reclamation of salt affected soils. In Agricultural Drainage; Skaggs, R.W., van Schilfgaarde, J., Eds.; American Society of Agronomy-Crop Science Society of America-Soil Science Society of America: Madison, WI, USA, 1999; pp. 659–691. [Google Scholar]
  11. Abdelgawad, A.; Arslan, A.; Awad, F.; Kadouri, F. Deep Plowing Management Practice for Increasing Yield and Water Use Efficiency of Verch, Cotton, Wheat and Intensified Corn Using Saline and Non-Saline Irrigation Water. In Proceedings of the 55th IEC Meeting of the International Commission on Irrigation and Drainage (ICID), Moscow, Russia, 9–10 September 2004; pp. 67–78.
  12. Qadir, M.; Oster, J.D. Crop and irrigation management strategies for saline-sodic soils and waters aimed at environmentally sustainable agriculture. Sci. Total Environ. 2004, 323, 1–19. [Google Scholar]
  13. Qadir, M.; Sharma, B.R.; Bruggeman, A.; Choukr-Allah, R.; Karajeh, F. Non-conventional water resources and opportunities for water augmentation to achieve food security in water scarce countries. Agric. Water Manage 2007, 87, 2–22. [Google Scholar]
  14. Song, C.C.; Deng, W.; Li, Q.S.; Wang, Z.C.; Zhang, G.X. Techniques of controlling secondary soil salinization in the west of songnen plain [in Chinese]. Sci. Geogr. Sin. 2002, 22, 610–614. [Google Scholar]
  15. Luo, X.Z.; Sun, G.Y. Desalinization process through cultivating rice in heavy salinized meadow soil containing saline-alkaline patches [in Chinese]. Ecol. Env. 2004, 13, 47–50. [Google Scholar]
  16. Zhao, L.P.; Feng, J.; Wang, Y.; Wang, H.B.; Geng, Y.H.; Wang, S.H.; Li, C.L. Theoretical and technological problems in the development of planting paddy in saline-alkali land of Songnen Plain [in Chinese]. J. Jilin Agric. Univ. 2012, 34, 237–241. [Google Scholar]
  17. Acharya, C.L.; Abrol, I.P. Effect of river sand on the permeability of a sodic soil. J. Indian Soc. Soil Sci. 1976, 24, 245–252. [Google Scholar]
  18. Ahmad, N.; Qureshi, R.H.; Qadir, M. Amelioration of a calcareous saline-sodic soil by gypsum and forage plants. Land Degrad. Dev. 1990, 2, 277–284. [Google Scholar]
  19. Chhabra, R.; Abrol, I.P. Reclaiming effect of rice grown in sodic soils. Soil Sci. 1977, 124, 49–55. [Google Scholar]
  20. Van Asten, P.J.A.; van’t Zelfde, J.A.; van der Zee, S.E.A.T.M.; Hammecker, C. The effect of irrigated rice cropping on the alkalinity of two alkaline rice soils in the Sahel. Geoderma 2004, 119, 233–247. [Google Scholar]
  21. Ceuppens, J.; Wopereis, M.C.S. Impact of non-drained irrigated rice cropping on soil salinization in the Senegal River Delta. Geoderma 1999, 92, 125–140. [Google Scholar]
  22. Wang, C.Y.; Wu, Z.J.; Shi, Y.L.; Wang, R.Y. The resource of saline soil in the Northeast China [in Chinese]. Chin. J. Soil Sci. 2004, 35, 643–647. [Google Scholar]
  23. Chi, C.M.; Wang, Z.C. Characterizing salt-affected soils of Songnen Plain using saturated paste and 1:5 soil-to-water extraction methods. Arid Land Res. Manage 2010, 24, 1–11. [Google Scholar]
  24. Zeng, L.H.; Lesch, S.M.; Grieve, C.M. Rice growth and yield respond to changes in water depth and salinity stress. Agric. Water Manag. 2003, 59, 67–75. [Google Scholar]
  25. Liu, G.M.; Peng, S.Z.; Yang, J.S. Soil salt dynamics of rice field under different controlled irrigation conditions [in Chinese]. Trans. Chin. Soc. Agric. Eng. 2007, 23, 86–89. [Google Scholar]
  26. Menete, M.Z.L.; van Es, H.M.; Brito, R.M.L.; DeGloria, S.D.; Famba, S. Evaluation of system of rice intensification (SRI) component practices and their synergies on salt-affected soils. Field Crops Res. 2008, 109, 34–44. [Google Scholar]
  27. Wang, M.M.; Liang, Z.W.; Wang, Z.C.; Huang, L.H.; Ma, H.Y.; Liu, M.; Gu, X.Y. Effect of irrigation water depth on rice growth and yield in a saline-sodic soil in Songnen Plain, China. J. Food Agric. Environ. 2010, 8, 530–534. [Google Scholar]
  28. Zhang, G.X. Measures for securing water safety of main grain production base and wetland ecological safety in Northeast China [in Chinese]. China Water Resour. 2012, 15, 9–11. [Google Scholar]
  29. Luan, Z.Q.; Zhang, G.X.; Deng, W.; Hu, J.M.; Zhou, D.M. Studies on changes of air temperature and precipitation for last 50 years in Songnen Plain [in Chinese]. Chin. J. Agrometeorol. 2007, 28, 355–358. [Google Scholar]
  30. Seckler, D. The New Era of Water Resources Management: From Dry to Wet Water Savings; Research Report 1; International Water Management Institute: Colombo, Sri Lanka, 1996. [Google Scholar]
  31. Jalota, S.K.; Prihar, S.S. Reducing Soil Water Evaporation with Tillage and Straw Mulching; IOWA State University Press: Ames, IA, USA, 1998. [Google Scholar]
  32. Tuong, T.P. Productive water use in rice production: opportunities and limitations. In Water Use and Production; Kikham, M.B., Ed.; The Haworth Press Inc.: Philadelphia, PA, USA, 1999; pp. 241–264. [Google Scholar]
  33. Chahal, G.B.S.; Sood, A.; Jalota, S.K.; Choudhury, B.U.; Sharma, P.K. Yield, evapotranspiration and water productivity of rice (Oryza sativa L.)–wheat (Triticum aestivum L.) system in Punjab-India as influenced by transplanting date of rice and weather parameters. Agric. Water Manag. 2007, 88, 14–27. [Google Scholar]
  34. Sandhu, B.S.; Khera, K.L.; Prihar, S.S.; Singh, B. Irrigation needs and yield of rice on a sandy loam soil as affected by continuous and intermittent submergence. Indian J. Agric. Sci. 1980, 50, 492–496. [Google Scholar]
  35. Singh, C.B.; Aujla, T.S.; Sandhu, B.S.; Khera, K.L. Effect of transplanting date and irrigation regime on growth, yield and water use in rice (Oryza sativa) in northern India. Indian J. Agric. Sci. 1996, 66, 137–141. [Google Scholar]
  36. Tabbal, T.P.; Bouman, B.A.M.; Bhuyian, S.I.; Sibayan, E.B.; Satter, M.A. On-farm strategies for reducing water input in irrigated rice: Case studies in Philippines. Agric. Water Manage 2002, 56, 93–112. [Google Scholar]
  37. Shi, D.C.; Wang, D.L. Effects of various salt-alkaline mixed stresses on Aneurolepidium chinense (Trin.) Kitag. Plant Soil 2005, 271, 15–26. [Google Scholar]
  38. Li, B.; Wang, Z.C. The alkalization parameters and their influential factors of saline-sodic soil in the Songnen Plain [in Chinese]. J. Arid Land Resour. Environ. 2006, 6, 183–191. [Google Scholar]
  39. Chen, W.; Chen, B.C.; Shen, Q.R. Studies on the changes of pH value and alkalization of heavily saline soil in seabeach during its desalting process [in Chinese]. Acta Pedol. Sin. 2000, 37, 521–528. [Google Scholar]
  40. Ghafoor, A.; Murtaza, G.; Rehman, M.Z.; Saifullah; Sabir, M. Reclamation and salt leaching efficiency for tile drained saline-sodic soil using marginal quality water for irrigating rice and wheat crops. Land Degrad. Dev. 2012, 23, 1–9. [Google Scholar] [CrossRef]
  41. Xi, G.S.; Wang, Y.L.; Sun, Y.H. Water-Saving irrigation technique for well-irrigated rice in saline-alkali waterlogged lowland of Songnen Plain [in Chinese]. J. Jilin Agric. Univ. 2002, 24, 17–20. [Google Scholar]

