Article

Evaluation of Clogging during Sand-Filtered Surface Water Injection for Aquifer Storage and Recovery (ASR): Pilot Experiment in the Llobregat Delta (Barcelona, Spain)

1
Cetaqua, Water Technology Center, Carretera d’Esplugues 75, Cornellà de Llobregat, 08940 Barcelona, Spain
2
Aigües de Barcelona, Empresa Metropolitana de Gestió del Cicle Integral de l’Aigua, S.A., General Batet, 1-7, 08028 Barcelona, Spain
*
Author to whom correspondence should be addressed.
Water 2017, 9(4), 263; https://doi.org/10.3390/w9040263
Submission received: 23 November 2016 / Revised: 28 March 2017 / Accepted: 3 April 2017 / Published: 8 April 2017
(This article belongs to the Special Issue Water Quality Considerations for Managed Aquifer Recharge Systems)

Abstract

:
The aquifer storage and recovery system of Sant Joan Despí (SJD) in the Llobregat Basin (Barcelona, Spain) has been injecting potable water since its construction in 1969. In order to increase the environmental and economic sustainability of the process, the substitution of potable water by sand-filtered surface water (SFSW) has been considered. This study aims at assessing the clogging potential of SFSW by reproducing the aquifer storage and recovery (ASR) system in a column-type pilot system. Developed clogging of a metallic screen simulating a well screen in the ASR was observed by direct visualization and by scanning electron microscopy (SEM), and was measured by the pilot column head loss and by the analysis of extracellular polymeric substances formed. The results show that although there is a detectable clogging formation, the experiment could run with no flow limitation, suggesting that SFSW could be a feasible candidate water for aquifer injection in a real well demonstration phase.

Graphical Abstract

1. Introduction

Due to the increasing water demand in urban areas and overexploitation of groundwater, managed aquifer recharge (MAR) has become an increasingly important means of solving water supply problems. The aquifer storage and recovery (ASR) system in Llobregat is one of the oldest MAR systems of this type in Spain. It was constructed in 1969 in the surroundings of the drinking water treatment plant (DWTP) of Sant Joan Despí (SJD) in Barcelona (Spain), which is mainly fed with surface water from the Llobregat River. The objective of the Llobregat ASR is to store water underground in a sustainable way, especially considering that the Llobregat aquifer is heavily exploited by the DWTP when the water quality of the Llobregat River deteriorates (e.g., due to rainfall events).
Historically, drinking water produced in the DWTP of SJD has been recharged into the aquifer using injection wells. The complete treatment process of the DWTP is displayed in Figure 1. It includes a conventional treatment comprised of preliminary screening, pre-chlorination with ClO2, coagulation/flocculation by the addition of aluminium sulphate, subsequent sedimentation and sand filtration. It is at this stage where groundwater, when required, is incorporated in the treatment as a substitute or in addition to the intake of treated surface water. From this point on, water flow is split into two streams: one undergoes ozonation and granular activated carbon (GAC) filtration, while the other undergoes in-line coagulation with FeCl3, ultrafiltration (UF), ultraviolet (UV) irradiation, reverse osmosis (RO) filtration and remineralisation. After this, both treated streams are blended and the resulting stream is then post-chlorinated prior to distribution.
Despite the high hydraulic transmissivity of the Llobregat aquifer, which makes it very suitable for aquifer recharge, and the good results achieved in terms of volume injected, the ASR system has been operated less frequently due to the increase of the potabilisation treatment costs, especially since the introduction in 2010 of advanced treatment, including ultrafiltration and reverse osmosis. Therefore, the aim of this study is to assess the nature of well clogging and biofilm formation, if any, when sand-filtered surface water (SFSW) is used as injection water. To this end, an aquifer recharge pilot system was designed and operated to mimic as closely as possible the ASR in SJD. The study intends to evaluate the feasibility of substituting the current water injected to the ASR (consisting of drinking water after advanced treatment such as reverse osmosis) with SFSW, without compromising the environmental and economic sustainability of the ASR in SJD. This study has been conducted within the European Union Seventh Framework Programme (FP7/2007-2013) Project entitled “Demonstrate Ecosystem Services Enabling Innovation in the Water Sector”, which aims to promote innovative solutions for water scarcity and challenges related to water quality, in addition to demonstrating a methodology for the valuation of ecosystem services (ESS) [1].

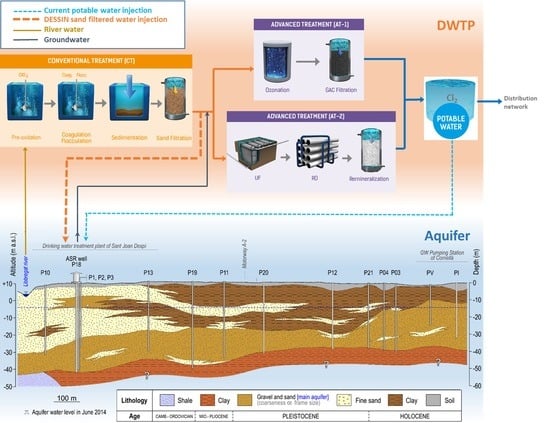
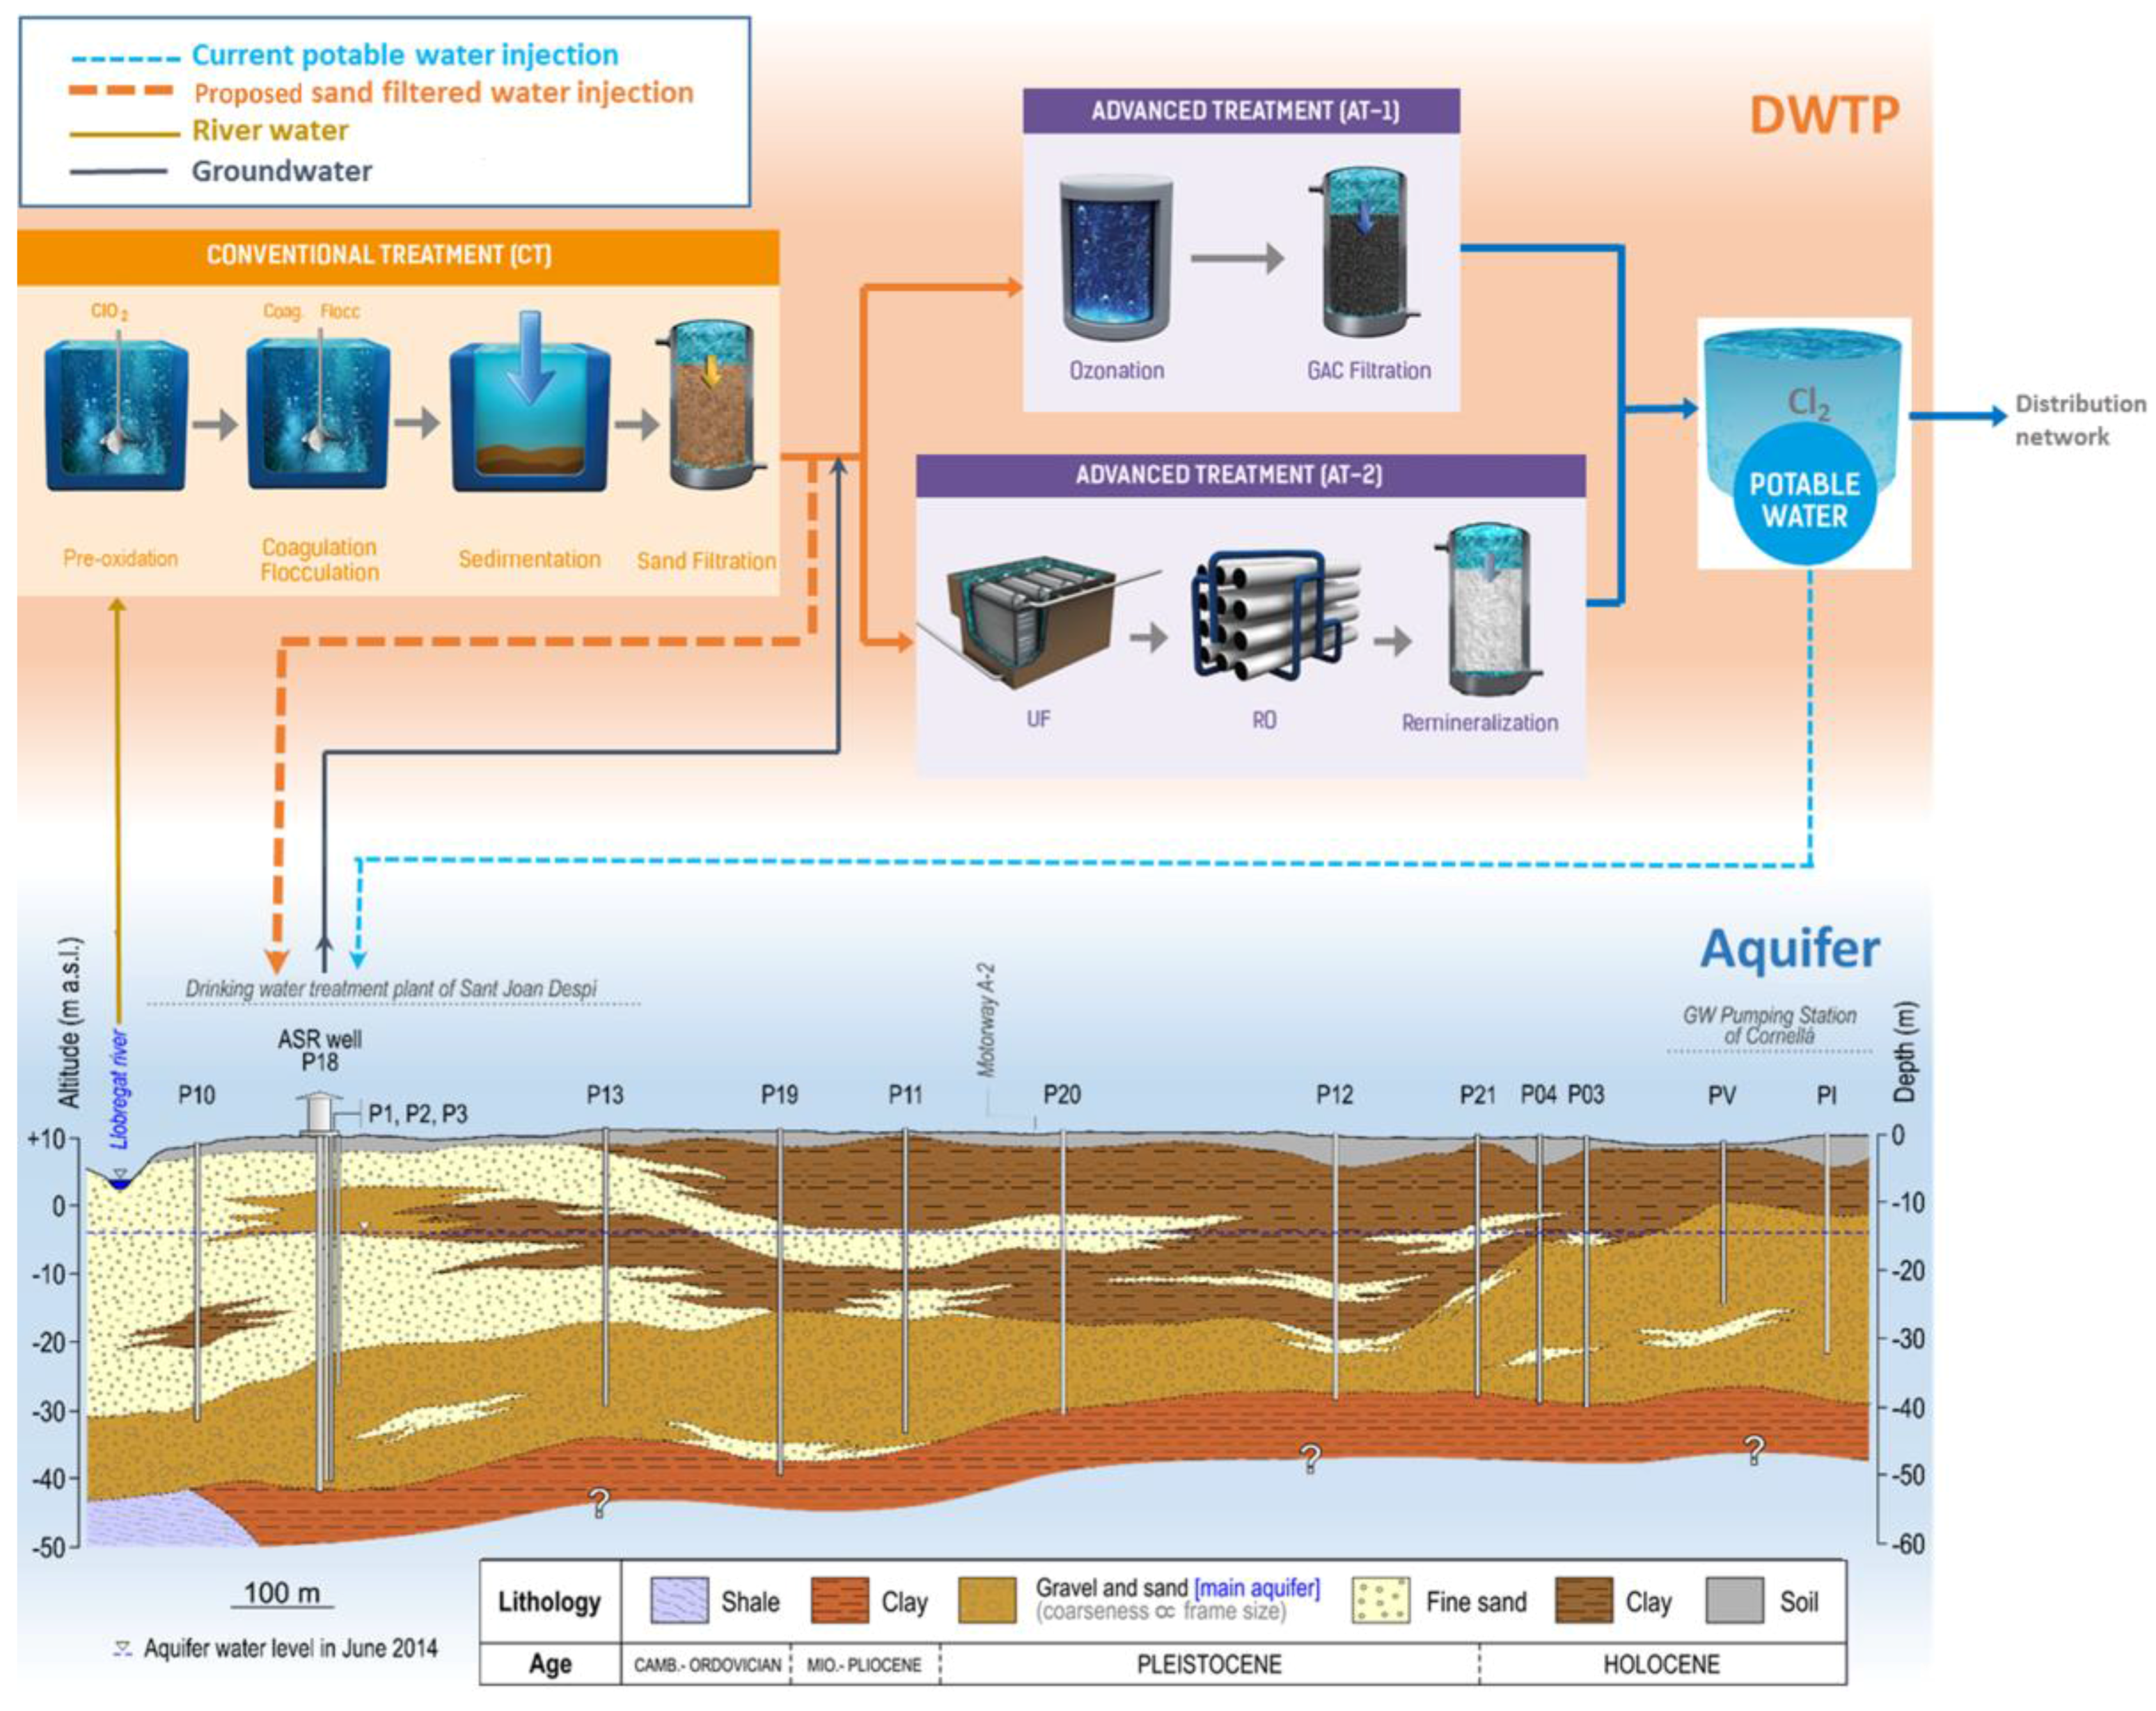
2. Background Information

The ASR target aquifer (Llobregat aquifer) has two aquifer units in the Delta: the upper, phreatic unit, and the lower, semi-confined unit (Figure 2). Given the significant storage volume (110 Hm3), the latter is the target for water production by the DWTP of SJD in case of a deterioration in the water of the Llobregat River [2].
Aquifer transmissivity values around 30,000 m2/d [3] are typically observed at the Llobregat ASR wells, indicating that it is a high transmissivity aquifer compared to other international ASR sites worldwide (Figure 3). Porosity is around 20%, while the average aquifer thickness is 20 m [3]. The lower aquifer extends from 30 m to 50 m in depth, up to a clay layer. Granulometry of the aquifer sediments shows that 90% are larger than 1 mm, while between 40 and 80% are larger than 10 mm [3].
Artificial recharge operations using injection wells are often limited by the clogging of well screens and the porous media of the aquifer immediately surrounding the screens [5,6]. Under operation at a constant pressure, clogging can reduce the injection rate until it reaches an unacceptably low value. At a constant rate, clogging can cause an excessive increase in head losses of the well and aquifer within days, weeks or months of operation, depending on the clogging process involved. Clogging processes, which can be extremely rapid, have often been shown to be the consequence from suspended sediments in the injected water depositing within the pores of the aquifer [5]. Other factors are also capable of producing clogging, such as bacterial growth, chemical reactions forming precipitates, swelling of clay minerals in the formation, generation of gases, air entrainment or mobilisation, migration and deposition of fine material [5]. Clogging of artificial recharge bores can be due to one or any combination of these factors [7].
The cost-benefit analysis of artificial recharge demands sufficient recharge rates along the duration of the injection phase. Therefore, as a matter of practical concern, it is desirable to evaluate the potential for clogging formation and the subsequent impact of clogging, as well as the strategies to counteract this phenomenon. For the given set of hydrogeological properties of the Llobregat aquifer (high hydraulic transmissivity, high porosity), SFSW was selected to be injected. In fact, chlorinated SFSW has already been injected in the 70s, at which time chlorinated SFSW was the water sent for distribution. The current study aims to inject SFSW prior to any chlorination step. Due to the clogging potential of SFSW in the ASR system, a preliminary lab test to evaluate these risks was set up.
Table 1 shows the comparison of the most relevant quality parameters between SFSW, native groundwater, Spanish drinking quality standards and literature recommendations for ASR systems.
It is worth mentioning that published recommendations of threshold values for injection water in ASR schemes are scarce. Several efforts have been previously conducted [5,8,9,10,11,12,13,14], but quality parameters considered were limited to turbidity, Modified Fouling Index (MFI) (as indicators of particles load that may induce physical clogging) [8,9,10], and Total Organic Carbon (TOC) and Assimilable Organic Carbon (AOC) (as indicators of promoters of biofilm that eventually can contribute to organic and biological clogging) [5,12,13]. Ammonium and Escherichia coli thresholds have also been reported [8] as indicators of chemical and pathogen pollution, respectively. Some organic growth indicators as AOC were discarded as future control parameters, due to their high cost, hard development of the analytical method and lack of historical data. Values sourced from these published recommendations are also given in Table 1.

3. Materials and Methods

3.1. Column Set-Up and Operation

The configuration and operation of the column were selected to mimic the ASR in Sant Joan Despí as closely as possible.
The column consisted of a transparent metacrylate cylinder (length of 85 cm and inner diameter of 39.2 cm) packed with a 20-cm height of Llobregat aquifer sediments (approx. 35 kg) placed on a 20-cm layer of spherical glass beads (average diameter of 7 mm) to hold the aquifer material (90% between 1 and 10 mm) in place. The size of glass beads was small enough (7 mm) to prevent the loss of soil particles. The cylinder material of the column was transparent methacrylate in order to facilitate visual observations of the events occurring within it.
Flow of injected water through a well screen in the ASR system in Sant Joan Despí was simulated by horizontally placing a metallic screen on the top of the aquifer material bed. This metallic screen was made of 16 perforated, rectangular, ST52 steel pieces that had exactly the same dimensions (4 cm × 4 cm × 0.6 cm) as those used in the ASR wells. The 16 pieces were arranged in a 4 × 4 array, covering an area of the column section of 16 cm × 16 cm (see Figure 4). The design of the metallic screen allowed for the withdrawal of each piece separately for sampling and analysis purposes during the experiment. An additional, 1-cm2 steel piece was put beside the pieces as a sample for scanning electron microscopy (SEM) analysis.
SFSW was pumped from the sand filter unit of the Sant Joan Despí plant to the top of the column, from which it flowed in a downflow mode by gravity. The flow rate was maintained at an average of 0.062 L/s by keeping the water height constant (approx. 35 cm) above the surface of the bed. This was accomplished with an overflow canal at the top of the column. The flow rate corresponded to the well injection velocity of 1.8 m/h, which is the same as that in the Sant Joan Despí ASR. The flow was measured by weighing the amount of water at the outlet during known periods of time. Due to the retention of suspended solids within the bed by filtration, a gradual decay of the flow rate was expected during the injection period. To counteract this, the outlet of the column was provided with a variable rotameter. The column was also provided with a lateral port placed at the bottom of the aquifer material bed, which was fitted with a manometer to measure head loss caused by possible decreases in the permeability of the metallic screen and the aquifer material layer. The column was covered with an opaque material to prevent light exposure and to better simulate conditions encountered in the aquifer. The filter operated at room temperature (20 ± 5 °C), which is comparable to the Llobregat aquifer temperature.
The pilot was operated manually during 201 days with a continuous injection during working days (Monday to Friday) and being stopped during the weekends. The injection was also stopped during the experiment for other maintenance issues, such as not having SFSW available or for system pumps retrofit. Therefore, the calculated continuous injection time was 80 days.

3.2. Sampling and Analytical Methods

During the experiment, pressure head loss through the aquifer sediments layer was routinely (at minimum daily) monitored, with pieces of the metallic screen being periodically taken out for chemical analysis. This included the organic matter content, measured via loss of ignition method, and the extracellular polymeric substances (EPS) (on days 8, 27, 26, 51, 56, 64, 67 and 73 of continuous injection). At the final day of the experiment (day 182) the 1-cm2 steel piece was also analysed by SEM. Furthermore, photos of the metallic screen were also taken periodically.

3.2.1. Pressure Head Loss Measurements

A portable digital manometer (LEO3 KELLER, Winterthur, Switzerland) was placed in the port on the column wall in order to measure the head loss within the well screen and aquifer material bed. As the flow within the column was kept constant during the experiment, any head loss measured could be considered as a direct indicator of clogging occurring in the metallic screen and the aquifer material.

3.2.2. Determination of Organic Matter in Sediments Deposited on the Metallic Screen Pieces

A piece of the metallic screen was retrieved at each sampling event, and 1 cm2 of its surface was scraped with a cell scraper until a sample of 60 g was obtained. Then, its content of organic matter was analysed according to well-established procedures found in the literature [15]. Basically, the loss of ignition analysis is based on a sequential heating of the sample, whereby it is first dried in an oven until constant weight is achieved (usually 12–14 h at 105 °C) and then combusted in a muffle furnace (Dinter-Dinko Instruments, Barcelona, Spain) to ashes and carbon dioxide at a temperature between 500 and 550 °C in air atmosphere. The difference in weight of the sample before and after the combustion corresponds to the content of organic matter in the sample. Upon completion of the analysis, the piece analysed was placed back into the column.

3.2.3. Biofilm Growth Evolution Determination

Similar to the sampling previously described, the EPS present in a 1-cm2 sample was removed using a phosphate tampon solution, stored in an Eppendorf safe–lock tube and analysed following the method described in [16]. The analysis results of the EPS content in the biofilm of the different samples are given in micrograms of glucose equivalents per sampled area (1 cm2). In this case, duplicates (taken from either a different 1 cm2 of the same piece or from another piece) were analysed to gain in representativity (giving rise to a total of 16 samples). Upon completion of the analysis, the piece analysed was placed back into the column.

3.2.4. Visual Observation of the Metallic Screen Pieces

Photographs were taken regularly during the experiments in order to capture images of the metallic screen pieces and document changes, if any, in their appearance. Prior to taking a photograph, the water in the column was removed. Once emptied, photographs were taken from above using a digital camera.

3.2.5. Examination of Sediment Morphology by Scanning Electron Microscopy with Energy Dispersive X-rays Analysis

In order to have a clearer idea of the morphology of the clogging layer and to identify biofilm formation in the well screen, SEM was performed. SEM is a very useful technique for the investigation of the surface structure of biological samples. Much of the current knowledge about biofilms is due to the advances in imaging studies, especially SEM [17]. The analysis of characteristic energy dispersive X-rays (EDX) emitted from the sample gives more quantitative elemental information. Furthermore, SEM/EDX is the best known and most widely-used of surface analytical techniques. High resolution images of surface topography, with excellent depth of field, are produced using a highly-focused, scanning (primary) electron beam.
As well as the biofilm research carried out on the well screen, biofilms are usually found on solid substrates submerged in or exposed to an aqueous solution, formed by structured communities of bacteria, algae, cyanobacteria, fungi, and protozoa embedded in a polymeric matrix [18]. Most microorganisms found in biofilms produce extracellular polymers, which lead to adhesion to the substrate and comprise the polymeric matrix responsible for biofilm integrity. EPS are rich in high molecular weight polysaccharides and other non-sugar compounds such as proteins. The EPS matrix is a crucial structural parameter for biofilm stability and architecture and provides a refuge for the microbial community against shear stress, and protection against desiccation.
For the examination of the biofilm in the well screen, a 1-cm2 steel piece was placed in the column that, over the course of the experiment, was covered with the clogging material, and this was used for SEM observation.
Sample preparation was carried out using a standardised methodology [19]. Samples of biofilm were fixed in 2.5% glutaraldehyde in phosphate buffer at 4 °C (0.1 M and pH 7.4) for 2 h and washed four times (10 min each wash) in the same buffer. Samples were then immediately fixed in a mixture of 1% osmium tetroxide and 0.8% potassium ferricyanide in phosphate buffer at 4 °C. After washing samples six times in ultrapure water (a quick first wash with and another five washes every 10 min at 4 °C), samples were then dehydrated at 4 °C in successively increasing gradient concentrations of ethanol (50% ethanol for 10 min, 70% ethanol overnight, 80% ethanol for 10 min, three changes of 90% ethanol for 10 min each, three changes of 96% ethanol for 10 min each, three changes of 100% ethanol for 10 min each). Samples were then dried by critical point, where ethanol was replaced by liquid CO2 and changed to gas without changing its density. Microscopic examination was performed using SEM (JEOL LTD, Tokyo, Japan) equipped with an EDX analyser (Oxford Instruments, Abingdon, UK, INCA-250 model) operated at 20 kV. For the visual characterization of the morphology, the solid samples were sputter-coated with carbon to facilitate electrical conduction in the SEM.

4. Results

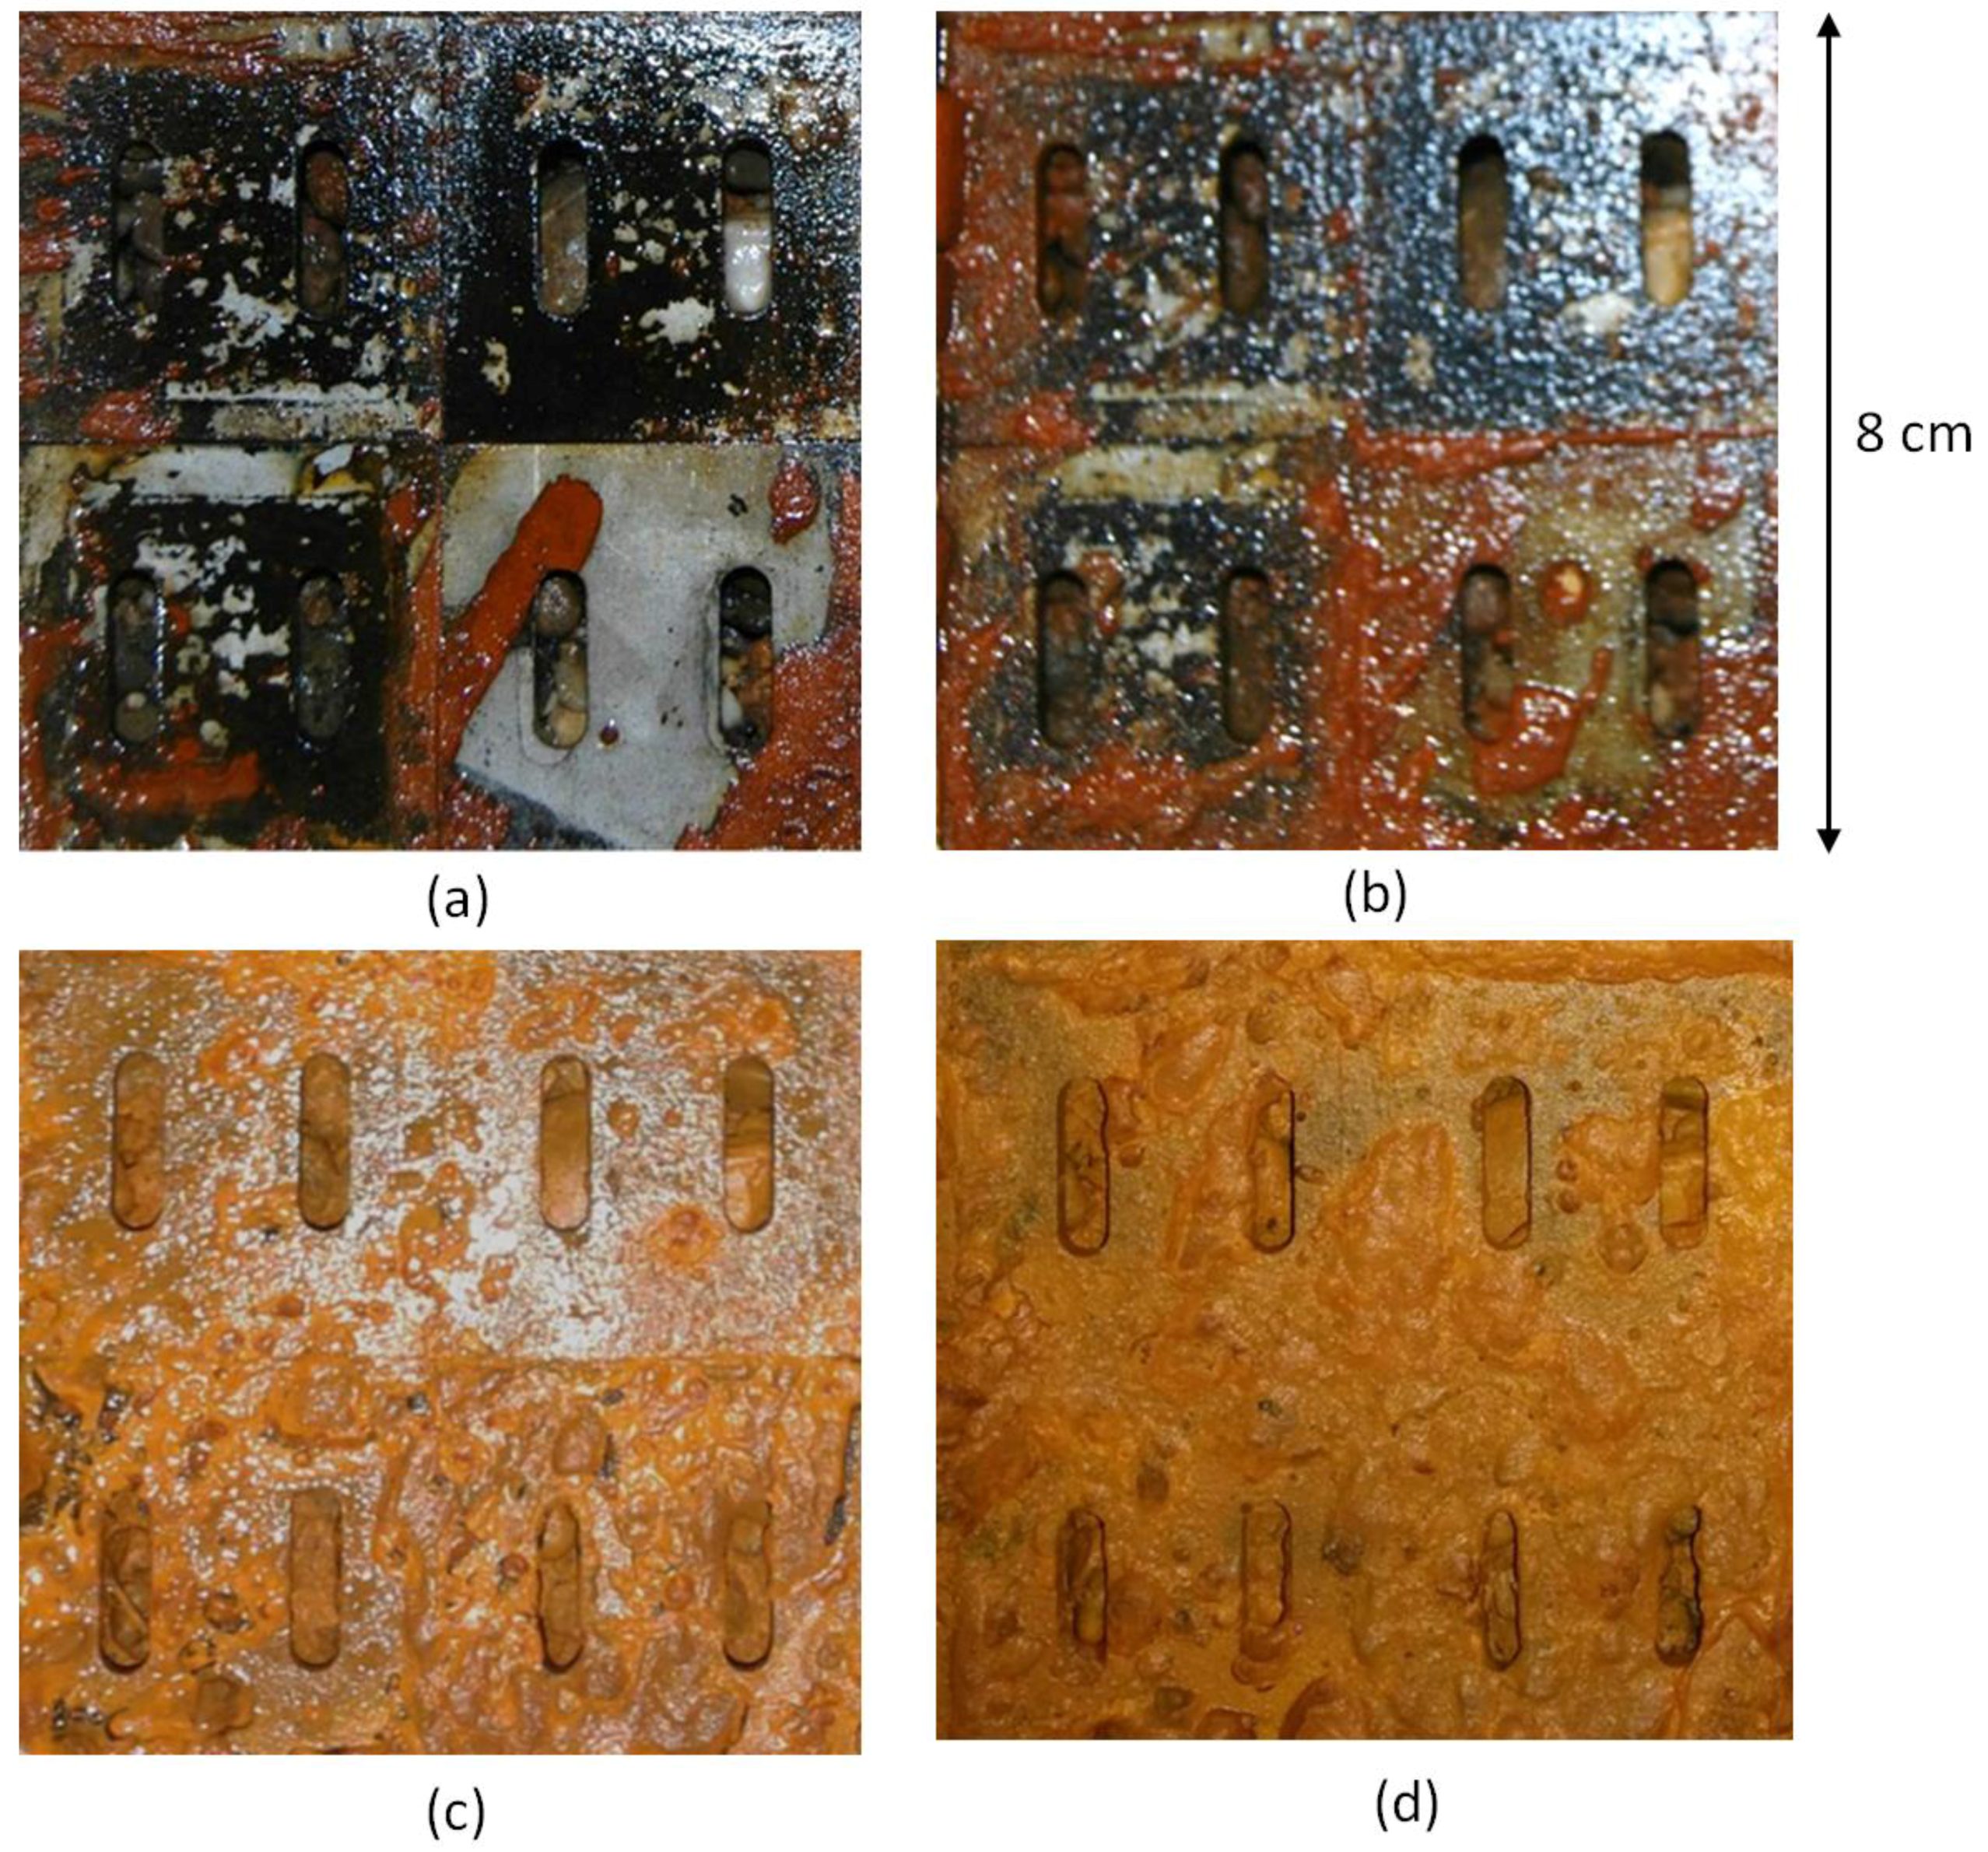
4.1. Well Screen Observations

Figure 5 shows a sequence of pictures of four different pieces taken at different times after the beginning of the experiment. It can be seen that the pieces were gradually covered by orange-brown fine viscous sediments, with the consequent clogging of the piece holes. In the column experiment, after 80 days of continuous injection without any backwash, the grid openings were still open but some of them had reduced open area.

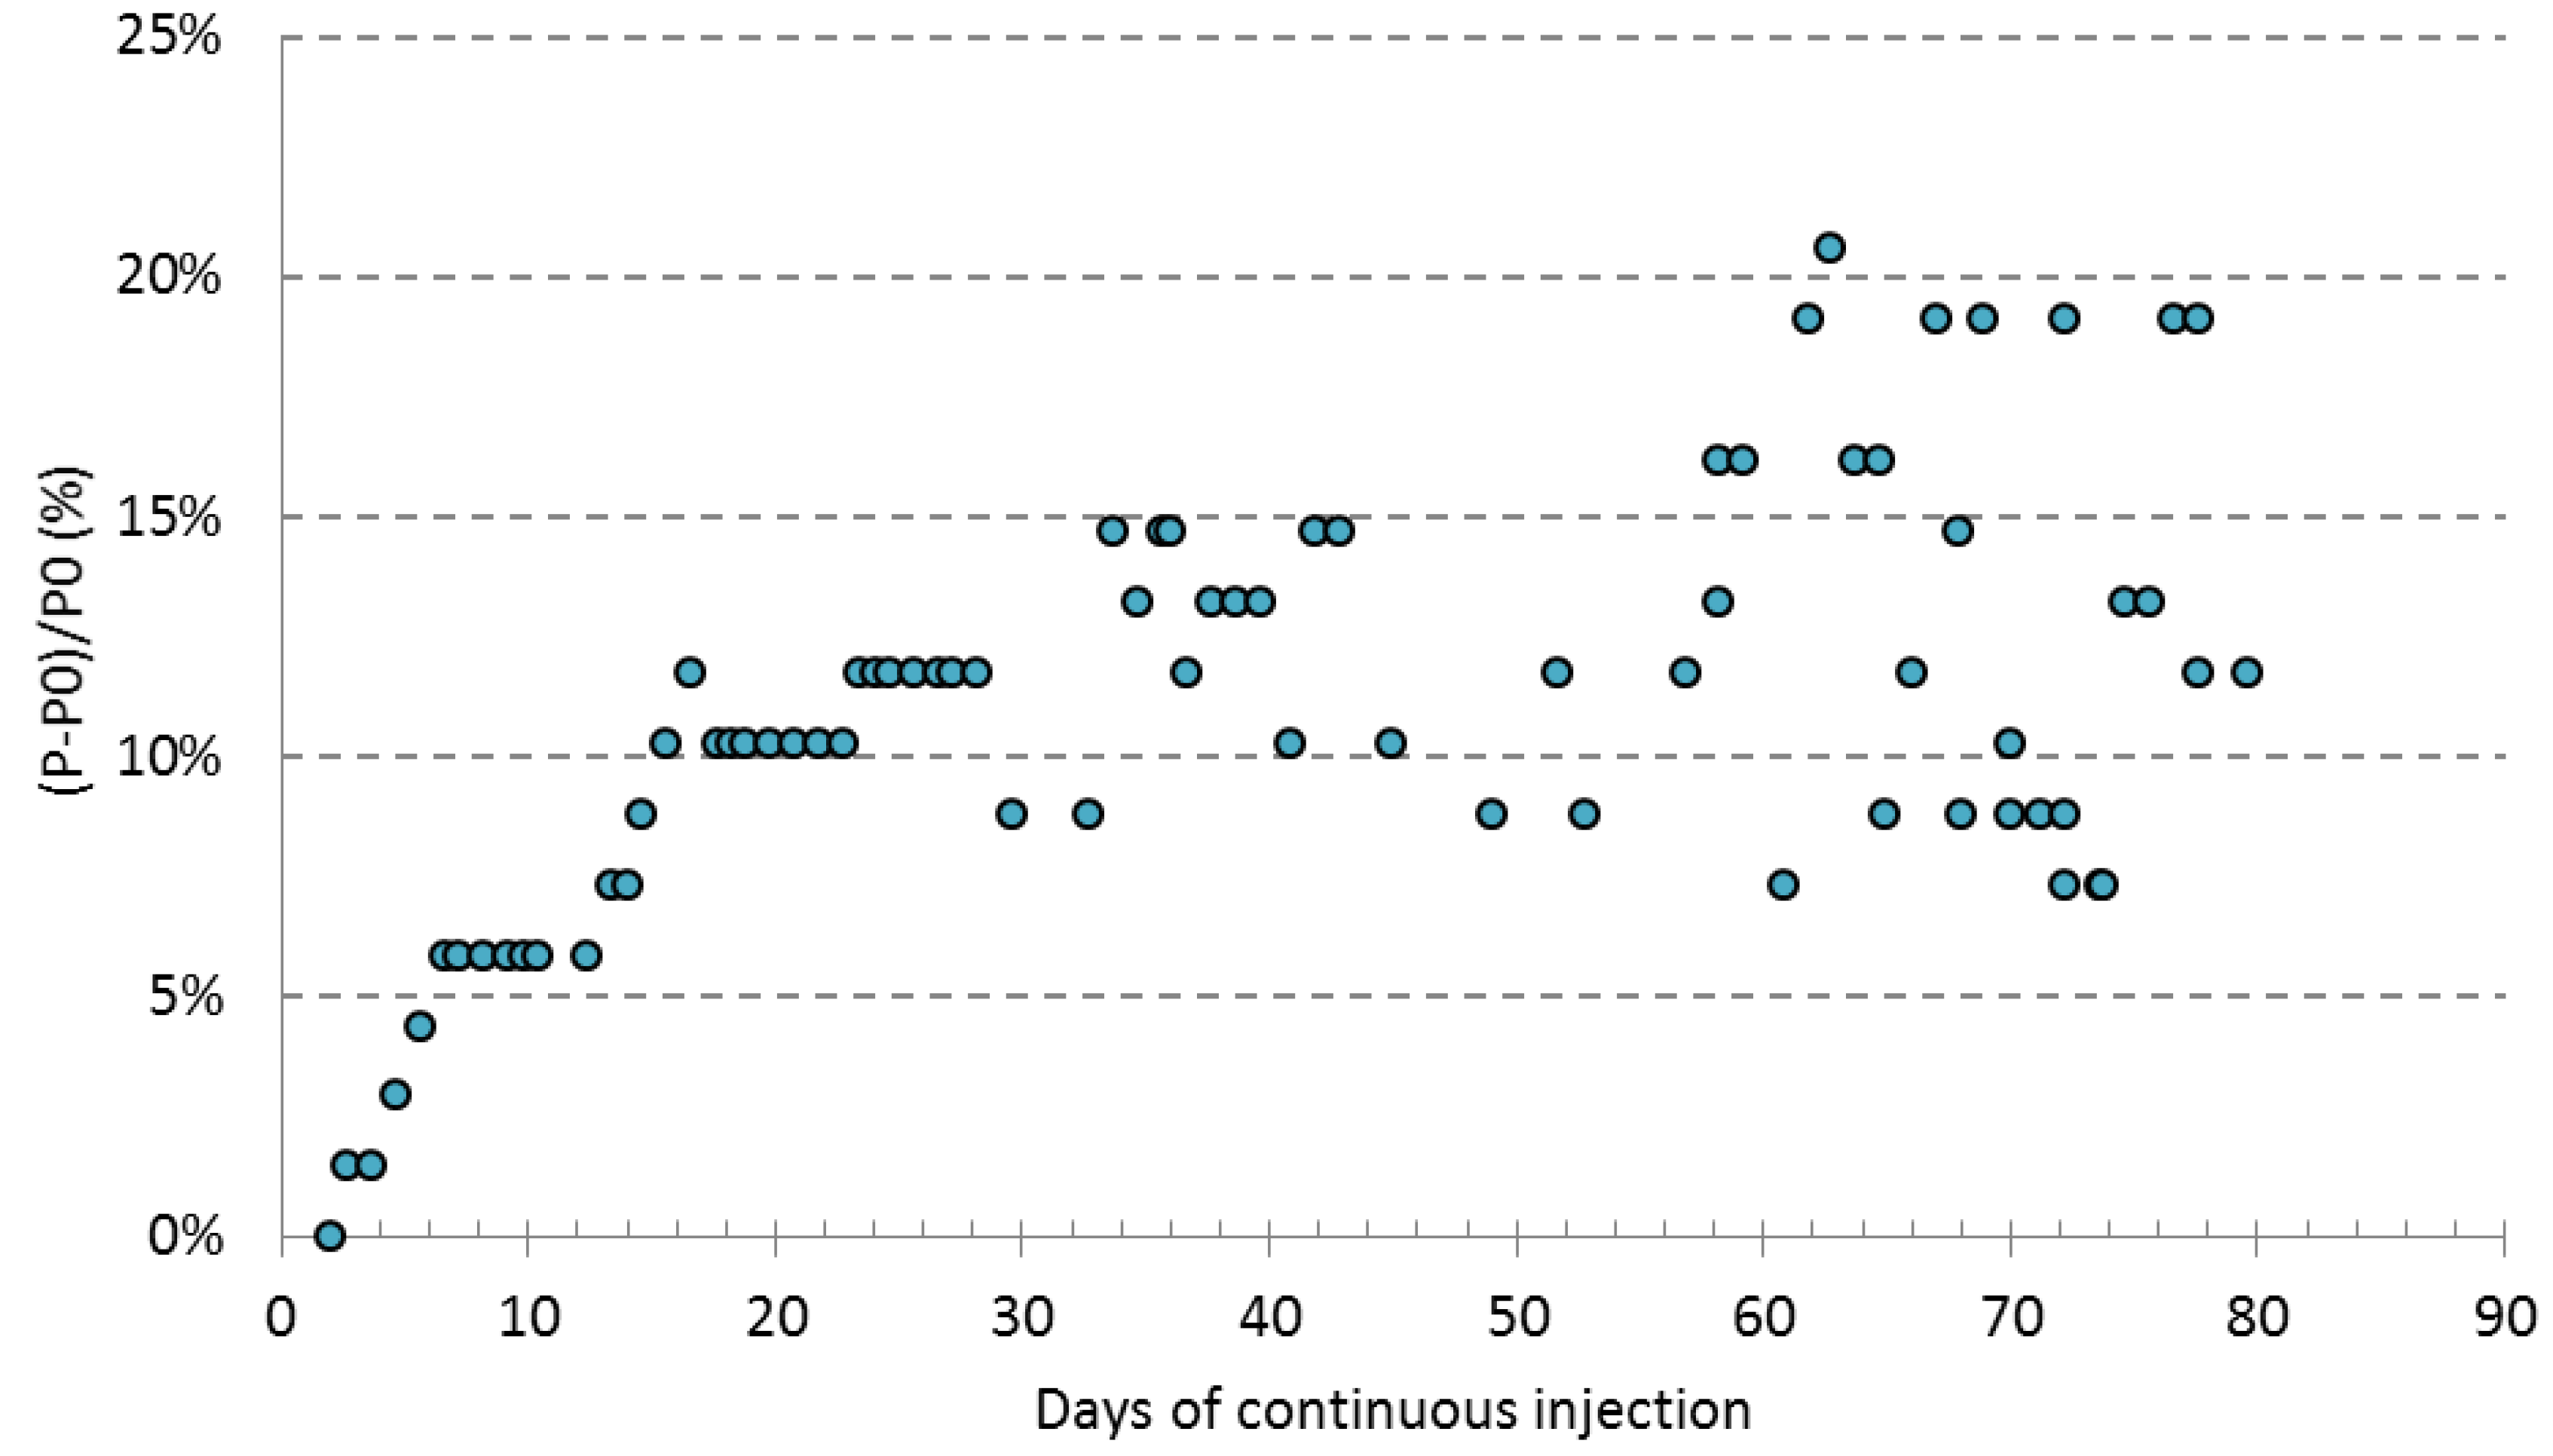
4.2. Preassure Head Loss

Figure 6 depicts the evolution of the head loss (expressed as the relative change in measured head loss, (P-Pinitial)/Pinitial)) during the pilot column experiment. During the first 30 days of continuous injection, the relative change in head loss increased constantly until a maximum of 15%. After this first 30 days period, no clear trend can be observed due to the strong variation of relative change in head loss measured (always ranging between 10% and 20%).

4.3. Determination of Organic Fraction of Biofilm

The analysis by loss of ignition of the samples extracted from the pieces revealed that the content of organic matter in the clogging material averaged 11 ± 1%. This accumulation of organic matter on the metallic screen serves as an indicator of the carbon available for bacterial activity to take place. The remaining 89% likely corresponded to inorganic particles deposited on the well screen.

4.4. Biofilm Growth Evolution Determination

Biofilm formation is a complex process which depends on the microbial species, its communication and motility skills, the features of the surface where the biofilm will attach, and, of course, the quality as well as the chemical and physical properties of the surrounding aquatic environment. On a surface such as metal, biofilms allow for a variety of microorganisms with differing redox potential requirements to reside in close proximity to the metal [18]. In this way, biocorrosion can occur during biofilm formation, as happened in the case of the metallic pieces of the well screen. Biofilms are composed primarily of microbial cells and EPS. EPS may account for 50% to 90% of the total organic carbon of biofilms [20] and can be considered the primary matrix material of the biofilm. For this reason, a study of the concentration of EPS was carried out in order to analyze the phases of biofilm formation on the well screen. Figure 7 depicts EPS content related to the five stages of biofilm formation during the time of continuous injection:
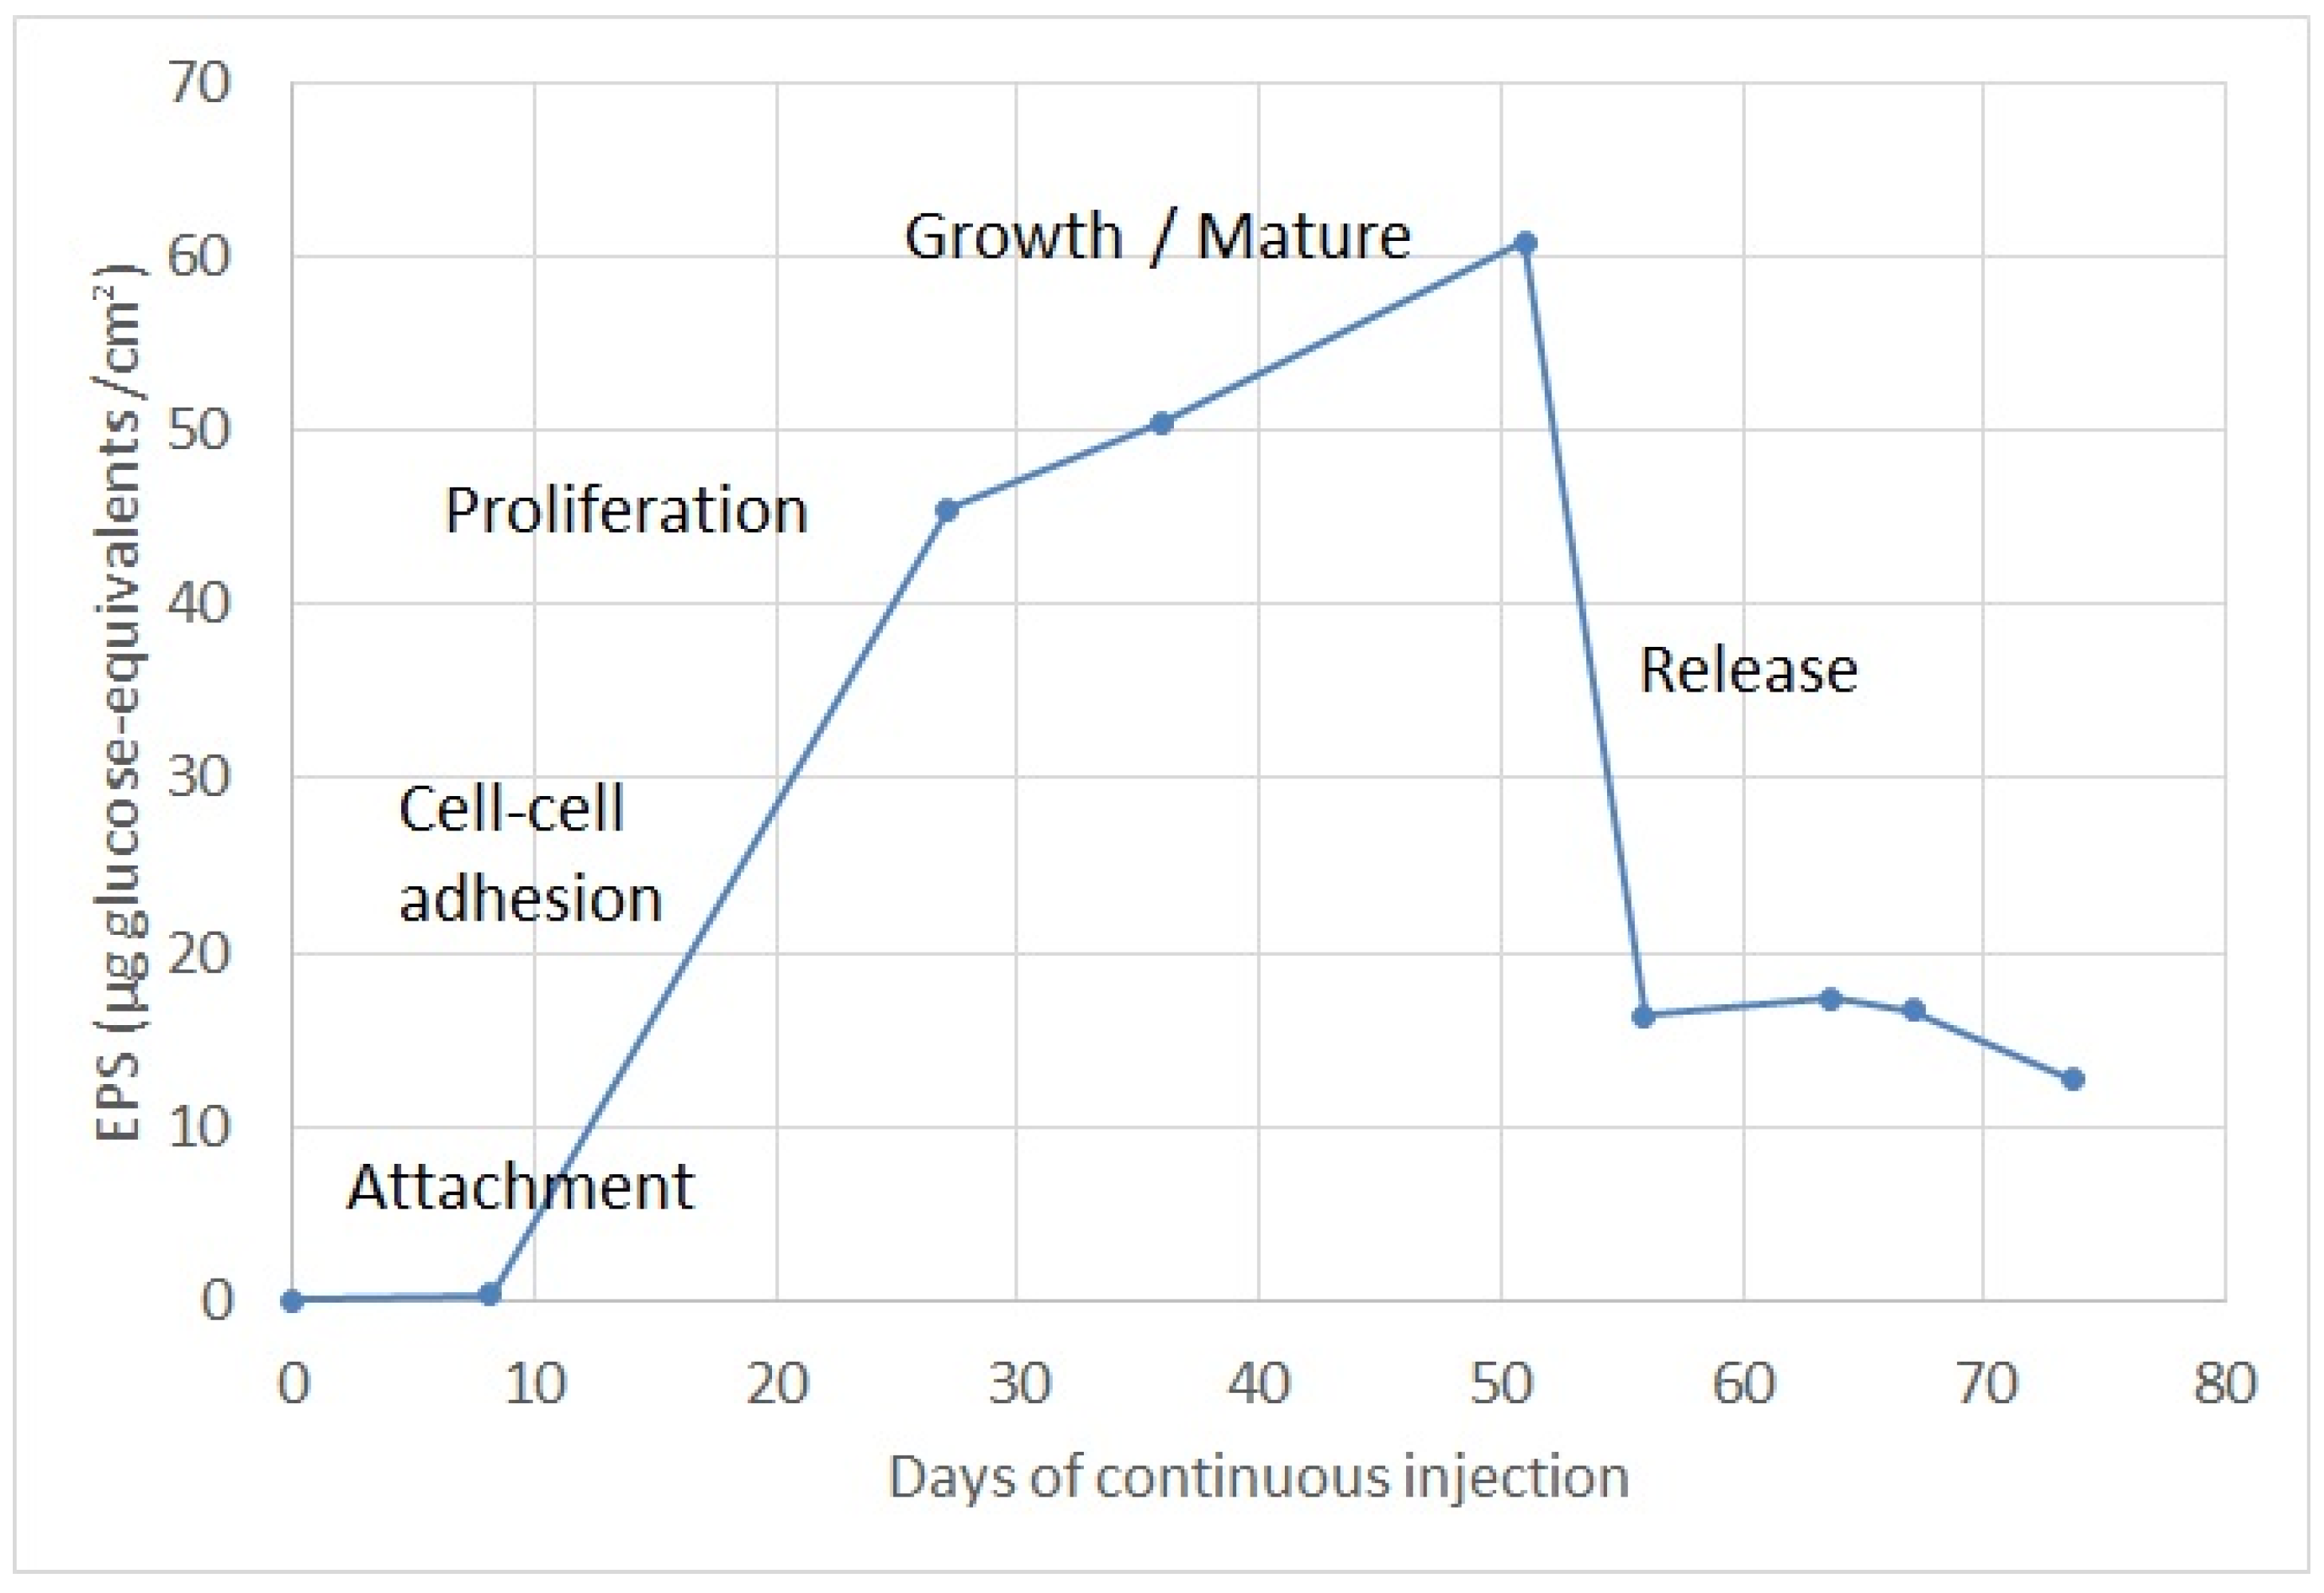
  • Attachment: during the first ten days, EPS concentrations to the order of 1 µg glucose-eq/cm2 were observed, corresponding to the time at which planktonic bacteria adhere to the well screen surface. Previous research shows that a single bacterium will reach the surface through the liquid phase usually by swimming. The single bacterium will attach to surfaces using flagella and other surface appendages [21]. This attachment is generally reversible and it is largely mediated by van der Waals forces. However, early stages of biofilm development will depend on the specific strain. In nature biofilms, other eukaryotic organisms interact with the biofilm and thus form part of it, such as fungi, algae, yeasts, protozoa and other microorganisms.
  • Adhesion: the following ten days were observed as the concentration of EPS increased progressively, passing from 1 to 30 µg glucose-eq/cm2 in about 10 days. As observed by other researchers [22], during the second stage bacteria will slowly but tightly adhere to the surface via pili, proteins, polysaccharides and fimbriae. Filamentous fungi will carry out deposition of spores or other propagules, such as hyphal fragments or sporangia. Diatoms will attach to the substratum by the production of mucilage, which will encapsulate the cells.
  • Proliferation: from day 20 to day 28 a concentration of EPS was observed around 45 µg glucose-eq/cm2, corresponding to this subsequent step of proliferation, which is characterized mainly by the proliferation and production of EPS. During this stage, cells lose their flagella-driven motility and the whole system becomes immobilized. EPS are not unique to bacteria; some of the most abundant EPS producers are microalgae (in particular, diatoms). Fungi (yeasts and molds) also produce EPS [23].
  • Biofilm maturation: this phase is the most elongated in time, lasting approximately 25 days, and the maximum EPS formation occurs during the maturation phase, reaching a maximum value of 60 µg glucose-eq/cm2. During this step, microorganisms continue to proliferate and excrete large amounts of hydrated EPS consisting of polysaccharides, proteins, nucleic acids and lipids, which provide stability to the biofilm as a whole and additional shelter to individual microorganisms [24].
  • Release or detachment: during this last stage, the EPS concentration decreased progressively, reducing from 60 to 12 µg glucose-eq/cm2 in about 5 days. This phase corresponds to the moment when motile cells may disperse from the film by diverse mechanisms. Cells from the biofilm will attach at other places and will promulgate the spreading of the film [25]. Dispersal of fungi involves spore dispersal or release of biofilm fragments.

4.5. Scanning Electron Microscopy Observations and Energy Dispersive X-ray Microanalysis

The solid-liquid interface between the surface (well screen) and aqueous medium (SFSW) provides an ideal environment for the attachment and growth of microorganisms. Figure 8a corresponds to the most frequent image observed during SEM observations, which shows a highly developed biofilm with a dense matrix of EPS. EDX revealed the elemental composition of these irregular pellet formations of carbon, oxygen and hydrogen, corresponding to organic substances, but also revealed the presence of iron, calcium, magnesium, potassium, silica and aluminium, corresponding to the main fraction of inorganic material.
SEM examination also revealed a complex morphological diversity composed of diverse microorganisms such as bacteria, algae and fungi, as well as their exopolymers, diatom skeletons, detritus and other biomaterial build-up (Figure 8a,b). Organic filaments closely resembling fungal hyphae were observed throughout the whole surface of the piece, together with branching filamentous structures of fungi and a sporangium, an enclosure in which spores are found (Figure 8c). Furthermore, siliceous diatom skeletons of diverse shapes and sizes were occasionally observed across the examined piece surface (Figure 8d).

5. Discussion

Although it was difficult to evaluate the clogging potential of only one type of water in an ASR system, the aggregate analysis of different results suggests the suitability of SFSW as injection water for the Llobregat ASR system.
The background information review of ASR injection water quality selected indicators threshold values (Table 1) indicates that SFSW may induce physical clogging of the ASR wells because the exhibited values of turbidity (0.24 Nephelometric Turbidity Units) and MFI (23.5 s/L2) exceed the minimum recommended values (0.2 NTU and 2 s/L2, respectively). Nevertheless, the risk of physical clogging anticipated by these recommendations may be alleviated by the high hydraulic transmissivity of the Llobregat aquifer. From a microbiologic point of view, it must be said that SFSW from the DWTP of SJD does not fulfil microbiologic drinking water requirements, as E. coli, total coliforms and Clostridium perfringens in SFSW are in the range of 1 to 3 logarithms. While this pathogen load is expected to be of no concern with regard to the quality of the stored groundwater, because it can be attenuated by the aquifer in the range of days [26], it may cause bio-clogging within the borehole wall or well screen. Indicators as TOC, AOC, nitrogen, phosphorus and potentially high temperatures in summer also suggest that bio-clogging formations could occur.
The different results of the column experiment reinforce the preliminary evaluation, suggesting that although SFSW injection to the Sant Joan Despí ASR system will develop physical and bio-clogging, its effect would not block the water passage through the injection well. Firstly, this effect was seen with the visual inspection of the well screen holes where the clogging material reduced the opening area but did not closed the holes. Secondly, the results revealed a linear increase of the relative change in head loss during the first days of the injection, but with a trend change after the first 30 days, suggesting a rapid clogging development in the short term but a decrease in the its development rate and a stabilization of the column clogging block impact in the midterm. A similar evolution was seen in the biofilm growth evolution determination by EPS analysis, with an initial rapid growth, a following stabilization and a final release. The selection of EPS as a bio-clogging indicator might have repercussions in ASR studies and MAR investigations, since there are other research groups that are already using it [27]. Finally, scanning electron microscopy confirmed the presence of a highly developed biofilm with a dense matrix of EPS in the clogging formations.

6. Conclusions

Based on the results of the column type experiment with SFSW, the following conclusions can be drawn:
  • Maximum relative change in head loss was 20% after 75 days of continuous operation in the ARS simulation experiment. Although the clogging formation caused an increase in head loss within the column, this was not enough to limit the flow rate. This suggests that in a real ASR system, a limitation in the aquifer infiltration capacity is not expected (the gravel would still be able to accept this injection flow), but a rise in the piezometric level of the well would be expected.
  • Based on the EPS formation, it was determined that the bio-clogging formation evolved with a rapid increase in the first 140 days and a subsequent stabilization and decrease in the following days. It was also assessed that the composition of the muddy sediment settled in the well screen simulation was mainly inorganic, but comprised 11% of organic content.
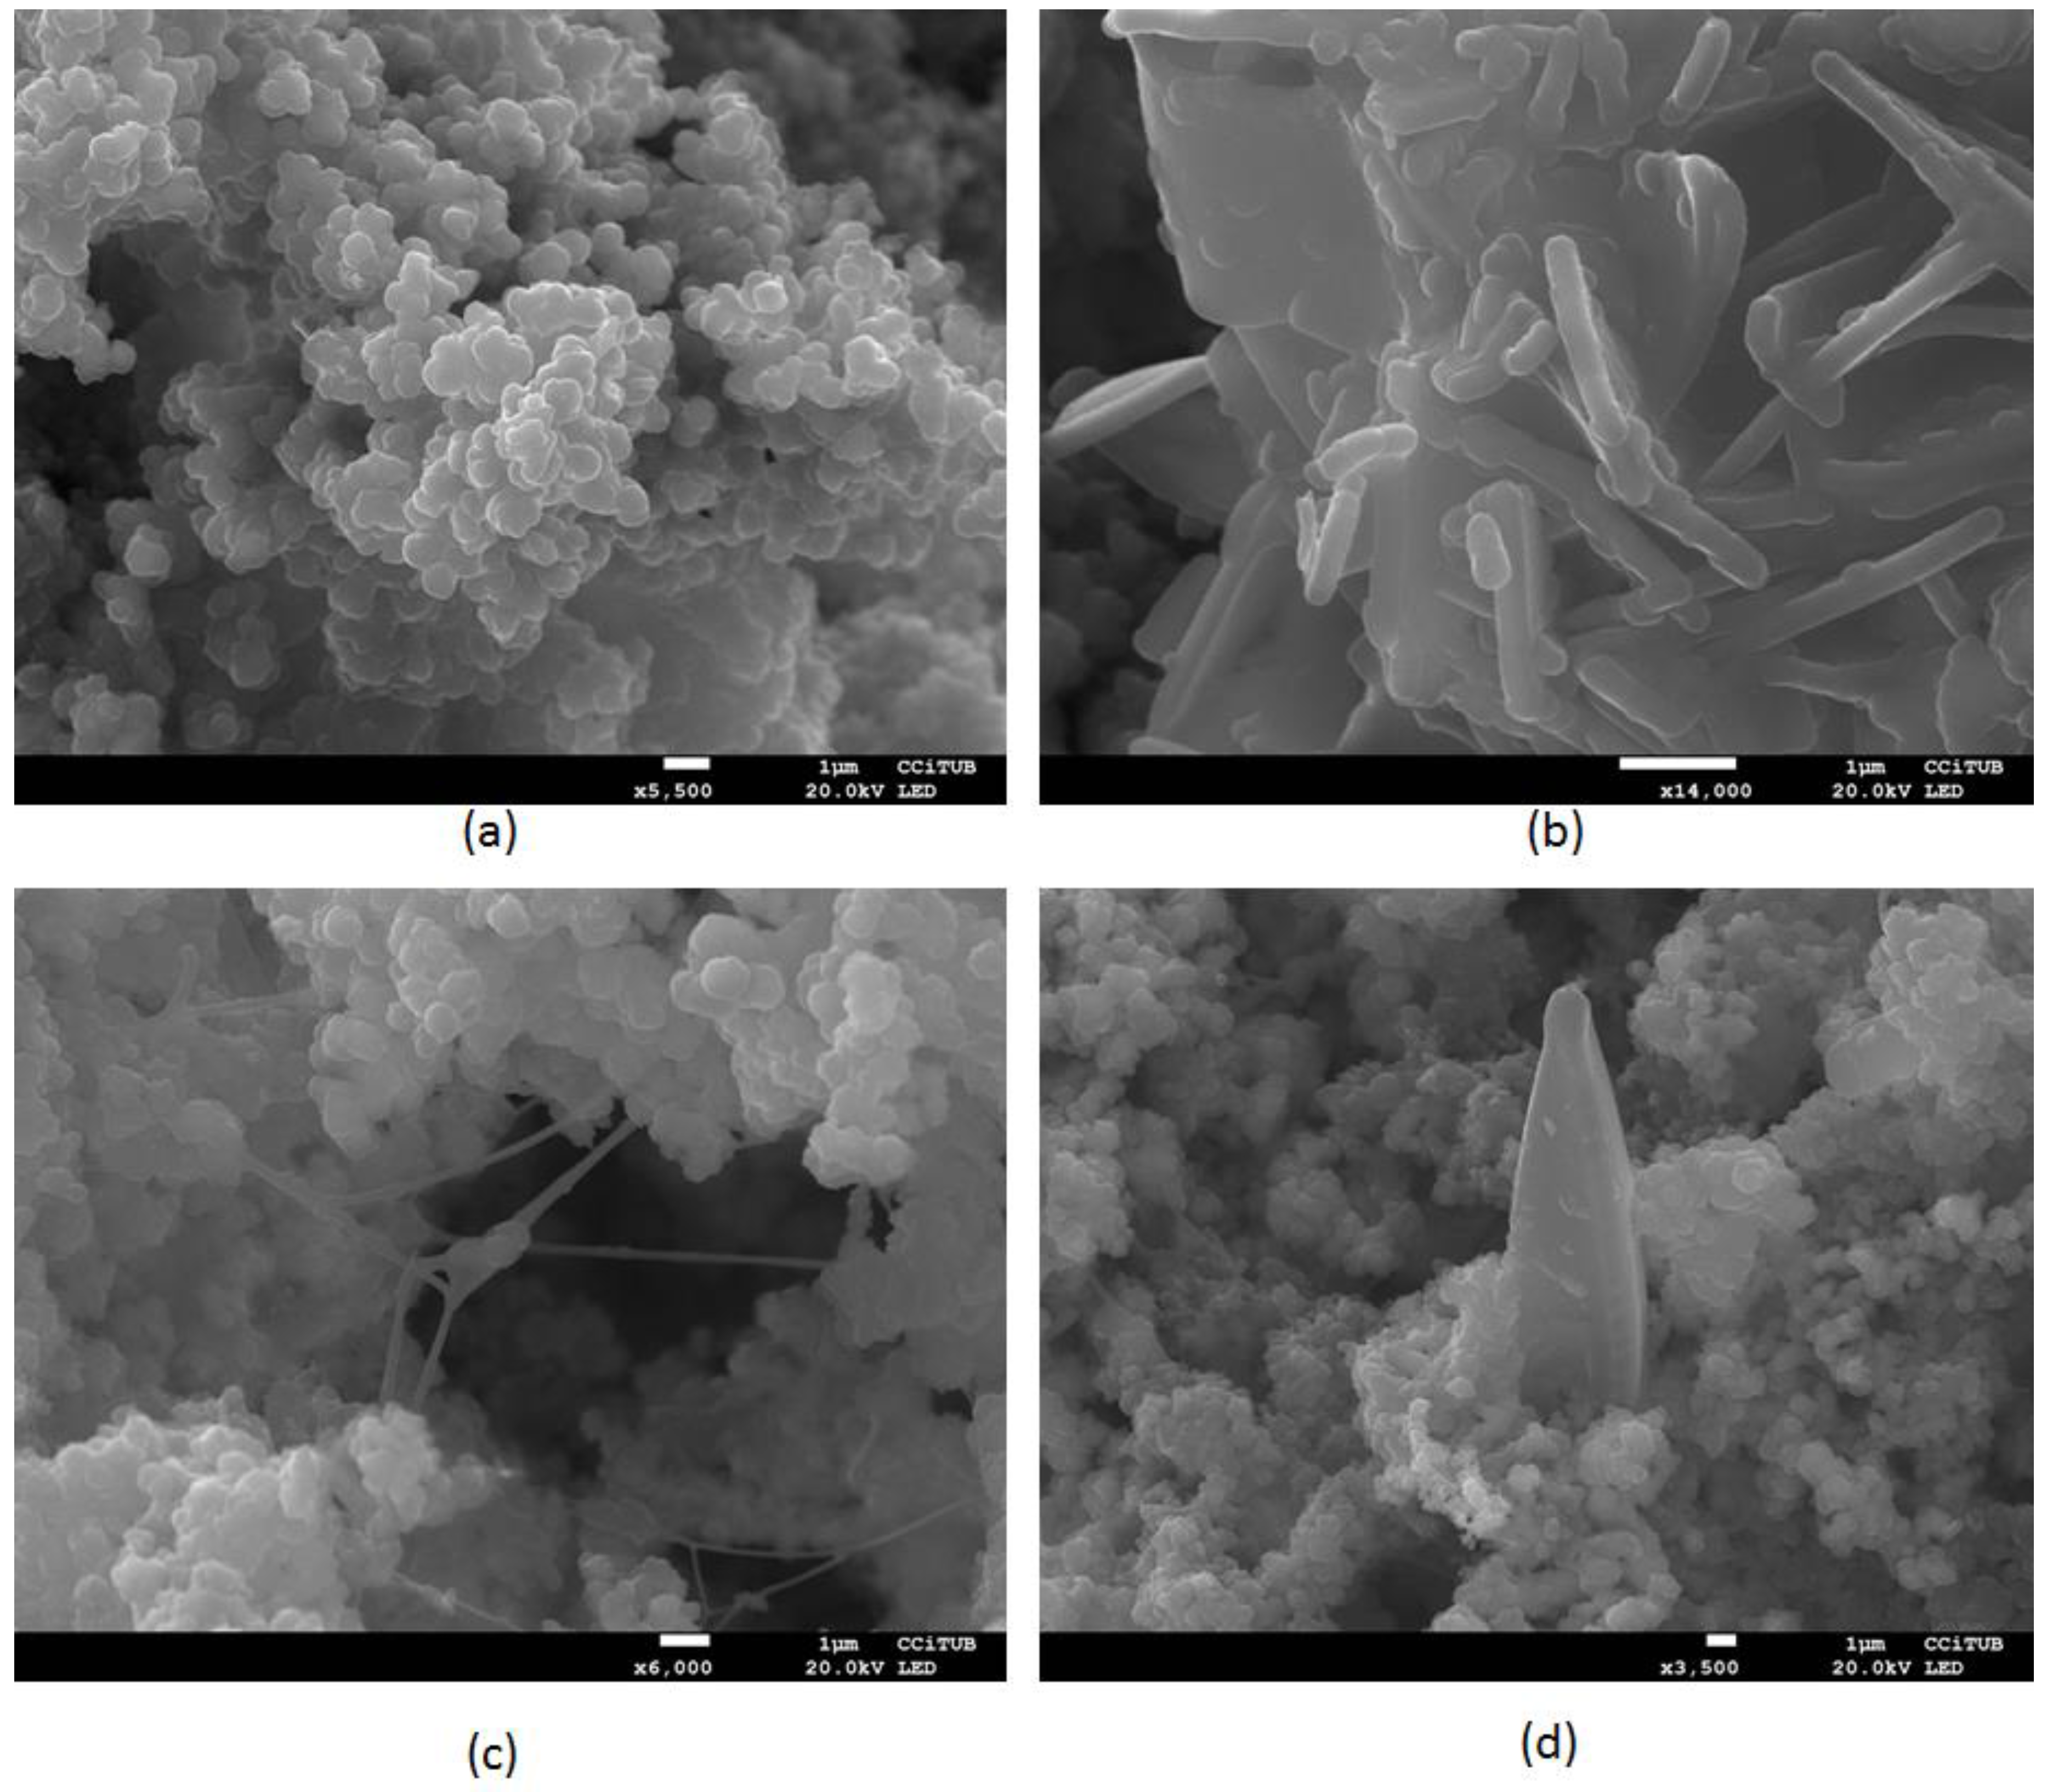
  • Bio-clogging formation characterization by SEM photography and elemental components determination identified the presence of carbon, oxygen and hydrogen, corresponding to the organic fraction, and iron, calcium, magnesium, potassium, silica and aluminium, corresponding to the main fraction of inorganic material. The pictures have shown some isolated bacillus and hifas, while most of the ubiquitous material observed with the microscope corresponds to biological mass aggregates, presumably EPS.
Therefore, after evaluation of a pilot scale work, it is suggested to use SFSW as injection water because it is demonstrated that although clogging can occur, it is expected that it will not negatively affect the correct operation of the ASR Llobregat system.
The pilot evaluation was conducted by simulating an ASR well as realistically as possible, but the scale of a real system is different and it has numerous complexities as a result of being a natural system. Therefore, future research at the Llobregat site focusing on SFSW injection in a fully-operative ASR well will allow us to confirm these preliminary conclusions.

Acknowledgments

The research leading to these results has received funding from the European Union Seventh Framework Programme (FP7/2007-2013) under grant agreement No. 619039. This publication reflects only the author’s view and the European Union is not liable for any use that may be made of the information contained therein. We thank the two anonymous reviewers whose comments/suggestions helped improve and clarify this manuscript.

Author Contributions

Pere Camprovin, Marta Hernández, Jordi Martín-Alonso and Belén Galofré conceived and designed the experiments; Pere Camprovin and Marta Hernández performed the experiments; Pere Camprovin, Marta Hernández, and Sonia Fernández analyzed the data; Jordi Martín-Alonso, Belén Galofré and José Mesa supervised this study and reviewed the manuscript. Pere Camprovin and Sonia Fernández wrote the paper. The final version was approved by all authors.

Conflicts of Interest

The authors declare no conflict of interest.

Abbreviations

The following abbreviations are used in this manuscript (in alphabetical order):
AOCAssimilable Organic Carbon
ASRAquifer Storage and Recovery
DWTPDrinking Water Treatment Plant
EPSExtracellular Polymeric Substances
EDXEnergy dispersive X-ray
MARManaged Aquifer Recharge
MFIModified Fouling Index
SEMScanning Electron Microscopy
SFSWSand-filtered Surface Water
SJDSant Joan Despí Municipality
TOCTotal organic Carbon

References

  1. DESSIN (Demonstrate Ecosystem Services Enabling Innovation in the Water Sector). Available online: https://dessin-project.eu/ (accessed on 10 November 2016).
  2. Armenter, J.L. Artificial recharging of the aquifers in the joint management of the resources in the delta of the river Llobregat. Houill. Blanche-Rev. Int. Eau 2008. [Google Scholar] [CrossRef]
  3. Pérez-Paricio, A.; Carrera, J. Site Description Cornellà, Spain; Final Report, EU Project on Artificial Recharge of Groundwater 1999, Chapter 4.8. EC Project ENV4-CT95-0071; UPC: Barcelona, Spain, 1999. [Google Scholar]
  4. European Union Seventh Framework Programme DESSIN Website. Project Delivarbale D22.4 Evaluation of Pre-Potablewater for Injection Using ASR. Available online: https://dessin-project.eu/?wpdmpro=draft-d22–4-a-evaluation-of-pre-potablewater-for-injection-using-asr (accessed on 10 November 2016).
  5. Pérez-Paricio, A.; Carrera, J. EU Project on Artificial Recharge of Groundwater Contract ENV4-CT95-0071. In Clogging Handbook; UPC: Barcelona, Spain, 2001; Chapter 2. [Google Scholar]
  6. Hubbs, S.A. Riverbank Filtration Hydrology: Impacts on System Capacity and Water Quality. In Proceedings of the NATO Advanced Research Workshop on Riverbank Filtration Hydrology, Bratislava, Slovakia, 7–10 September 2004; Springer: Bratislava, Slovakia, 2006. [Google Scholar]
  7. Pyne, R.D.G. Aquifer Storage Recovery: A Guide to Groundwater Recharge through Wells, 2nd ed.; ASR Systems: Gainesville, FL, USA, 2005. [Google Scholar]
  8. Martin, R.; Dillon, P. Department of Water, Land and Biodiversity Conservation. In Aquifer Storage and Recovery, Future Directions for South Australia; Report DWLBC 2002/04; CSIRO: Adelaide, Australia, 2002. [Google Scholar]
  9. West Basin Municipal Water District. Recycled Water Quality Standards Study; Final Report; Carollo Engineers: Walnut Creek, CA, USA, 2008. [Google Scholar]
  10. Olsthoorn, T.N. The Clogging of Recharge Wells, Main Subjects; KIWA-Communications 72; UDC: Rijswijk, The Netherlands, 1982. [Google Scholar]
  11. Ribas, F.; Frias, J.; Huguet, J.M.; Lucena, F. Efficiency of various water treatment processes in the removal of biodegradable and refractory organic matter. Water Res. 1997, 31, 639–649. [Google Scholar] [CrossRef]
  12. Mills, W.R. The quest for water through artificial recharge and wastewater recycling. Management of Aquifer recharge for Sustainability. In Proceedings of the 4th International Symposium on Artificial Recharge of Groundwater, Adelaide, Australia, 22–26 September 2002; Balkema Publishers: Adelaide, Australia, 2002. [Google Scholar]
  13. Van der Kooij, D.; Hijnen, W.A.M. The effect of low concentrations of assimilable organic carbon in water on biological clogging of sand beds. Water Reg. 1992, 26, 963–972. [Google Scholar]
  14. Escalante, F. Técnicas de Tratamiento de Suelo y Acuífero (S.A.T) Aplicadas a la Gestión de la Recarga; Grafinat: Madrid, Spain, 2006. [Google Scholar]
  15. Dean, W.E., Jr. Determination of carbonate and organic matter in calcareous sediments and sedimentary rocks by loss on ignition: Comparison with other methods. J. Sediment. Petrol. 1974, 44, 242–248. [Google Scholar]
  16. Romaní, A.M.; Fund, K.; Artigas, J.; Schwartz, T.; Sabater, S.; Obst, U. Relevance of Polymeric Matrix Enzymes during Biofilm Formation. Microb. Ecol. 2008, 56, 427–436. [Google Scholar] [CrossRef] [PubMed]
  17. El Abed, S.; Ibnsouda, S.K.; Latrache, H.; Hamadi, F. Scanning Electron Microscopy (SEM) and Environmental SEM: Suitable Tools for Study of Adhesion Stage and Biofilm Formation, Scanning Electron Microscopy; Kazmiruk, V., Ed.; InTech: Rijeka, Croatia, 2012. [Google Scholar]
  18. Else, T.A.; Pantle, C.R.; Amy, P.S. Boundaries for Biofilm Formation: Humidity and Temperature. Appl. Environ. Microbiol. 2003, 69, 5006–5010. [Google Scholar] [CrossRef] [PubMed]
  19. Bozzola, J.J.; Russell, L.D. Electron Microsscopy Principles and Techniques for Biologists; Jones and Bartlet Publishers: Sudbury, MA, USA, 1999. [Google Scholar]
  20. Flemming, H.-C.; Griegbe, W.J.; Mayer, C. Physico-chemical properties of biofilms. In Biofilms: Recent Advances in Their Study and Control; Evans, L.V., Ed.; Harwood Academic Publishers: Amsterdam, The Netherlands, 2000; pp. 19–34. [Google Scholar]
  21. Kearns, D.B. A field guide to bacterial swarming motility. Nat. Rev. Microbiol. 2010, 8, 634–644. [Google Scholar] [CrossRef] [PubMed]
  22. Monroe, D. Looking for Chinks in the Armor of Bacterial Biofilms. PLoS Biol. 2007, 5, e307. [Google Scholar] [CrossRef] [PubMed]
  23. Flemming, H.C.; Wingender, J. The biofilm matrix. Nat. Rev. Microbiol. 2010, 8, 623–633. [Google Scholar] [PubMed]
  24. Conrad, J.C. Physics of bacterial near-surface motility using flagella and type IV pili: Implications for biofilm formation. Res. Microbiol. 2012, 163, 619–629. [Google Scholar] [CrossRef] [PubMed]
  25. Imam, S.; Chen, Z.; Roos, D.S.; Pohlschröder, M. Identification of Surprisingly Diverse Type IV Pili, across a Broad Range of Gram-Positive Bacteria. PLoS ONE 2011, 6, e28919. [Google Scholar] [CrossRef] [PubMed]
  26. John, D.E.; Rose, J.B.; Kamarainen, A. Survival of Fecal Indicator Bacteria, Bacteriophage and Protozoa in Florida Surface and Ground Waters; Final Report of the Fate of Microorganisms in Aquifers Study; College of Marine Sciences, University of South Florida: Tampa, FL, USA, 2004. [Google Scholar]
  27. Freixa, A.; Rubol, S.; Brangarí, C.; Fernàndez-Garcia, D.; Sanchez-Vila, X.; Romaní, A. The effects of sediment depth and oxygen concentration on the use of organic matter: An experimental study using an infiltration tank. Sci. Total Environ. 2016, 540, 20–31. [Google Scholar] [CrossRef] [PubMed]
Figure 1. Drinking water treatment plant (DWTP) and Llobregat Aquifer section in Sant Joan Despí with the current aquifer storage and recovery (ASR) system with potable water injection and the proposed ASR scheme with sand-filtered water injection.
Water 09 00263 g001
Figure 2. Llobregat Aquifer location map and geological cross section. The ASR system location is marked in red.
Water 09 00263 g002
Figure 3. Comparison of aquifer transmissivity of different international ASR sites worldwide [4].
Water 09 00263 g003
Figure 4. Pilot column scheme simulating ASR.
Water 09 00263 g004
Figure 5. Evolution in clogging of the column well screen after (a) 1, (b) 20, (c) 29, and (d) 73 days.
Water 09 00263 g005
Figure 6. Normalized head loss in the column experiment within 80 days of injection (P: pressure, P0: pressure at the beginning of the experiment).
Water 09 00263 g006
Figure 7. Biofilm content evolution by the extracellular polymeric substances (EPS) analysis.
Water 09 00263 g007
Figure 8. Scanning electron microscopy (SEM) images of the biofilm. (a) Bacteria covered by the biofilm matrix. SEM image at 17,000× magnification; (b) Bacilli present on the surface (14,000× magnification); (c) Filamentous fungi present in the biofilm structure at 6000× magnification; (d) Front-side view of a diatom (3500× magnification).
Water 09 00263 g008
Table 1. Water quality parameters of the Sant Joan Despí DWTP sand-filtered surface water (SFSW) and groundwater, with comparisons to Spanish drinking water standards and the literature recommendations for ASR injection (NA: not analysed, NR: not regulated, NRF: no recommendations found) (*) Llobregat River mean value—no variation expected in SFSW. (**) Sampled before sand filters.
Parameter (Units)SFSWNative GroundwaterDrinking Water StandardsRecommendations for ASR Injection Water [Reference]
Turbidity (NTU)0.240.1311 [7], 0.2 [8]
MFI (s/L2)23.5NANR3–5 [5], 2 [8]
Colour (mg Pt/L)4.581.3815NRF
Conductivity (µS/cm)1279 (*)17532500NRF
Chloride (mg/L)229297250NRF
TOC (mg/L)3.61.275 [9], 10 [5,10]
AOC (µg acetate-C/L)0.31 [11] (**)NANR10 [12]
Calcium (mg/L)105164NRNRF
Magnesium (mg/L)26.748.1NRNRF
Sodium (mg/L)116173200NRF
Sulphate (mg/L)160 (*)244250NRF
Nitrate (mg/L)9.1 (*)10.350NRF
Ammonium (mg/L)1.11 (*)0.070.50.5 [6]
Total Iron (µg/L)10.196.4200NRF
Aluminium (µg/L)178.812.5200NRF
Nickel (µg/L)6.92.520NRF
Total manganese (µg/L)9.1611.7550NRF
Total phosphorus (µg/L)3210NRNRF
Total Trihalomethanes (µg/L)<2<2100NRF
E. coli (MPN/100 mL)1200010,000 [6]
Total coliforms (MPN/100 mL)7310.50NRF
Enterococcus (CFU/100 mL)200NRF
C. perfringens (CFU/100 mL)35.70.10NRF
Colony count at 22 °C (CFU/100 mL)402431100NRF
TOC: Total Organic Carbon; AOC: Assimilable Organic Carbon; MPN: Most probable Number; CFU: Colony Forming Units.

