Article

Evidence for Submarine Groundwater Discharge into the Black Sea—Investigation of Two Dissimilar Geographical Settings

1
UFZ—Helmholtz Centre for Environmental Research, Permoserstr. 15, 04318 Leipzig, Germany
2
UFZ—Helmholtz Centre for Environmental Research, Theodor-Lieser-Str. 4, 06120 Halle, Germany
3
GeoEcoMar; Dimitrie Onciul Street 23-25, Bucharest 030167, Romania
4
Ivane Javakhishvili Tbilisi State University; Department of Hydrogeophysic and Geothermic, Chavchavadze Ave. 1, Tbilisi 0179, Georgia
*
Author to whom correspondence should be addressed.
Water 2017, 9(7), 468; https://doi.org/10.3390/w9070468
Submission received: 5 May 2017 / Revised: 20 June 2017 / Accepted: 22 June 2017 / Published: 27 June 2017

Abstract

:
The sustainable management of coastal marine environments requires a comprehensive understanding of the processes related to material transport from land to coastal sea. Besides surface water discharge (e.g., rivers and storm drains), submarine groundwater discharge (SGD) plays a key role since it provides a major pathway for solute and particulate transport of contaminants and nutrients, both having considerable potential to cause deterioration of the overall ecological status of coastal environments. The aim of the presented study was the investigation of SGD in two exemplary and dissimilar areas at the Black Sea coast, one in the west (Romania) and one in the east (Georgia). The approach included the assessment of the geological/geographical setting regarding the potential of SGD occurrence, the use of environmental tracer data (222Rn, δ18O, δ2H, salinity), and the evaluation of sea surface temperature patterns near the coastline using satellite data. Besides the individual site specific results, the study revealed that a combined evaluation of tracer data and satellite based information allows SGD localization with satisfying precision. A downscaling approach starting with large scale satellite data is generally recommended, continuing with medium scale tracer patterns and ending with local spot sampling.

1. Introduction

Sustainable management of the coastal ocean requires a comprehensive understanding of the processes related to solute and particulate material transport from the terrestrial to the marine environment. Whereas river and sewage discharge into the sea are bound to distinct and generally easily accessible locations, which allows for straightforward quantification of the associated discharge rates and matter budgets, the investigation of material transport via submarine groundwater discharge (SGD) is more challenging. Adding to the general difficulties in localizing SGD in order to investigate the related processes is the spatial and temporal variability that is typical for SGD.
SGD provides a major pathway for solute and particulate transport across the groundwater/seawater interface. Nutrients and contaminants carried by discharging groundwater have considerable potential to cause deterioration of the overall ecological status of coastal marine environments. Related detrimental impacts include contamination and eutrophication of the coastal sea, contamination of seafood, disturbance of coastal marine ecosystems as well as harmful algal blooms.
The aim of the present study was the investigation of SGD in two exemplary and dissimilar areas at the Black Sea coast. So far, information on SGD occurrence in the Black Sea is scarce in the available literature. Related published information is rather general and vague [1]. The authors assume a SGD flux of about 16 km3 per year for the complete Black Sea basin locally equaling values between 3% and 30% of the respective river water runoff (with a total flux of about 325 km3 per year for the Black Sea basin). Furthermore, it is assumed that SGD is mainly occurring on the Crimean Peninsula and the Georgian coast. Still, no sources of the cited data, which seems to be based on extrapolating a limited number of results mainly from the Georgian coast, are given. This lack of traceable and reliable data and information triggered the presented SGD Black Sea project, which was set up as a pilot study. It was of further interest that the Black Sea shows a rather unusual geographical setting resulting in a minimal tidal range and a salinity that reaches only about half the level found in most other major marine environments. Since tidal pumping and salinity induced water layering is generally of major importance for the intensity of groundwater/seawater, the Black Sea takes an exceptional position in terms of SGD related processes.

2. Materials and Methods

2.1. Approach

The study aimed at evaluating the applicability of a set of state-of-the-art SGD investigation methods in two representative Black Sea environments. The chosen investigation approaches included (i) an assessment of the coastal hinterland regarding the potential occurrence of SGD along the shore; (ii) the collection and interpretation of environmental tracer data collected on site; and (iii) the evaluation of satellite based near coastline sea surface temperature (“SST”) patterns.
Tracers generally provide an appropriate tool for investigating SGD including its causing and resulting processes. They can either be artificially injected into the coastal aquifer or are ubiquitously present in natural waters. The latter so called environmental tracers are defined as natural or anthropogenic substances that originate from defined sources. In contrast to injected tracers, the use of environmental tracers has the general advantage of not contaminating the study area by introducing chemicals into the environment that may be persistent. In addition, due to their geogenic omnipresence, they are most suitable for large-scale and/or long-term studies.
In the Black Sea study, the naturally occurring radionuclide 222Rn (half-life t1/2 = 3.82 days; hereafter referred to as “radon”) was measured as an environmental tracer. Radon has the advantage of being a radioactive noble gas, i.e., a (short-lived) radionuclide that is chemically inert and easily detectable immediately on site using mobile equipment. Since radon is produced in every mineral matrix and since it is fairly soluble in water, it occurs ubiquitously in groundwater. Due to the lack of radon producing particles in open water bodies (lakes, rivers and the ocean), radon concentrations that are usually found in the coastal sea are about three to four orders of magnitude lower than in groundwater. The resulting distinct radon concentration gradient at the groundwater/seawater interface allows the use of the radon distribution pattern in the coastal sea for localizing areas that are influenced by SGD and for roughly estimating the related groundwater fluxes [2,3,4,5].
In the study, the radon distribution patterns that were recorded in the coastal sea were backed by salinity data that were recorded simultaneously. Even though the surface water of the Black Sea reaches a salinity of only about 17 (i.e., half of the salinity of the major oceans), the gradient between groundwater and seawater is still distinct enough to use plumes of low salinities in coastal waters as an SGD indicator.
In addition to radon and salinity, the water stable isotope ratios 18O/16O and 2H/1H were used as environmental tracers in the study. Natural isotope fractionation processes in the hydrological cycle result, in general, in isotopically heavier δ18O and δ2H notations in surface waters compared to groundwater [6,7]. Groundwater mainly reflects the weighted mean isotopic composition of the precipitation that contributes to groundwater recharge in the area. Thus, stable isotopes represent a hydrological tracer that allows the recognition of mixing processes between meteoric groundwater and evaporation affected surface water bodies such as the coastal sea. Resulting data allows a determination of the mixing ratios between groundwater and the coastal sea [8,9].
Besides the environmental tracer data mentioned above, a conceptual and completely independent approach was used for cross-checking the tracer based results and for validating the SGD locations as revealed by the tracer data analysis. This approach included analyzing the near coastal hinterland morphology and linked hydrogeological characteristics in order to geographically outline potential water accumulation areas immediately adjacent to the coastline. This approach is principally based on the geometric lineament analysis of available digital elevation models (DEM) originating from satellite radar missions, for example. Here, a gridded post-processed data product of NASA’s Shuttle Radar Topography Mission (SRTM) was used which is covering the area of interest at a spatial resolution of 90 m × 90 m. The gridded DEM represents the terrain surface of the focused model domain by a set of geodetic information in the form of regularly spaced grid cells. The terrain surface is evaluated for its surficial drainage characteristics by applying a D8 algorithm for grid cell based flow direction calculations [10]. The creation of an intended hierarchical flow accumulation network involves individual cell based statistics on slope and direction information derived from the spatial analysis of surrounding neighbor cells. These statistics or linear indices are collected over the entire DEM domain by applying a 3 × 3 moving window kernel. Resulting matrices are used to rank all analyzed grid cells hierarchically which subsequently allow for outlining surficial flow accumulation pathways as structural lineaments along the model area’s terrain surface. These lineaments thus indicate potential freshwater accumulation areas which are most likely interlinked to geological features that are related to e.g., structural bedding, tectonic faults, fracture zones, transitions or contacts of individual hydrogeological units or even distinct contrasts of hydraulic conductivity and are providing potential but preferential pathways for terrestrial freshwater flow (e.g., [11,12]). In case identified lineaments are intersecting studied coastal sections, the applied concept allows the assumption of an increased probability of seaward freshwater outflow and is therefore indicating locations of potential SGD occurrence.
The satellite data based approach further included the use of freely available thermal satellite images (band 6.2 of Landsat Enhanced Thematic Mapper ETM+; thermal infrared range 10.4 µm–12.5 µm, 60 m resolution) of the coastal ocean for SGD indication. Sea surface temperature (SST) patterns conceptually allow for the indication of groundwater discharge into the coastal sea based on the assumption that discharging groundwater has a relatively constant temperature compared to that of the coastal sea, which fluctuates seasonally and in the short term [13,14]. Hence, areas with a small SST standard variation potentially indicate a continuous and steady SGD influence that stabilizes the water temperature at the discharge location.

2.2. Site Setting

Two dissimilar coastal areas were chosen as exemplary Black Sea pilot study areas. One area was located on the western Black Sea coast (Romania) south of the city of Constanta. The other area was located on the north-eastern Black Sea coastline (Georgia) north of the city of Batumi (Adjara region) (Figure 1). The two chosen areas are representative of a flat and a mountainous coastal hinterland, respectively. Apart from this, both areas show exposure to anthropogenic pressure. Urbanization, agricultural activities and industrial development pose potential risks for the local groundwater quality that may be translated through SGD into the connected coastal ocean.
The western study area (Romania) covers about 40 km of coastline between Constanta and Mangalia. From a general geological perspective, this coastal stretch of the Western Black Sea Basin (WBSB) is mainly represented by Neogene (Upper Middle Miocene) and Quaternary units. Along most parts, a coastal cliff rises about 21 m over sea-level. The hinterland is flat and dominated by agriculture. The upper part of the cliff is made of loessoide deposits about 8 m in thickness with vertical walls. Below, a gentler slope, corresponding to red clays, is followed by another vertical section of limestone that continues seaward as submarine bench. At the foot of the cliff, a narrow sandy, and pebbly beach is developed. The groundwater level appears at about 13 m above sea level at the base of the loessoide deposits. The basement of the study area is formed by strata of the Moesian platform and is represented by Jurassic and Cretaceous units that overlap Palaeozoic crystalline and metamorphic bedrocks. Due to the WBSB’s rifting nature, the basement is characterized by extensional faults and vertically displaced blocks indicating these extensive rifting processes. At least three major NW-SE striking faults zones are cutting the coastline between Constanta and Mangalia and are potentially relevant for local SGD occurrence [14,15,16] (cf. Figure 5).
The eastern study area (Georgia) covers a coastal section in the Adjara region that geologically belongs to the Eastern Black Sea Basin. The section extends over 27 km starting north of the town of Kobuleti and ending at the coastal cliffs north of Batumi. The area is characterized by a narrow band of Quaternary sediments and the adjacent eastern foothills of the Meskheti mountain range, which is mainly represented by volcanic rocks of Eocene age rising up to over 1000 m above sea level and continuing submarine to the west as a volcanic fissure system.

2.3. On-Site Activities

For achieving the data required for the intended pilot SGD assessment in the two chosen areas, three sampling campaigns were carried out: two in the west (Romania) in May and September 2012, and one in the east (Georgia) in October 2012.
In each of the two areas, groundwater samples that were representative of the coastal aquifer were taken for the purpose of defining terrestrial tracer end-members. In both areas, reliable groundwater monitoring wells, i.e., wells with known depth and filter screen positions, were rather scarce. While terrestrial stable isotope and salinity end-members can be retrieved from spring or seepage samples, radon sampling necessitates the availability of at least 200 mL of fresh groundwater that can be taken without the risk of degassing. This was difficult at both of the two study areas. However, if a sampling site appeared suitable, the radon concentrations were detected by applying the radon monitor AlphaGuardTM (Saphymo, Frankfurt, Germany) [17].
For mapping radon distribution patterns in the coastal sea, including off-shore end-members, the monitor RAD7 (Durridge, Billerica, MA, USA) was used. Due to the low radon concentrations in seawater, two RAD7s were run synchronically in order to allow adequate statistical data reliability. The detectors were running with a 10 min counting cycle at a cruising speed of about 4 km/h resulting in about 660 m of coastline covered by each radon data point. Salinities in the coastal sea were recorded simultaneously to radon using a conductivity-temperature-depth “CTD” probe and logger (YSI, Yellow Springs, OH, USA). The water salinity in the groundwater samples was measured using a portable conductivity meter (WTW, Weilheim, Germany). Both radon and salinity was detected in a water depth of about 1 m.
Discrete water samples were taken for stable isotopes both from the coastal sea and from groundwater. The samples were filtered on site (0.45 µm mesh size), shipped to Germany and measured at the UFZ Helmholtz Centre for Environmental Research by means of Cavity Ring-Down Spectroscopy (Picarro, Santa Clara, CA, USA). All samples were referenced against Vienna Standard Mean Ocean Water (V-SMOW).

3. Results and Discussion

3.1. Western Study Area

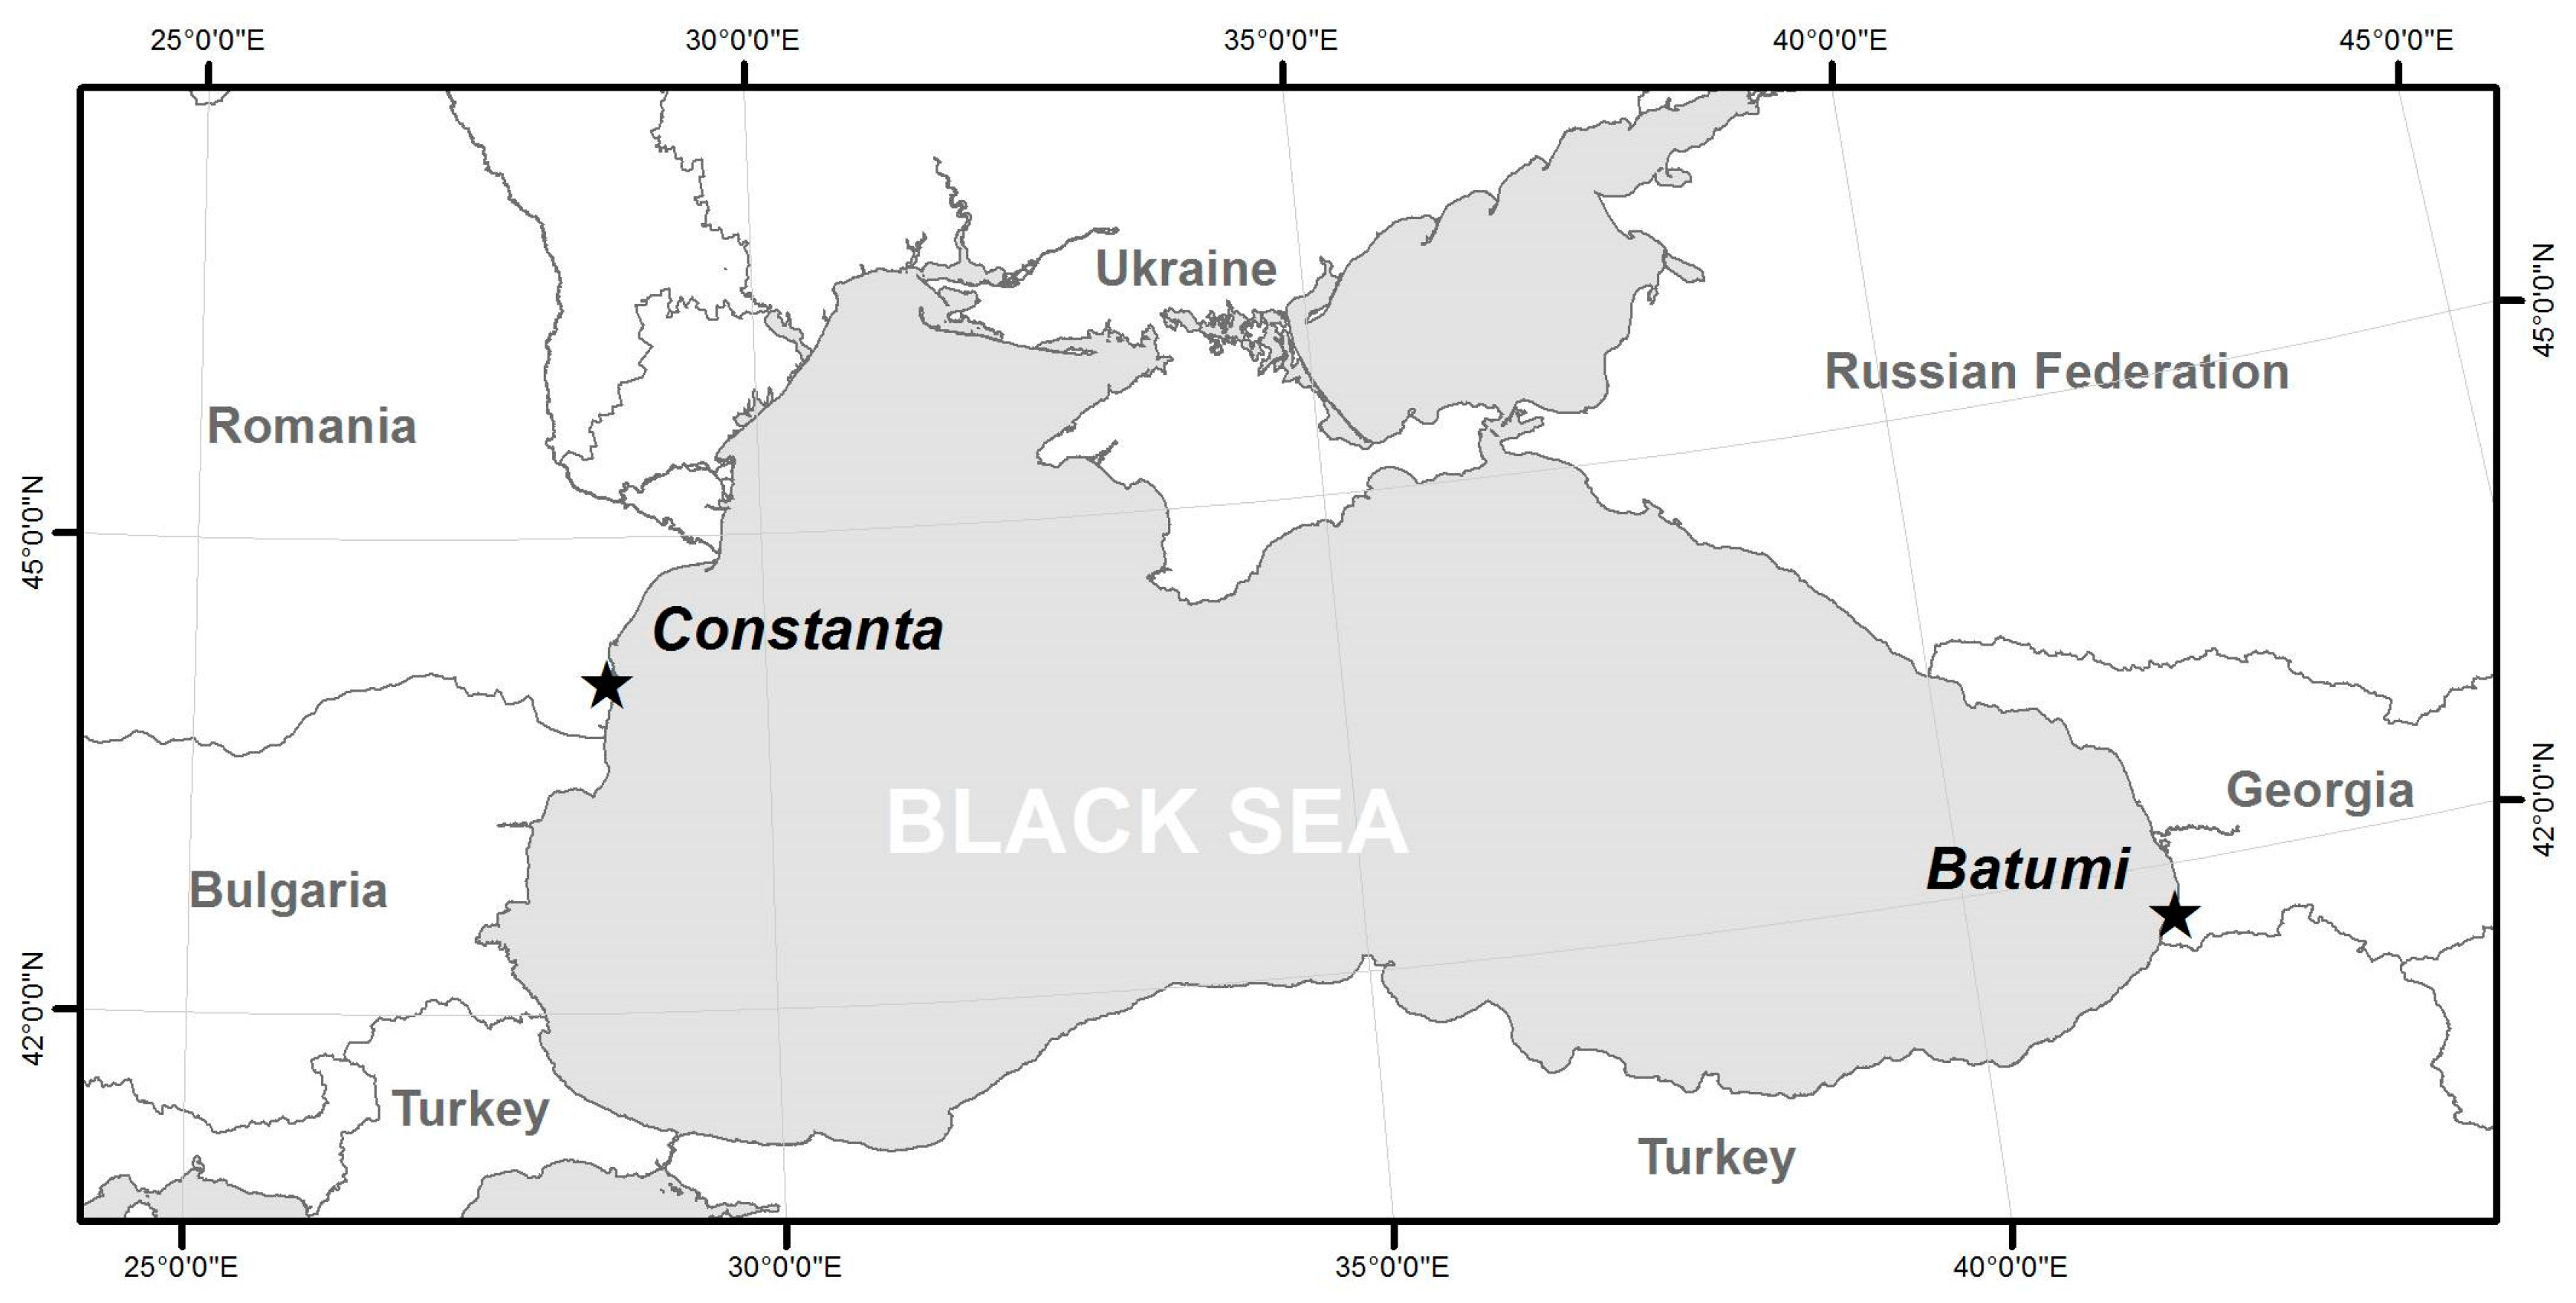
The sampling cruise carried out in May 2012 along the Romanian shore covered about 40 km of coastline between the southern end of the Constanta harbor structures and the southern outskirts of Mangalia (Figure 2). During the campaign, the whole section was surveyed for both radon and salinity.
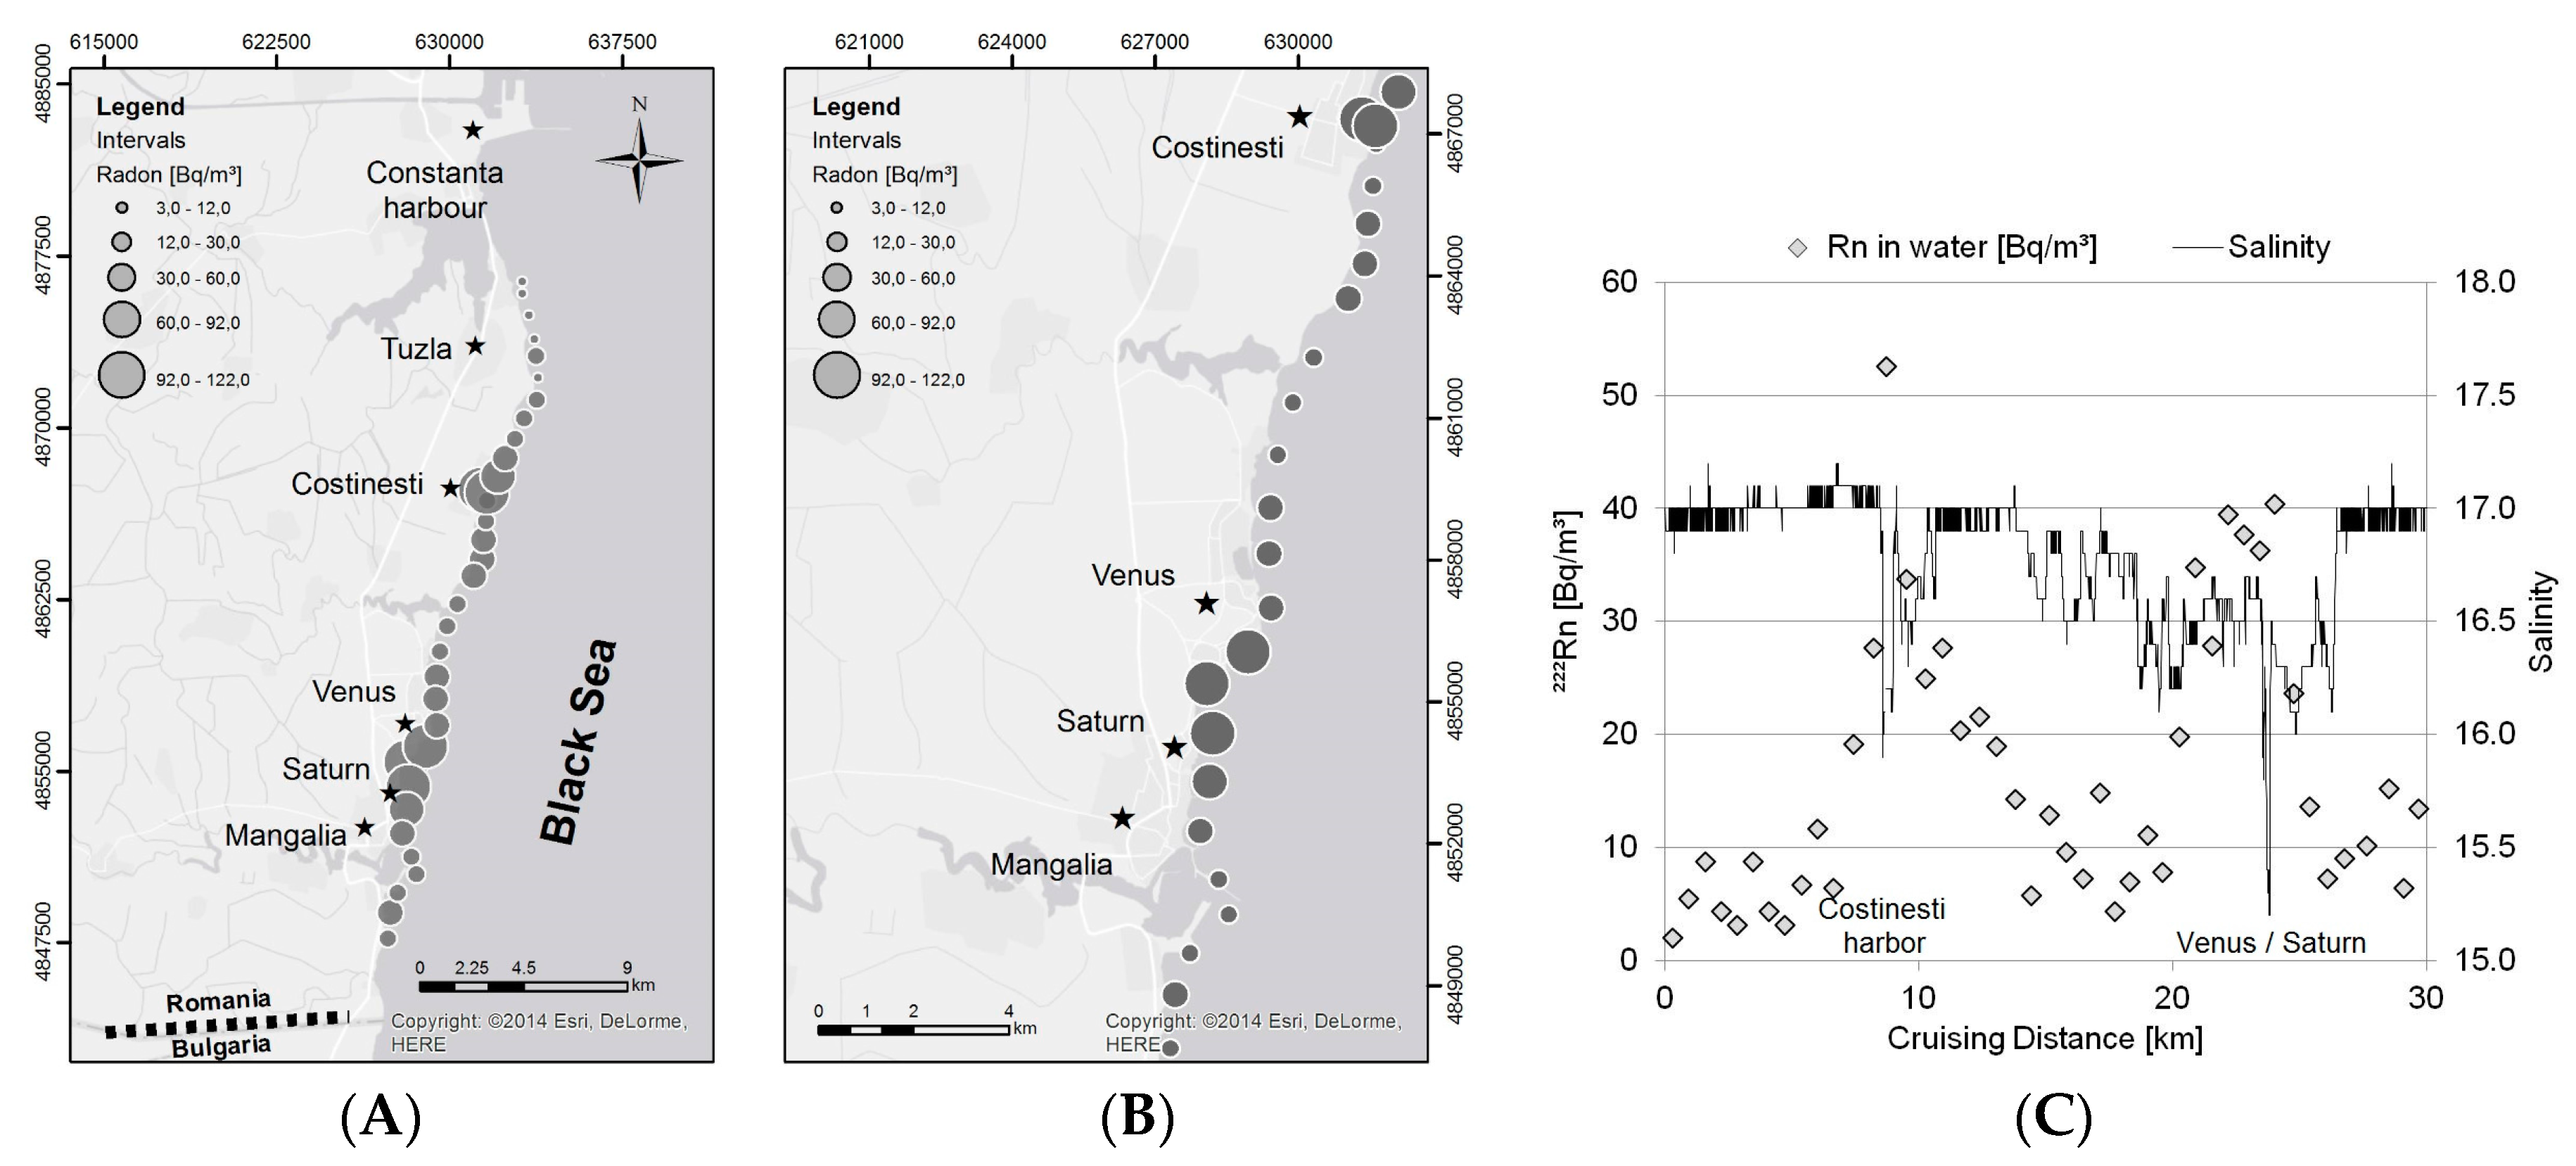
The offshore radon end-member (4 km off the coast) was detected to be 5 Bq/m3. However, no reliable terrestrial radon end-member could be determined since no groundwater monitoring wells were available close to the coastline. The springs and open water holes that were used for terrestrial end-member definition regarding salinity and stable isotopes were not appropriate for radon measurement due to the high likelihood of radon degassing.
Along the 40 km coastal profile, the radon concentration stayed for most parts around 10 Bq/m3, i.e., slightly elevated in relation to the offshore end-member, thus indicating radon diffusion from the sediment pore water into the coastal sea. Still, at two sites, the data revealed significantly elevated radon concentrations of up to 110 Bq/m3. These two radon “hot spots” were detected in the area around Costinesti harbor and on the sandy bay between the beach settlements Venus and Saturn north of Mangalia. Besides these two distinct radon anomalies, a third area with elevated radon concentrations was found south of Mangalia. However, at this spot the detected concentration was only slightly elevated compared to the coastal average and supported by only one data point (Figure 2).
Since the water depth below the boat was kept constant at about 4 m during the cruise, no dilution effect had to be taken into account for radon data evaluation. Radon evasion from the sea surface to the atmosphere was taken into account by measuring atmospheric radon and using wind speed data provided by a local weather station [18]. The corrected radon data is illustrated in Figure 2A and in more detail for Costinesti harbor and for the beach between Venus and Saturn in Figure 2B. From the data, it was concluded that the two areas (Costinesti harbor and Venus/Saturn) are significantly influenced by SGD; a potential indication for SGD was present south of Mangalia.
The interpretation of the radon data was supported by the simultaneously recorded salinities. The offshore end-member for salinity was found to be 17.0. While background salinities of 16.5–17.0 were detected along most parts of the coastal profile, the values dropped locally at Costinesti harbor to 15.9 and on the beach between Venus and Saturn to 15.2 (Figure 2C). The data show that salinity is generally suitable for supporting radon data interpretation. At the same time, it becomes obvious that salinity can hardly stand alone as a SGD indicator because the indication is not distinct enough.
Even though both radon and salinity clearly indicate two SGD hot spots, it is obvious that the radon pattern at Costinesti harbor is spatially limited compared to the Venus/Saturn peak. In order to verify the Costinesti anomaly by at least two radon data points, the cruising speed had been reduced to 2 km/h close to the harbor mouth. Still, the radon maximum shows sharp gradients towards the neighboring sampling locations, indicating a location of rather focused SGD close to the harbor structures. Considering comparable findings [19,20], the data suggests an anthropogenic impact on the coastal aquifer as a possible reason for the indicated locally increased SGD rate. It can be assumed that a perturbation of the local calcareous aquifer by the pilings of the harbor construction results in preferential flow paths, thereby producing a comparatively high groundwater seepage rate locally.
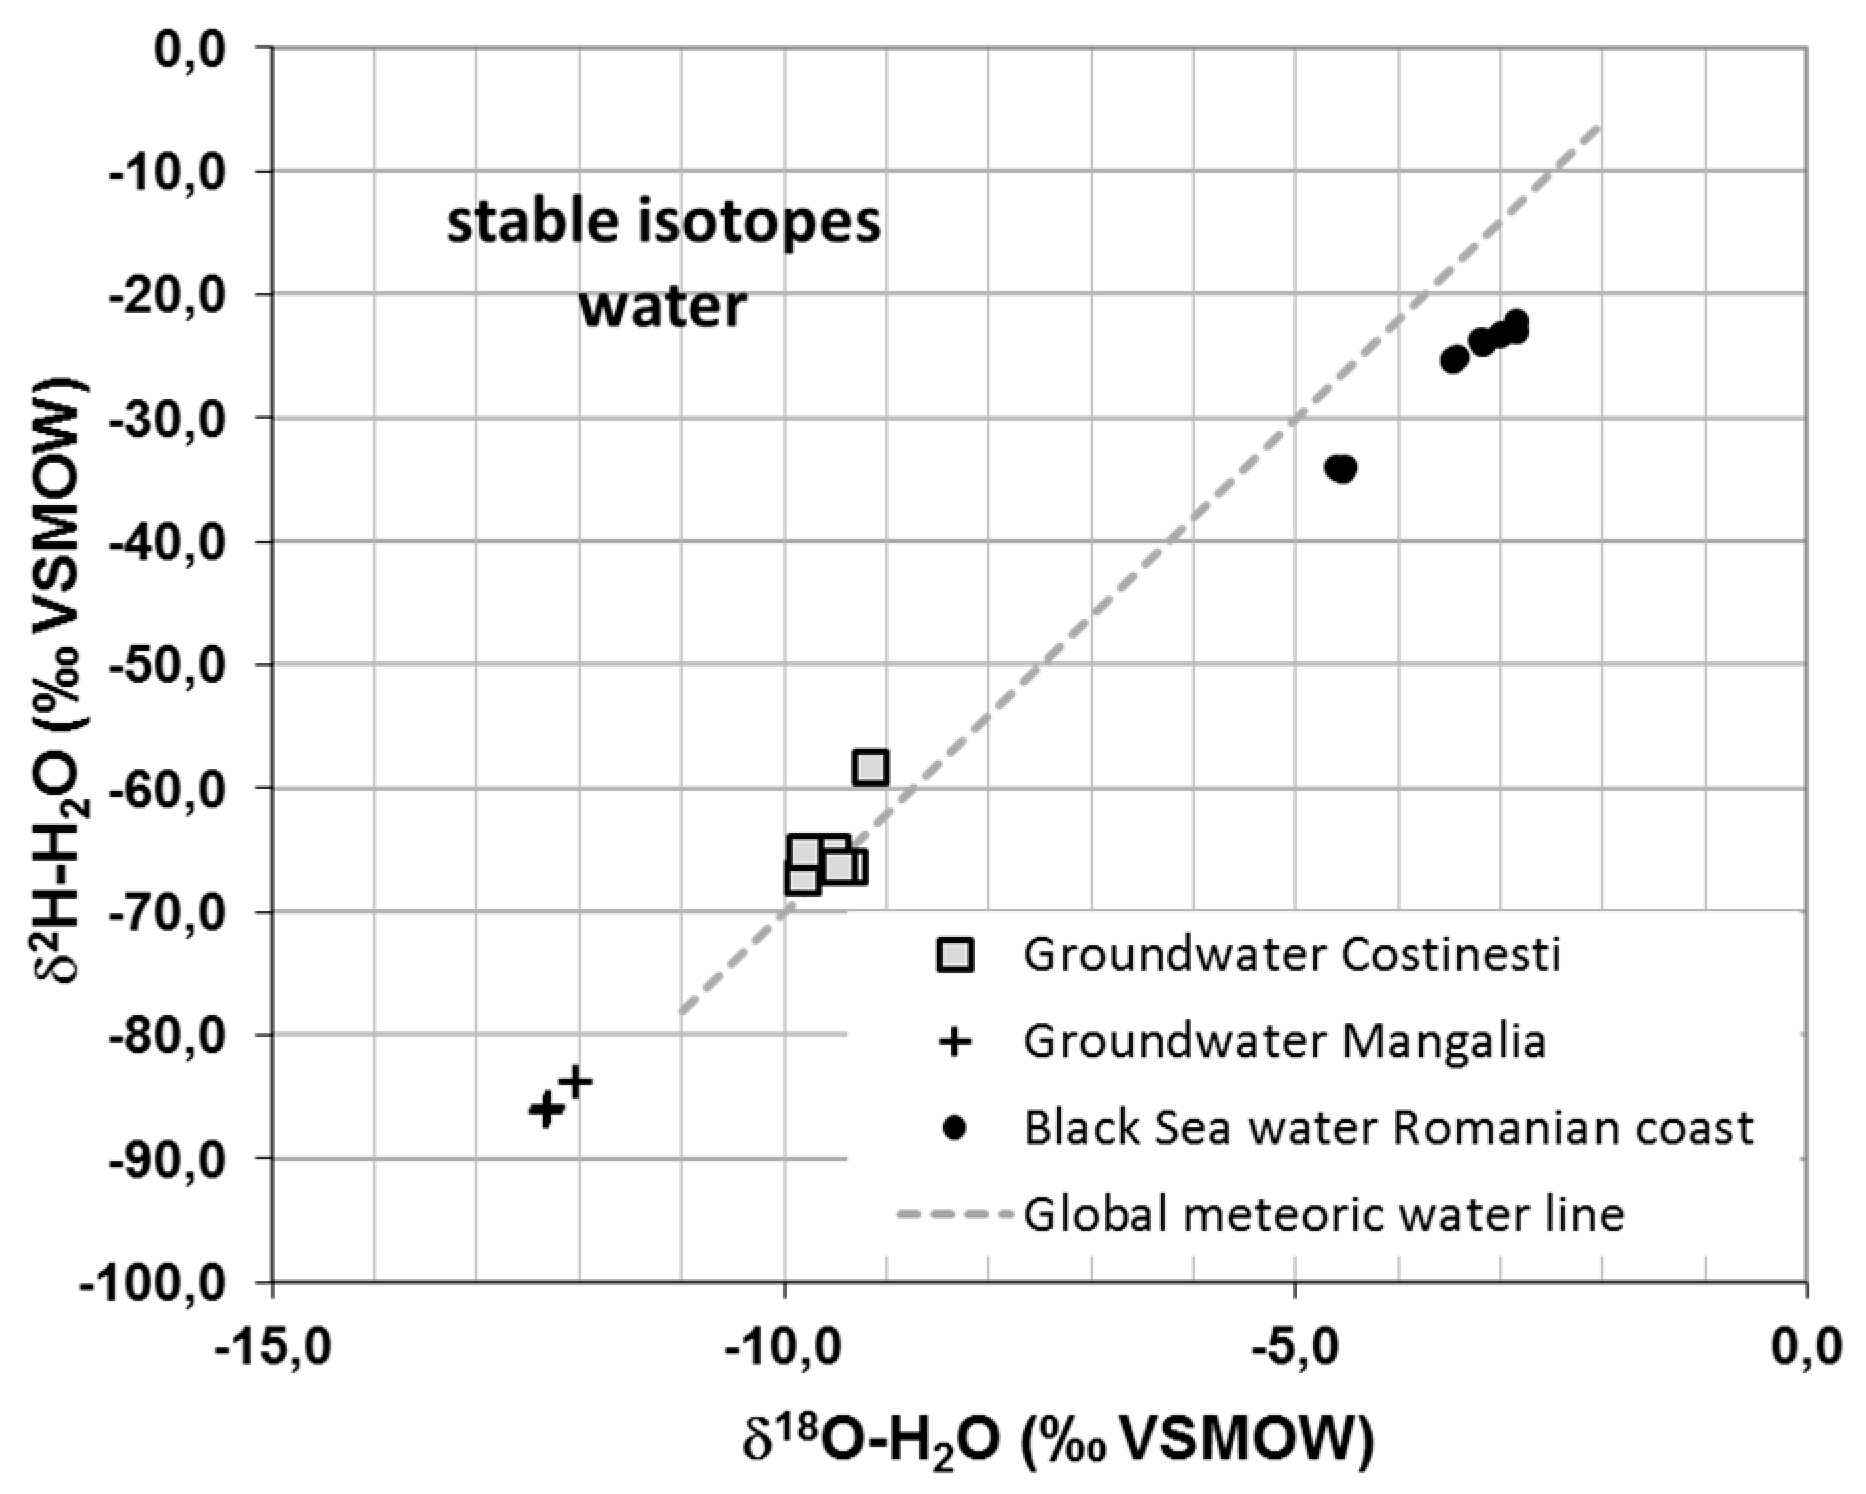
The Venus/Saturn peak, on the other hand, is not a man-made phenomenon but of geological origin. The beach is known for its hot spring, which indicates good hydraulic connection to a deep aquifer domain. This hydrogeological structure results in an elevated SGD rate. The assumption is supported by chemistry data of the groundwater sampled there. If the hot spring water parameters are compared to water taken from the sampling locations near Costinesti that are fed by the shallow aquifer, the differences become obvious (Table 1). Furthermore, the stable isotope data indicate a different aquifer domain for the water from the hot spring (Figure 3). A radon end-member could not be determined at the hot spring due to the high temperature of the water and the associated difficulties related to sample handling (degassing).
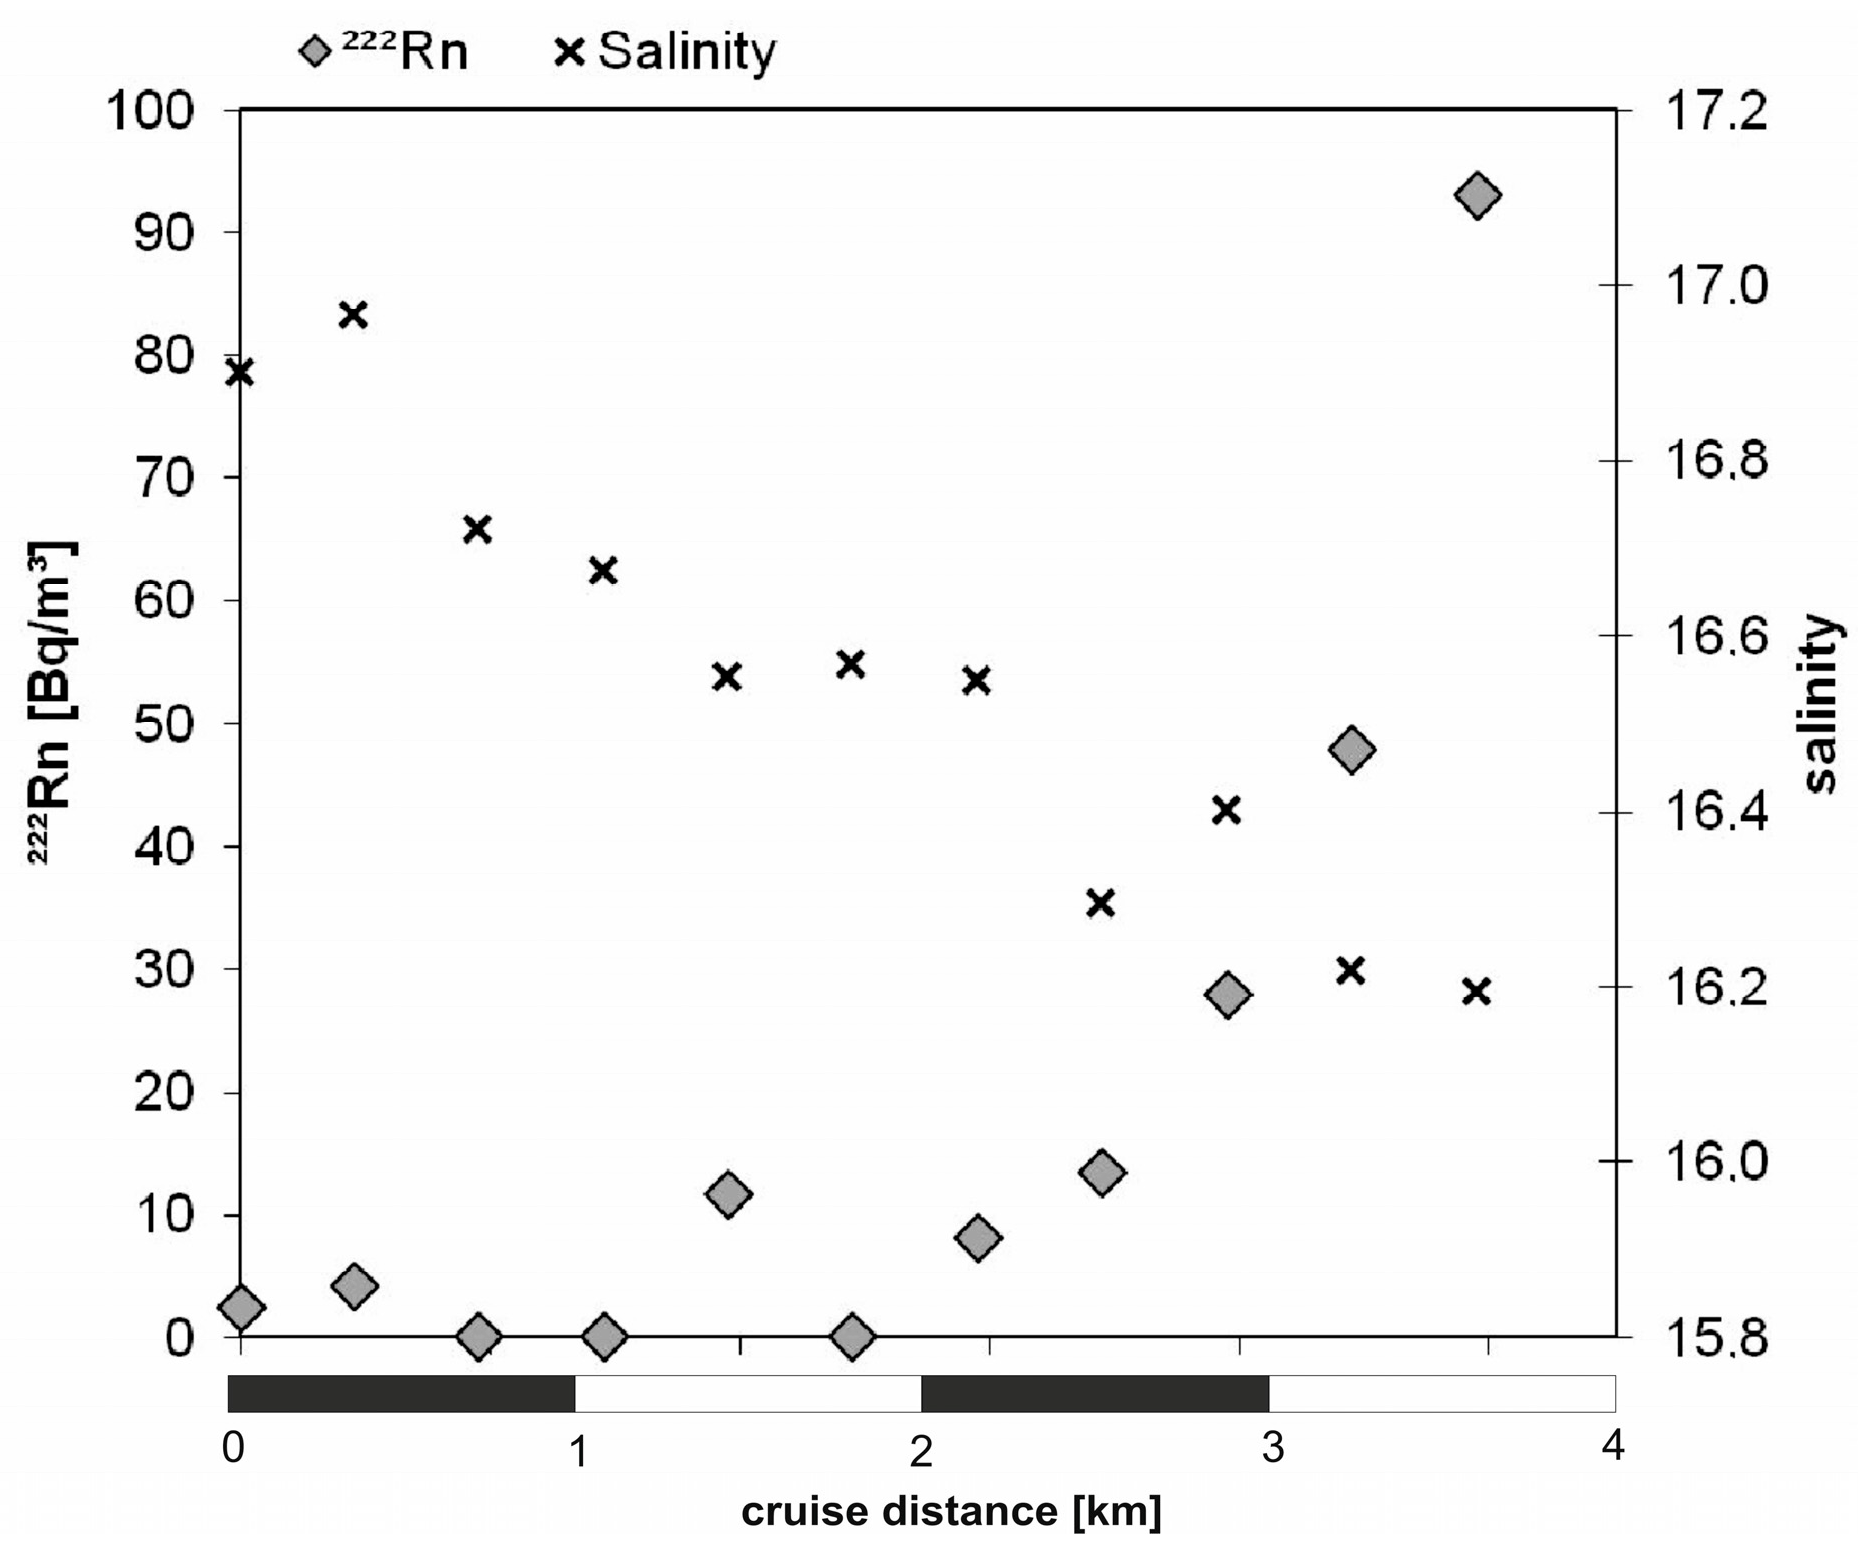
In order to validate the findings, an additional radon cruise was executed in September 2012. The survey focused on the SGD prone stretch of coastline north of Mangalia between the beach settlements of Venus and Saturn. The May results could be confirmed with the September data. The coastal profile between Mangalia in the south and Venus in the north showed again highest concentrations of up to 120 Bq/m3 at the Venus/Saturn beach. Additionally to the coastal cruise, a profile perpendicular to the coast starting 4 km offshore and ending at the Venus/Saturn beach was measured during the September campaign. Along the profile, the offshore radon concentration ranged below 5 Bq/m3 and started to rise gradually about 2 km off the beach, reaching its highest value of nearly 100 Bq/m3 close to the beach. Along the same profile, salinities dropped from about 16.9 offshore to 16.2, thus also indicating SGD influence (Figure 4).
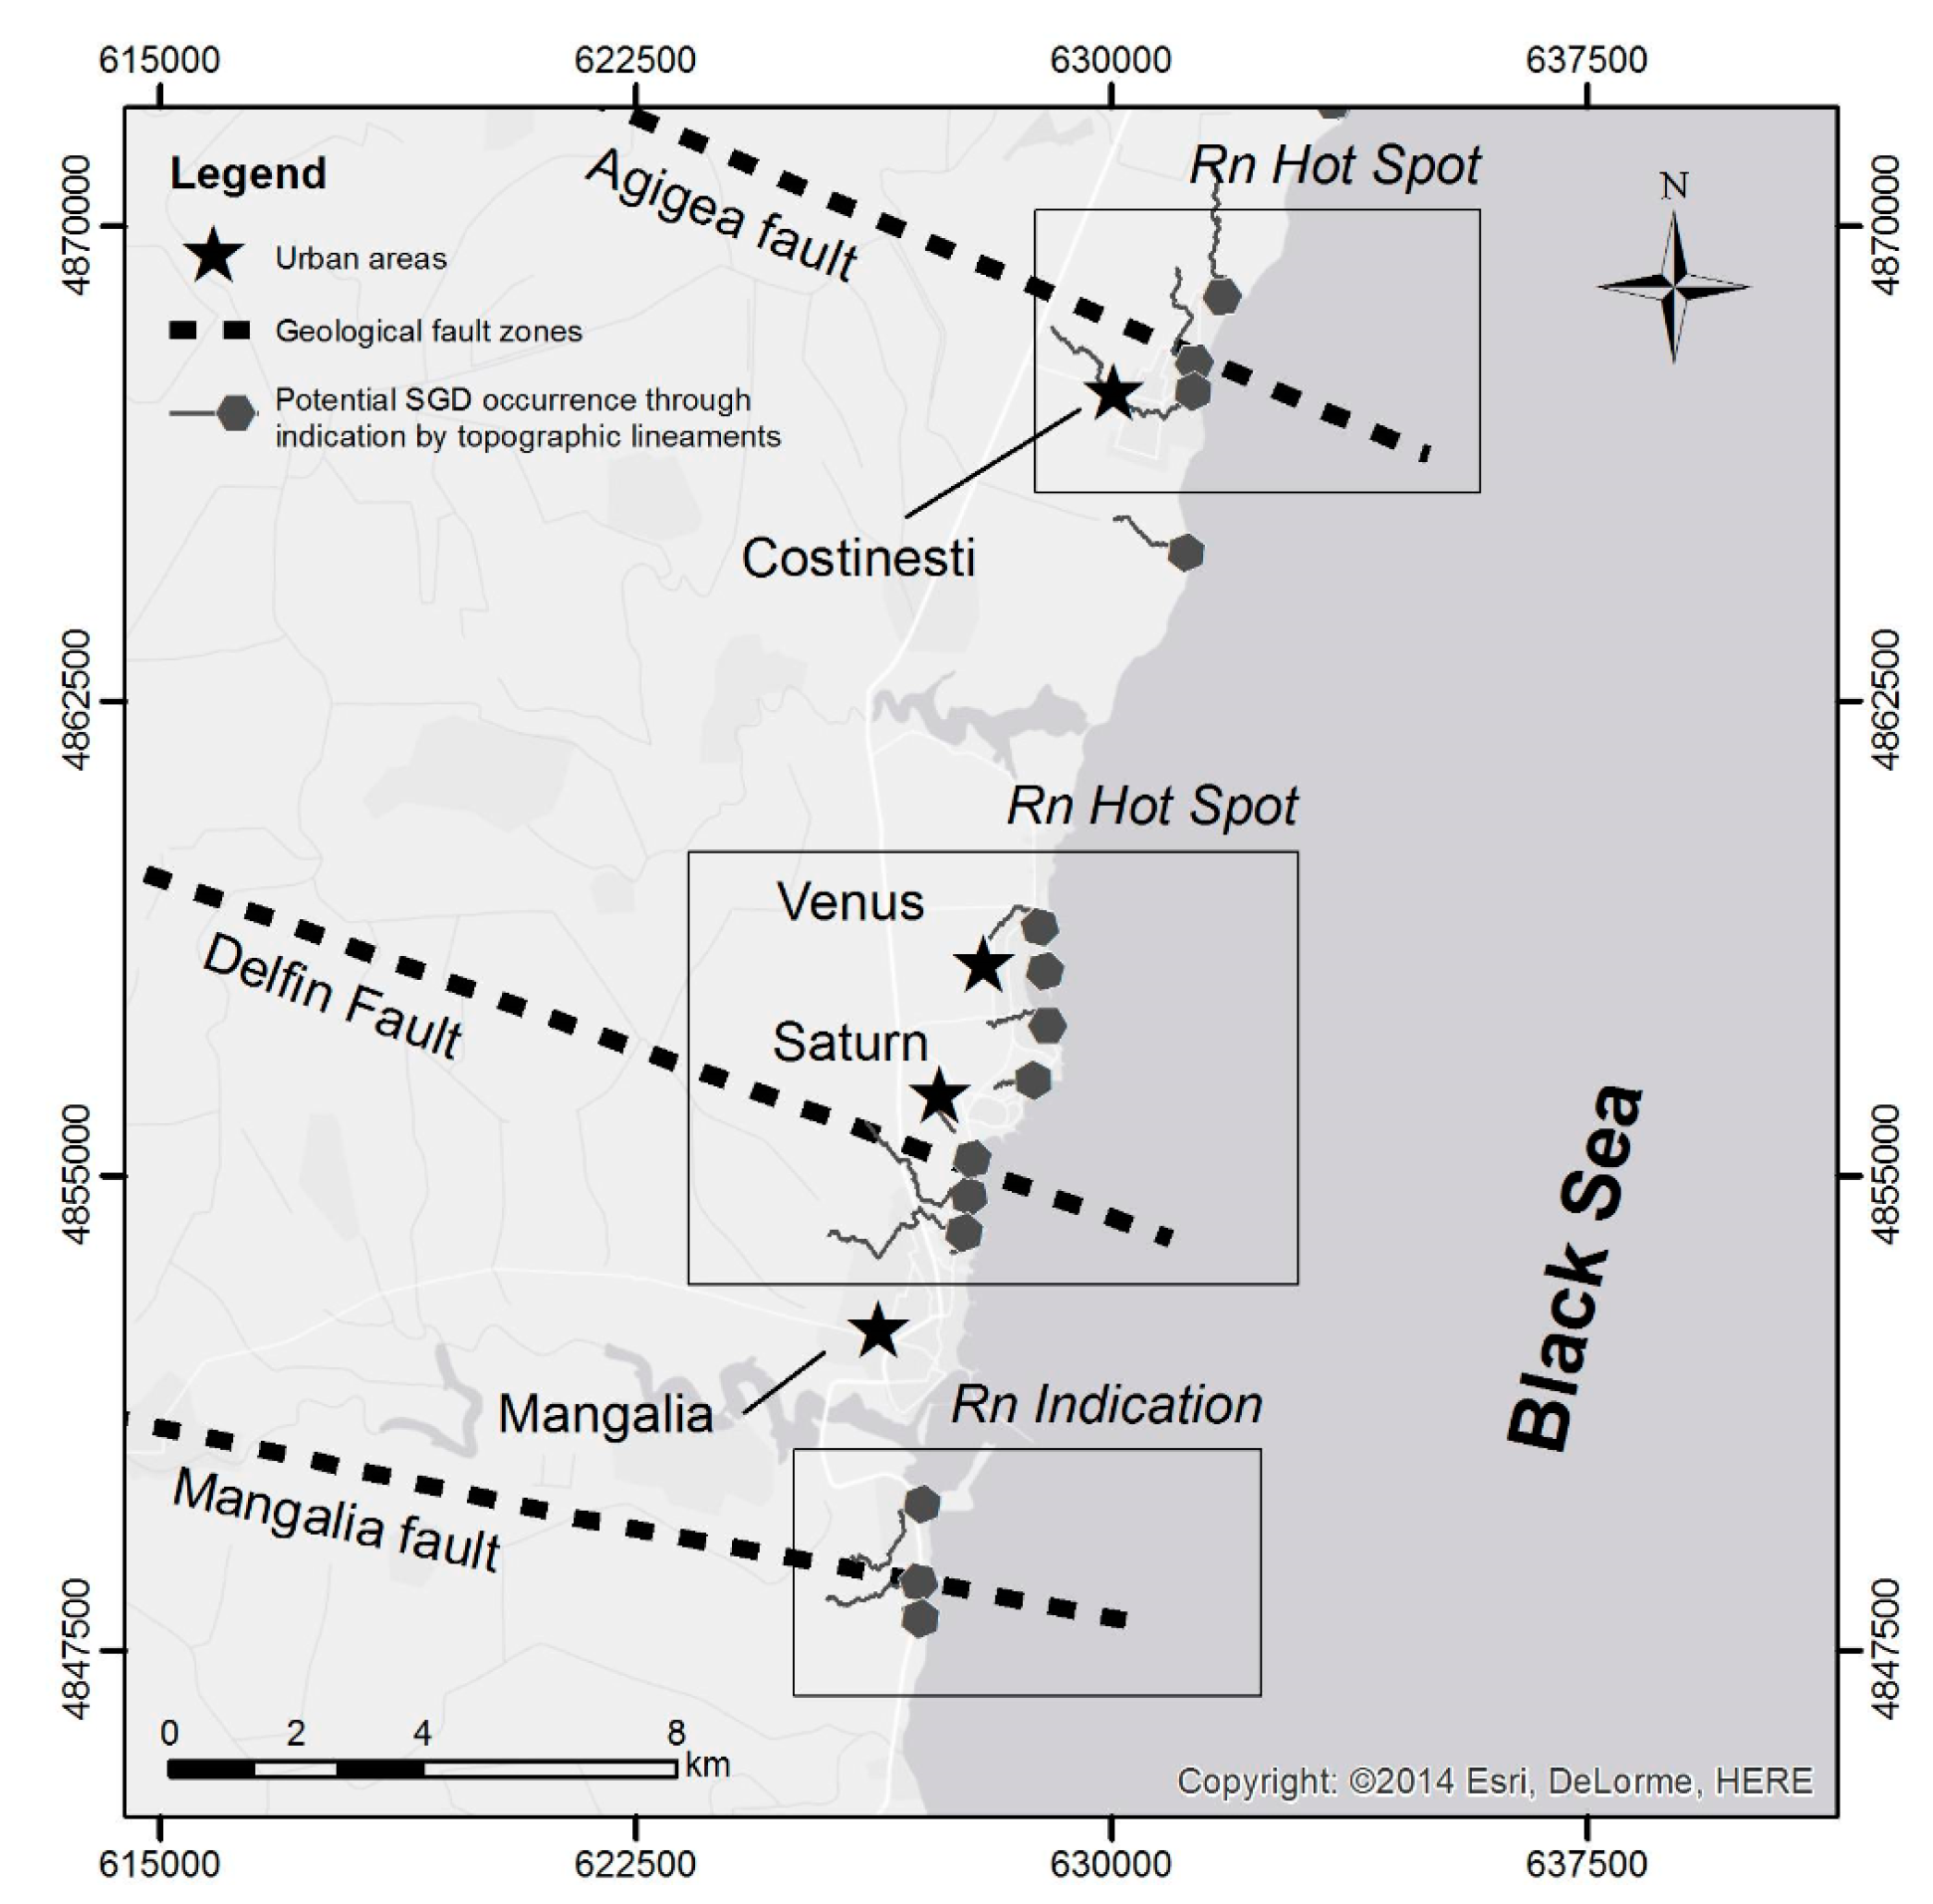
The conclusions drawn for the coastline from the radon and salinity results were evaluated based on satellite data that covered a wider area both inland and seaward. Figure 5 shows three major geological fault zones and a number of smaller morpho-structural lineaments that were derived from a geometric topography analysis using regional digital elevation models. Even though the agriculture dominated wider hinterland of the investigated coastal area is rather flat with an average elevation of ca. 50 m above sea level and a 21 m coastal cliff, the modeled lineaments indicate zones of preferential water accumulation. A group of water accumulation lines and one of the major fault zones (“Agigea Fault”) intersect with the shoreline in the vicinity of Costinesti harbor indicating an elevated probability of SGD within this area. As discussed above, SGD at this spot is most probably bound to a manmade perturbation of the local aquifer resulting in preferential groundwater flow paths. Still, water accumulation and preferential coast bound flow patterns in the connected hinterland add to the hydraulic pressure that triggers the local SGD hot spot. Another cluster of water accumulation lines and another major fault zone (“Delfin Fault”) intersect the coastline between Venus and Saturn and south of Saturn. As supported by the chemistry and stable isotope data discussed above, the hot spring present in this area is most likely linked to the fault zone. This indicates that the Venus/Saturn SGD hot spot is not preferentially supported by the inland hydraulic head of the upper aquifer (and hence not necessarily indicated by the associated water accumulation lines) but presumably originating from a deeper aquifer domain with a flow and pressure pattern completely independent from the local surface geography and upper hydraulic head distribution. A third fault system (“Mangalia Fault”) and a cluster of related water accumulation lines intersect the coastline south of Mangalia within the area that shows minor SGD signals as indicated by the radon distribution pattern.
In contrast to the satellite based geometric lineament analysis, the assessment of sea surface temperature distribution patterns in the coastal sea showed no results that were in line with the tracer based results. Costinesti harbor and the Venus/Saturn beach show normal SST ranges, thereby not indicating substantial SGD volumes. It can be concluded that the SST approach is not suitable for the western Black Sea target area since the SGD rates are not high enough to influence the SST pattern significantly.

3.2. Eastern Study Area

Three general SGD prone areas exist along the Georgian coastline [1]: (i) the slope of the Greater Caucasus in the north-west essentially with focused SGD from karst systems; (ii) the central lowlands (Kolkheti region) mainly with diffuse SGD from alluvial deposits; and (iii) the south-eastern mountainous Adjara region preferentially with focused SGD from volcanic fissure systems discharging groundwater both close to the coast and deep offshore. The eastern project study area is located within the Adjara region. For this region [1] expected SGD fluxes up to about 30% of the regional river water runoff, however, without stating any literature references, which makes it hard to evaluate these estimates.
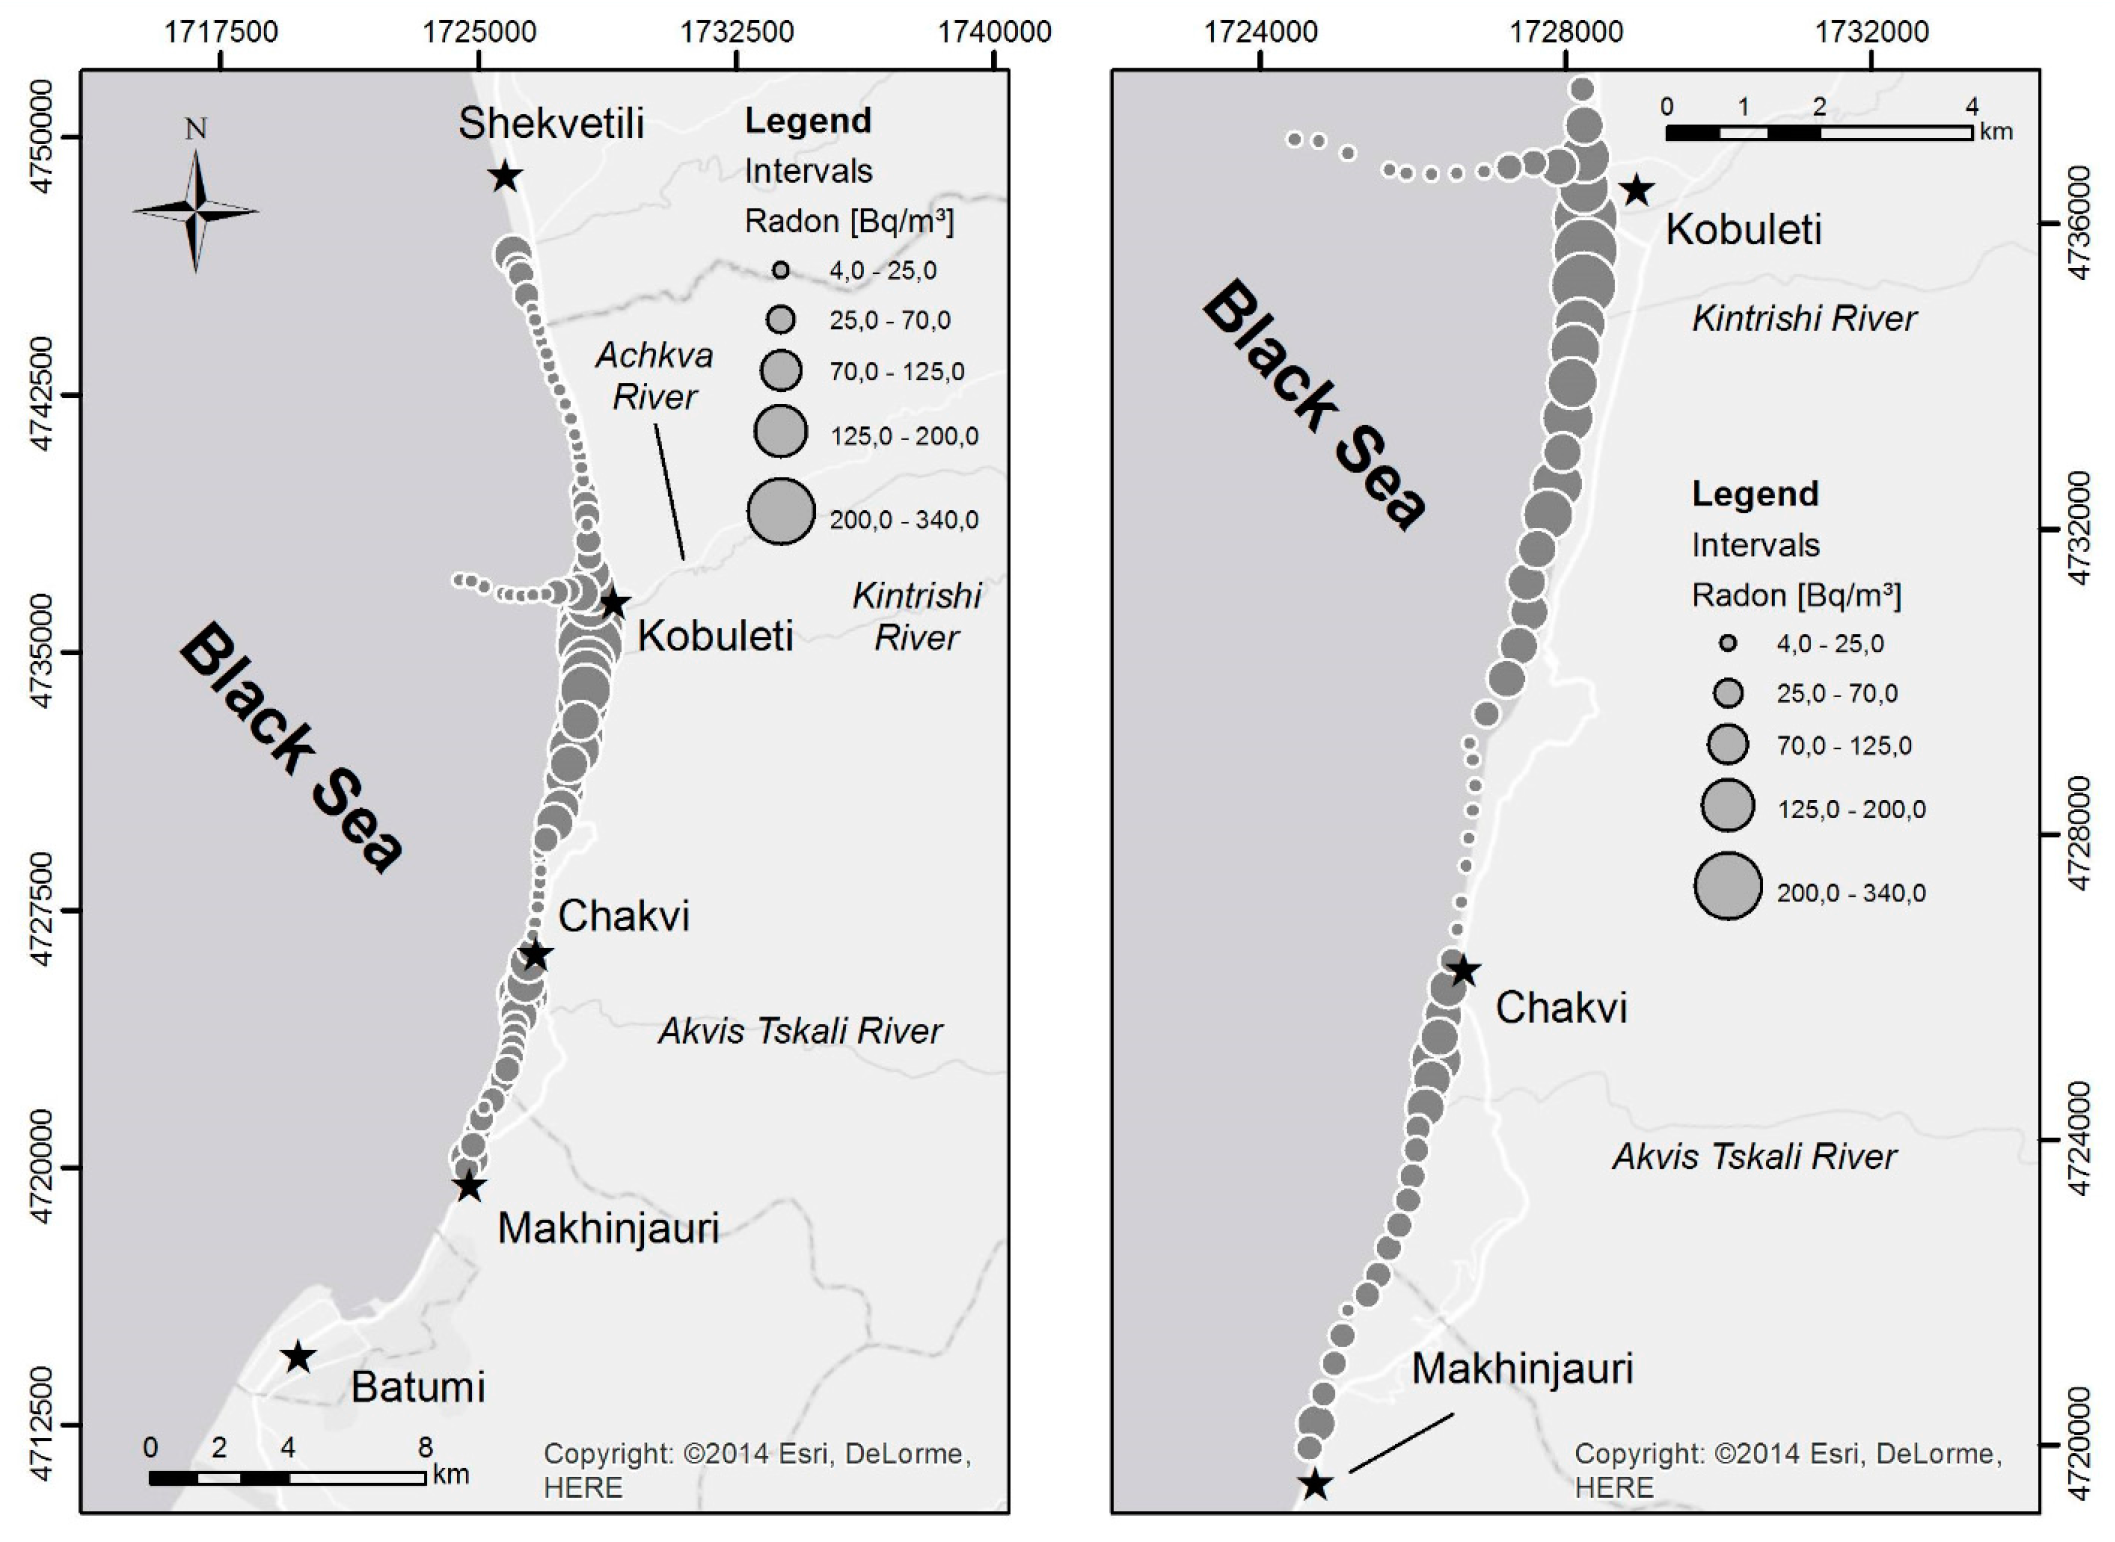
The sampling campaign that was carried out in the Adjara region as part of the presented Black Sea study took place in October 2012 and covered 27 km of coastline starting 10 km north of Kobuleti (Natanebi River mouth) and ending about 3 km north of Batumi bay. The whole coastal section was surveyed for radon and salinity. Offshore end-members for all applied tracers (222Rn, salinity, δ18O, δ2H) were measured 4 km offshore. The measurements revealed radon and salinity end-members of 4 Bq/m3 and 17.5, respectively (for stable water isotope end-members see below). Terrestrial end-members were taken at springs, rivers and accessible wells. While all terrestrial sampling locations were suitable for the determination of stable isotopes and salinity, the resulting radon data is not satisfactorily reliable. The latter is due to the lack of trustworthy groundwater monitoring wells in the closer vicinity of the coast.
The background radon concentrations along the 27 km coastal profile stayed mainly below 25 Bq/m3. In comparison to the offshore end-member, this value indicates minor diffuse SGD all along the profile, which can be attributed to the rather steep hydraulical gradient in the hinterland. In addition, two distinct areas with significantly elevated radon concentrations were mapped. The first area started at the northern city limits of Kobuleti and continued along the town beach and south of it for about 7 km; the second area was detected in the south of the surveyed stretch of coastline about 10 km north of Batumi bay close to the mouth of the Chakvi River (Figure 6).
In the northern SGD zone, the highest radon concentrations of about 340 Bq/m3 were recorded in the middle of the Kobuleti beach section. This section is characterized by major concrete pilings designed for stabilizing the beach and the immediately adjacent urban structures. As had been assumed for Costinesti harbor, the concrete pilings might have caused major disturbances of the natural structure of the shallow aquifer resulting in preferential groundwater flow paths thus triggering elevated SGD rates in the vicinity of the pilings. As mentioned above (and in contrast to Costinesti harbor), the Kobuleti hinterland shows noteworthy relief with elevations up to 300 m and hence a substantial hydraulic gradient. A distinct topographic lineament correlating with the Kintrishi River catchment and indicating water accumulation was identified in the area. The lineament intersects with the coastline at the Kobuleti beach potentially triggering SGD in this area (cf. Figure 8). Furthermore, a major hydrogeological contact between Middle Eocene volcanic rocks (basalts) of the Arsiani range in the southeast and unconsolidated Quaternary molasse in the northwest supports SGD in the Kobuleti area. The basaltic bedrock is outcropping southeast of Kobuleti and acts as a hydrogeological barrier that forces the groundwater to discharge into the sea in the Kobuleti region. These findings are comparable to a situation discussed for the region of Gordon’s Bay, False Bay, South Africa [21].
In the southern SGD zone radon concentrations of up to 130 Bq/m3 were detected (Figure 6). No major manmade structures are present here. However, in the area, the coastline intersects with a cluster of distinct water accumulation lineaments suggesting natural groundwater accumulation and seaward flow path patterns as cause for elevated SGD rates in this area (cf. Figure 8).
The coastal cruise revealed salinity background values of about 17.3, i.e., values slightly below the offshore end-member of 17.5. Still, the salinities recorded along the coastal profile are not suitable for verifying the assumptions made based on the radon distribution pattern. On the one hand, the salinity did drop down to 4.8 at Kobuleti town beach and down to 9.1 north of Chakvi River mouth. On the other hand, the data cannot be attributed to SGD alone due to the river discharge. The salinities of the coastal sea that were found directly at the mouths of the Achkva (north) and Chakvi (south) rivers were 1.4 and 6.3, respectively.
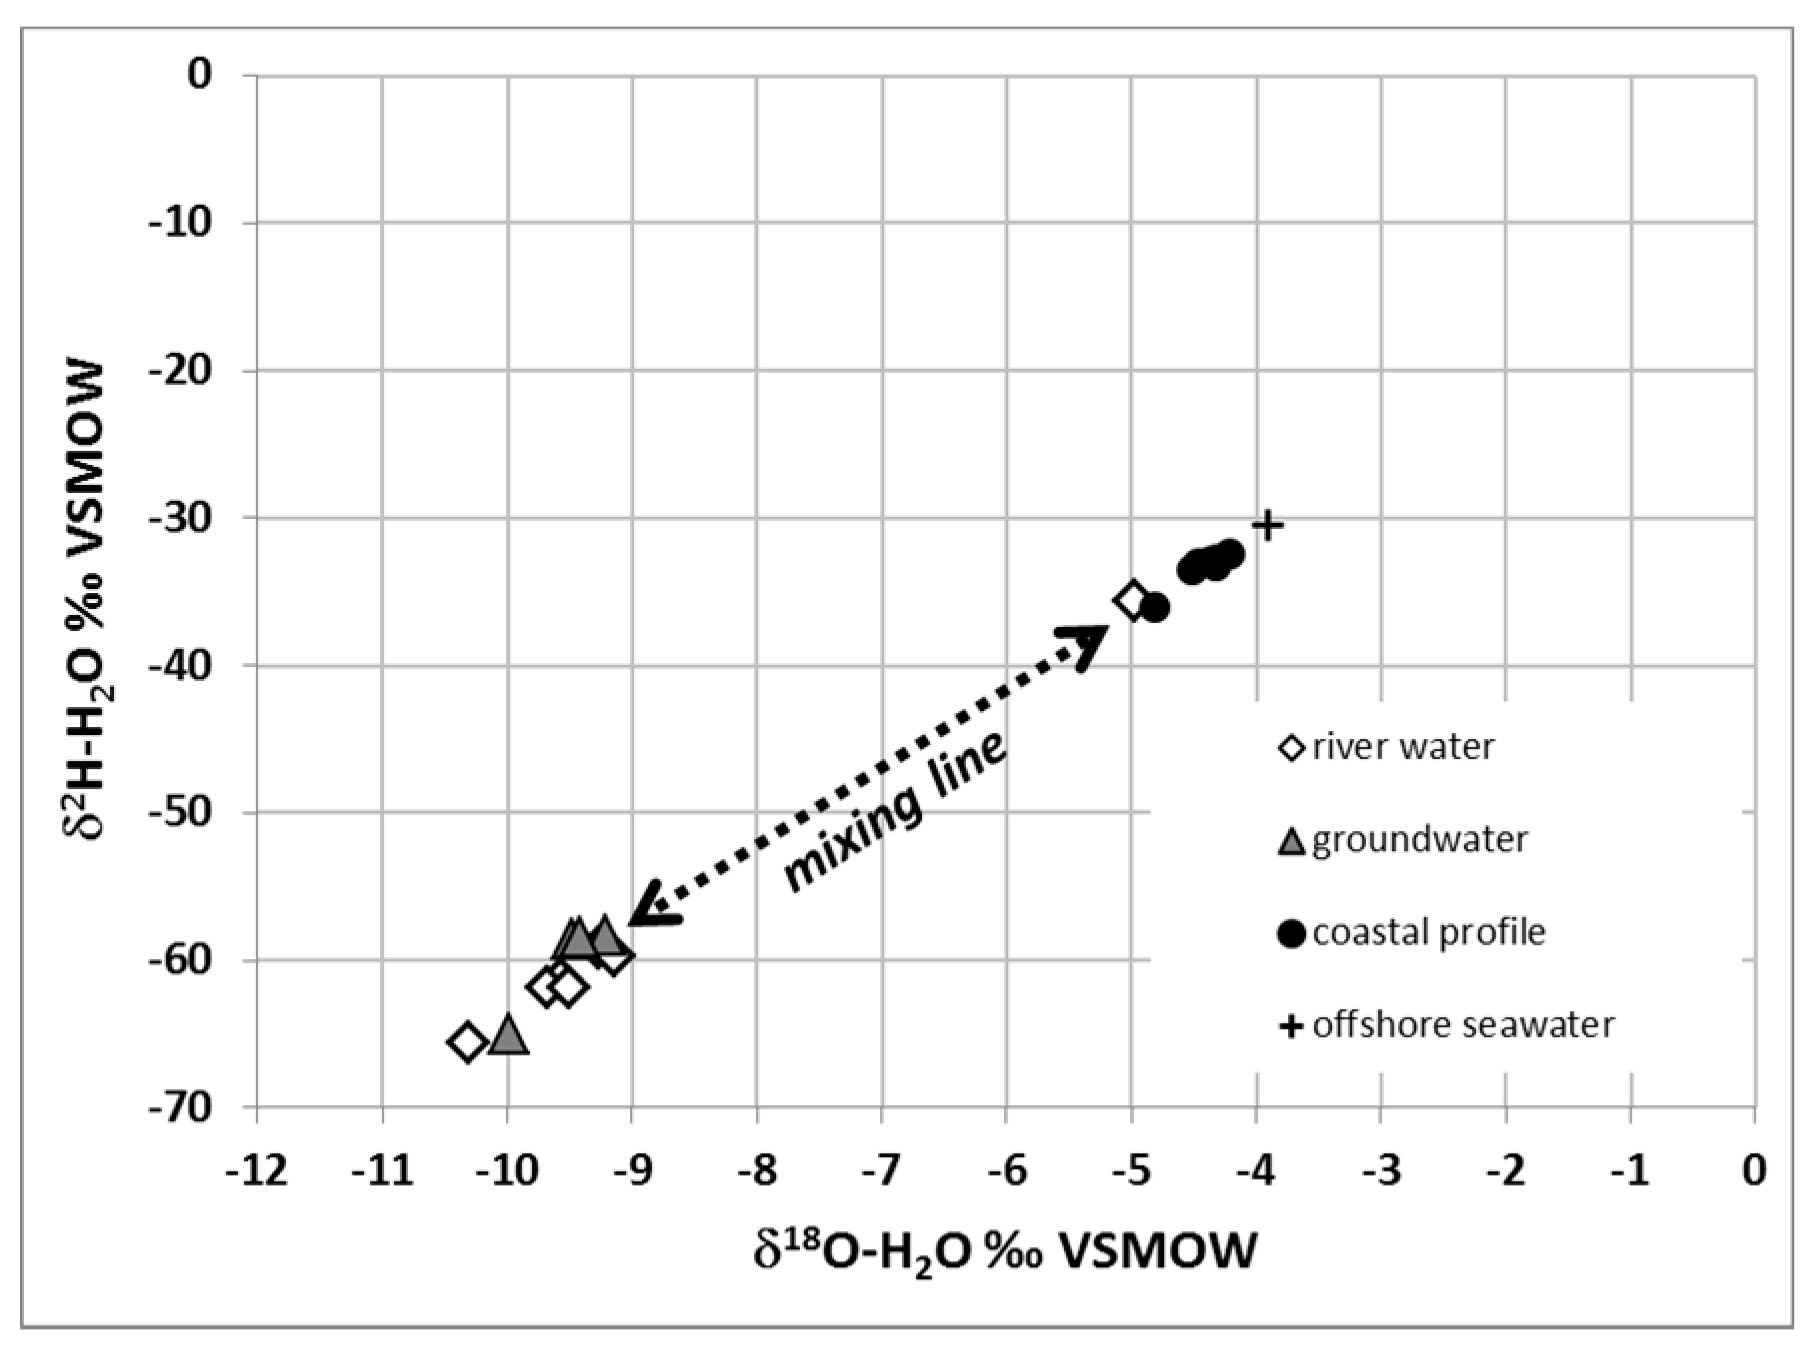
In addition to radon and salinity, six samples were taken for measuring stable water isotope signatures in the coastal seawater. The samples were taken along a 4 km profile perpendicular to the beach. The profile ended about 1 km north of the Kobuleti town beach concrete structures. Closest to the coast, the signatures indicated a share of freshwater in the coastal seawater of up to 20%. Since the signatures of groundwater and upstream river water are identical, this share of freshwater also cannot be attributed to SGD alone; river water discharge has to be taken into account (Figure 7). At the same time, it can be stated that the river water discharge is not at all dominating the signal since the water volume discharged by the rivers was, at the time of sampling, rather small. This only minor influence is reflected by a stable isotope signature measured in a river water sample that were taken upstream Achkva River in a distance of ca. 200 m from its mouth. These samples still revealed an 80% share of seawater (Figure 7). Since no tidal forces are present in the Black Sea, the marine influence must be due to a very low water discharge rate of the Achkva River.
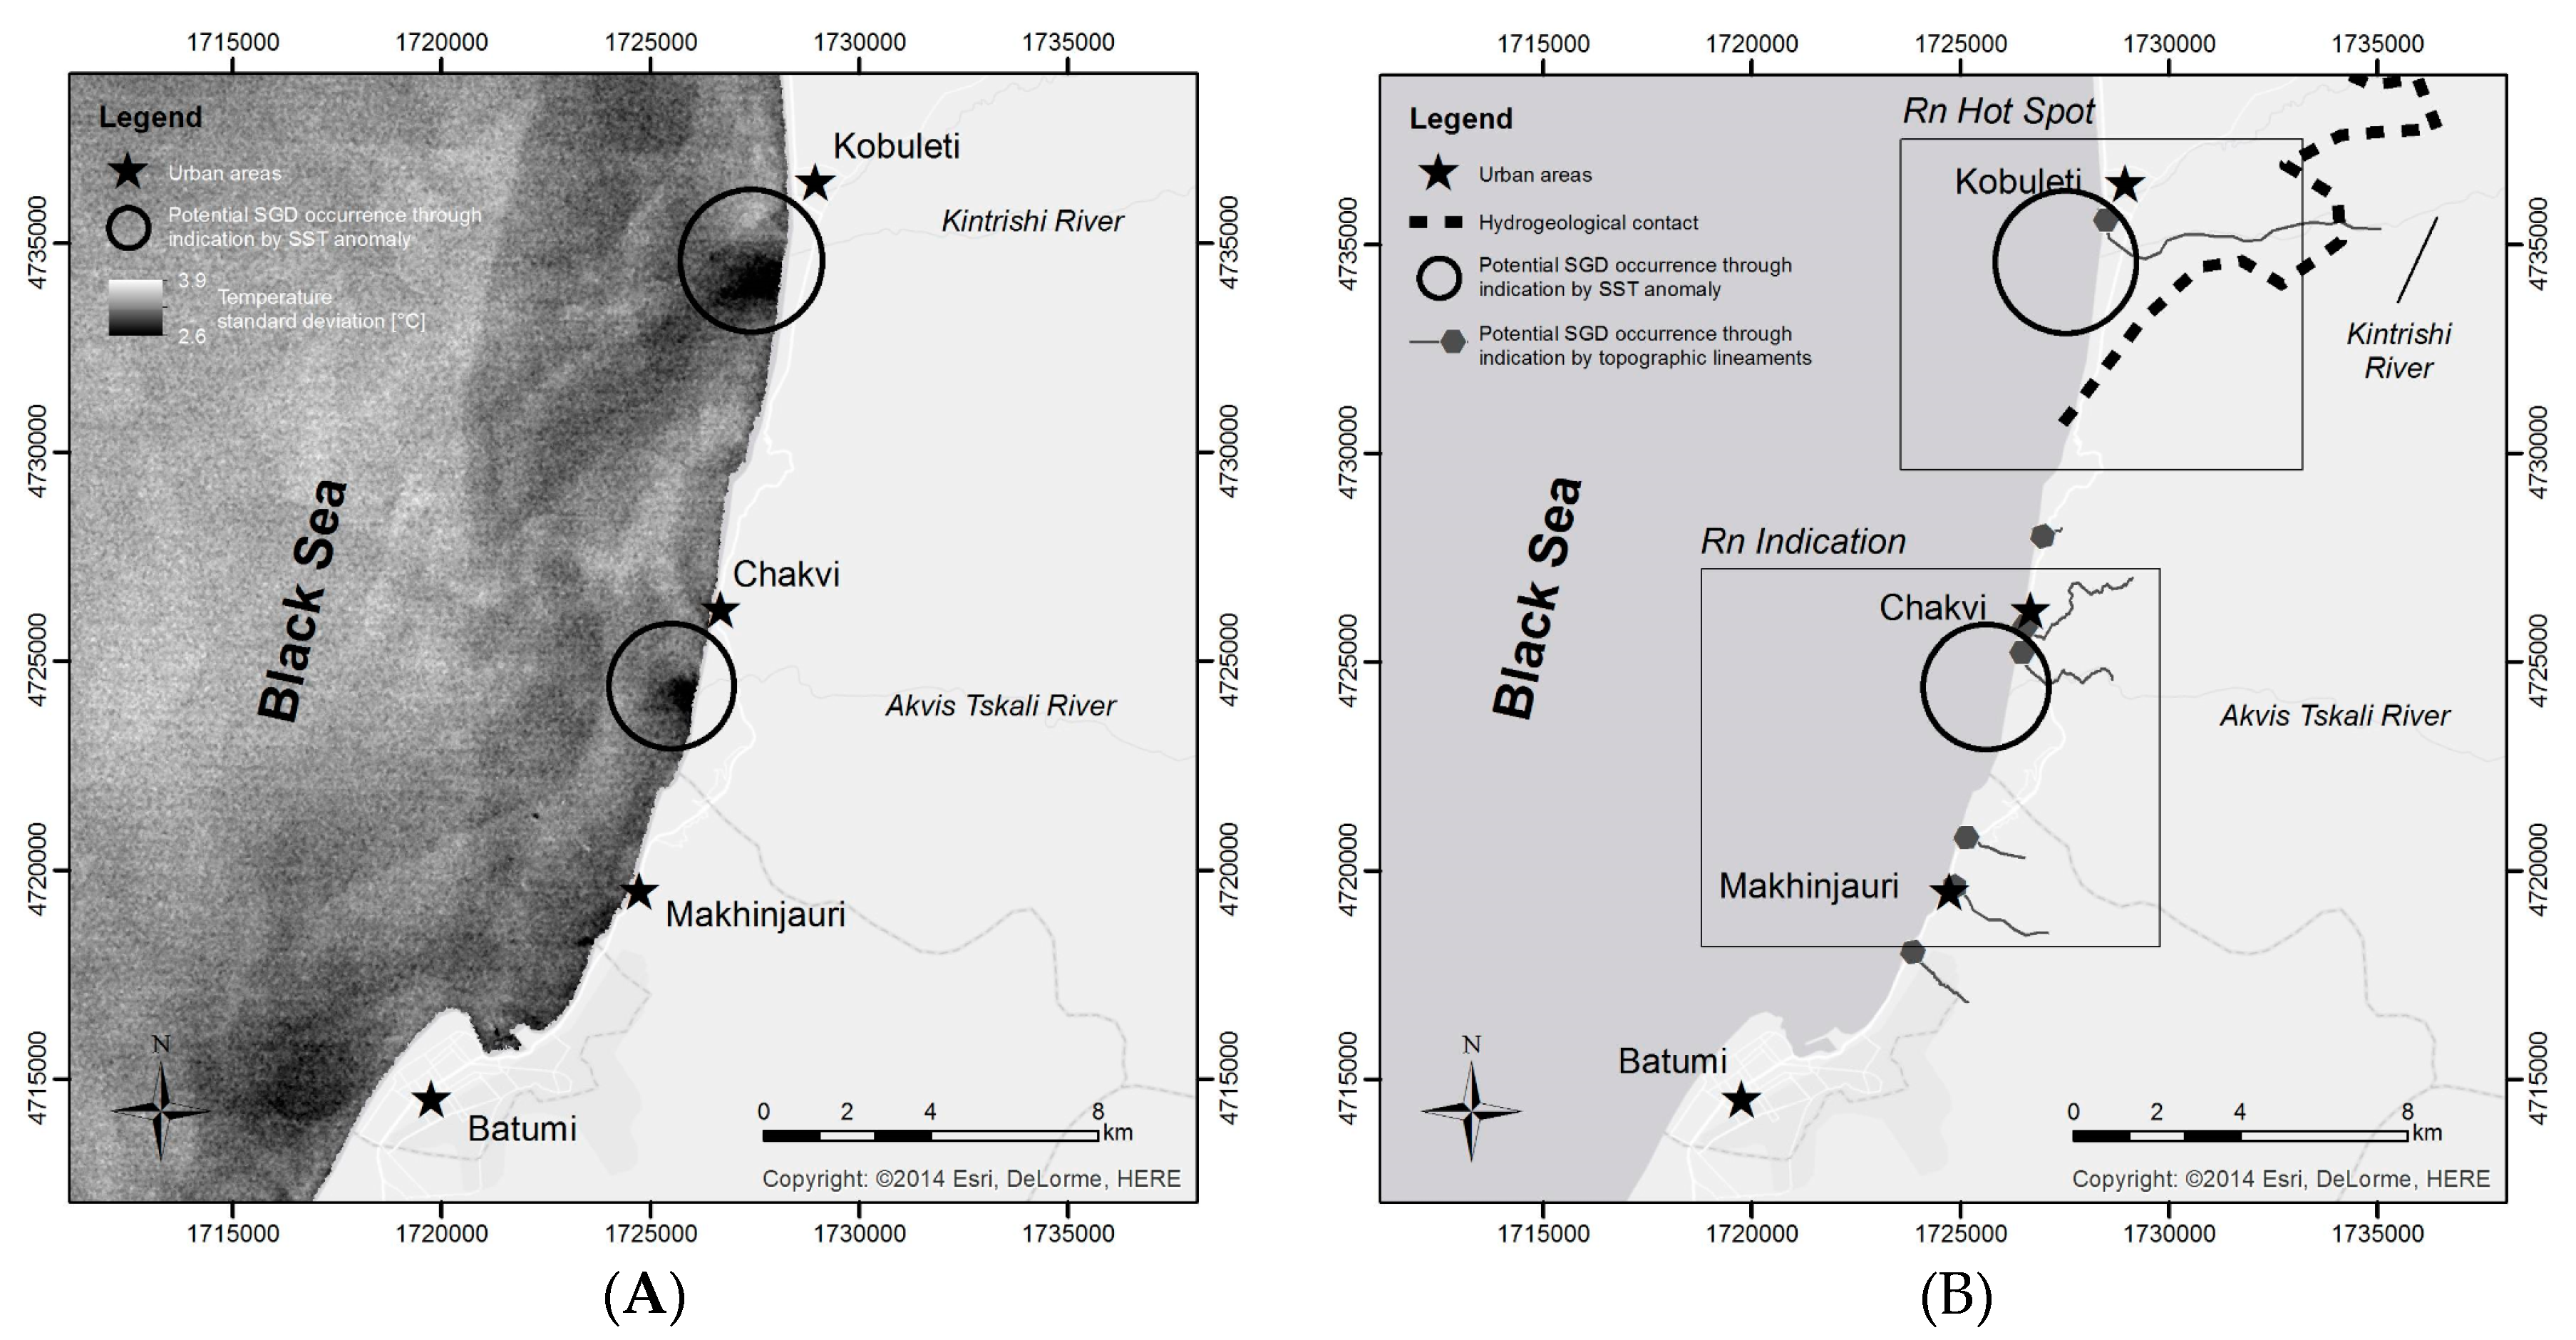
In contrast to the survey carried out at the Romanian coast, the two SGD zones that were localized in the Adjara region based on radon distribution patterns are also reflected in the SST distribution. The approach is based on the temperature standard deviation calculated per pixel from a set of eight SST images recorded during the hydrological winter. Zones of low SST variability that are conceptually indicating SGD were found directly south of Kobuleti and immediately south of the mouth of Chakvi River. The two areas, which show a rather diffuse but still significant SST indication, are illustrated in Figure 8A,B. It has to be noted that the two SST indications were detected slightly south of the zones that showed the highest radon concentrations close to the Kobuleti and Chakvi Rivers (with offsets of about 600 and 200 m, respectively). Small scale ocean current patterns (available from the Ukrainian “Black Sea GOOS program” [22]), which indicate a south bound current in the target area, can only be partially responsible for the observed patterns, since such coastal ocean current would result in a shift of both signals, radon and SST. The slight spatial offset between the two indications can be explained with the following assumption. Radon, which was sampled from a water depth of about 1 m, is an integral signal that represents more or less the complete 4 m water column. The SST signal, on the other hand, is only valid for the uppermost layer of that water column that are less than a millimeter in thickness. Hence, a difference in the drift velocity of the coastal water column on the one hand and the uppermost sea surface on the other hand, e.g., triggered by southward winds, would result in a spatial offset of the signals.

4. Conclusions

Besides the site specific results discussed above, the executed study confirms the general conclusion that a combined data evaluation of tracer information (222Rn, salinity, 18O/2H) and satellite based data (SST, DEM, fault system analysis) allows SGD localization with satisfying precision. On the other hand, no SGD quantification was possible in the given cases due to missing reliable terrestrial radon end member data. This information is crucial for SGD quantification applying the discussed approach. Salinity data, for which the definition of a terrestrial end member is unproblematic, indicates both river discharge and SGD and can hence not be used as a pure SGD indicator. The same is the case for 18O/2H, still the water stable isotopes allow differentiating between discharging aquifer domains. It could also be shown that SST patterns are not suitable as a SGD indicator in case of low discharge rates in concert with diffuse influx. Still, a downscaling approach starting with large scale satellite data is generally recommended, continuing with medium scale tracer patterns and ending with local spot sampling.

Acknowledgments

The project has been carried out as BS-ERA.NET activity within the FP7 framework founded by the European Commission (“SGD Black Sea”).

Author Contributions

Michael Schubert: main author and project PI, radon; Kay Knöller: stable isotope data interpretation; Reiner Stollberg: modeling, geological and DEM data interpretation; Ulf Mallast: SST data interpretation; Gyongyi Ruzsa: local data and logistics at western study site; George Melikadze: local data and logistics at eastern study site.

Conflicts of Interest

The authors declare no conflict of interest. The founding sponsors had no role in the design of the study; in the collection, analyses, or interpretation of data; in the writing of the manuscript, and in the decision to publish the results.

References

  1. Zektser, I.S.; Dzhamalov, R.G.; Everett, L.G. Groundwater Discharge to the Black Sea. In Submarine Groundwater; CRC Press-Taylor and Francis Group: Boca Raton, FL, USA, 2007; pp. 306–316. [Google Scholar]
  2. Burnett, W.C.; Dulaiova, H. Estimating the dynamics of groundwater input into the coastal zone via continuous radon-222 measurements. J. Environ. Radioact. 2003, 69, 21–35. [Google Scholar] [CrossRef]
  3. Schubert, M.; Paschke, A.; Lieberman, E.; Burnett, W.C. Air-Water Partitioning of 222Rn and its dependence on water temperature and salinity. Environ. Sci. Technol. 2012, 46, 3905–3911. [Google Scholar] [CrossRef] [PubMed]
  4. Petermann, E.; Schubert, M. Quantification of the response delay of mobile Rn-in-air detectors applied for detecting short-term fluctuations of Rn-in-water concentrations. Eur. Phys. J. Spec. Top. 2015, 224, 697–707. [Google Scholar] [CrossRef]
  5. Rocha, C.; Wilson, J.; Scholten, J.; Schubert, M. Retention and fate of groundwater-borne Nitrogen in a coastal bay (Kinvarra Bay, Western Ireland) during summer. Biogeochemistry 2015, 125, 275–299. [Google Scholar] [CrossRef]
  6. Craig, H. Isotopic variations in meteoric waters. Science 1961, 133, 1702–1703. [Google Scholar] [CrossRef] [PubMed]
  7. Dutton, A.R. Groundwater isotopic evidence for paleorecharge in U.S. High Plains aquifers. Quat. Res. 1995, 43, 221–231. [Google Scholar] [CrossRef]
  8. Santos, I.M.; Niencheski, F.; Burnett, W.; Peterson, R.; Chanton, J.; Andrade, L.C.; Milani, I.; Schmidt, A.; Knoeller, K. Tracing anthropogenically driven groundwater discharge into a coastal lagoon from southern Brazil. J. Hydrol. 2008, 353, 275–293. [Google Scholar] [CrossRef]
  9. Rocha, C.; Veiga-Pires, C.; Scholten, J.; Knöller, K.; Gröcke, D.; Carvalho, L.; Anibal, J.; Wilson, J. Assessing land–ocean connectivity via submarine groundwater discharge (SGD) in the Ria Formosa Lagoon (Portugal): Combining radon measurements and stable isotope hydrology. Hydrol. Earth Syst. Sci. 2016, 20, 3077–3098. [Google Scholar] [CrossRef]
  10. Shahzad, F.; Gloaguen, R. TecDEM: A MATLAB based toolbox for tectonic geomorphology, Part 1: Drainage network preprocessing and stream profile analysis. Comput. Geosci. 2011, 37, 250–260. [Google Scholar] [CrossRef]
  11. Mallast, U.; Gloaguen, R.; Geyer, S.; Rödiger, T.; Siebert, C. Derivation of groundwater flow-paths based on semi-automatic extraction of lineaments from remote sensing data. Hydrol. Earth Syst. Sci. 2011, 15, 2665–2678. [Google Scholar] [CrossRef]
  12. Rapaglia, J.; Grant, C.; Bokuniewicz, H.; Pick, T.; Scholten, J. A GIS typology to locate sites of submarine groundwater discharge. J. Environ. Radioact. 2015, 145, 10–18. [Google Scholar] [CrossRef] [PubMed]
  13. Mallast, U.; Gloaguen, R.; Friesen, J.; Rödiger, T.; Geyer, S.; Merz, R.; Siebert, C. How to identify groundwater-caused thermal anomalies in lakes based on multi-temporal satellite data in semi-arid regions. Hydrol. Earth Syst. Sci. 2014, 18, 2773–2787. [Google Scholar] [CrossRef]
  14. Tamborski, J.J.; Rogers, A.D.; Bokuniewicz, H.J.; Cochran, J.K.; Young, C.R. Identification and quantification of diffuse fresh submarine groundwater discharge via airborne thermal infrared remote sensing. Remote Sens. Environ. 2015, 171, 202–217. [Google Scholar] [CrossRef]
  15. Georgiev, G. Geology and Hydrocarbon Systems in the Western Black Sea. Turkish J. Earth Sci. 2012, 21, 723–754. [Google Scholar] [CrossRef]
  16. Seghedi, A.; Vaida, M.; Iordan, M.; Verniers, J. Paleozoic evolution of the Romanian part of the Moesian Platform: An Overview. Geol. Belg. 2005, 8, 99–120. [Google Scholar]
  17. Schubert, M.; Bürkin, W.; Peña, P.; Lopez, A.; Balcázar, M. On-site determination of the radon concentration in water samples: Methodical background and results from laboratory studies and a field-scale test. Radiat. Meas. 2006, 41, 492–497. [Google Scholar] [CrossRef]
  18. MacIntyre, S.; Wanninkhof, R.; Chanton, J.P. Trace Gas Exchange across the Air-Water Interface in Freshwater and Coastal Marine Environments. In Methods in Ecology-Biogenic Trace Gases: Measuring Emissions from Soil and Water; Matson, P.A., Harriss, R.C., Eds.; Blackwell Science: Cambridge, MA, USA, 1995. [Google Scholar]
  19. Stieglitz, T.; Rapaglia, J.P.; Krupa, S. An effect of pier pilings on nearshore submarine groundwater discharge from a (partially) confined aquifer. Estuaries Coasts 2007, 30, 543–550. [Google Scholar] [CrossRef]
  20. Schubert, M.; Knoeller, K.; Einsiedl, F.; Rocha, C. Preliminary Evaluation of groundwater contributions to the water budget of Kinvarra Bay, Ireland, using 222Rn, EC and stable isotopes as natural indicators. Environ. Monit. Assess. 2015, 187. [Google Scholar] [CrossRef] [PubMed]
  21. Petermann, E.; Knöller, K.; Stollberg, R.; Scholten, J.; Gebel, M.; Lorz, C.; Glück, F.; Riemann, K.; Schubert, M. Novel Approaches for Localization and Quantification of Submarine Groundwater Discharge Using the Environmental Tracer Radon (222Rn) and Hydro(geo)logical Modeling. J. Hydrol. 2017. accepted. [Google Scholar]
  22. Black Sea Global Ocean Observing System. Available online: www.ims.metu.edu.tr/Black_Sea_GOOS/index.htm (accessed on 5 May 2017).
Figure 1. General geographical location of the two study areas.
Water 09 00468 g001
Figure 2. (A) (Left): Radon concentration distribution along the complete coastal profile between the south of Constanta harbor and the south of Mangalia; (B) (Middle): Detailed illustration of the radon hot spots around Costinesti harbor and the settlements Venus and Saturn; slightly elevated radon indication south of Mangalia; (C) (Right): Simultaneously recorded salinity and radon data between Costinesti harbor and the settlements Venus and Saturn.
Water 09 00468 g002
Figure 3. Stable isotope data of the water from the Venus/Saturn hot spring (“Mangalia”) and from the shallow aquifer (“Costinesti”) [21,22].
Water 09 00468 g003
Figure 4. Profile measured perpendicular to Venus/Saturn beach with 0 km being the offshore location and 4 km the shoreline.
Water 09 00468 g004
Figure 5. Potential water flow accumulation zones as suggested by digital elevation models (DEM) and major fault zones.
Water 09 00468 g005
Figure 6. Radon distribution along the shoreline.
Water 09 00468 g006
Figure 7. Stable water isotope signatures of end-members (river water, groundwater and offshore water) and coastal seawater (six samples taken on the perpendicular transect).
Water 09 00468 g007
Figure 8. (A) (left): Submarine groundwater discharge (SGD) indication by SST patterns; (B) (right): Potential water flow accumulation zones as suggested by DEM and hydrological contact zone; SGD zones as indicated by sea surface temperature (SST) patterns.
Water 09 00468 g008
Table 1. Data of shallow aquifer water (SAW) and hot spring water (HSW).
N-NO2N-NO3SiO2SO4Colour AppTurbiditySusp. SolidsCa2+
[mg/L][mg/L][mg/L][mg/L][PtCo][ftu][mg/L][mg/L]
SAW0.0170.101.1500.040042.1
HSW0.0040.0215.57011.02610586.3

