Spatiotemporal Changes of Reference Evapotranspiration in the Highest-Latitude Region of China


1
Key Laboratory of Wetland Ecology and Environment, Northeast Institute of Geography and Agroecology, Chinese Academy of Sciences, No. 4888, Shengbei Street, Changchun 130102, China
2
University of the Chinese Academy of Sciences, Beijing 100049, China
3
School of Renewable Natural Resources, Louisiana State University Agricultural Center, Baton Rouge, LA 70803, USA
4
Institute of Meteorological Sciences of Jilin Province, and Laboratory of Research for Middle-High Latitude Circulation and East Asian Monsoon, and Jilin Province Key Laboratory for Changbai Mountain Meteorology and Climate Change, Changchun 130062, China
*
Author to whom correspondence should be addressed.
Water 2017, 9(7), 493; https://doi.org/10.3390/w9070493
Submission received: 2 June 2017
/
Revised: 29 June 2017
/
Accepted: 4 July 2017
/
Published: 5 July 2017
(This article belongs to the Special Issue Adaptation Strategies to Climate Change Impacts on Water Resources)
Abstract
:Reference evapotranspiration (ET0) is often used to make management decisions for crop irrigation scheduling and production. In this study, the spatial and temporal trends of ET0 in China’s most northern province as well as the country’s largest agricultural region were analyzed for the period from 1964 to 2013. ET0 was calculated with the Penman-Monteith of Food and Agriculture Organization of the United Nations irrigation and drainage paper NO.56 (FAO-56) using climatic data collected from 27 stations. Inverse distance weighting (IDW) was used for the spatial interpolation of the estimated ET0. A Modified Mann–Kendall test (MMK) was applied to test the spatiotemporal trends of ET0, while Pearson’s correlation coefficient and cross-wavelet analysis were employed to assess the factors affecting the spatiotemporal variability at different elevations. The results from this study showed a clear decreasing trend for annual ET0 from the low elevation plain area to the high elevation mountainous area. Over the past five decades, ET0 in Heilongjiang Province decreased in all seasons, except for the winter months, during which a steady increase in temperature was found. Elevation played an important role in estimating ET0 in this higher-latitude region, while relative humidity was the most relevant meteorological factor that affected the spatiotemporal variation of ET0 in the province. Overall, the findings from the study suggest that winter ET0 in a high altitude region will continue to increase in the future as climate change persists, which could worsen spring droughts and irrigation management for semi-arid areas in the province.
1. Introduction
Reference evapotranspiration (ET0) is an important parameter in the water and energy balance of terrestrial ecosystems [1,2]. It has been used for determining crop water demand and irrigation scheduling [3,4], as it is closely related to hydrological processes such as soil moisture transfer to the atmosphere, groundwater recharge, and runoff generation [5,6]. ET0 can be also considered an indicator for the ecological water demand of natural landscapes. Therefore assessing ET0 spatial distribution can be useful for determining regional water consumption and developing effective water management strategies.
Although global temperatures have increased in the past 50 years, ET0 has been found to respond differently in different geographical regions. For instance, ET0 has been reported to increase in the Mediterranean countries and Central Asia [7,8]. However, ET0 has been found to decline in Australia [9], the United States [10], Canada [11], India [12], and China [13,14]. Despite a number of large-scale studies on ET0, few studies have looked at its spatiotemporal trend in high-altitude regions that are vulnerable to temperature changes in the future.
In the context of a hydrological cycle, any change in meteorological factors could affect ET0 because evapotranspiration is directly or indirectly related to these factors [15]. Previous studies have analyzed the sensitivity of ET0 to various meteorological factors such as air temperature, humidity, wind speed, or solar radiation [16,17,18,19]. Roderick and Farquhar [20] found that the decrease in ET0 was consistent with the decreases in sunlight resulting from increasing cloud coverage and aerosol concentration. Qian et al. [21] reported that increased air pollution may decrease solar radiation and result in less energy being available for evapotranspiration. Differing from most opinions, McVicar et al. [22] considered that change in wind speed was one of the most important factors contributing to the decline of the ET0 on the global scale. In addition, it may also be relevant that solar radiation was a vital factor likely to effect ET0. However, Brutsaert et al. [23] argued that, as actual evaporation increases, atmospheric humidity increases, thus reducing the apparent potential evaporation, which is reflected in reduced pan evaporation. In short, the cause of the change in ET0 is complex and remains a scientific problem, especially in high-altitude regions, due to these regions experiencing the fastest warming trends [9,24].
As one of the most important grain production bases in China, Heilongjiang is the country’s northernmost province (43–53° N) and is also the world’s northernmost rice-growing area. Several studies have found a significant increase in temperature in the region during the past several decades [13,14,25]. In addition, a few previous studies had qualitatively indicated that annual ET0 had a decreasing trend over the whole Northeast of China [18,19,26,27,28]. However, few studies quantitatively analyze ET0 variation against elevation in high altitude regions like northeast China. Furthermore, it is not clear whether and how the temperature increase affects ET0 variability in this province. The variation of ET0 is a key element, which is closely related to water demands for irrigation. As global temperatures are projected to increase in the coming century [24], it is vital to understand the spatiotemporal variation of ET0 in high latitude regions. This is especially true for analyzing future water demands for irrigation in these regions as many of the regions suffer from periodic droughts [3,29,30].
This study aims to assess the past five decades of spatiotemporal change in reference to evapotranspiration in China’s highest latitude region. Specifically, the study aims to (1) quantify ET0 at different elevations in Heilongjiang Province for the period from 1964 to 2013; (2) map ET0 spatially across the province to discern the regional heterogeneity; and (3) analyze the sensitivity of ET0 to key meteorological variables.
2. Materials and Methods
2.1. Study Area
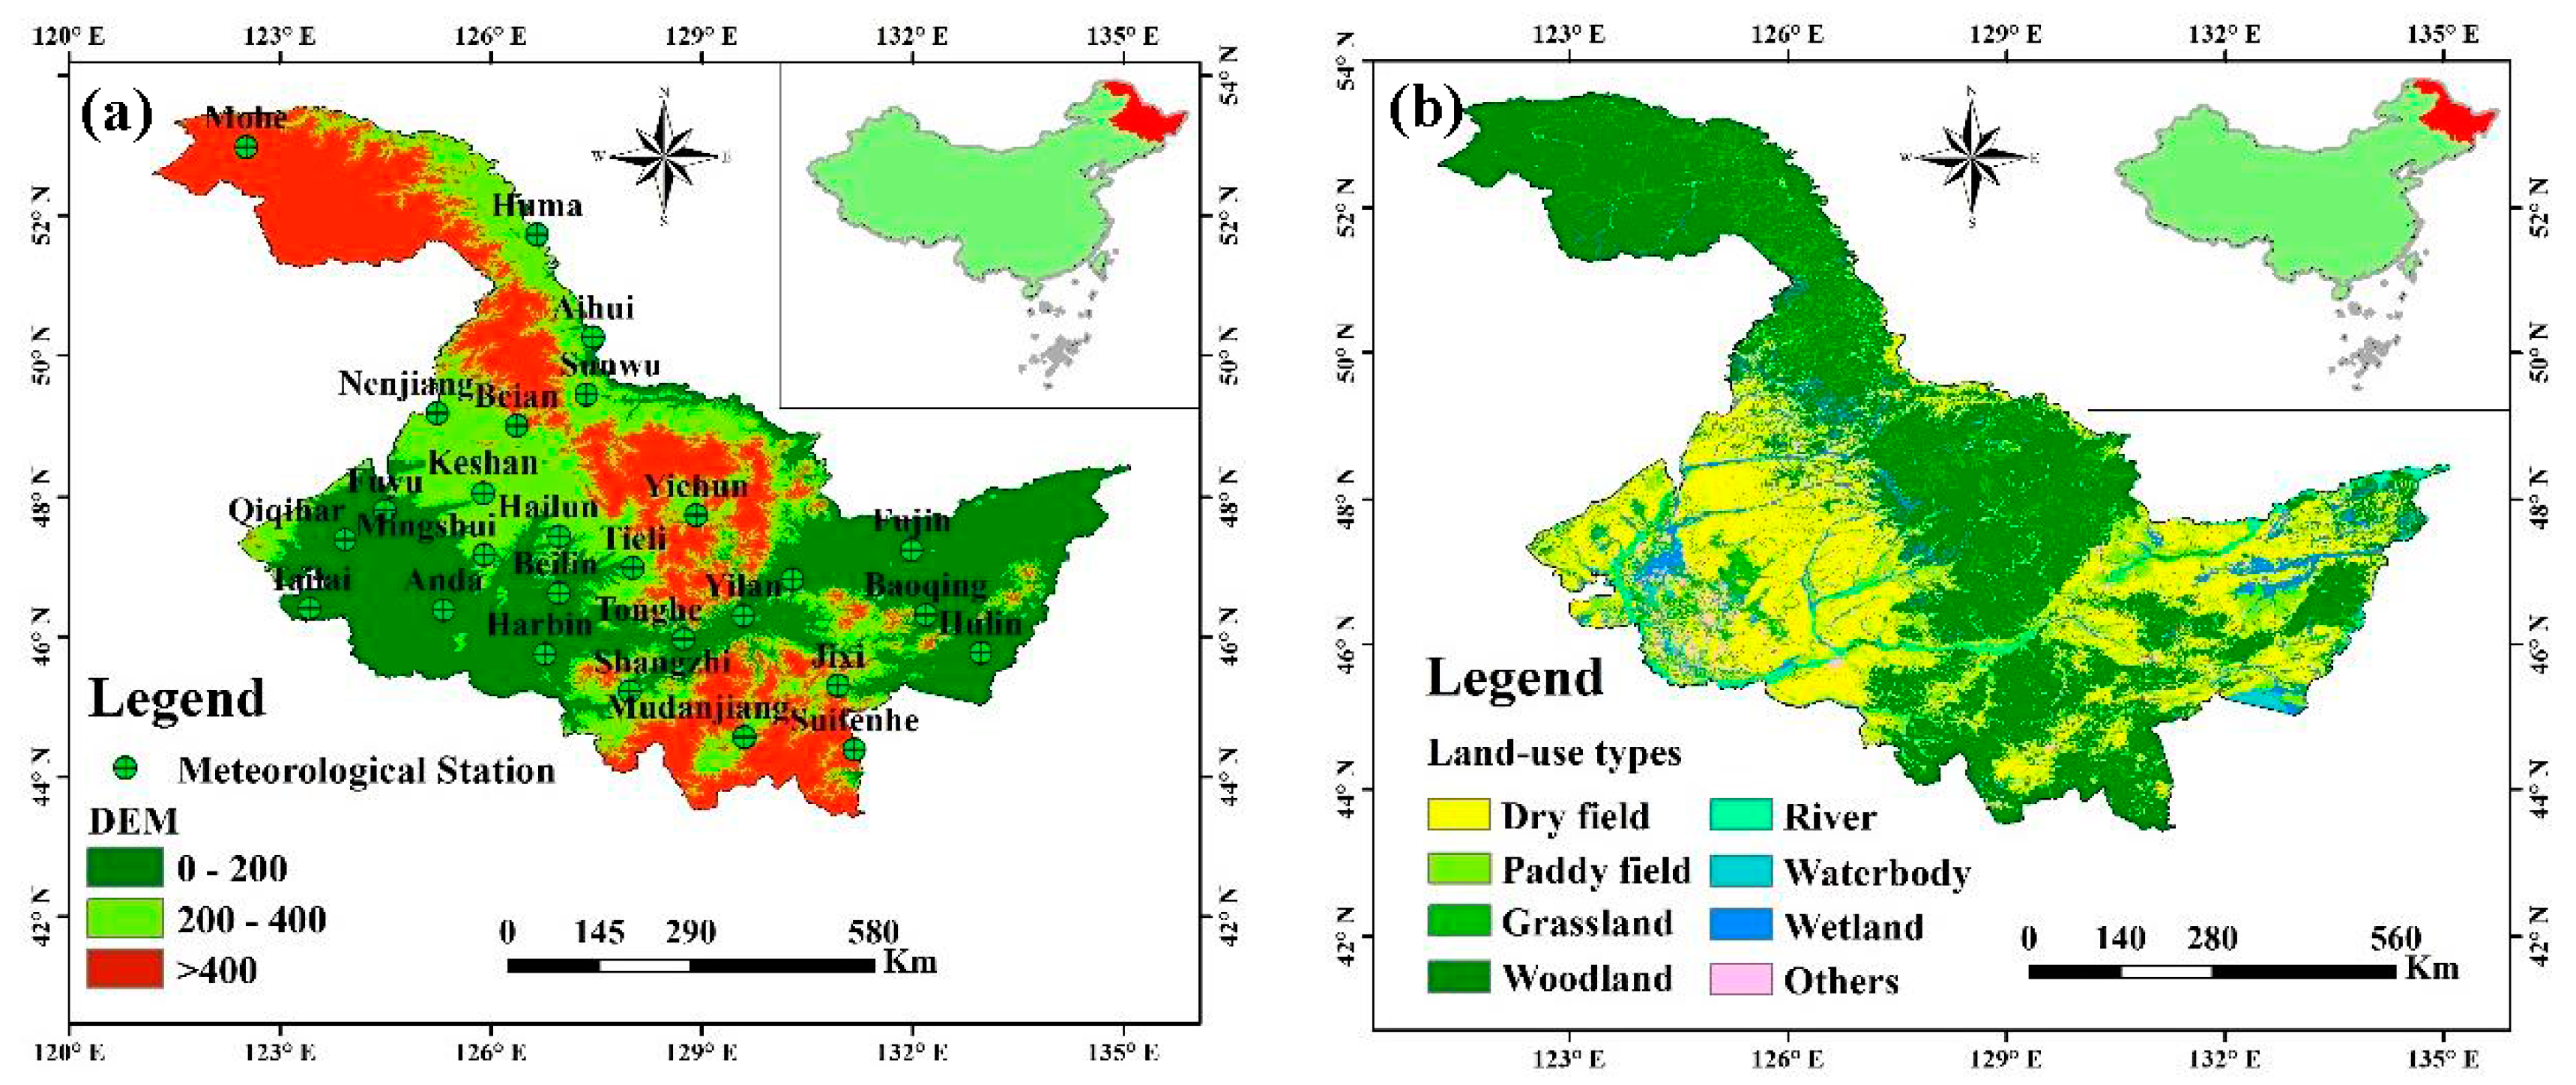
Heilongjiang Province (43°22′–53°24′ N and 121°13′–135°05′ E) is located in northeast China, covering a total land area of approximately 473,000 km2 (Figure 1a). About one third of the province (i.e., 37%) consists of low-lying plain areas with extensive wetlands, many of which have been converted to rice cultivation in the past half century [31]. Currently, 28% of the province’s area (i.e., 133,000 km2) is agricultural land (Figure 1b) that annually produces a total of 0.65 × 10⁸ t grains, ranking first in China (Heilongjiang Bureau of Statistics, 2015) [32]. The province is designed by the Chinese Government to be the most important grain production base in the future.
The climate of this high-latitude region can be characterized as temperate, humid, and semi-humid continental monsoon with a long-term annual average temperature of 1.9 °C, which ranges from −5 to 5 °C, and a long-term annual average precipitation of about 550 mm, most of which falls during the summer season [33]. The total annual solar radiation in the province is between 44 × 108 and 50 × 108 J/m2, 55% to 60% of which is accumulated during the growing season from May to September, with a decreasing trend from South to North. The total duration of sunshine in the province is about 2400–2800 h per year. The monthly average wind speed is 2.7 m/s, varying from 2.1 m/s to 3.8 m/s. Normally, strong winds occur in Spring, causing lower humidity in the season.
2.2. Meteorological Data Collection
Daily meteorological data from 27 stations in Heilongjiang Province were obtained for the period from 1964 to 2013 from the China Meteorological Administration (http://data.cma.cn/) (Table 1). Six meteorological variables were used to calculate ET0 for each station, and they included maximum air temperature (Tmax, °C), minimum air temperature (Tmin, °C), mean air temperature (Tmean, °C), mean relative humidity (RH, %), wind speed at 10 m above the ground (WS, m/s), and sunshine duration (SD, h/d). All these meteorological data were qualitatively checked before use.
2.3. Calculation of Reference Evapotranspiration
In this study, the Penman-Monteith equation, which is applied widely all over world [34] as recommended by the United Nations Food and Agriculture Organization (FAO), was used for calculating the ET0 due to lack of measured pan evapotranspiration:
where ET0 is the reference evapotranspiration (mm d−1), Rn is net radiation (MJ m−2 d−1); G is the soil heat flux density (MJ m−2 d−1), Tmean is the mean air temperature (°C), es is the saturation vapor pressure (kPa), ea is the actual vapor pressure (kPa), Δ is the slope of the saturation vapor pressure function (kPa °C−1), γ is the psychometric constant (kPa °C−1), and U2 is the wind speed at 2 m height (m s−1).
Due to the lack of U2 data, this variable was estimated from wind speed at 10 m height, using the logarithmic vertical wind speed profile [34]:
where z is the height of measurement above ground surface (m) and Uz is the measured wind speed at z m above ground surface (m s−1).
The detailed description used in estimating ET0 was given in Chapter 3 of FAO-56 [34]. The seasonal and annual values of ET0 were calculated using the daily ET0 data.
2.4. Spatial Interpolation
In recent years, based on meteorological station data, some spatial interpolation methods have been applied to study the spatial distributions of ET0 and the climate variations. Due to the fact that the inverse distance weighting (IDW) method gave the lowest mean error, the method is applied widely all over world [3,27,35,36]. Thus, in this study, the IDW method is selected to analyze the spatial variation of ET0.
The weights of the IDW interpolation method are solely a function of the distance between the interest point and the sampling points for i = 1, 2, …, n. Considering the distance Di between these two points, the value of an interest point is in the form [37]:
where M is the interpolated value of a interest point, Mi is the value of the sampling point I, and Di is the distance to the sampling point.
2.5. Data Analysis
In this study, all analyses of the spatiotemporal variation of ET0 were performed two times; once with annual data and once with seasonal data. Meanwhile, a season is defined in the standard climatological way; Spring is considered as occurring from March to May, Summer from June to August, Autumn from September to November, and Winter from December to February.
The Modified Mann-Kendall test (the Mann-Kendall test with trend-free pre-whitening) was applied to analyze the long-term trend of ET0 throughout the whole study period. The traditional Mann-Kendall test assumes that the series is independent and not robust against autocorrelation. However, some meteorological time series may frequently show statistically significant serial correlation. This may lead to a disproportionate rejection of the null hypothesis without the trend, whereas the null hypothesis is actually true. Therefore, the effect of serial correlation is a main source of uncertainty in testing and interpreting trends. To correct the serial correlation in the data, a trend-free pre-whitening procedure is used to remove the lag-1 serial correlation (r1) from the time series. Recently, this method has been applied in more and more studies [25,38,39]. To determine whether the observed data set is serially correlated, the significance of the lag-1 serial correlation (r1) should be tested at the 0.10 significance level. r1 is calculated using the following formula [40]:
If , the time series is assumed to be independent at the 0.10 significance level and can be subjected to the original Mann-Kendall test. Otherwise, the effect of serial correlation should be removed from the time series by pre-whitening prior to applying the Mann-Kendall test. The Mann-Kendall test was then used to detect a trend in the residual series. The new time series was obtained as follows [41]:
The r1 value of this new time data set was calculated and used to determine the residual series as:
The value of β × i was added again to the residual data set as follows:
The yi series was subjected to trend analysis.
Based on the Modified Mann-Kendall test, a normalized test statistic Z was calculated for all the meteorological stations. When the significance levels are set at 0.01 and 0.05, |Za| is 2.58 and 1.96, respectively. At a certain significance level, if |Z| > |Za|, the null hypothesis H0 is rejected. In other words, the trend is significant at the set level of significance. Otherwise, no significant trend exists [25].
Pearson’s correlation coefficient was applied to analyze the correlativity between the ET0 and key meteorological factors, and r value was calculated via SPSS 16.0 software.
The sensitivity coefficients of the ET0 to each meteorological factor were simulated as follows [42,43]:
where Cs is the sensitivity coefficient, CHET0 is the change in ET0 with respect to change in the climate variable, and CHCV is the change (increase or decrease) in the climate variable, which was changed within a range between −20% and 20% at an interval of 1%.
In order to analyze the temporal evolution of the different components at a number of scales (i.e., scale analysis) that are present in the time series, wavelet coherence (WTC), which is widely used in hydrological and meteorological research all over the world, was applied to determine the intensity of the covariance of two time series, xt and yt, in time-frequency domains [44]. Ranging from 0 to 1, with 1 representing the highest covariance between xt and yt, the values of the wavelet squared coherency R were calculated as [45]:
where and are the wavelet transforms of time series x and y, respectively, according to time t, and is their cross-wavelet spectrum. S represents a smoothing operator and can be expressed as:
where Sscale and Stime represent the smoothing along the wavelet scale and in time, respectively. For the Morlet wavelet, a suitable smoothing operator is given by Torrence and Webster as follows:
where c1 and c2 are normalization constants and Π is the rectangle function. The factor of 0.6 is the empirically determined scale decorrelation length for the Merlet wavelet [44].
In addition, the Lilliefors test and the Kolmogorov–Smirnov goodness-of-fit test were applied to check the probability distribution of each time series. Furthermore, it was worth noting that a non-normal time series was transformed into a record of percentiles in terms of its cumulative distribution function in order to avoid the presence of any oulier [45]. The WTC procedures were applied after the transformation. In this study, the wavelet analysis was performed by a Matlab toolbox developed by Grinsted et al. [45], which is available at http://noc.ac.uk/using-science/crosswavelet-wavelet-coherence.
3. Results
3.1. Spatial Variation of ET0
The long-term (1964–2013) ET0 in Heilongjiang Province averaged 729 mm/year, ranging from 542 mm/year to 960 mm/year. The annual average ET0 showed a clear decreasing trend from the low elevation plain area to the high elevation mountainous area (Figure 2). The annual average ET0 was 772.5 mm/year in the elevation from 0 to 200 m, 705.4 mm/year in the elevation from 200 to 400 m, and 668.1 mm/year in the elevation above 400 m (Table 2). The ET0 in the Southwest was higher than that in other areas. The annual average ET0 was highest (960 mm) at the Tailai station in the Southwest and lowest (542 mm) at the Mohe station in the Northwest.
Over the past five decades, the ET0 in Heilongjiang Province averaged 248 mm, 312 mm, 134 mm, and 35 mm in Spring, Summer, Autumn, and Winter, respectively. (Figure 3). The ET0 during summer was clearly higher in the low elevation plain area than in the high elevation mountainous area. The spring, summer, and autumn ET0 showed a decreasing trend with increasing elevation. However, the winter ET0 showed a tendency to increase first and decrease thereafter as elevation increased.
3.2. Temporal Variation of ET0
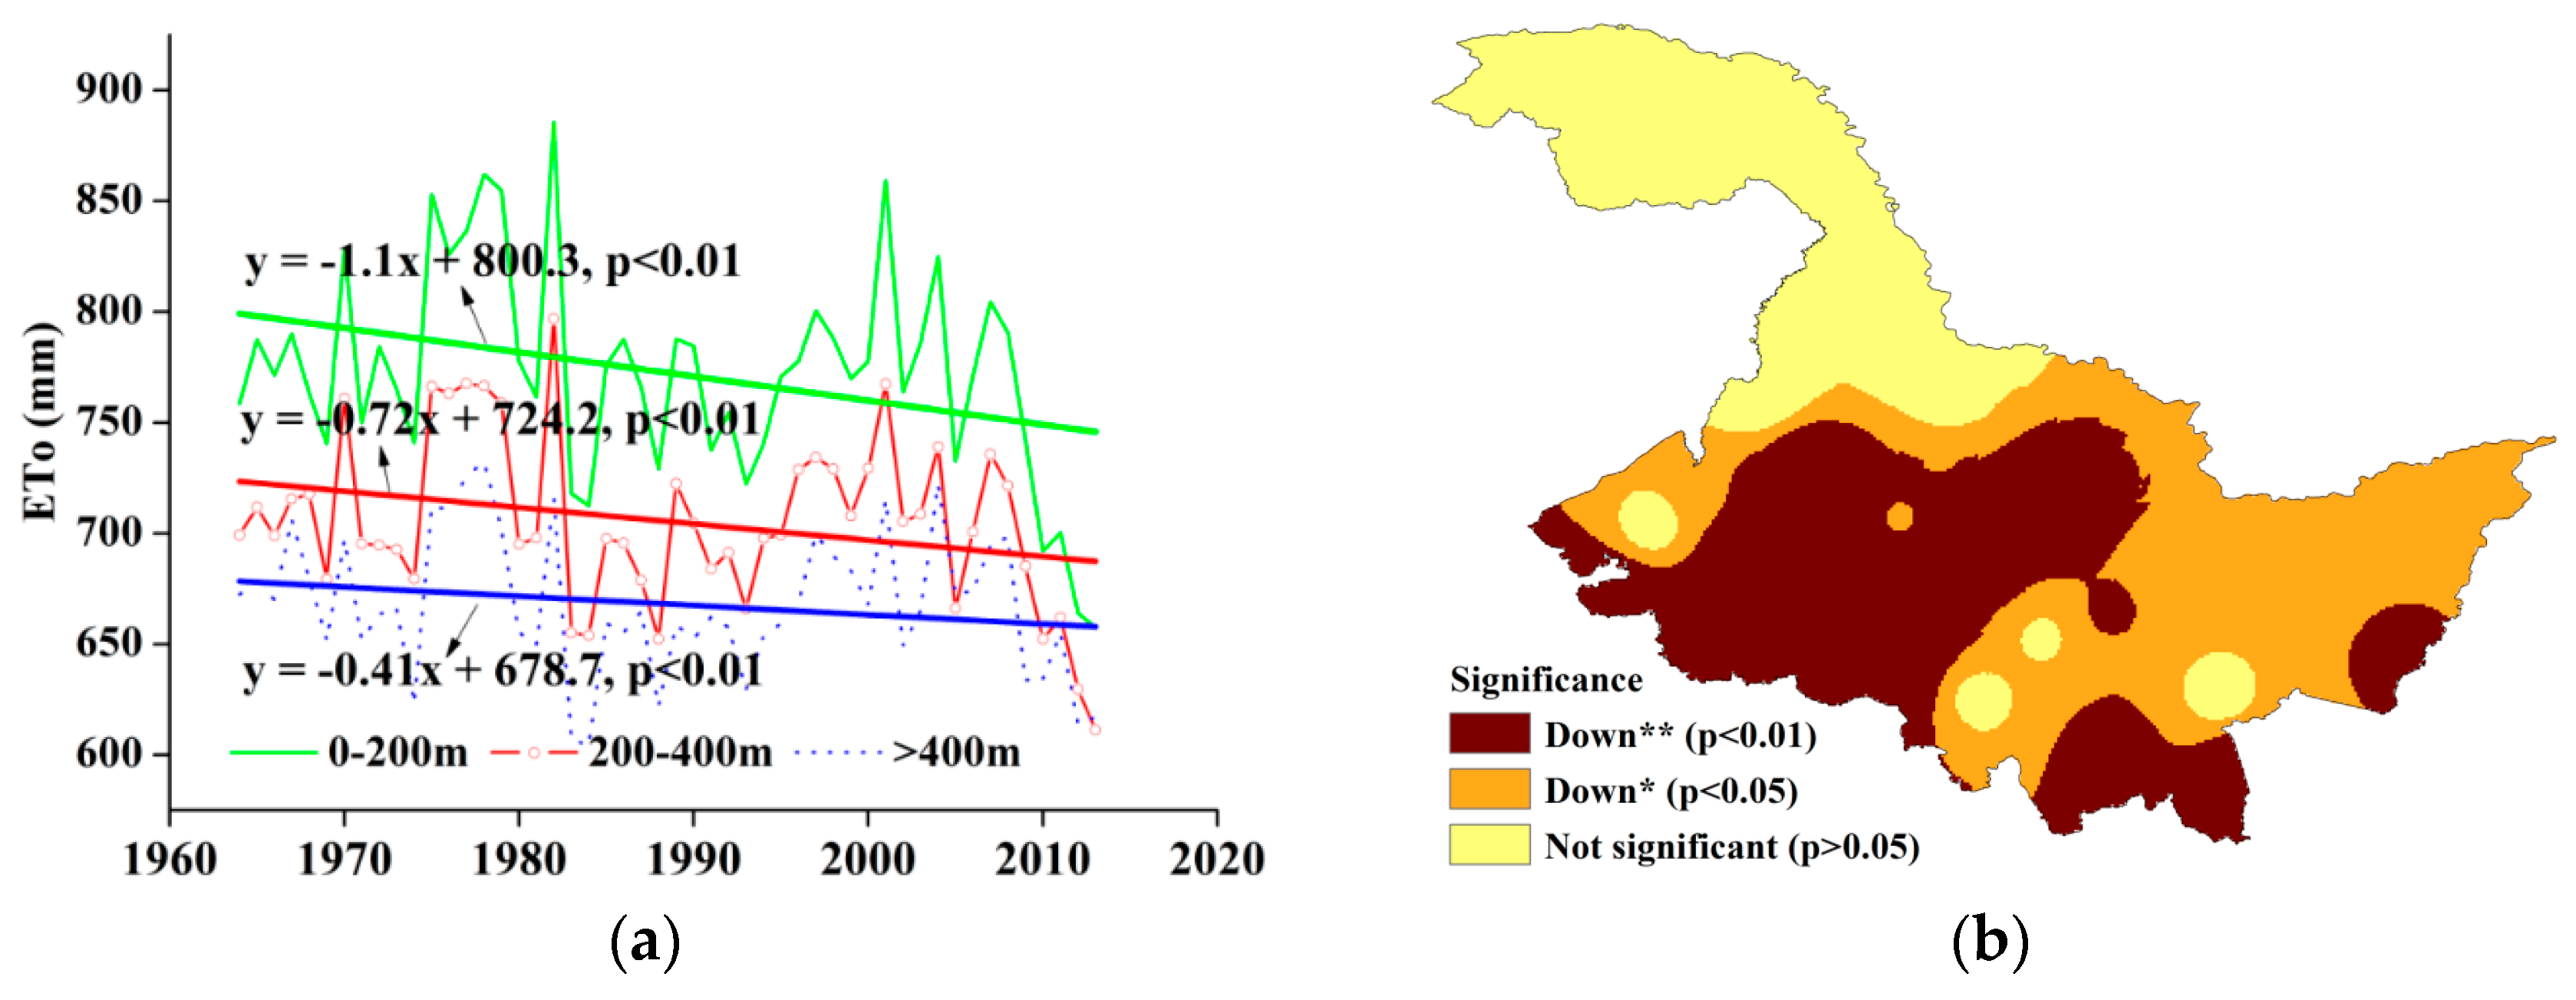
During 1964 to 2013, the average annual ET0 in Heilongjiang Province varied from 722 mm to 633 mm, with a decreasing trend of 7.4 mm ever 10 years (Table 2). Furthermore, different decreasing trends were shown for different elevations (Figure 4a). The trend decreased trend with an increase of elevation (Table 2). The decreasing trend of ET0 was very significant (p < 0.01 or p < 0.05) for most regions from 0 to 400 m and not significant for the northern region above 400 m aor for a few local regions (Figure 4b).
Seasonally, the average ET0 varied from 264 mm to 221 mm in Spring, from 332 mm to 280 mm in Summer, from 144 mm to119 mm in Autumn, and from 40 mm to 31 mm in Winter, with a changing trend of ‒4.2 mm every 10 years, ‒2.7 mm every 10 years, and ‒1.1 mm every 10 years, and 0.6 mm every 10 years during the period from 1964 to 2013 in Heilongjiang Province, respectively (Table 3).
Furthermore, the same trend as for the annual ET0 occured for the ET0 during Spring and Summer, as shown for different elevations in Figure 5a and Figure 6a. The trend is declining with the increase of elevation (Table 3). The decreasing trend of ET0 is very significant (p < 0.01 or p < 0.05) for most regions from 0 to 400 m and not significant for a few local regions (Figure 5b and Figure 6b). A decreasing trend of ET0 in Autumn was shown from 0 to 400 m from 1964 to 2013. However, an increasing trend is shown above 400 m (Figure 7a). The decreasing trend of ET0 is significant (p < 0.05) for most regions from 0 to 400 m and very significant (p < 0.01) in a few local regions. However, no significant level is shown (Figure 7b). A tendency for ET0 to increase in Winter is shown for different elevations from 1964 to 2013 in Figure 8a. In addition, it is worth noting that the trend is most obvious for the region above 400 m, with an increasing trend 0.9 mm every 10 years (Figure 8b).
3.3. Sensitivity Analysis of ET0 with Climatic Factors
Climatic factors, including wind speed (WS), maximum and minimum temperature (Tmax and Tmin), sunshine duration (SD), and relative humidity (RH), in Heilongjiang Province showed a clear association with elevation change. The average WS, Tmax, Tmin, and SD all had a decreasing trend from the low elevation plain area to the high elevation mountainous area in the province across the four seasons (Table 4). By contrast, the average relative humidity (RH) had a reverse relation with elevation. With respect to the seasonal patterns at different elevations, the variation of the meteorological factors in Winter was complex. The average Tmax and SD in Winter showed a decreasing trend as the elevation increased. The average WS and Tmin in Winter showed a tendency to decrease first and then to increase with increasing elevation. However, the average RH in Winter showed a tendency to increase first and then to decrease (Table 4).
The variation of interannual and seasonal WS, Tmax, Tmin, SD, and RH showed a complex trend from 1964 to 2013 at different elevations in Heilongjiang Province. The change of Tmin was most significant, and the change of SD was not significant at different elevations (Table 5).
The correlation coefficients between ET0 and the other meteorological factors (WS, Tmax, Tmin, SD, and RH) was calculated in the interannual category, Spring, Summer, Autumn, and Winter from 1964 to 2013 at different elevations in Heilongjiang Province, northeast China (Table 6). The most relevant meteorological factor to ET0 for Heilongjiang Province was RH annually and in Spring, Summer, and Autumn and Tmax in Winter. In addition, the most relevant meteorological factor changed for different elevations, i.e., on the annual scale the most sensitive meteorological factor was RH in the elevation range of 0 m to 200 m and above 400 m but SD in the elevation range of 200 m to 400 m.
On an annual scale, the most sensitive variable was RH, followed by Tmax at different elevations in the whole of Heilongjiang Province. On the seasonal scale, the most sensitive variable was RH in Spring, Summer, Autumn and Tmax in Winter. In addition, WS also had a relatively large sensitivity coefficient on ET0, except in Winter. SD has a relatively large sensitivity coefficient on ET0 in Summer. There was no obvious pattern of change at different elevations, except that ET0’s sensitivity coefficients to Tmax and Tmin in Winter increased with increasing elevation (Table 7).
4. Discussion
In this study, we found a clear spatial pattern of ET0 in China’s far northern province. Across the high-latitude region, there was a decreasing trend of annual ET0 from the low elevation plain area to the high elevation mountainous area, which is more apparent in Spring, Summer, and Autumn. This may be attributed to a combined effect of temperature and precipitation variations since they are closely related to the topography and monsoon circulation in the region [18,35,46].
Similar to two recent studies [13,14], our study found that there was a significantly decreasing trend of annual ET0 in the typically high altitude region. The same trend was found in Spring, Summer, and Autumn. In addition, some studies that reported ET0 was significantly reduced in high altitude regions such as the Taoer River Basin [47], the northwest of China [48], and so on. However, we found an increasing trend of ET0 in Winter. Furthermore, the higher the elevation, the more obvious the increasing trend (Figure 8a). In addition, as discussed in the introduction, ET0 has been found to respond differently in different geographical regions. One of reasons is that ET0 had different sensitivities to meteorological variables in different regions [43,49,50].
Our study showed that ET0 in Heilongjiang was sensitive to the key meteorological variables and the sensitivity varies depending on the season. ET0 in Spring, Summer, and Autumn was most sensitive to relative humidity in high altitude region. However, ET0 was most sensitive to Tmax in the wintertime, followed by Tmin. These findings differ from previous studies [13,51] on evapotranspiration across China, which reported that ET0 was only sensitive to relative humidity in northeast China. There was a significantly increased trend (p < 0.05) in winter Tmax (Figure 9a) and a very significantly increased trend in winter Tmin, which was almost double the Tmax (p < 0.01) (Figure 9b) at different elevations in Heilongjiang Province.
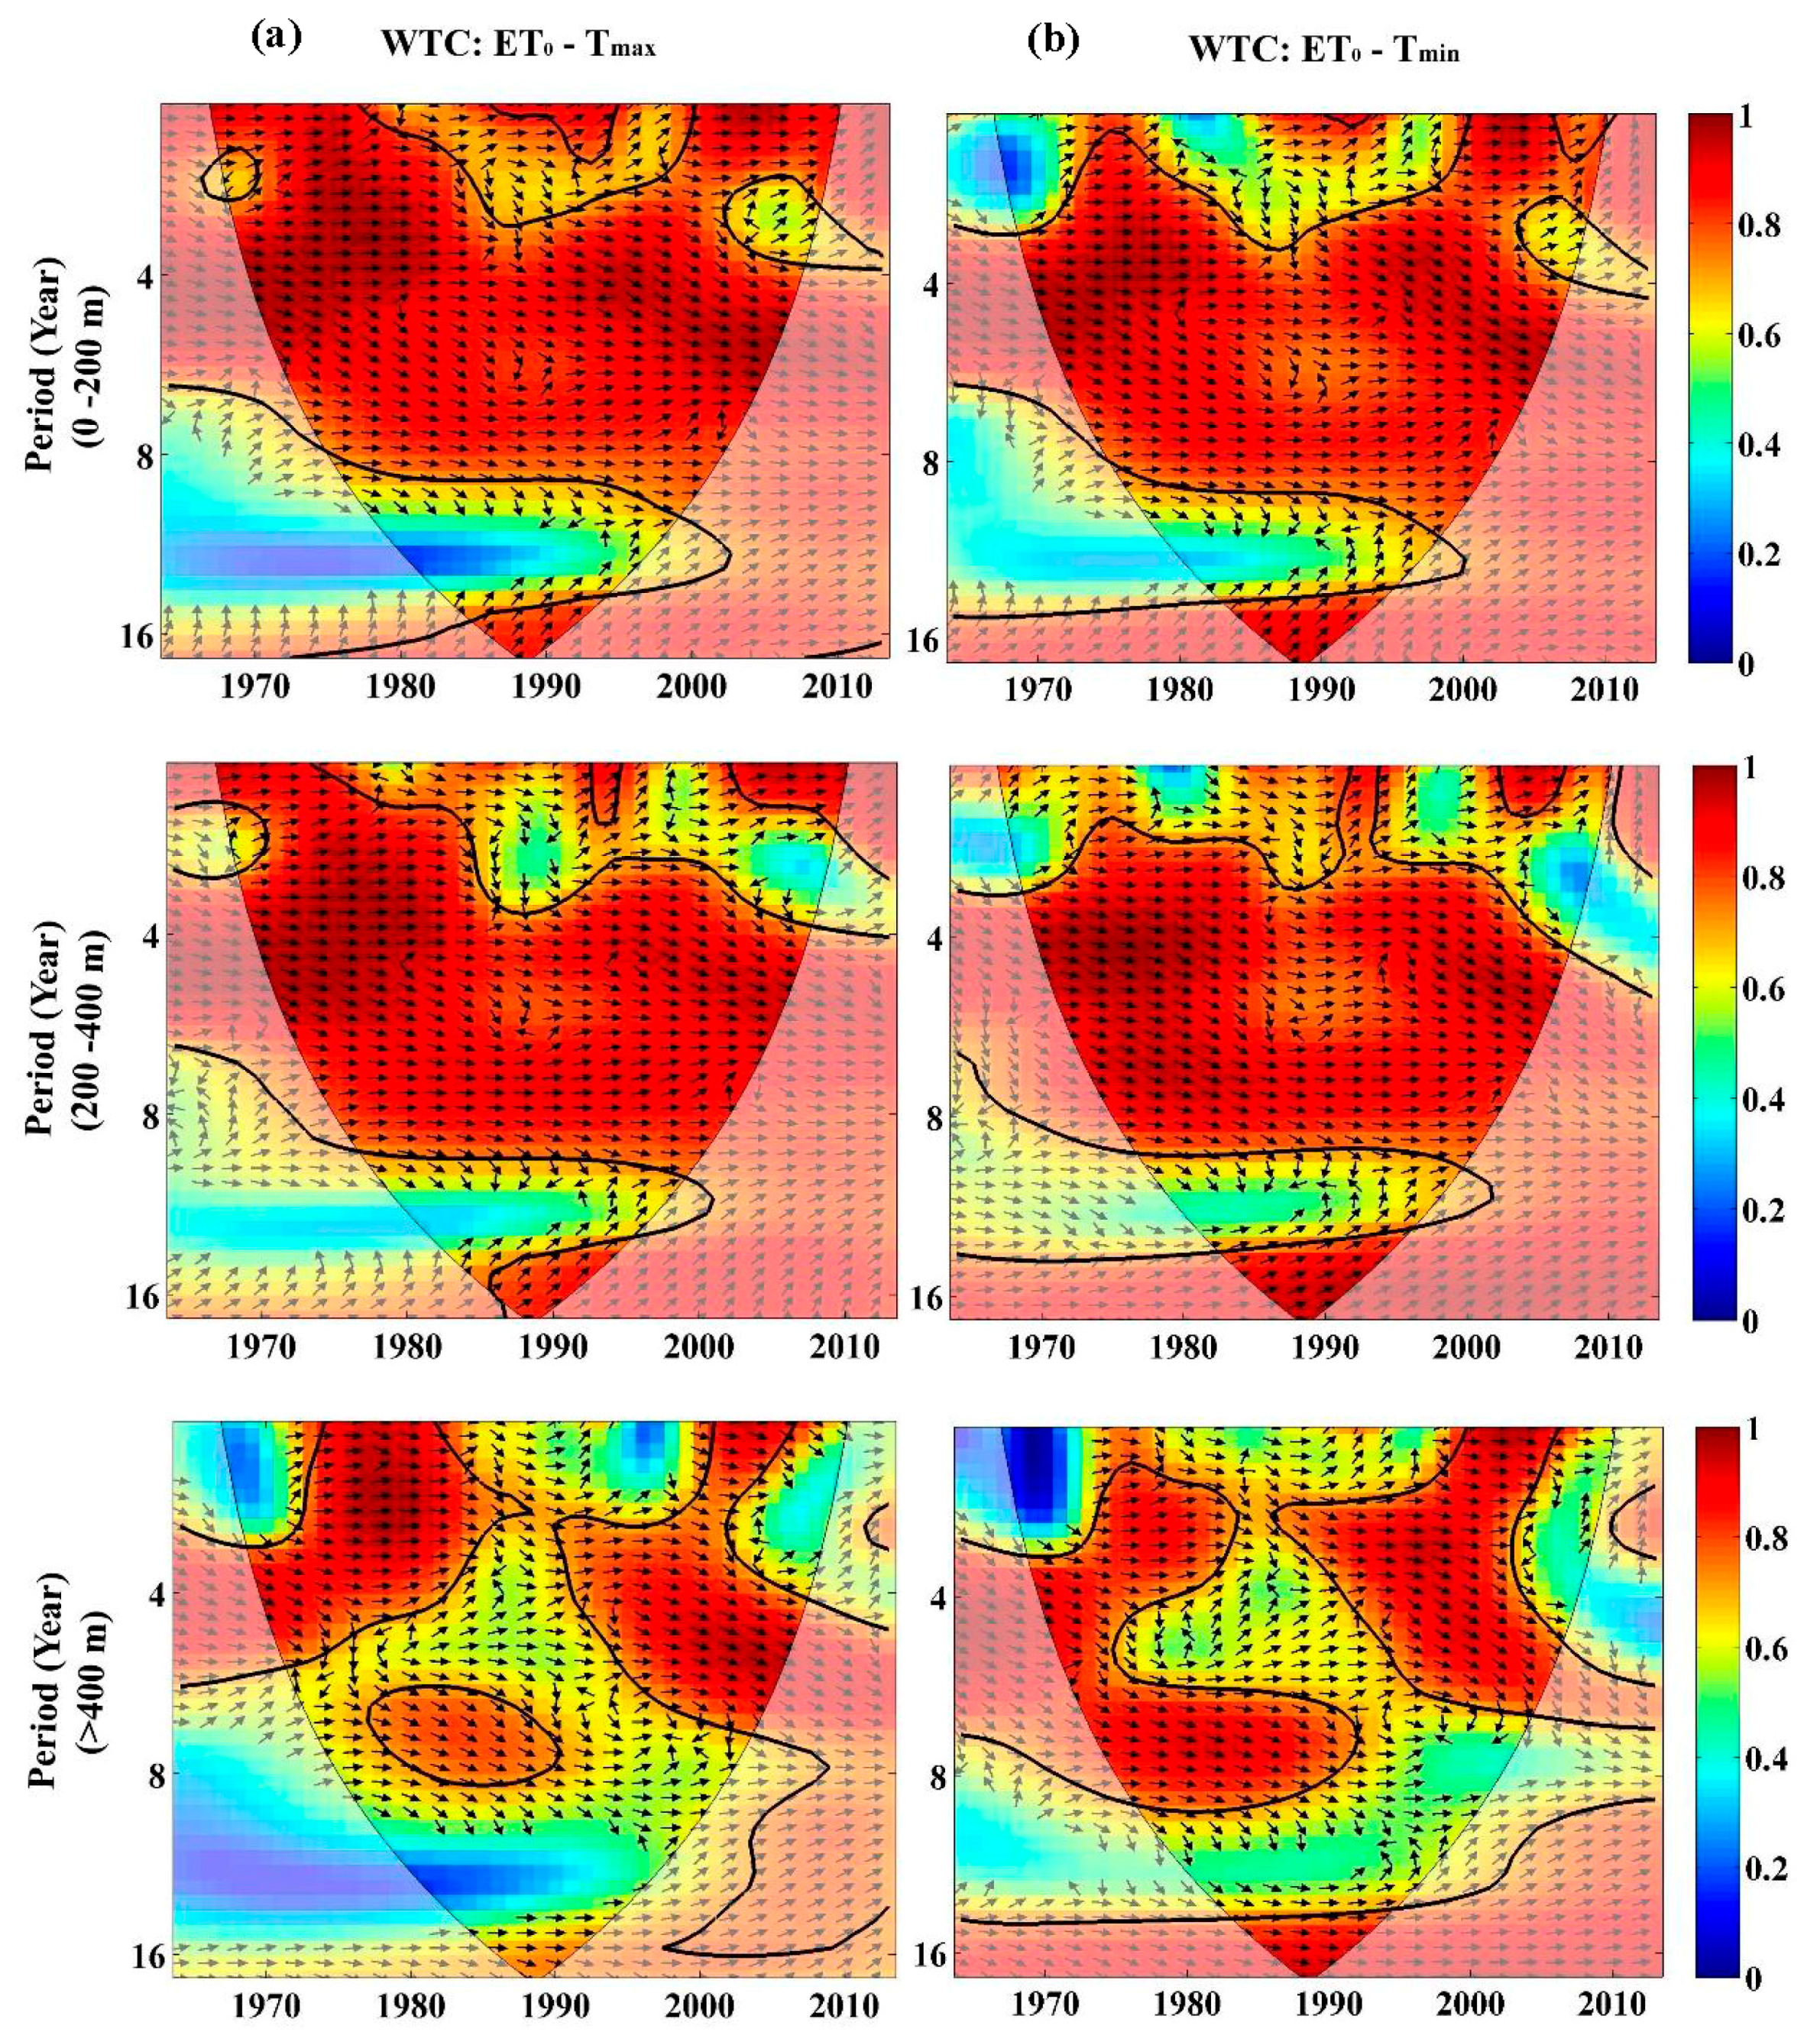
In order to determine how winter temperatures affect ET0 specifically, we applied wavelet coherence (WTC). ET0 has a correlation of a 0.05 significance level with Tmax (Figure 10a) and Tmin (Figure 10b) in Winter on a time scale of up to nine years or three to nine years for the areas below 400 m a.s.l. from 1964 to 2013. The time scale of significance correlation was complex above 400 m a.s.l. As shown in the Figure 10a,b, there were correlations of a 0.05 significance level in a time scale of up to five years from 1970 to 1985, six to eight years from 1976 to 1990, and up to seven years from 1990 to 2005. In addition, all these areas showed an in-phase (the arrow pointed to the right), which indicated that Tmax and Tmin had a strong effect on winter ET0 at this time scale. This explained why ET0 in winter has had an increasing trend in the past five decades, and we expect that the trend will continue in the future as climate change persists, which could worsen spring droughts and irrigation management for semi-arid areas in the province.
Some uncertainty may exist in estimating reference evapotranspiration rates with the Penman-Monteith equation. However, due to the lack of actual pan evapotranspiration measurements in this region, we were unable to quantify possible error estimates. Despite the uncertainties and limitations, our study sheds light on the spatiotemporal variation of ET0 and its sensitivity to meteorological variables at different elevations in the highest latitude region of China. Future studies are needed to constrain the uncertainties and refine ET0 estimation for different land use types and crop cultivations.
5. Summary and Conclusions
This study analyzed the spatiotemporal variation of seasonal and interannual reference evapotranspiration in China’s far northern region, Heilongjiang Province, at different elevations from 1964 to 2013. Based on the findings, the following conclusions can be drawn:
- (1)
- Reference evapotranspiration in Heilongjiang Province has decreased in the past five decades during all seasons, except Winter. This is mainly a result of the steadily-increasing winter temperature in this higher-latitude region.
- (2)
- Elevation plays an important role in estimating reference evapotranspiration in Heilongjiang because of the greater sensitivity of transpiration to temperature in the higher-altitude region.
- (3)
- Over the past five decades, the greatest changes in Heilongjiang’s climate have occurred in relative humidity and temperatures (especially minimum temperature) during the winter months. Relative humidity is the most important meteorological factor that has affected the spatiotemporal variation of reference evapotranspiration in this province.
Acknowledgments
This research was supported by the Featured Institute Project 4, the Northeast Institute of Geography and Agroecology of the Chinese Academy of Sciences (Project number: IGA-135-05). During the preparation of the manuscript, Y. Jun Xu received funding support from a U.S. Department of Agriculture Hatch Fund project (project number: LAB94230).
Author Contributions
Peng Qi and Y. Jun Xu conceived the idea of the study and wrote the manuscript; Peng Qi carried out the data collection and analysis; Guangxin Zhang supervised the research project and contributed to the oversight of the data collection; Yanfeng Wu and Zongting Gao contributed valuable analysis and did a manuscript review; and all authors approved the final manuscript.
Conflicts of Interest
The authors declare no conflict of interest.
References
- Wever, L.A.; Flanagan, L.B.; Carlson, P.J. Seasonal and interannual variation in evapotranspiration, energy balance and surface conductance in a northern temperate grassland. Agric. For. Meteorol. 2002, 112, 31–49. [Google Scholar] [CrossRef]
- Jarvis, P.G.; McNaughton, K. Stomatal control of transpiration: Scaling up from leaf to region. Adv. Ecol. Res. 1986, 15, 1–49. [Google Scholar]
- Nam, W.-H.; Hong, E.-M.; Choi, J.-Y. Has climate change already affected the spatial distribution and temporal trends of reference evapotranspiration in South Korea? Agric. Water Manag. 2015, 150, 129–138. [Google Scholar] [CrossRef]
- Hatch, U.; Jagtap, S.; Jones, J.; Lamb, M. Potential Effects of Climate Change on Agricultural Water Use in the Southeast US. J. Am. Water Resour. Assoc. 1999, 35, 1551–1561. [Google Scholar] [CrossRef]
- Fisher, J.B.; Whittaker, R.J.; Malhi, Y. ET come home: Potential evapotranspiration in geographical ecology. Glob. Ecol. Biogeogr. 2011, 20, 1–18. [Google Scholar] [CrossRef]
- Katerji, N.; Rana, G. Crop reference evapotranspiration: A discussion of the concept, analysis of the process and validation. Water Resour. Manag. 2011, 25, 1581–1600. [Google Scholar] [CrossRef]
- Dadaser-Celik, F.; Cengiz, E.; Guzel, O. Trends in reference evapotranspiration in Turkey: 1975–2006. Int. J. Climatol. 2015, 38, S83. [Google Scholar] [CrossRef]
- Vicente-Serrano, S.M.; Azorin-Molina, C.; Sanchez-Lorenzo, A.; Revuelto, J.; Morán-Tejeda, E.; López-Moreno, J.I.; Espejo, F. Sensitivity of reference evapotranspiration to changes in meteorological parameters in Spain (1961–2011). Water Resour. Res. 2015, 50, 8458–8480. [Google Scholar] [CrossRef]
- Schuur, E.; McGuire, A.; Schädel, C.; Grosse, G.; Harden, J.; Hayes, D.; Hugelius, G.; Koven, C.; Kuhry, P.; Lawrence, D. Climate change and the permafrost carbon feedback. Nature 2015, 520, 171–179. [Google Scholar] [CrossRef] [PubMed]
- Lawrimore, J.H.; Peterson, T.C. Pan evaporation trends in dry and humid regions of the United States. J. Hydrometeorol. 2000, 1, 543–546. [Google Scholar] [CrossRef]
- Burn, D.H.; Hesch, N.M. Trends in evaporation for the Canadian Prairies. J. Hydrol. 2007, 336, 61–73. [Google Scholar] [CrossRef]
- Goyal, R. Sensitivity of evapotranspiration to global warming: A case study of arid zone of Rajasthan (India). Agric. Water Manag. 2004, 69, 1–11. [Google Scholar] [CrossRef]
- Liu, C.; Zhang, D. Temporal and spatial change analysis of the sensitivity of potential evapotranspiration to meteorological influencing factors in China. Acta Geogr. Sin. 2011, 66, 579–588. [Google Scholar]
- Zheng, C.; Wang, Q. Spatiotemporal pattern of the global sensitivity of the reference evapotranspiration to climatic variables in recent five decades over China. Stoch. Environ. Res. Risk Assess. 2015, 29, 1937–1947. [Google Scholar] [CrossRef]
- Temesgen, B.; Eching, S.; Davidoff, B.; Frame, K. Comparison of some reference evapotranspiration equations for California. J. Irrig. Drain. Eng-ASCE 2005, 131, 73–84. [Google Scholar] [CrossRef]
- Milly, P.; Dunne, K. Trends in evaporation and surface cooling in the Mississippi River basin. Geophys. Res. Lett. 2001, 28, 1219–1222. [Google Scholar] [CrossRef]
- Tabari, H.; Marofi, S.; Aeini, A.; Talaee, P.H.; Mohammadi, K. Trend analysis of reference evapotranspiration in the western half of Iran. Agric. For. Meteorol. 2011, 151, 128–136. [Google Scholar] [CrossRef]
- Fan, Z.-X.; Thomas, A. Spatiotemporal variability of reference evapotranspiration and its contributing climatic factors in Yunnan Province, SW China, 1961–2004. Clim. Chang. 2013, 116, 309–325. [Google Scholar] [CrossRef]
- Shan, N.; Shi, Z.; Yang, X.; Gao, J.; Cai, D. Spatiotemporal trends of reference evapotranspiration and its driving factors in the Beijing-Tianjin Sand Source Control Project Region, China. Agric. For. Meteorol. 2015, 200, 322–333. [Google Scholar] [CrossRef]
- Roderick, M.L.; Farquhar, G.D. The cause of decreased pan evaporation over the past 50 years. Science 2002, 298, 1410–1411. [Google Scholar] [PubMed]
- Qian, Y.; Kaiser, D.P.; Leung, L.R.; Xu, M. More frequent cloud-free sky and less surface solar radiation in China from 1955 to 2000. Geophys. Res. Lett. 2006, 33. [Google Scholar] [CrossRef]
- McVicar, T.R.; Roderick, M.L.; Donohue, R.J.; Li, L.T.; Van Niel, T.G.; Thomas, A.; Grieser, J.; Jhajharia, D.; Himri, Y.; Mahowald, N.M. Global review and synthesis of trends in observed terrestrial near-surface wind speeds: Implications for evaporation. J. Hydrol. 2012, 416, 182–205. [Google Scholar] [CrossRef]
- Brutsaert, W.; Parlange, M. Hydrologic cycle explains the evaporation paradox. Nature 1998, 396, 30. [Google Scholar] [CrossRef]
- Intergovernmental Panel on Climate Change (IPCC). Climate Change (IPCC). Climate Change 2014: Synthesis Report. In Contribution of Working Groups I, II and III to the Fifth Assessment Report of the Intergovernmental Panel on Climate Change; Pachauri, R.K., Meyer, L.A., Eds.; Core Writing Team; IPCC: Geneva, Switzerland, 2014; p. 151. [Google Scholar]
- Li, F.; Zhang, G.; Xu, Y.J. Spatiotemporal variability of climate and streamflow in the Songhua River Basin, Northeast China. J. Hydrol. 2014, 514, 53–64. [Google Scholar] [CrossRef]
- Ma, Q.; Zhang, J.; Sun, C.; Guo, E.; Zhang, F.; Wang, M. Changes of Reference Evapotranspiration and Its Relationship to Dry/Wet Conditions Based on the Aridity Index in the Songnen Grassland, Northeast China. Water 2017, 9, 316. [Google Scholar] [CrossRef]
- Feng, Y.; Cui, N.; Zhao, L.; Gong, D.; Zhang, K. Spatiotemporal variation of reference evapotranspiration during 1954–2013 in Southwest China. Quat. Int. 2017, 441, 129–139. [Google Scholar] [CrossRef]
- Ye, X.; Li, X.; Liu, J.; Xu, C.Y.; Zhang, Q. Variation of reference evapotranspiration and its contributing climatic factors in the Poyang Lake catchment, China. Hydrol. Process. 2014, 28, 6151–6162. [Google Scholar] [CrossRef]
- Nam, W.-H.; Choi, J.-Y.; Yoo, S.-H.; Engel, B. A real-time online drought broadcast system for monitoring soil moisture index. KSCE J. Civ. Eng. 2012, 16, 357–365. [Google Scholar] [CrossRef]
- Nam, W.-H.; Choi, J.-Y.; Yoo, S.-H.; Jang, M.-W. A decision support system for agricultural drought management using risk assessment. Paddy Water Environ. 2012, 10, 197–207. [Google Scholar] [CrossRef]
- Gao, J.; Liu, Y. Climate warming and land use change in Heilongjiang Province, Northeast China. Appl. Geogr. 2011, 31, 476–482. [Google Scholar] [CrossRef]
- Heilongjiang Bureau of Statistics. A view of Food Industry Development in Heilongjiang Province. Unpublished work. 2015. [Google Scholar]
- Liu, W.; Cai, T.; Ju, C.; Fu, G.; Yao, Y.; Cui, X. Assessing vegetation dynamics and their relationships with climatic variability in Heilongjiang province, Northeast China. Environ. Earth Sci. 2011, 64, 2013–2024. [Google Scholar] [CrossRef]
- Allen, R.G.; Pereira, L.S.; Raes, D.; Smith, M. Crop evapotranspiration—Guidelines for computing crop water requirements—FAO Irrigation and drainage paper 56. FAO Rome 1998, 300, D05109. [Google Scholar]
- Raziei, T.; Pereira, L.S. Spatial variability analysis of reference evapotranspiration in Iran utilizing fine resolution gridded datasets. Agric. Water Manag. 2013, 126, 104–118. [Google Scholar] [CrossRef]
- Chuanyan, Z.; Zhongren, N.; Guodong, C. Methods for modelling of temporal and spatial distribution of air temperature at landscape scale in the southern Qilian mountains, China. Ecol. Model. 2005, 189, 209–220. [Google Scholar] [CrossRef]
- Tong, L.; Kang, S.; Zhang, L. Temporal and spatial variations of evapotranspiration for spring wheat in the Shiyang river basin in northwest China. Agric. Water Manag. 2007, 87, 241–250. [Google Scholar] [CrossRef]
- Vousoughi, F.D.; Dinpashoh, Y.; Aalami, M.T.; Jhajharia, D. Trend analysis of groundwater using non-parametric methods (case study: Ardabil plain). Stoch. Environ. Res. Risk Assess. 2013, 27, 547–559. [Google Scholar] [CrossRef]
- Aziz, O.I.A.; Burn, D.H. Trends and variability in the hydrological regime of the Mackenzie River Basin. J. Hydrol. 2006, 319, 282–294. [Google Scholar] [CrossRef]
- Yue, S.; Pilon, P.; Phinney, B.; Cavadias, G. The influence of autocorrelation on the ability to detect trend in hydrological series. Hydrol. Process. 2002, 16, 1807–1829. [Google Scholar] [CrossRef]
- Kumar, S.; Merwade, V.; Kam, J.; Thurner, K. Streamflow trends in Indiana: Effects of long term persistence, precipitation and subsurface drains. J. Hydrol. 2009, 374, 171–183. [Google Scholar] [CrossRef]
- Smajstrla, A.; Zazueta, F.; Schmidt, G. Sensitivity of potential evapotranspiration to four climatic variables in Florida. Proc. Soil Crop Sci. Soc. Fla. (USA) 1987, 46, 21–26. [Google Scholar]
- Irmak, S.; Payero, J.O.; Martin, D.L.; Irmak, A.; Howell, T.A. Sensitivity analyses and sensitivity coefficients of standardized daily ASCE-Penman-Monteith equation. J. Irrig. Drain. Eng-ASCE 2006, 132, 564–578. [Google Scholar] [CrossRef]
- Torrence, C.; Compo, G.P. A practical guide to wavelet analysis. Bull. Am. Meteorol. Soc. 1998, 79, 61–78. [Google Scholar] [CrossRef]
- Grinsted, A.; Moore, J.C.; Jevrejeva, S. Application of the cross wavelet transform and wavelet coherence to geophysical time series. Nonlinear Process. Geophys. 2004, 11, 561–566. [Google Scholar] [CrossRef]
- Zongxing, L.; Qi, F.; Wei, L.; Tingting, W.; Yan, G.; Yamin, W.; Aifang, C.; Jianguo, L.; Li, L. Spatial and temporal trend of potential evapotranspiration and related driving forces in Southwestern China, during 1961–2009. Quat. Int. 2014, 336, 127–144. [Google Scholar] [CrossRef]
- Liang, L.; Li, L.; Liu, Q. Temporal variation of reference evapotranspiration during 1961–2005 in the Taoer River basin of Northeast China. Agric. For. Meteorol. 2010, 150, 298–306. [Google Scholar] [CrossRef]
- Huo, Z.; Dai, X.; Feng, S.; Kang, S.; Huang, G. Effect of climate change on reference evapotranspiration and aridity index in arid region of China. J. Hydrol. 2013, 492, 24–34. [Google Scholar] [CrossRef]
- Gong, L.; Xu, C.-Y.; Chen, D.; Halldin, S.; Chen, Y.D. Sensitivity of the Penman—Monteith reference evapotranspiration to key climatic variables in the Changjiang (Yangtze River) basin. J. Hydrol. 2006, 329, 620–629. [Google Scholar] [CrossRef]
- Liu, Q.; Yang, Z.; Cui, B.; Sun, T. The temporal trends of reference evapotranspiration and its sensitivity to key meteorological variables in the Yellow River Basin, China. Hydrol. Process. 2010, 24, 2171–2181. [Google Scholar] [CrossRef]
- Song, X.; Zhu, K.; Lu, F.; Xiao, W. Spatial and temporal variation of reference evapotranspiration under climate change: A case study in the Sanjiang Plain, Northeast China. Hydrol. Res. 2017, 48, 1–14. [Google Scholar] [CrossRef]
Figure 1.
(a) Geographical locations and (b) land use types of the meteorological stations used in this study for Heilongjiang Province, northeast China.
Figure 1.
(a) Geographical locations and (b) land use types of the meteorological stations used in this study for Heilongjiang Province, northeast China.

Figure 2.
Spatial variation of annual average ET0 from 1964 to 2013 in Heilongjiang Province, northeast China.
Figure 2.
Spatial variation of annual average ET0 from 1964 to 2013 in Heilongjiang Province, northeast China.
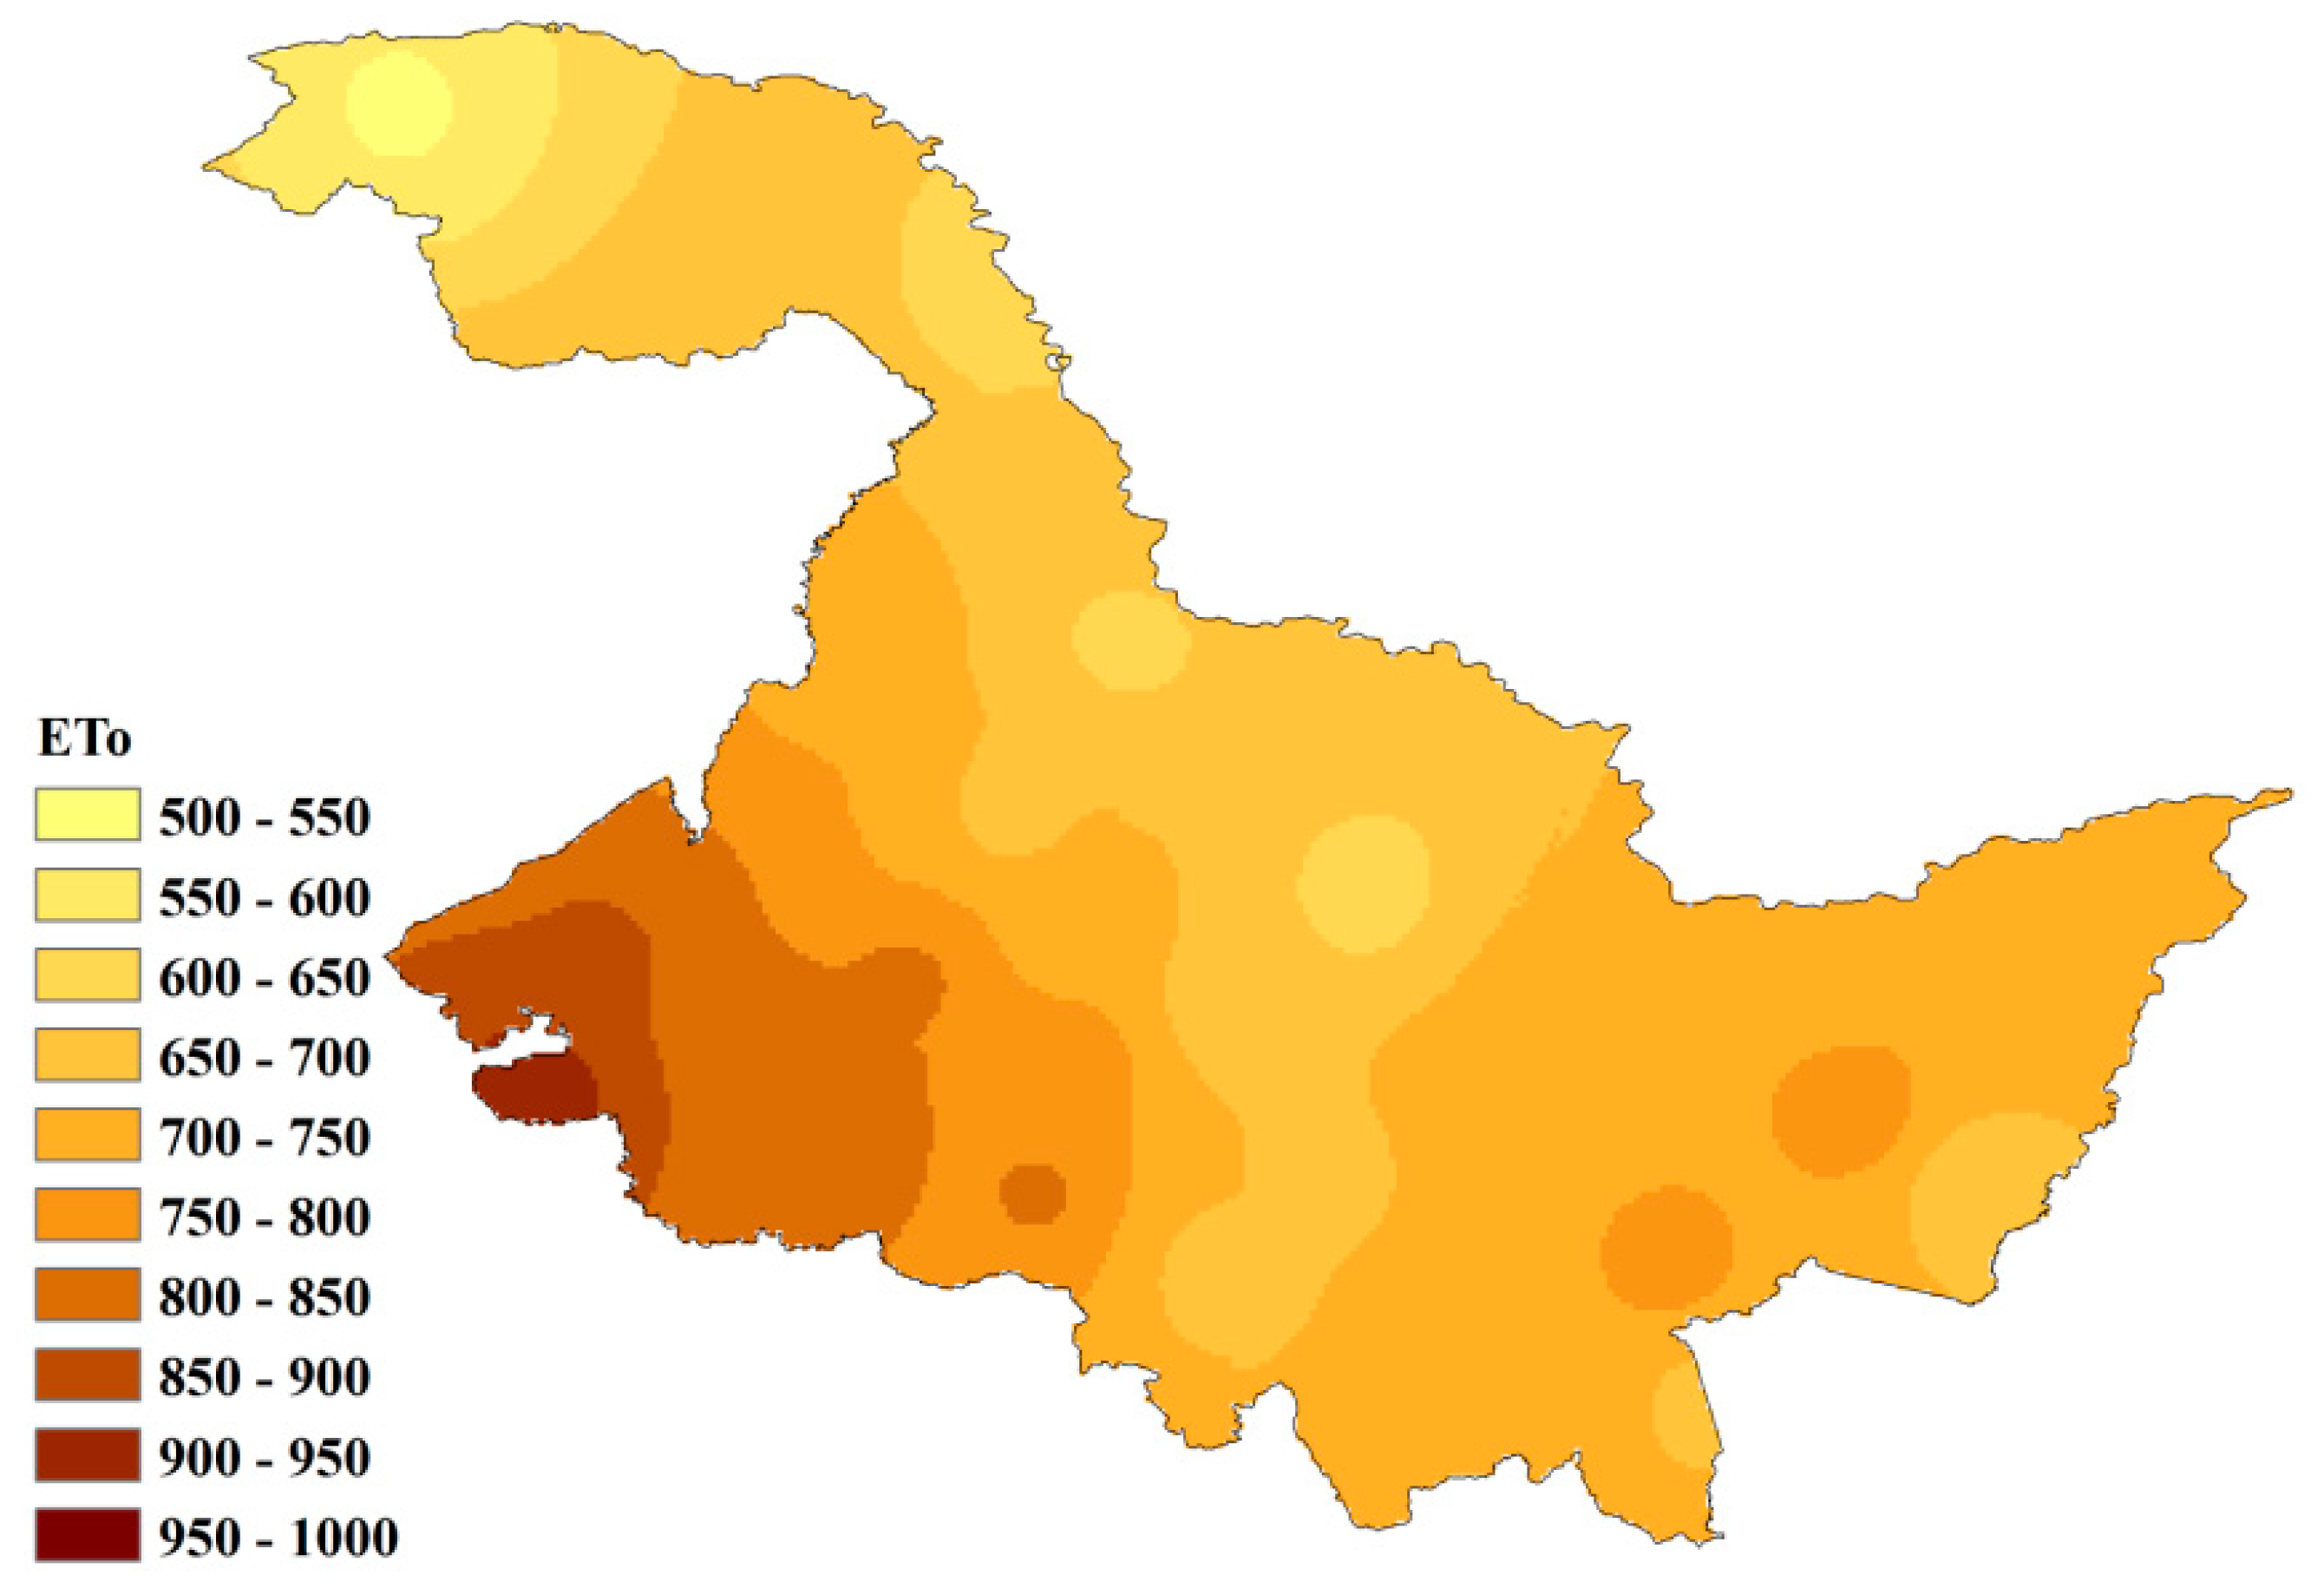
Figure 3.
Spatial variation of seasonal ET0 during 1964 to 2013 in Heilongjiang Province, northeast China. (a: spring; b: summer; c: autumn; d: winter).
Figure 3.
Spatial variation of seasonal ET0 during 1964 to 2013 in Heilongjiang Province, northeast China. (a: spring; b: summer; c: autumn; d: winter).
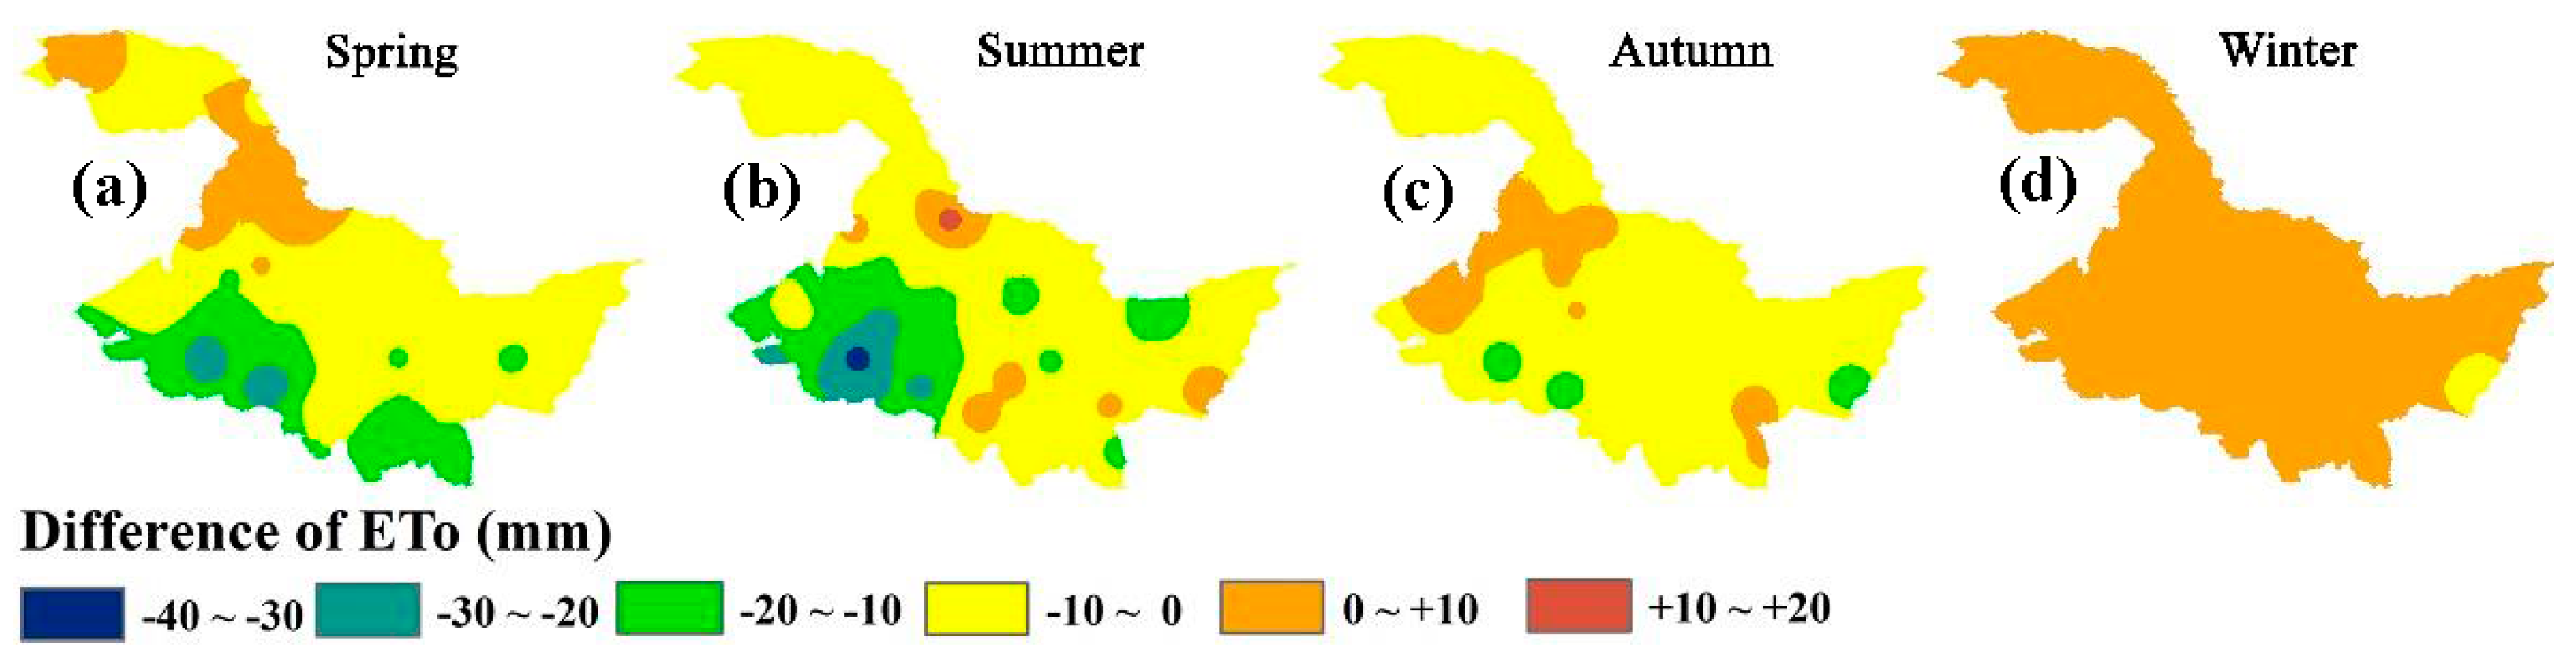
Figure 4.
(a) Temporal trends of interannual ET0 for different elevations during 1964 to 2013 and (b) the spatial pattern of the Modified Mann–Kendall (MMK) test in Heilongjiang Province, northeast China. Down ** indicates the decreasing trend at the 0.01 significance level, Down * indicates the decreasing trend at 0.05 significance level, and not significant means no significantly decreasing trend. (Green thick and solid line is the linear trend of ET0 at 0–200 m, the Red thick and solid line is the linear trend of ET0 at 200–400 m, Blue thick and solid line is the linear trend of ET0 at >400 m).

Figure 5.
(a) Temporal trends of spring ET0 for different elevations from 1964 to 2013 and (b) spatial pattern of MMK test in Heilongjiang Province, northeast China. Down ** indicates the decreasing trend at the 0.01 significance level, Down * indicates the decreasing trend at 0.05 significance level, and not significant means no significantly decreasing trend. (Green thick and solid line is the linear trend of ET0 at 0–200 m, the Red thick and solid line is the linear trend of ET0 at 200–400 m, Blue thick and solid line is the linear trend of ET0 at >400 m).
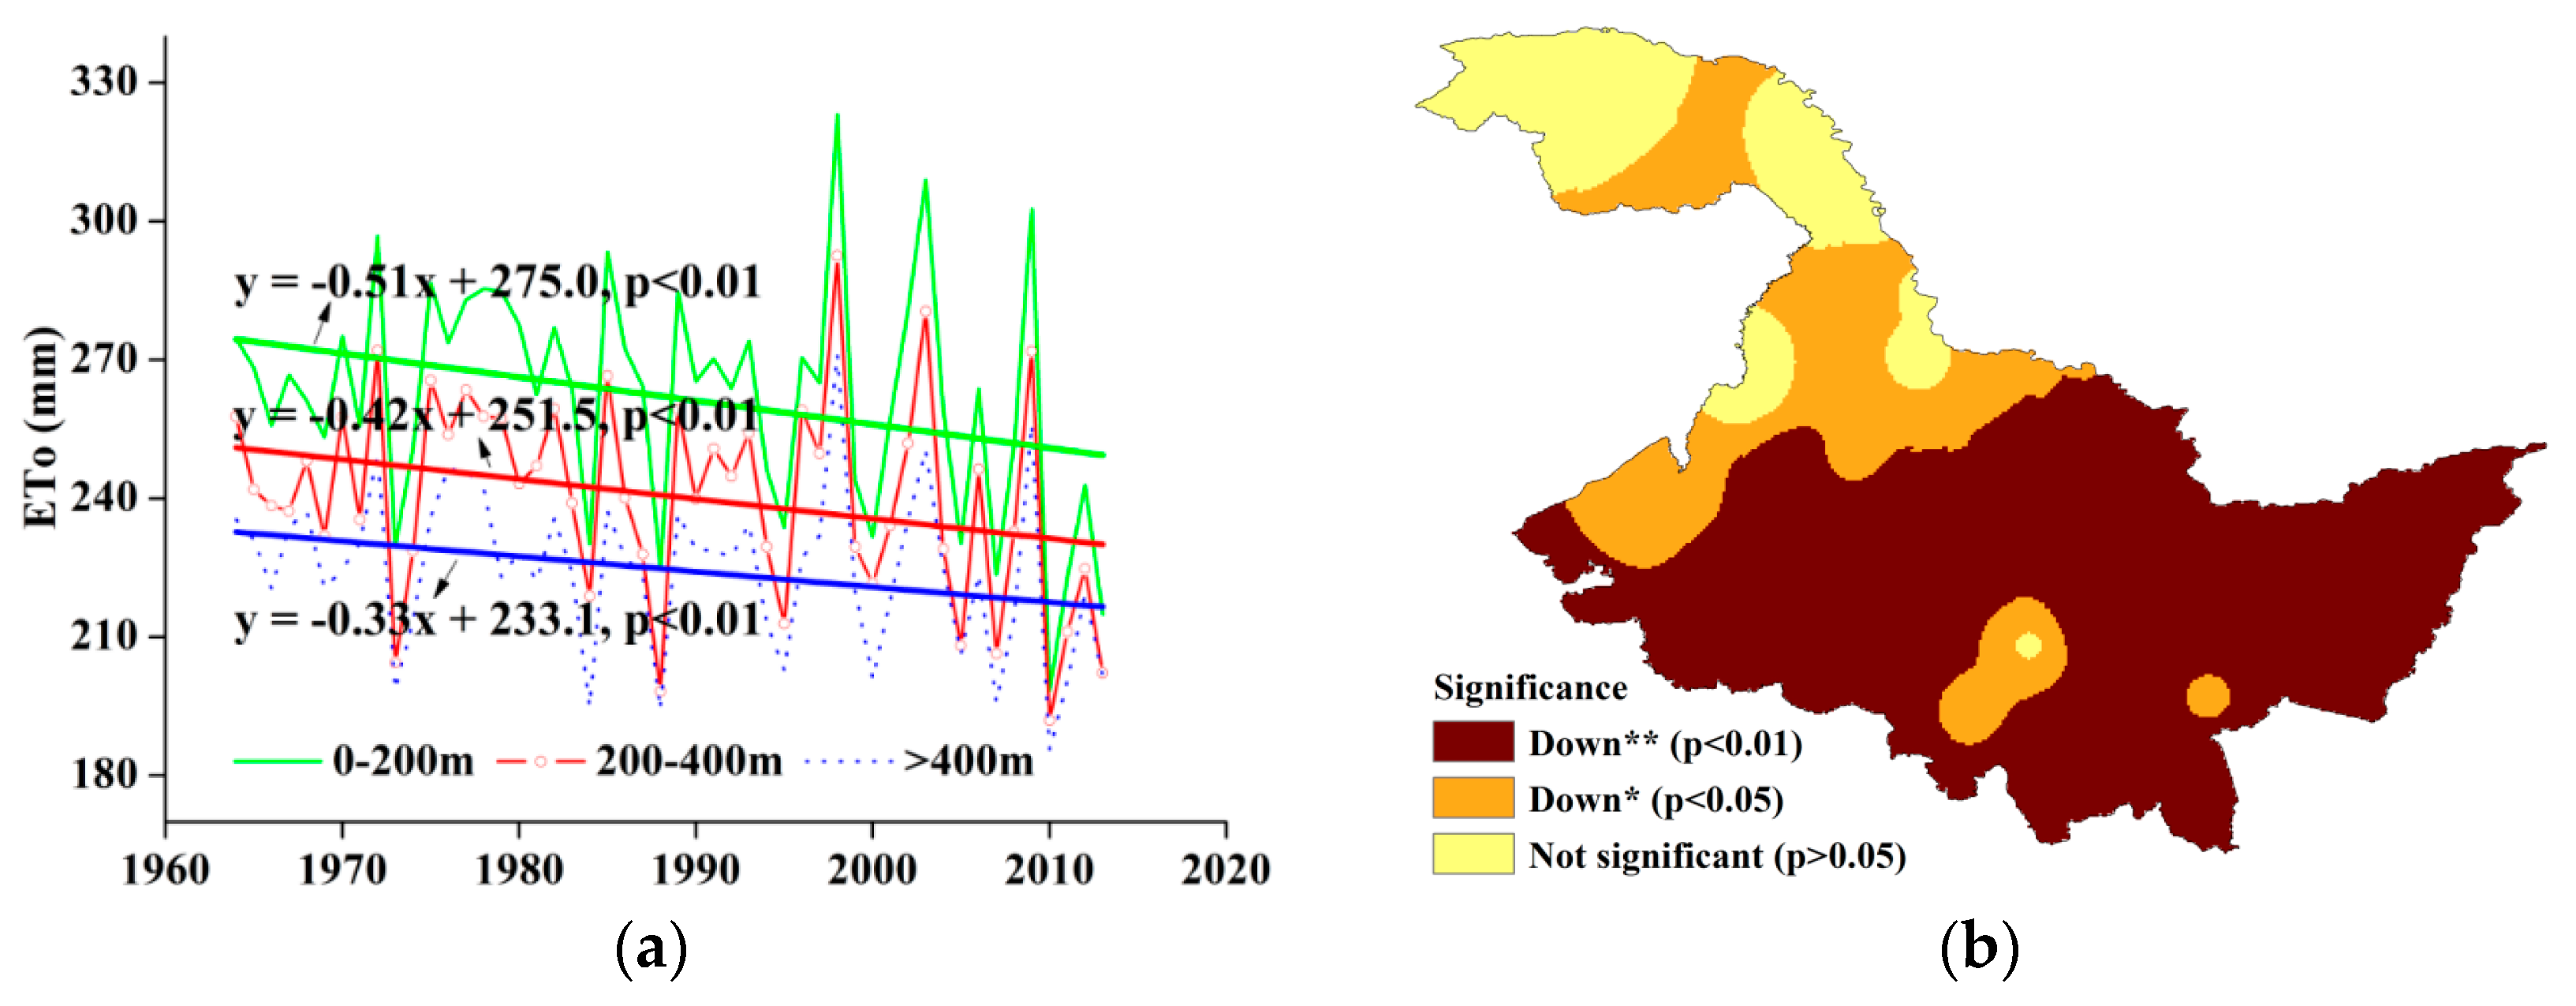
Figure 6.
(a) Temporal trends of summer ET0 for different elevations from 1964 to 2013 and (b) spatial pattern of MMK test in Heilongjiang Province, northeast China. Down ** indicates the decreasing trend at the 0.01 significance level, Down * indicates the decreasing trend at 0.05 significance level, and not significant means no significantly decreasing trend. (Green thick and solid line is the linear trend of ET0 at 0–200 m, the Red thick and solid line is the linear trend of ET0 at 200–400 m, Blue thick and solid line is the linear trend of ET0 at >400 m).

Figure 7.
(a) Temporal trends of autumn ET0 for different elevations from 1964 to 2013 and (b) spatial pattern of MMK test in Heilongjiang Province, northeast China. Down ** indicates the decreasing trend at the 0.01 significance level, Down * indicates the decreasing trend at 0.05 significance level, and not significant means no significantly decreasing trend. (Green thick and solid line is the linear trend of ET0 at 0-200 m, the Red thick and solid line is the linear trend of ET0 at 200-400 m, Blue thick and solid line is the linear trend of ET0 at >400 m).
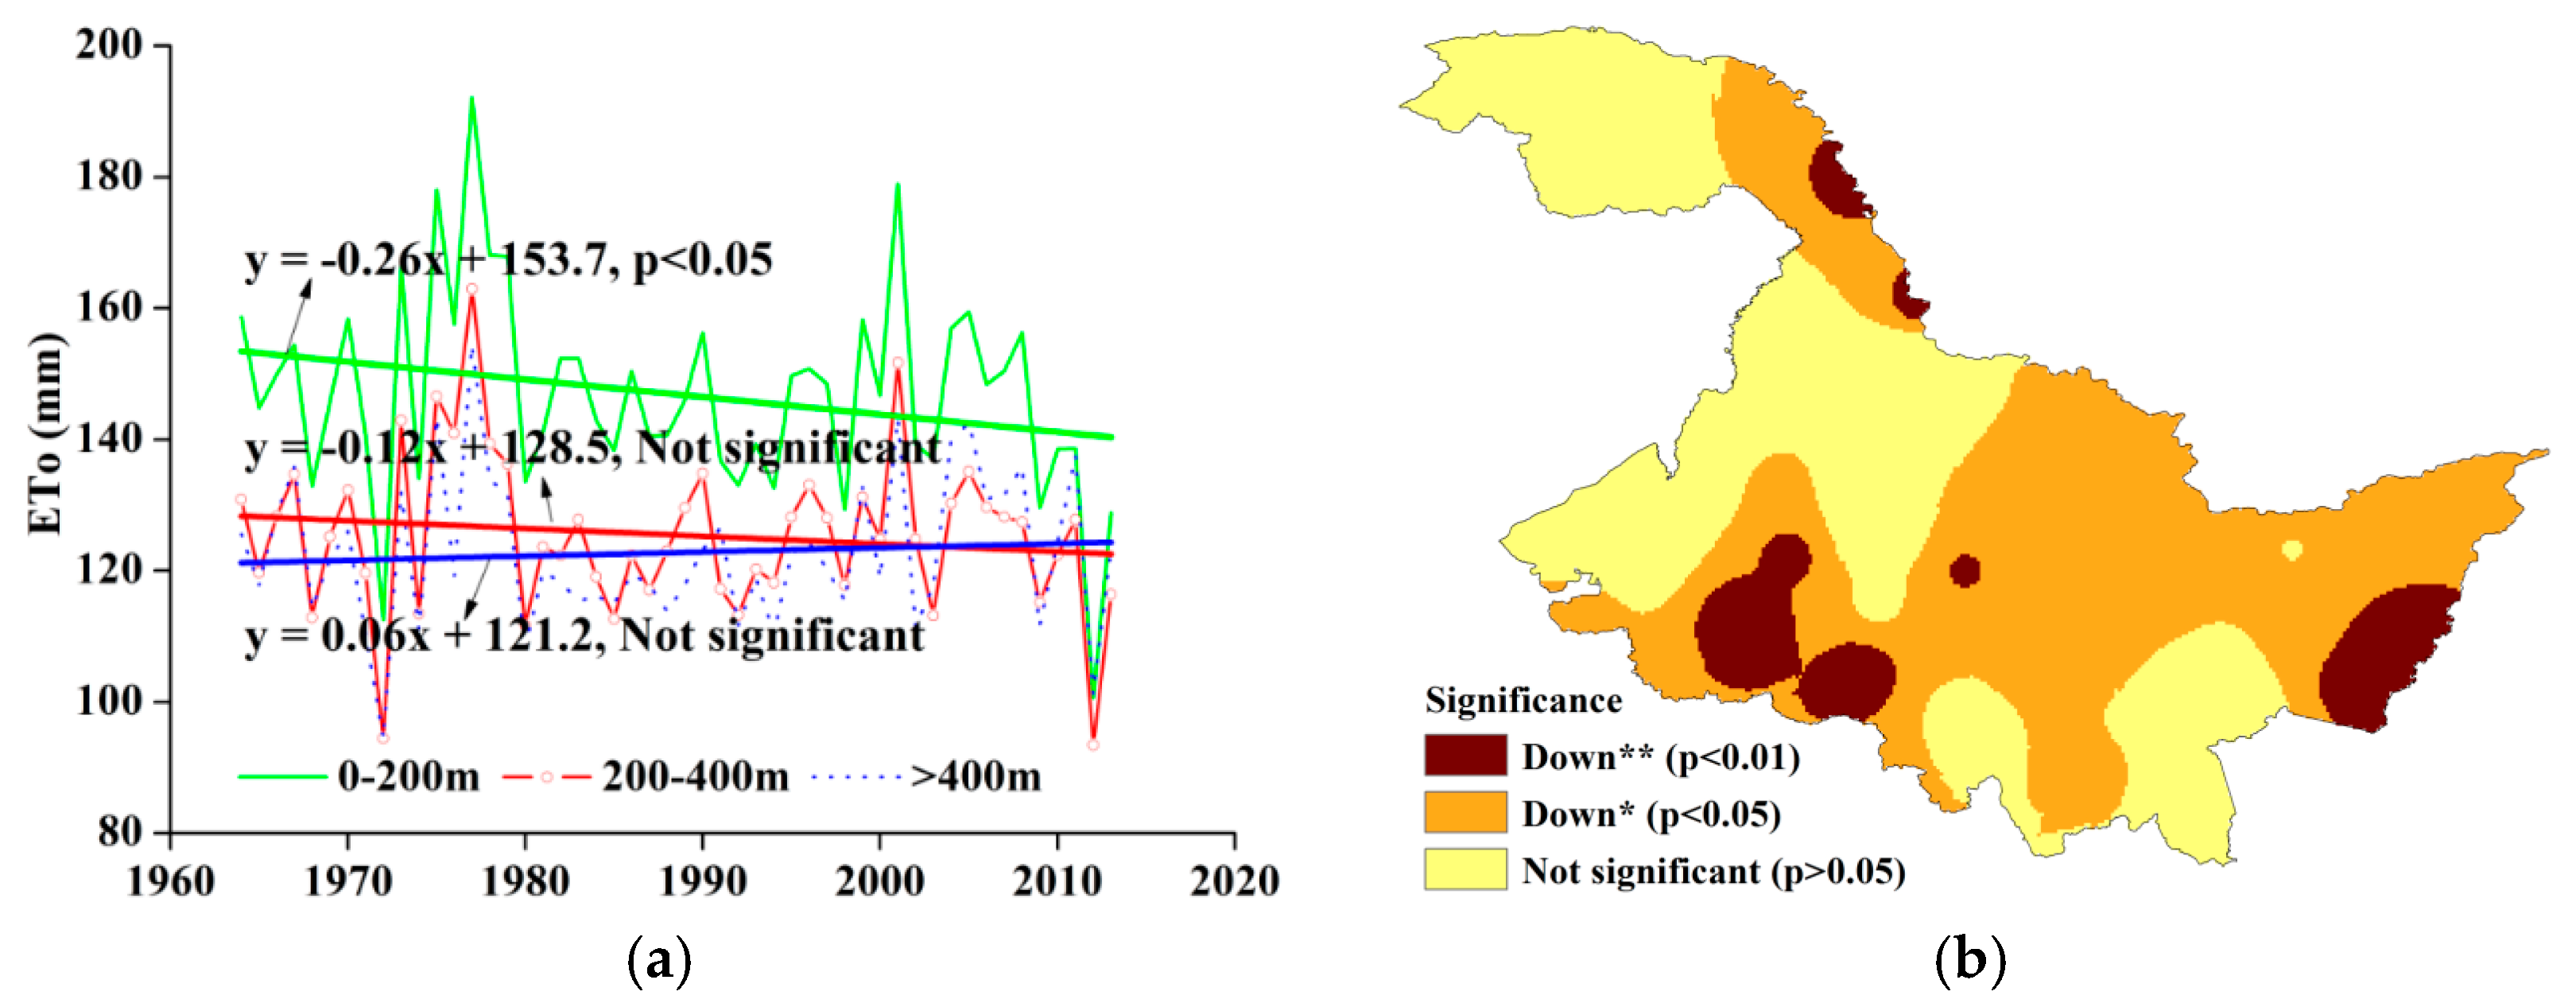
Figure 8.
(a) Temporal trends of winter ET0 for different elevations from 1964 to 2013 and (b) spatial pattern of MMK test in Heilongjiang Province, northeast China. Down ** indicates the decreasing trend at the 0.01 significance level, Down * indicates the decreasing trend at 0.05 significance level, and not significant means no significantly decreasing trend. (Green thick and solid line is the linear trend of ET0 at 0–200 m, the Red thick and solid line is the linear trend of ET0 at 200–400 m, Blue thick and solid line is the linear trend of ET0 at >400 m).

Figure 9.
Trend of (a) winter maximum temperature (Tmax), and (b) winter minimum temperature (Tmin) at different elevations from 1964 to 2013 in Heilongjiang Province, northeast China. As the change slopes show, winter Tmin increased much more than winter Tmax in China’s northernmost region. (Green thick and solid line is the linear trend of ET0 at 0–200 m, the Red thick and solid line is the linear trend of ET0 at 200–400 m, Blue thick and solid line is the linear trend of ET0 at >400 m).
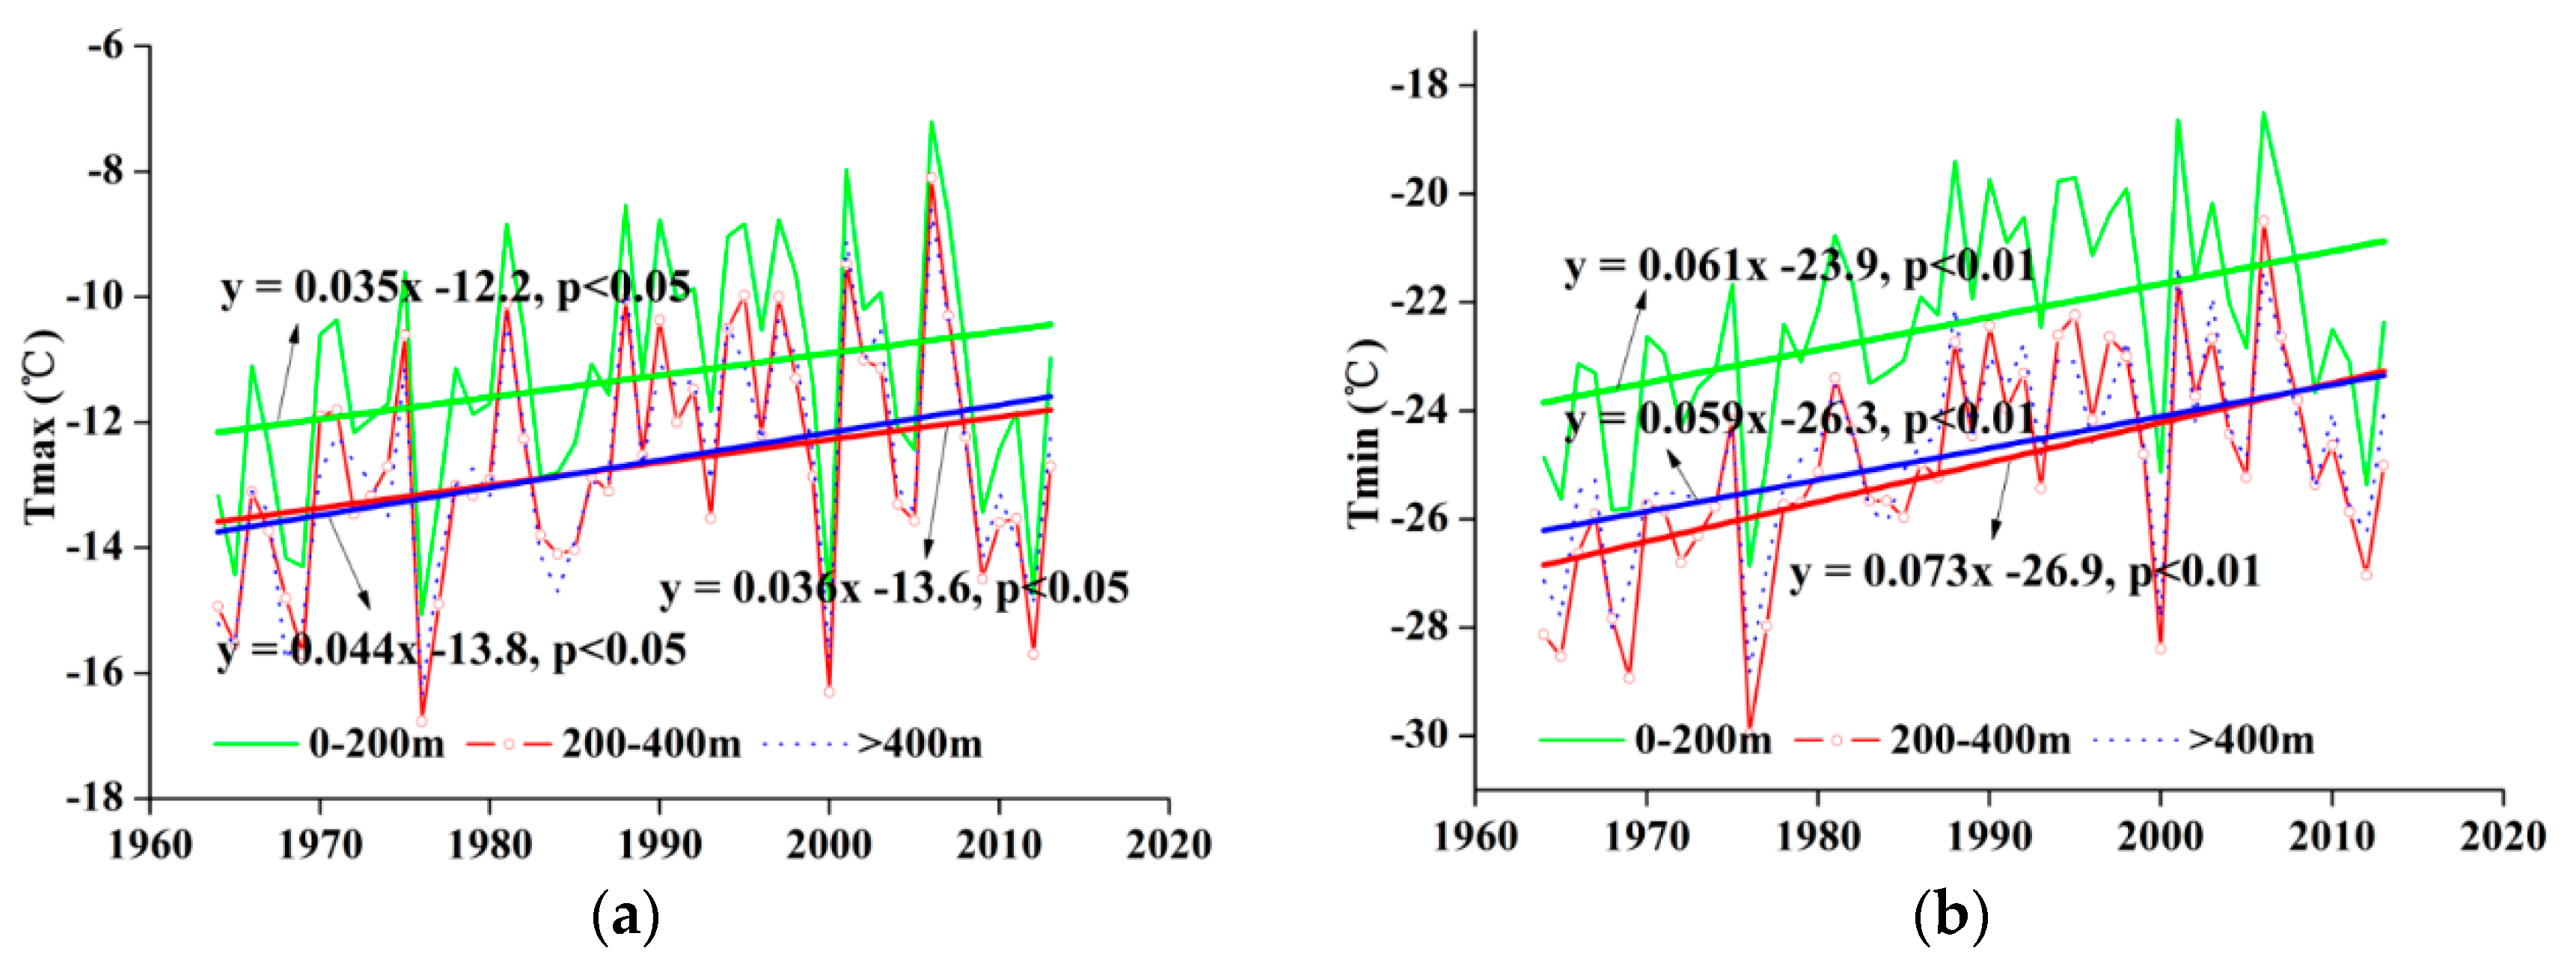
Figure 10.
The wavelet coherence (a) between winter ET0 and Tmax and (b) between winter ET0 and Tmin in Heilongjiang Province. A significance level of 5% against red noise is exhibited as a thick contour, and the relative phase relationship is denoted as arrows (with anti-phase pointing left and in-phase pointing right).

Table 1.
Geographical location and elevation of the 27 meteorological stations used in this study for estimating reference evapotranspiration for Heilongjiang Province, northeast China.
Table 1.
Geographical location and elevation of the 27 meteorological stations used in this study for estimating reference evapotranspiration for Heilongjiang Province, northeast China.
| Station | Latitude | Longitude | Elevation | Station | Latitude | Longitude | Elevation |
|---|---|---|---|---|---|---|---|
| Fujin | 47.23 | 131.98 | 66.4 | Huma | 51.72 | 126.65 | 201.4 |
| Jiamusi | 46.82 | 130.28 | 81.2 | Tieli | 46.98 | 128.02 | 210.5 |
| baoqing | 46.32 | 132.18 | 83 | Sunwu | 49.43 | 127.35 | 234.5 |
| Yilan | 46.30 | 129.58 | 100.1 | Keshan | 48.05 | 125.88 | 234.6 |
| Hulin | 45.77 | 132.97 | 100.2 | Hailun | 47.43 | 126.97 | 239.2 |
| Tonghe | 45.97 | 128.73 | 110.6 | Yichun | 47.73 | 128.92 | 240.9 |
| Harbin | 45.75 | 126.77 | 142.3 | Mudanjiang | 44.57 | 129.60 | 241.4 |
| Qiqihar | 47.38 | 123.92 | 147.1 | Nenjiang | 49.17 | 125.23 | 242.2 |
| Anda | 46.38 | 125.32 | 149.3 | Mingshui | 47.17 | 125.90 | 247.2 |
| Tailai | 46.40 | 123.42 | 149.5 | Beian | 48.7 | 126.4 | 347.2 |
| Fuyu | 47.80 | 124.48 | 162.7 | Jixi | 45.2 | 130.80 | 415.8 |
| Aihui | 50.25 | 127.45 | 153.4 | Mohe | 52.97 | 122.52 | 433.1 |
| Beilin | 46.62 | 126.97 | 179.6 | Suifenhe | 44.38 | 131.17 | 567.8 |
| Shangzhi | 45.22 | 127.97 | 189.7 |
Table 2.
Average ET0 (±std) of different seasons at different elevations in Heilongjiang Province, northeast China.
Table 2.
Average ET0 (±std) of different seasons at different elevations in Heilongjiang Province, northeast China.
| Variable | Elevation (m a.s.l.) | Annual | Spring | Summer | Autumn | Winter |
|---|---|---|---|---|---|---|
| ET0 (mm) | 0–200 | 772.5 ± 48.3 | 262.0 ± 25.2 | 324.5 ± 30.3 | 146.9 ± 15.9 | 39.2 ± 6.1 |
| 200–400 | 705.4 ± 38.5 | 240.6 ± 22.1 | 309.4 ± 26.3 | 125.5 ± 12.4 | 30.0 ± 4.0 | |
| >400 | 668.1 ± 31.8 | 224.7 ± 17.4 | 284.3 ± 22.4 | 122.8 ± 11.5 | 36.4 ± 4.5 | |
| Mean | 715.3 ± 38.4 | 242.4 ± 21.2 | 306.1 ± 25.8 | 131.7 ± 12.7 | 35.2 ± 4.7 |
Note: a.s.l. means above sea level.
Table 3.
Seasonal and interannual variation of ET0 from 1964 to 2013 at different elevations in Heilongjiang Province, Northeast China.
Table 3.
Seasonal and interannual variation of ET0 from 1964 to 2013 at different elevations in Heilongjiang Province, Northeast China.
| Variable | Elevation (m a.s.l.) | Annual (Z) | Spring (Z) | Summer (Z) | Autumn (Z) | Winter (Z) |
|---|---|---|---|---|---|---|
| ET0 (mm/10 year) | 0–200 | −10.7 ** (−2.7) | −5.1 ** (−2.8) | −3.4 ** (−2.5) | −2.6 ** (−2.4) | 0.3 (0.5) |
| 200–400 | −7.2 ** (−2.4) | −4.2 ** (−2.7) | −2.4 ** (−2.4) | −1.2 (−1.9) | 0.5 (0.8) | |
| >400 | −4.1 ** (−2.3) | −3.3 ** (−2.6) | −2.3 ** (−2.2) | 0.6 (0.3) | 0.9 (1.1) | |
| Mean | −7.4 ** (−2.5) | −4.2 ** (−2.7) | −2.7 ** (−2.4) | −1.1 (−1.3) | 0.6 (0.8) |
Note: ** indicates a 1% significance level; Z is the statistical value by the MMK method.
Table 4.
Average wind speed (WS), maximum and minimum temperature (Tmax, Tmin)), sunshine duration (SD), and relative humidity (RH) during the four seasons at different elevations in Heilongjiang Province, northeast China.
Table 4.
Average wind speed (WS), maximum and minimum temperature (Tmax, Tmin)), sunshine duration (SD), and relative humidity (RH) during the four seasons at different elevations in Heilongjiang Province, northeast China.
| Variable | Elevation (m a.s.l.) | Annual | Spring | Summer | Autumn | Winter |
|---|---|---|---|---|---|---|
| WS (m/s) | 0–200 | 3.3 | 4.0 | 2.8 | 3.3 | 3.0 |
| 200–400 | 2.8 | 3.5 | 2.6 | 2.8 | 2.2 | |
| >400 | 2.7 | 3.3 | 2.3 | 2.7 | 2.7 | |
| Mean | 2.9 | 3.6 | 2.6 | 2.9 | 2.6 | |
| Tmax (°C) | 0–200 | 9.0 | 11.2 | 26.2 | 9.8 | −11.3 |
| 200–400 | 8.1 | 10.5 | 25.8 | 8.9 | −12.7 | |
| >400 | 7.5 | 9.6 | 24.9 | 8.3 | −12.8 | |
| Mean | 8.2 | 10.4 | 25.6 | 9.0 | −12.3 | |
| Tmin (°C) | 0–200 | −2.4 | −1.5 | 15.7 | −1.4 | −22.4 |
| 200–400 | −4.1 | −3.0 | 14.6 | −3.1 | −25.1 | |
| >400 | −5.1 | −4.3 | 13.0 | −4.2 | −24.8 | |
| Mean | −3.9 | −2.9 | 14.4 | −2.9 | −24.1 | |
| SD (h/d) | 0–200 | 7.2 | 8.2 | 8.3 | 6.7 | 5.7 |
| 200–400 | 7.1 | 8.1 | 8.2 | 6.5 | 5.6 | |
| >400 | 6.9 | 8.0 | 7.8 | 6.4 | 5.5 | |
| Mean | 7.1 | 8.1 | 8.1 | 6.5 | 5.6 | |
| RH (%) | 0–200 | 64.9 | 53.7 | 73.4 | 64.9 | 67.6 |
| 200–400 | 67.5 | 55.8 | 74.6 | 67.9 | 71.6 | |
| >400 | 69.5 | 56.8 | 76.9 | 68.0 | 68.3 | |
| Mean | 67.3 | 55.4 | 75.0 | 66.9 | 69.2 |
Table 5.
Decadal changes in wind speed (WS), maximum and minimum temperature (Tmax, Tmin), subnshine duration (SD), and relative humidity (RH) from 1964 to 2013 in Heilongjiang Province, northeast China.
Table 5.
Decadal changes in wind speed (WS), maximum and minimum temperature (Tmax, Tmin), subnshine duration (SD), and relative humidity (RH) from 1964 to 2013 in Heilongjiang Province, northeast China.
| Variable | Elevation (m a.s.l.) | Interannual | Spring | Summer | Autumn | Winter |
|---|---|---|---|---|---|---|
| WS (m/s/10 year) | 0–200 | −0.31 | −0.41 | −0.22 | −0.31 | −0.31 |
| 200–400 | −0.22 | −0.29 | −0.21 | −0.19 | −0.23 | |
| >400 | −0.13 | −0.13 | 0.09 | −0.13 | −0.13 | |
| Mean | −0.22 | −0.28 | −0.11 | −0.21 | −0.22 | |
| Tmax (°C/10 year) | 0–200 | 0.21 | 0.11 | 0.22 | 0.29 | 0.35 |
| 200–400 | 0.32 | 0.14 | 0.19 | 0.31 | 0.36 | |
| >400 | 0.23 | 0.12 | 0.12 | 0.33 | 0.44 | |
| Mean | 0.25 | 0.12 | 0.18 | 0.31 | 0.38 | |
| Tmin (°C/10 year) | 0–200 | 0.46 | 0.53 | 0.52 | 0.53 | 0.61 |
| 200–400 | 0.58 | 0.61 | 0.51 | 0.62 | 0.73 | |
| >400 | 0.43 | 0.42 | 0.34 | 0.49 | 0.59 | |
| Mean | 0.49 | 0.52 | 0.46 | 0.55 | 0.64 | |
| SD (h/d/10 year) | 0–200 | −0.12 | −0.14 | −0.14 | −0.12 | −0.10 |
| 200–400 | −0.11 | −0.13 | −0.19 | −0.11 | −0.09 | |
| >400 | −0.13 | −0.18 | −0.22 | −0.13 | −0.11 | |
| Mean | −0.12 | −0.15 | −0.18 | −0.12 | −0.10 | |
| RH (%/10 year) | 0–200 | −0.12 | 0.18 | −0.23 | −0.22 | −0.31 |
| 200–400 | −0.21 | 0.22 | −0.33 | −0.43 | −0.43 | |
| >400 | 0.02 | 0.53 | 0.19 | −0.14 | −0.38 | |
| Mean | −0.10 | 0.31 | −0.12 | −0.26 | −0.37 |
Table 6.
Correlation coefficients between ET0 and meteorological parameters, including wind speed (WS), maximum and minimum temperature (Tmax, Tmin), sunshine duration (SD), and relative humidity (RH) from 1964 to 2013 at different elevations in Heilongjiang Province, northeast China.
Table 6.
Correlation coefficients between ET0 and meteorological parameters, including wind speed (WS), maximum and minimum temperature (Tmax, Tmin), sunshine duration (SD), and relative humidity (RH) from 1964 to 2013 at different elevations in Heilongjiang Province, northeast China.
| Time | Elevation (m a.s.l.) | WS | Tmax | Tmin | SD | RH |
|---|---|---|---|---|---|---|
| Annual | 0–200 | 0.41 | 0.39 | −0.11 | 0.61 * | −0.68 * |
| 200–400 | 0.49 * | 0.32 | −0.13 | 0.67 * | −0.62 * | |
| >400 | 0.43 | 0.31 | −0.09 | 0.72 * | −0.81 * | |
| Mean | 0.44 | 0.34 | −0.11 | 0.67 * | −0.70 * | |
| Spring | 0–200 | 0.41 | 0.72 * | 0.23 | 0.49 * | −0.81 * |
| 200–400 | 0.52 * | 0.68 * | 0.21 | 0.51 * | −0.82 * | |
| >400 | 0.19 | 0.61 * | 0.19 | 0.52 * | −0.85 * | |
| Mean | 0.30 | 0.67 | 0.21 | 0.51 | −0.83 * | |
| Summer | 0–200 | 0.32 | 0.71 * | 0.01 | 0.86 * | −0.93 * |
| 200–400 | 0.31 | 0.73 * | −0.09 | 0.88 * | −0.91 * | |
| >400 | 0.4 | 0.8 * | −0.1 | 0.90 * | −0.82 * | |
| Mean | 0.34 | 0.75 * | −0.06 | 0.87 * | −0.89 * | |
| Autumn | 0–200 | 0.40 | 0.43 | −0.13 | 0.82 * | −0.94 * |
| 200–400 | 0.41 | 0.51 * | −0.18 | 0.79 * | −0.83 * | |
| >400 | 0.32 | 0.58 * | 0.11 | 0.73 * | −0.92 * | |
| Mean | 0.38 | 0.51 * | −0.07 | 0.78 * | −0.90 * | |
| Winter | 0–200 | 0.11 | 0.91 * | 0.79 * | 0.43 | −0.77 * |
| 200–400 | 0.22 | 0.83 * | 0.81 * | 0.42 | −0.61 * | |
| >400 | 0.09 | 0.83 * | 0.73 * | 0.03 | −0.63 * | |
| Mean | 0.14 | 0.86 * | 0.78 * | 0.29 | −0.67 * |
Note: * indicates a 5% significance level; the bold words are the greatest correlation coefficient.
Table 7.
Seasonal and annual average sensitivity coefficients for individual climatic factors, including wind speed (WS), maximum and minimum temperature (Tmax, Tmin), sunshine duration (SD), and relative humidity (RH) to ET0 from 1964 to 2013 at different elevations in Heilongjiang Province, northeast China.
| Time | Elevation (m a.s.l.) | WS | Tmax | Tmin | SD | RH |
|---|---|---|---|---|---|---|
| Annual | 0–200 | 0.15 | 0.16 | 0.05 | 0.06 | −0.33 |
| 200–400 | 0.11 | 0.14 | 0.08 | 0.05 | −0.29 | |
| >400 | 0.14 | 0.17 | 0.10 | 0.03 | −0.31 | |
| Mean | 0.13 | 0.16 | 0.07 | 0.05 | −0.31 | |
| Spring | 0–200 | 0.16 | 0.08 | 0.04 | 0.06 | −0.34 |
| 200–400 | 0.13 | 0.07 | 0.02 | 0.05 | −0.33 | |
| >400 | 0.15 | 0.05 | 0.02 | 0.05 | −0.32 | |
| Mean | 0.15 | 0.07 | 0.03 | 0.05 | −0.33 | |
| Summer | 0–200 | 0.20 | 0.07 | −0.04 | 0.15 | −0.45 |
| 200–400 | 0.13 | 0.05 | −0.02 | 0.14 | −0.44 | |
| >400 | 0.13 | 0.04 | −0.01 | 0.12 | −0.43 | |
| Mean | 0.15 | 0.05 | −0.02 | 0.14 | −0.44 | |
| Autumn | 0–200 | 0.19 | 0.16 | −0.03 | 0.02 | −0.33 |
| 200–400 | 0.14 | 0.14 | 0.08 | 0.02 | −0.22 | |
| >400 | 0.23 | 0.14 | 0.11 | 0.00 | −0.33 | |
| Mean | 0.19 | 0.15 | 0.05 | 0.01 | −0.29 | |
| Winter | 0–200 | 0.04 | 0.31 | 0.21 | 0.00 | −0.21 |
| 200–400 | 0.03 | 0.33 | 0.23 | 0.00 | −0.18 | |
| >400 | 0.05 | 0.43 | 0.28 | −0.04 | −0.15 | |
| Mean | 0.04 | 0.35 | 0.24 | −0.01 | −0.18 |
Note: Numbers in bold indicate the greatest sensitivity coefficients.
© 2017 by the authors. Licensee MDPI, Basel, Switzerland. This article is an open access article distributed under the terms and conditions of the Creative Commons Attribution (CC BY) license (http://creativecommons.org/licenses/by/4.0/).
Share and Cite
MDPI and ACS Style
Qi, P.; Zhang, G.; Xu, Y.J.; Wu, Y.; Gao, Z. Spatiotemporal Changes of Reference Evapotranspiration in the Highest-Latitude Region of China. Water 2017, 9, 493. https://doi.org/10.3390/w9070493
AMA Style
Qi P, Zhang G, Xu YJ, Wu Y, Gao Z. Spatiotemporal Changes of Reference Evapotranspiration in the Highest-Latitude Region of China. Water. 2017; 9(7):493. https://doi.org/10.3390/w9070493
Chicago/Turabian StyleQi, Peng, Guangxin Zhang, Y. Jun Xu, Yanfeng Wu, and Zongting Gao. 2017. "Spatiotemporal Changes of Reference Evapotranspiration in the Highest-Latitude Region of China" Water 9, no. 7: 493. https://doi.org/10.3390/w9070493
Note that from the first issue of 2016, this journal uses article numbers instead of page numbers. See further details here.