
Alternative Engineered Soils and Seed Mixes Used for Seepage Troughs
by
 , , and
Oliver Weiss
* ,
,
Pia Minixhofer
,
Nadine Werner
,
Stefan Riedenbauer
,
Elisabeth Olesko
,
Katharina Lübke
,
Bernhard Scharf
and
Ulrike Pitha
Department of Civil Engineering and Natural Hazards, Institute of Soil Bioengineering and Landscape Construction, University of Natural Resources and Life Sciences, Vienna, Peter-Jordan-Strasse 82, A-1190 Vienna, Austria
*
Author to whom correspondence should be addressed.
Land 2021, 10(11), 1152; https://doi.org/10.3390/land10111152
Submission received: 22 September 2021
/
Revised: 23 October 2021
/
Accepted: 27 October 2021
/
Published: 29 October 2021
(This article belongs to the Special Issue Urban Green and Blue Infrastructure in the View of Global Warming)
Abstract
:Green Infrastructure measures such as seepage troughs are an integral part of sustainable urban rainwater management. In Austria, seepage troughs are currently almost exclusively produced with a 30 cm thick active soil filter passage made of topsoil. A standard seed mix is used as vegetation, which usually consists of only three different turfgrass species. During a three-year trial, engineered soils with improved properties (increased water storage capacity, infiltration rate and pore volume) were tested for their suitability as seepage troughs compared to topsoil. In addition to the standard turf seed mix, a flowering turf seed mix (34 species) and flowering meadow seed mix (53 species) were applied. The engineered and reference soils were analyzed for infiltration rate, vitality, cover ratio and inflorescence. The results were further assessed with the evaluation chart showing quantitatively the suitability of the tested soils for rainwater management. The investigations showed that engineered soils in combination with flowering meadow seed mix lead to the best results. Therefore, this type of vegetation for seepage troughs is recommended for future applications. The reference alternatives cannot be recommended.
1. Introduction
Green Infrastructure (GI) measures such as seepage troughs or rain gardens are an integral part of sustainable urban rainwater management. Their importance is rapidly increasing as the climate crisis will lead to more frequent extreme weather events such as heavy rainfalls, heatwaves and sustained dry periods [1,2,3]. Green-Blue Infrastructure measures contribute to flood protection and urban heat island reduction [4,5]. Their performance depends on their technical construction, layer composition and vegetation selection [6,7]. The interplay of soil and vegetation is essential for their infiltration capacity during stormwater events as well as their evaporation capacity to contribute to a livable urban climate [8,9].
1.1. The Use of Engineered Soils
Usually, rain gardens are constructed using topsoil on-site [10]. Topsoil is the natural surface soil layer, which might be slightly improved with soil amendments. Already established systems for seepage troughs such as rain gardens work with (improved) topsoil or engineered soils [10,11]. ‘Engineered soils’ are constructed soil layers made up of artificially produced plant substrates, which can be produced by (re)using excavated materials, such as sand, gravel or soil, combined with technical soil amendments to enhance essential soil functions such as water retention [12]. In this article, ‘plant substrates’ were defined as soil substitutes used as a plant medium that is mixed from predominantly mineral materials according to predefined requirements [13].
Internationally, the application of rain gardens is fairly common [14], but it is rare that any data on specifications for engineered soil development is published. In most cases, however, the topsoil found on site is reused and, if necessary, the desired properties are achieved by adding sand, gravel or compost, for example, to create a mix of two-thirds sandy loam topsoil and one-third compost to improve conditions for plant growth [10]. However, different ratios are applied of the composition by gravel, sand, loam, topsoil and compost of a suitable rain garden [10,15]. The currently used engineered soils still have the potential to optimize the geotechnical properties of water storage capacity and long-term water permeability while allowing for optimal plant growth in seepage troughs.
1.2. Seepage Troughs
Seepage troughs are swales in the open ground, where surface water or runoff is infiltrated into the existing subsoil [16]. Seepage troughs are vegetated channels to provide linear conveyance, retention and water treatment of stormwater. Especially the first flush contains high levels of contaminants, which causes high demands on filtering media and vegetation [17]. The design of seepage troughs is of importance in reducing erosion and ensuring long-term infiltration. In Austria, the area and depth of a seepage trough are calculated according to the guidelines of the Austrian Water and Waste Management Association (ÖWAV) [18] and should consist of a 30 cm thick active soil filter passage located above the subsoil [16]. The bottom of the seepage trough is enclosed by adjacent slopes, which should be designed with a 2:3 ratio to ensure erosion stability and maintenance [19].
Depending on the type of soil filter (natural or technical), the main indicators to be fulfilled for suitability as a soil filter are infiltration, soil composition and retention capacity [20]. The standard version of a seepage trough built in Austria is not suited to tackle these challenges. The permeability coefficient, also called kf-value (given in meters per second), describes the infiltration rate of a soil layer. The higher the value, the higher the water permeability of the soil [21]. In the case of a one-year rainfall event, a damming time of 24 h should not be exceeded, and the kf-value should not be below 1 × 10⁻⁵, which is why the selection of suitable plant substrates is essential for long-term functionality [21]. Frequent flooding of the seepage troughs leads to a limited infiltration rate due to the accumulation of fine particles and compaction [22,23,24]. Due to the external input of contaminants and fine sediments, the highest reduction of the infiltration rate could be observed within the first year after installation [22]. Structure stability and grain size are essential indicators that influence the long-term infiltration rate of soils [25,26].
1.3. Vegetation in Seepage Troughs
In cities, sufficient water storage capacity has a major influence on the vitality and development of woody plants and turfgrass communities, especially because of the hostile environment for vegetation [27,28,29]. The reduced air-soil interconnectivity also results in reduced plant vitality [30]. However, established and vital vegetation is essential to stabilize the soil with the root system and the surface coverage of the soil by leaf mass [31,32,33]. Water is released into the surrounding air masses through transpiration during photosynthesis, which is why sufficient water in the soil is essential for high vitality [34,35]. Plants require different amounts of water depending on the type of photosynthesis (C3, C4 or CAM) [35]. Therefore, it is important to use suitable seed mixes for urban areas. Not only engineered soils need to adapt to the new extreme conditions, but the vegetation does as well to assure the long-term success of the GI measures. Vital vegetation provides a habitat and food source for numerous insects. Through the increasing urbanization, there is less plant diversity and supply that may serve as a food source for insects [36,37,38]. In the last 27 years, there has been a 75% decline in the total insect biomass [36]. In 2019, over 40% of insects were threatened with extinction [38]. It seems to be of significant importance to provide habitats for them in urban environments. However, a standard turf seed mix currently used usually consists of only a few different turfgrass species [39], which do not contribute to maintaining and increasing biodiversity. This can be assured by replacing species-poor standard turf mixes with species-rich flowering turf or flowering meadow mixes.
1.4. Research Aim and Questions
These shortcomings lead to the need for newly engineered soils with long-lasting, robust performances and high biodiversity. In this article, the closely interlinked aspects of biodiversity, geotechnical and hydrological properties of the engineered soils are presented together to allow a comprehensive understanding of the complex plant-soil-water system.
Engineered soils with improved properties (increased water storage capacity, infiltration rate and pore volume) were tested for their suitability in seepage troughs during a three-year research project. A pilot system was installed in Vienna, Austria, to observe its effectiveness and functionality. The emphasis was on drainage and planting systems that were allowed to persist along streets and roads over the long term. The project aimed to retain as much rainwater as possible on-site to simplify the irrigation of the vegetation. Thus, improving the vitality, the microclimate and unburdening the sewer system in case of heavy rainfall events.
In this article, the following research questions shall be answered:
- How is the geotechnical performance of the newly engineered soils compared to the standard solution using topsoil?
- How is the vegetational performance of the tested seed mixes on new engineered soils compared to the reference soils?
- Which combination(s) of tested soil alternative and seed mix can be recommended for future applications?
2. Materials and Methods
2.1. Site Description and Set-Up
The test series was conducted in Kuchelauer Hafenstraße in the North-West of Vienna, Austria (48°17′15.6″ N 16°20′42.9″ E), between July 2018 and December 2020. The test site was installed in June 2018 and is positioned in the suburbs of the 19th district of Vienna, next to the city boundary. Annual precipitation is 650 mm [40] and the average temperature is 10.5 °C [41]. According to the Köppen-Geiger climate classification, Vienna has a warm-moderate climate with summer and winter precipitation (Cfb), which is still valid despite climate change [42,43]. Kuchelauer Hafenstraße was chosen as the test site because flood damage was already caused here by a heavy rain event in June 2013, and the research work was done in cooperation with the City of Vienna.
The test site was a linear seepage trough of about 120 m in length, 3 m in width, and 0.3 m in depth, and 0.1 m freeboard beside a bicycle route in an area largely devoid of automobiles. The slope sides that border the bottom of the seepage trough were designed in a ratio of 2:3. The built-up depth depended on the tested engineered soil alternatives and was either 0.3 m (single-layered) or 0.8 m (multi-layered). Accordingly, both single- and double-layers were tested. The alternatives contained a sandy gravel layer as a naturally occurring subsoil with a kf-value between 10−3 and 10−4 [21]. The soil was backfilled by dump truck into the excavated trough directly onto the existing in-situ sandy gravel layer and placed by hand without compaction.
In total, the seepage trough consisted of eight different engineered soil alternatives (E1–E8) and two reference soils (R1 and R2, topsoil and tree engineered soil). The engineered soils (E1–E8) were constructed with mineral plant substrates based on one (E1, E2, E3, E4) or a combination of calcareous, zeolite or perlite materials (multi-layered engineered soils consisting of a base layer (Chalk, Perlite, Zeolite) and a sublayer of retention substrate). These components allow the characteristics of high infiltration rate, high water absorption capacity and high pore volume [26,44].
The following Table 1 gives an overview of the tested soil alternatives.
The topsoil alternative (R1) was built in a single layer construction, typical for standardized seepage troughs in the City of Vienna with a built-up height of 30 cm according to ÖNORM B2506-1 [21]. Engineered soils E1–E4 were also single-layered, with a built-up height of 30 cm. A tree engineered soil (R2) was a multi-layered (30 cm vegetation base layer, 50 cm sub-layer) engineered soil usually used in Vienna for planting street trees. The tree engineered soil is currently used for tree pits in the seepage troughs and was not designed for an application of greenery with grasses and herbs. However, this study evaluated the possibility of a surface application of the engineered soils in seepage troughs around the tree pits as an alternative to the currently used topsoil.
Engineered soils E5–E8 were multi-layered, with a built-up height of 80 cm. Additionally, these alternatives were equipped with a water retention soil layer of 50 cm up to the 30 cm high base layer. The retention layer consists of a mixture with a grain-size distribution of 0/64 (i.e., the size of the smallest stones are very fine-grained close to 0 mm, the largest stones are up to 64 mm), based on the structural soil concept of the Stockholm system [11].
The tested soil alternatives were placed randomly next to each other in ten different test plots along the seepage trough. These fields were subdivided into three parts with different alternatives of seed mixes. Figure 1 shows the different engineered soils and the three different seed mix alternatives (ST = standardized turf, FT = flowering turf, FM = flowering meadow). The detailed species list is attached in the Appendix A (Table A1). As specified in the regulations, 15 g/m2 were applied for the standard seed mix, 10 g/m2 for the flowering turf seed mix and 8 g/m2 for the flowering meadow seed mix [45].
The maintenance intensity varied between the seed mixes. No initial maintenance treatment in the form of irrigation was carried out. During the vegetation period, the standardized turf was cut regularly once a month (about eight times a year during the vegetation period), flowering turf every second month and flowering meadow twice a year. The clippings were removed without residue during mowing. Besides cutting, we applied no further actions in maintenance.
2.2. Analyzed Indicators
In the course of the geotechnical and vegetation monitoring, the following indicators were investigated in the period from August 2018 to November 2020: infiltration rate, precipitation, cover ratio, vitality and inflorescence. The geotechnical indicator infiltration rate was measured at the beginning and the end of each vegetation period starting after the finished installation in June 2018. Precipitation was measured continuously by sensors over the entire period (technical specifications in Appendix A Table A2). The vegetation monitoring was carried out once a month during the vegetation period (08.2018–11.2018; 03.2019–11.2019; 03.2020–11.2020), starting one month after the installation of the study site after the establishment of the applied seed mixes could be observed.
2.2.1. Infiltration Rate
According to Austrian Standards [46,47] and the Austrian Research Association for Road, Railways and Transport [48] different methods are described to assess the infiltration rates of the soil alternatives. Two methods have been identified as suitable for coarse engineered soils and tested prior to the field monitoring.
As a result, the infiltration rate, indicating the permeability of the soil, is measured in meters per second (m/s) and is decisive for the determination of the seepage capacity [21]. The infiltration rate was tested with a double ring infiltrometer according to the Austrian Standards [47], using method C for sports soils with surfaces made of unbound mineral materials.
The water infiltration rate (IC) is calculated according to Austrian Standards [47]:
IC = FWC/tC
- IC water infiltration rate
- FWC sinking of the water level (mm)
- tC the time for the water level to sink (h)
The measurements were carried out once in spring and once in autumn, to represent the beginning and the end of the vegetation period. Each measurement was carried out centrally at the bottom of the seepage trough for each engineered soil alternative and each seed mix. The measurement was carried out in three replicates and the kf-value calculated from the mean value.
The descriptive statistical analysis of the infiltration rate included the bar and line chart and box plot to graphically identify any differences in the infiltration performance of the tested engineered soils.
2.2.2. Vegetation Monitoring
The vegetation monitoring was designed to answer the research question on vegetation performance. In the application of vegetation in seepage troughs, the focus is on cover ratio and vitality to prevent surface erosion. In addition, the aspect of biodiversity and nutrient supply to pollinators should be monitored. Based on previous research [49,50,51], the two indicators, vitality and inflorescence, were rated with the visual assessment index (shown in Table 2) to allow efficient and tailored monitoring. For each soil alternative and seed mix, one of five vitality classes was assigned. Vitality and inflorescence were rated according to their vitality class from (partially) dead (vitality stage 5, 1 point) to lush (vitality stage 1, 9 points). All test plots were assessed in terms of vigor, coloration and the general condition of the vegetation. Visually recorded data was collected by two people to account for potential biases [49].
Inflorescence was addressed by the species-specific blossoms produced, which is the species’ ability to reproduce.
Furthermore, the vegetation monitoring included the cover ratio, which was assessed for each soil alternative and seed mix. The cover ratio represents the percentage of surface covered by vegetation in its projection on the ground relative to the area of the surveyed area. Estimates are given by two people in 5% increments, with 0% representing absent or very puny vegetation, and 100% representing complete cover ratio of the experimental area [52].
For a statistical analysis of the vegetation indicators, the descriptive statistical procedures of the line and bar chart were also applied in order to identify possible graphical differences with regard to the individual indicators of the tested soil alternatives. In addition, existing correlations between the indicators vitality and cover ratio, as well as vitality and precipitation, were tested.
2.2.3. Evaluation Chart
Based on the geotechnical (infiltration rate) and vegetation indicators (vitality, cover ratio, inflorescence) collected, the evaluation chart provides an overview of the suitability of the various engineered soil and seed mix alternatives investigated in the seepage trough to recommend the best combination for its intended purpose. The results are separated into three categories with a different score (‘Good’ = 3 points, ‘Sufficient’ = 2 points, ‘Insufficient’ = 1 point) [45,53].
An infiltration rate between 4.9 × 10⁻⁴ and 1.1 × 10⁻⁵ m/s was ‘Good’ (3 points). ‘Sufficient’ values (2 points) were between ≤5.0 × 10⁻³ to 5.0 × 10⁻⁴ m/s and ‘Inadequate” infiltration results were 1.0 × 10⁻⁵ and ≥5.0 × 10⁻⁶ m/s. The values were derived from the standard regulations [13,21]. The first guideline recommends a permeability coefficient of 1.0 × 10⁻⁴ to 1.0 × 10⁻⁵ m/s for the uppermost 30 cm of the installed engineered soil in seepage troughs [21]. The second guideline recommends an infiltration rate of at least 5.0 × 10⁻⁶ m/s and a permeability coefficient of 5.0 × 10⁻⁵ m/s should not be exceeded [13].
A high plant vitality is necessary for a long-term existence of the greening. Only vital plants can provide satisfactory ecosystem services, such as cooling by evapotranspiration [54] or reduction by erosion through stabilization by roots and above-ground leaf mass [31,32,33]. Accordingly, vitality is of high importance. The classification of the vitality was ‘Good’ 6.1–9.0, ‘Adequate’ 4.1–6.0, and ‘Inadequate’ 1.0–4.0 [49].
The cover ratio was based on the Austrian standards for landscaping and landscape construction [55], which stipulates a projective cover ratio of 60%, and the Austrian standards for natural turf and sports fields [56], which stipulates a projective cover ratio of 95% after the inspection and approval of the follow-on care period [55,56]. Accordingly, a cover ratio of 95% or more is described as ‘Good’, 60–95% as ‘Sufficient’, and <60% as ‘Insufficient’.
A high number of blossoms (with average inflorescence values between 7.1 and 9.0) were rated as ‘Good’. Moderate inflorescence between 4.1 and 7.0 was ‘Sufficient’, and low inflorescence (between 1.0 and 4.0) was rated ‘Insufficient’ [49].
To account for the varying relevance of the indicators for the seepage troughs, they were given different weightings. Indicators with high relevance were weighted with a multiplier of ‘3’, those with moderate relevance with a multiplier of ‘2’ and indicators with lower relevance with a multiplier of ‘1’ [53]. In Table 3, the prioritization of the indicators is ranked according to their importance.
The infiltration rate and the cover ratio were assigned the highest weight of ‘3’, due to their essential function to achieve a permeable seepage trough with lower erosion risk [31,32,33]. Vitality was of less importance but still essential for the long-term existence of the vegetation [27,28,57] and was weighted with ’2’. Another factor was inflorescence, as biodiversity and food availability for insects were important aspects for green infrastructure in cities and therefore weighted with ‘1’ [36,37,38].
The maximum achievable score per engineered soil and seed mix alternative was 27 points per year and a total score of 81 points (100%) over the entire trial period 2018–2020.
3. Results
Results were separated into (1) the geotechnical assessment of the engineered soil alternatives, and (2) the visual rating of the vegetation. Section 3.1 describes the geotechnical assessment of the engineered soil alternatives (precipitation, infiltration rate, soil moisture). Section 3.2 shows the results of the vegetation monitoring (cover ratio, vitality, inflorescence).
3.1. Geotechnical Assessment of the Engineered Soil Alternatives
3.1.1. Precipitation and Infiltration Rate
In 2019, the annual sum of precipitation was 682 mm. Compared to the year 2020, the year 2019 was wetter (661 mm). However, during the vegetation period (April–November), the average sum of precipitation was lower in 2019 (515 mm) than in 2020 (547 mm).
The following Figure 2 shows the coefficient of permeability as a unit for the infiltration rate over the three monitored vegetation periods in 2018–2020. Infiltration was measured (as described in Section 2.2.1) twice a year.
It can be shown that there were no significant differences regarding infiltration rate between the three years (2018–2020) within each tested soil. However, there were high differences in infiltration between the tested soil alternatives. By far, the lowest infiltration rate had R1, followed by R2. The highest infiltration rates were evident for E2 and E4. In contrast to the different infiltration values of the tested soil alternatives, no differences in infiltration were documented for the seed mixes.
The soil moisture of selected alternatives (R1, R2, E1–E5 and E8) was measured using a soil moisture sensor (TEROS 12, technical specifications see Appendix A Table A2). Based on a heavy rainfall event (intensity of a triennial rainfall event for the site of the seepage trough) on 7 June 2019, Figure 3 shows the different developments of soil moisture. In this figure, the soil moisture values of the engineered soils (E1, E2, E3, E4, E5 and E8) were combined in one average line as the performance was similar and the readability of the graph enhanced.
During the rain event, 22.2 mm of precipitation occurred within 30 min, which roughly corresponded to a triennial heavy rain event for the site (design precipitation at grid point 2657 of the Austrian Hydrographic Service) [58].
The engineered soils (E1–E5 and E8) showed a similar trend independent of their layering, but a difference in maximum water storage of more than 10% volumetric water content (VWC) was observed (see Figure 3). After the recorded heavy rain event, the soil moisture increased rapidly and decreased slowly afterwards. In comparison, R2 showed a rapid decrease in soil moisture after the event. Twelve hours after the heavy rain event, soil moisture of only 10% volumetric water content (VWC) had been assessed for R2, while the soil moisture of the engineered soil alternatives remained higher with values ranging from 13 to 21% volumetric water content (VWC). In contrast to all other alternatives, R1 showed a very slow increase in soil moisture with a maximum of 16% volumetric water content (VWC) after 12 h, which can be explained by the low infiltration rate shown in Figure 2.
3.2. Vegetation Monitoring of the Seed Mix
3.2.1. Vitality
The vitality of the tested soil alternatives and seed mixes varied depending on the soil and seed mix alternative. The average vitality values are shown in the following Table 4 for the years 2018, 2019 and 2020 and the total over all three years. The results for the individual three years are the average values of the monthly monitoring during the vegetation period. The location of the tested alternative was not decisive for the assessed vitality, e.g., R2 is surrounded by alternatives E5 and E7 with better vitalities of all seed mix alternatives. E1 and E5 had the highest vitality, whereas R2 had the lowest. The flowering meadow had the highest vitality rate, followed by flowering turf and standardized turf. R2 showed a below-average vitality rate.
3.2.2. Cover Ratio
The flowering meadow had the highest cover ratio, with an average of 73% over the entire investigation period. The second-best cover ratio had been assessed for the flowering turf with an average within three years of 66%. The lowest cover ratio had been observed for standardized turf (see the following three Figure 4, Figure 5 and Figure 6) with an average of 63%. An increase in the cover ratio was evident from 2018–2020 for all tested soil alternatives and seed mixes. The highest cover ratio had E7 and the lowest R2. In 2020, the highest cover ratio was on average 97% for E1 and E7. Furthermore, there was a significant correlation between vitality and cover ratio (n = 200, α = 0.05; p ≤ 0.001, r = 0.424).
The average cover ratio values are presented in Figure 4, Figure 5 and Figure 6 for 2018, 2019 and 2020, indicated by the red line. The average values for the individual three years were based on the monthly monitoring during the growing season.
Figure 7 shows the vitality in comparison to the monthly sum of precipitation. Especially in 2020, the vitality increased with increasing precipitation delayed by a month. Although a graphical correlation was recognizable, there were no significant correlations (n = 48, α = 0.05; p = 0.182, r = 0.196) between vitality and precipitation. Especially in 2020, low precipitation led to an increase and thus improvement of vitality in the following month. Over both vegetation periods, R2 was performing far worse than the engineered soils. No effects of layering have been observed.
3.2.3. Inflorescence
Table 5 shows the inflorescence for the different engineered soil alternatives. The tested seed mixes and their individual cutting management had a considerable influence on the inflorescence. In the flowering meadow mix, cutting only twice a year resulted in the highest average blossom abundance. The flowering meadow (cutting interval every two months) showed the second-highest inflorescence. The lowest number of flowers was found in the monthly cut standardized turf. R2 had the lowest number of blossoms, whereas E1–E7 had the highest number of blossoms. There were no differences between single- and multi-layered engineered soils.
3.3. Evaluation Chart
The prioritization and weighting of the key indicators resulted in the following evaluation chart (see Table 6), which shows the ‘Good’ (65.1–81 points, 81–100%), ‘Sufficient’ (49.1–65 points, 61–80%) and ‘Insufficient’ (0–49 points, <60%) engineered soil alternatives and seed mixes. Table 6 shows the results for 2018–2020 and the total of the individual engineered soils and seed mixes. An annual maximum score of 27 points could have been achieved in the evaluation chart, and the total maximum score was 81 points (100%).
The highest value was determined for the engineered soils E3, E5, E7 and E8. The worst results were determined for R1 and R2. They reached just over half of the maximum achievable points. R1 delivered the worst results in geotechnical indicators, and R2 in vegetation indicators.
4. Discussion
First, the performance of the tested soil alternatives was assessed regarding the different indicators (infiltration, plant cover, vitality, inflorescence; see Section 4.1). Second, the analysis led to recommendations for engineered soil alternatives and seed mixes in Section 4.2.
4.1. Evaluation and Assessment of the Tested Soil Alternatives
4.1.1. Infiltration Performance
Based on the results obtained, it can be shown that there were significant differences in the infiltration performance of the individual engineered soil alternatives (see Figure 2). While all engineered soil alternatives met the requirements of the established technical standards [13,21], the reference soil R1 (topsoil) showed significantly lower infiltration rates. In 2019, kf-values of 1 × 10⁻⁹ m/s were achieved here, although the limit values according to the technical standards were 1 × 10⁻⁵ m/s and 5 × 10⁻⁶ m/s [13,21]. Compaction is the main reason why soils can no longer allow water to infiltrate due to the increased silting of sediments [22,23,24]. Especially during the first years after installation, this results in a significantly slower infiltration rate [22,26]. As stated in the literature [25], a high proportion of fine grains, as well as organic material, results in low resistance to compaction. As seen in additional carrying capacity measurements (see Appendix A Table A3), R1 had the lowest average carrying capacity of 4.0 MN/m2 in 2018–2020. This leads to the conclusion that the infiltration rate would diminish even further in case of any compaction caused by e.g., cars or pedestrians. Therefore, the standard alternative R1 cannot be recommended.
However, there were also significant differences between the individual engineered soil alternatives. The engineered soil alternatives E2, E4 and E8 can be particularly recommended in regard their infiltration performance when compared to the technical standards [13,21] under consideration of the progressing decreasing infiltration rate [26].
Significant findings of infiltration rates were supported by the soil moisture measurements. Thus, the engineered soils E1–E5 and E8 experienced a rapid increase in soil moisture due to the high infiltration already described (see Section 3.1.1, Figure 3). The soil moisture slowly decreased over time. This is an indication that precipitation can be retained in the engineered soils for a long time. In comparison, the tree engineered soil (R2) absorbed water just as quickly as the engineered soils but also dried out again very quickly. Thus, R2 had a significantly lower water retention capacity than the engineered soil.
The infiltration performance also affects the cooling capacity through evaporation, which is essential for the urban climate [8]. Green Infrastructures, such as seepage systems, green roofs, and green facades, provide an important contribution to urban cooling [9]. If there is too little plant-available water in the soil, the cooling capacity essential for the urban climate can also be inadequately provided by greatly reduced transpiration. During photosynthesis, water is released into the surrounding air masses through transpiration, which is why the presence of sufficient water in the soil is essential for the process and high vitality [34,35]. In urban areas, sufficient water storage capacity is essential [26], especially because of the hostile environment for vegetation [29].
4.1.2. Impact of Plant Cover
In general, the highest reduction of the infiltration rate can be observed within the first year due to the external input of fine sediments [22]. Consequently, the design of the seepage trough system is specifically important. To reduce erosion, not only plants play a decisive role. Animal processes in the soil can reduce the risk of erosion [59]. As an example, earthworm burrows can increase infiltration in the soil. To a much greater extent, established and vital vegetation can significantly reduce erosion. Because of this, in addition to stabilizing the soil by plant roots, it is primarily the surface coverage of the soil by leaf mass that is protecting the soil surface [31,32,33]. Therefore, the cover ratio results are of great importance.
Considering all tested alternatives over the three-year trial period, the highest average cover ratio could be documented for the seed mix alternative of the flowering meadow (73%), followed by the flowering turf (66%). The standardized turf mix had the lowest cover ratio with 63% and is, therefore, most susceptible to erosion [60].
The soil alternatives were assessed for their differentiated suitability for the different seed mixes. The engineered soils reached an average cover ratio of 71%, ranging from 66% for standard turf to 78% for flowering meadow. The topsoil (R1) showed the highest average cover ratio with 74%, ranging from 73% for standardized turf to 76% for flowering turf. The, by far, lowest values had been calculated for R2 with only 28% cover ratio on average, ranging from 26% for standardized turf to 31% for flowering meadow. Although R2 was not designed to function as a turf soil, the very low result was still surprising. The low result could be caused by the rapidly sinking soil moisture and the associated low water storage capacity of the base layer. Especially during the germination process, sufficient soil moisture of the substrate layer is important [61]. As the cover ratio was less than 60 % (as requested as the minimum ratio in the Austrian guidelines [55]), R2 cannot be recommended for use in seepage trough systems.
In comparison, some of the engineered soils (E1, E7, E8) and topsoil (R1) reached a cover ratio of more than 95% in the third monitoring year and even met the requirements of turf in sports field construction [56].
4.1.3. Impact of Vitality
Accordingly, vitality is strongly influenced by the water storage capacity of the soil. As shown in Figure 7, R2 had the lowest water holding capacity and by far the lowest average vitality, which is in line with the findings of the previously cited researchers as the performance of woody plants and turfgrass communities depends very much on the soil water availability [27,28,57]. With an average vitality of just over 3 and an average vitality for the standardized turf seed mix of 2, R2 had the lowest vitality of all investigated test alternatives. The highest vitality could be documented for two of the engineered soils (E1 and E5). R1 was in the (lower) middle range with a vitality of 6.0 for all seed mixes. The tree engineered soil R2 could also not be described as suitable for use in terms of vitality.
4.1.4. Impact on Inflorescence
Due to the high rate of insect decline in rural environments [36], it is important to provide urban habitats for the decreasing fauna. Since flowers serve as a food source for numerous insects [36,37,38], the inflorescence is considered an important indicator for decision selection and is included in the evaluation chart. However, since inflorescence has no direct effect on the performance of a seepage trough, it is included with a moderate weighting of ‘1’. No significant differences in inflorescence could be identified between the individual engineered soils. The tree engineered soil (R2) showed a significantly lower number of blossoms due to its low cover ratio and vitality. Similarly, topsoil (R1) used for seepage troughs also exhibited reduced inflorescence. Therefore, again, these two alternatives cannot be recommended for use in biodiverse seepage troughs.
4.2. Recommendations for Engineered Soil Alternatives and Seed Mixes
Looking at the evaluation chart in Table 6 (Section 3.3), the alternatives E3, E4, E5, E7 and E8 can be recommended for the tested indicators collected during the study period (infiltration, vitality, cover ratio and inflorescence). E3 and E4 are single-layer alternatives, while E5, E7 and E8 have multi-layer structures. This leads to the conclusion that both single-layer and multi-layer alternatives can deliver equally convincing results. Depending on the characteristics of the existing subsoil, single- or multi-layer alternatives can be chosen [62].
For each of these five engineered soil types, the flowering meadow mixture was able to achieve the best results, followed by the flowering turf mixture. This result can also be observed in the two reference materials R1 and R2. Therefore, based on the indicators collected, the use of flowering turf mixes is recommended.
Flower turf and flower meadow seed mixes offer the advantage of self-renewal in addition to the increase in biodiversity. An intelligent cutting concept waits for sufficient seed maturity and carries out the cut then, thus guaranteeing self-seeding and self-renewal of the flower turf or flower meadow while maintaining the highest possible species diversity [63,64,65]. In addition, higher species diversity causes less erosion than in areas with only a few plant species present [60].
Further research will need to focus on the use of novel engineered soils specifically for seepage systems with tree plantings. Furthermore, the species-specific root density and depth of trees as well as grasses and herbs might play a role in the water retention capacity. In further studies, chemical analyses of the filtering performance of the engineered soils should take place to quantify the contribution to groundwater protection and the absorption of pollutants from road runoff.
5. Conclusions
Previous designs of seepage systems with standardized topsoil and a structure height of 30 cm meet the regulatory framework conditions for a seepage system right after installation. However, due to silting and compaction, seepage systems already show a significantly slowed infiltration rate after a short period. In the trial, the standard alternative (R1) was already unable to achieve sufficient infiltration values after the first year of operation. In Austria, the area and depth of a seepage trough are calculated according to the guidelines of the Austrian Water and Waste Management Association (ÖWAV) [18]. The infiltration rate is a crucial factor in the calculation formula. Therefore, a significant change of infiltration rate changes the design parameters (regarding necessary area and depth) and may lead to malfunction of built seepage systems and increased risk of pluvial flooding. The tree engineered soil (R2) can only be recommended to a very limited extent for use in seepage systems with greening by seed mix. The infiltration rate remained within the limits during the entire monitoring period, but the results of the analysis, as well as the low water storage capacity, did not allow a recommendation for use in this combination.
The vegetation development in terms of cover ratio, vitality, inflorescence and the greatly reduced maintenance effort due to extended cutting intervals allowed a clear recommendation for flowering turf and flowering meadows in seepage systems. Thus, it could be clearly shown that engineered soils are a promising alternative to existing ones. In combination with a flowering turf or flowering meadow seed mix, these engineered soils can lead to optimal results with significantly reduced maintenance requirements and, at the same time, contribute to increasing biodiversity in urban areas.
The focus of the research was on the performance of plant development and infiltration rate rather than cost aspects. Considering the results presented in Table 6, the tested engineered soil alternatives proved to be more suitable for the long-term implementation and compensate for potentially higher costs for the initial soil material. The following cost ranges were based on quotes from local producers. The reference alternatives topsoil R1 and tree engineered soil R2 cost around 30 EUR per cubic meter. The tested engineered soils had a cost range from 40 EUR per cubic meter for E1 without zeolite to 80 EUR per cubic meter for E2 with the highest proportion of zeolite. The difference in costs was related to the type and amount of soil additives used for the mixtures of the tested engineered soils. The E3 and E4 had a cost of around 50 EUR per cubic meter, which is significantly cheaper than the less performing tested alternative E2. E7 and E8 included a retention layer costing in total of 70 EUR per cubic meter. Within the engineered soils, the combination of perlite and zeolite reached the best evaluation. In a decision-making process and considering public budgets and economic aspects, the engineered soils E3 and E4 seemed favorable.
In total, the following five key findings can be summarized for this work:
- The tested standard topsoil cannot be recommended due to rapid silting and the associated low infiltration performance.
- The tree engineered soil (R2) cannot be recommended for use in seepage systems with seed mix. Despite its high infiltration rate, it held a low water storage capacity and showed a poorly developing vegetation.
- No differences in geotechnical and vegetation results could be detected between the single- and multi-layer engineered soil structures of the engineered soils investigated.
- Flowering turf and flowering meadow seed mix provided an excellent alternative to species-poor standardized turf mix, increased urban biodiversity, and reduced maintenance requirements.
- The use of the tested engineered soil in combination with a flowering turf or flowering meadow seed mix can be recommended as a promising option for future use in seepage systems.
Author Contributions
Conceptualization, O.W., P.M., B.S. and U.P.; methodology, O.W., B.S. and U.P.; validation, O.W., P.M., B.S. and U.P.; formal analysis, O.W., S.R. and B.S.; investigation, O.W., K.L., E.O., N.W. and S.R.; data curation, O.W. and S.R.; writing—original draft preparation, O.W. and P.M.; writing—review and editing, O.W., P.M., B.S. and U.P.; visualization, O.W. and P.M.; supervision, B.S. and U.P.; project administration, O.W., B.S. and U.P.; funding acquisition, B.S. and U.P. All authors have read and agreed to the published version of the manuscript.
Funding
This research was funded by WIEN KANAL and MA 48.
Institutional Review Board Statement
Not applicable.
Informed Consent Statement
Not applicable.
Data Availability Statement
The data presented in this study are available in this article.
Conflicts of Interest
The authors declare no conflict of interest.
Appendix A

Table A1.
Species list for the three seed mixes standardized turf, flowering turf and flowering meadow.
Table A1.
Species list for the three seed mixes standardized turf, flowering turf and flowering meadow.
| Seed Mix | Standardized Turf [% by Mass] | Flowering Turf [% by Mass] | Flowering Meadow [% by Mass] |
|---|---|---|---|
| Grasses | 100 | 80 | 76 |
| Agrostis capillaris | 5 | 5 | |
| Anthoxanthum odoratum | 5 | ||
| Bromus erectus | 7 | ||
| Cynodon dactylon | 5 | ||
| Cynosurus cristatus | 5 | 5 | |
| Dactylis glomerata | |||
| Festuca arundinacea | 5 | 7 | |
| Festuca guestfalica | 10 | 5 | |
| Festuca nigrescens | 10 | 5 | |
| Festuca ovina duriuscula | 10 | ||
| Festuca pratensis | 7 | ||
| Festuca rubra (rubra) | 5 | 5 | 5 |
| Festuca rubra trichophylla | 5 | 5 | |
| Lolium perenne | 50 | 5 | 5 |
| Poa compressa | 5 | ||
| Poa pratensis | 45 | 10 | 10 |
| Legumes | 0 | 5 | 6 |
| Anthyllis vulneraria | |||
| Lotus corniculatus | 1.5 | 1 | |
| Medicago lupulina | 3 | 1.5 | |
| Trifolium prepens | 0.5 | ||
| Onobrychis viciifolia | 1 | ||
| Trifolium pratense | 0.5 | ||
| Vicia villosa | 1 | ||
| Herbs | 0 | 15 | 18 |
| Achillea millefolium | 2 | 1 | |
| Agrostemma githago | 0.5 | ||
| Ajuga reptans | 0.5 | 0.5 | |
| Anthemis nobilis | 1 | 0.5 | |
| Anthemis tinctoria | 0.5 | ||
| Bellis perennis | 0.5 | 0.5 | |
| Calendula officinalis | 0.5 | ||
| Campanula patula | 0.5 | ||
| Carum carvi | 0.5 | ||
| Centaurea cyanus | 0.5 | ||
| Centaurea jacea | 0.75 | 0.5 | |
| Cichorium intybus | 0.5 | ||
| Daucus carota | 0.5 | ||
| Dianthus deltoides | 0.5 | ||
| Galium album | 0.5 | 0.5 | |
| Knautia arvensis | 0.5 | ||
| Leontodon autumnalis | 0.5 | 0.5 | |
| Leontodon hispidus | 0.5 | 0.5 | |
| Leucanthemum vulgare | 1 | 0.5 | |
| Lychnis flos cuculi | 0.5 | ||
| Lychnis viscaria | 0.5 | ||
| Matricaria chamomilla | 0.5 | ||
| Papaver rhoeas | 0.5 | ||
| Petrorhagia saxifraga | 0.5 | 0.5 | |
| Phacelia tanacetifolia | 0.5 | ||
| Pimpinella saxifraga | 1 | 0.5 | |
| Plantago lanceolata | 0.5 | ||
| Plantago media | 0.5 | ||
| Potentilla verna | 0.5 | 0.5 | |
| Prunella vulgaris | 0.75 | 0.5 | |
| Salvia nemoralis | 1 | 0.5 | |
| Sanguisorba minor | 1.5 | 1 | |
| Silene vulgaris | 0.5 | 0.5 | |
| Thymus pulegioides | 1 | 0.5 | |
| Veronica chamaedrys | 0.5 | 0.5 |
Table A2.
Specifications of the used soil moisture sensor TEROS 12 and precipitation sensor ECRN-10 by METER (München, Germany) [66,67].
| Type of Sensor | ECRN-100 [66] | TEROS 12 [67] |
|---|---|---|
| Dimensions | height: 16.0 cm | length: 9.4 cm width: 2.4 cm height: 2.0 cm |
| Measuring volume | - | 1010 mL |
| Range of measurement | - | 0–57% VWC |
| Operating environment | 0–60 °C | −40–60 °C |
| Resolution | Rainfall per tip: 0.2 mm | 0.001 m3/m3 |
| Precision | Volume per tip: 4.02 mL/tip | Using a generic calibration: ±3% VWC Using a soil specific calibration: ±1–2% VWC |
Table A3.
Carrying capacity of R1, R2, E1–E8.
| Carrying Capacity [MN/m2] | |||
|---|---|---|---|
| Soil Alternative | Dynamic Evd [MN/m2] | ||
| 2018 | 2019 | 2020 | |
| R1 | 3.8 | 4.1 | 4.0 |
| R2 | 9.3 | 14.8 | 12.0 |
| E1 | 4.0 | 5.2 | 4.6 |
| E2 | 6.4 | 6.2 | 6.3 |
| E3 | 4.8 | 4.7 | 4.7 |
| E4 | 5.2 | 7.1 | 6.1 |
| E5 | 4.4 | 4.7 | 4.5 |
| E6 | 5.9 | 6.7 | 6.3 |
| E7 | 5.2 | 5.6 | 5.4 |
| E8 | 6.1 | 7.1 | 6.6 |
References
- Dankers, R.; Hiederer, R. Extreme Temperatures and Precipitation in Europe: Analysis of a High-Resolution Climate Change Scenario. JRC Sci. Tech. Rep. 2008, 1–66. [Google Scholar]
- Valipour, M.; Bateni, S.M.; Jun, C. Global Surface Temperature: A New Insight. Climate 2021, 9, 81. [Google Scholar] [CrossRef]
- Stoffel, M.; Stephenson, D.B.; Haywood, J.M. Antipyretic Medication for a Feverish Planet. Earth Syst. Environ. 2020, 4, 757–762. [Google Scholar] [CrossRef]
- O’Donnell, E.; Thorne, C.; Ahilan, S.; Arthur, S.; Birkinshaw, S.; Butler, D.; Dawson, D.; Everett, G.; Fenner, R.; Glenis, V.; et al. The Blue-Green Path to Urban Flood Resilience. Blue-Green Syst. 2020, 2, 28–45. [Google Scholar] [CrossRef] [Green Version]
- Zhao, D.; Lei, Q.; Shi, Y.; Wang, M.; Chen, S.; Shah, K.; Ji, W. Role of Species and Planting Configuration on Transpiration and Microclimate for Urban Trees. Forests 2020, 11, 825. [Google Scholar] [CrossRef]
- Gülbaz, S.; Kazezyılmaz-Alhan, C.M. Experimental Investigation on Hydrologic Performance of LID with Rainfall-Watershed-Bioretention System. J. Hydrol. Eng. 2017, 22, 1–10. [Google Scholar] [CrossRef]
- Mobilia, M.; D’Ambrosio, R.; Longobardi, A. Climate, soil moisture and drainage layer properties impact on green roofs in a Mediterranean environment. In Frontiers in Water-Energy-Nexus—Nature-Based Solutions, Advanced Technologies and Best Practices for Environmental Sustainability; Springer: Berlin/Heidelberg, Germany, 2020; pp. 169–171. [Google Scholar]
- Yang, F.; Lau, S.S.Y.; Qian, F. Summertime Heat Island Intensities in Three High-Rise Housing Quarters in Inner-City Shanghai China: Building Layout, Density and Greenery. Build. Environ. 2010, 45, 115–134. [Google Scholar] [CrossRef]
- Uçar, Z.; Akay, A.E.; Bilici, E. Towards Green Smart Cities: Importance of Urban Forestry and Urban Vegetation. Int. Arch. Photogramm. Remote Sens. Spat. Inf. Sci. ISPRS Arch. 2020, 44, 399–403. [Google Scholar] [CrossRef]
- City of Portland How to Manage Stormwater—Rain Gardens; City Of Portland Environmental Services: Portland, OR, USA, 2009.
- Embrén, B.; Alvem, B.M.; Stal, Ö.; Orvesten, A. Planting Pits in the City of Stockholm An Handbook; Stockholms Stad: Stockholm, Sweden, 2009. [Google Scholar]
- Deeb, M.; Groffman, P.M.; Blouin, M.; Egendorf, S.P.; Vergnes, A.; Vasenev, V.; Cao, D.L.; Walsh, D.; Morin, T.; Séré, G. Using Constructed Soils for Green Infrastructure—Challenges and Limitations. Soil 2020, 6, 413–434. [Google Scholar] [CrossRef]
- FLL Empfehlungen für Baumpflanzungen—Teil 2: Standortvorbereitungen für Neupflanzungen—Pflanzgruben und Wurzelraumerweiterung, Bauweisen und Substrate; Forschungsgesellschaft Landschaftsentwicklung Landschaftsbau e.V.: Bonn, Germany, 2010.
- Ishimatsu, K.; Ito, K.; Mitani, Y.; Tanaka, Y.; Sugahara, T.; Naka, Y. Use of Rain Gardens for Stormwater Management in Urban Design and Planning. Landsc. Ecol. Eng. 2017, 13, 205–212. [Google Scholar] [CrossRef]
- Vaculová, V.; Štěpánková, R. Application of Rain Gardens to an Urban Area—Housing Estate in Nitra, Slovakia. Acta Hortic. Regiotect. 2017, 20, 1–5. [Google Scholar] [CrossRef] [Green Version]
- VÖB Sickermulde. Available online: http://www.wasserwirtschaft.net/entwaesserunghochbau:sickermulde:start (accessed on 10 September 2021).
- Johnson, K.; Cai, M.; Patelke, M.; Saftner, D.; Swanson, J. Comparing Properties of Water Absorbing/Filtering Media for Bioslope/Bioswale Design; Minnesota Department of Transportation: St. Paul, MN, USA, 2017. [Google Scholar]
- ÖWAV. ÖWAV-Regelblatt 45: Oberflächenentwässerung durch Versickerung in den Untergrund. 2015. Available online: https://www.oewav.at/Page.aspx?target=196960&mode=form&app=134598&edit=0¤t=293666&view=205658&predefQuery=-1 (accessed on 26 October 2021).
- Larcher, H. Planungshilfen für die Bemessung und Hinweise zur Sanierung von dezentralen Versickerungsanlagen für Niederschlagswasser. Master’s Thesis, Leopold-Franzens-University of Innsbruck, Innsbruck, Austria, 2009. Available online: https://www.uibk.ac.at/umwelttechnik/teaching/master/da_larcher.pdf (accessed on 26 October 2021).
- Austrian Standards ÖNORM B2506-2. Regenwasser-Sickeranlagen für Abläufe von Dachflächen und Befestigten Flächen—Teil 2: Qualitative Anforderungen an das zu Versickernde Regenwasser Sowie Anforderungen an Bemessung, Bau und Betrieb von Reinigungsanlagen; Austrian Standards International: Vienna, Austria, 2012; pp. 1–18. [Google Scholar]
- Austrian Standards ÖNORM B2506-1. Regenwasser-Sickeranlagen für Abläufe von Dachflächen und Befestigten Flächen—Anwendung, Hydraulische Bemessung, Bau und Betrieb; Austrian Standards International: Vienna, Austria, 2013; pp. 1–22. [Google Scholar]
- Bergman, M.; Hedegaard, M.R.; Petersen, M.F.; Binning, P.; Mark, O.; Mikkelsen, P.S. Evaluation of Two Stormwater Infiltration Trenches in Central Copenhagen after 15 Years of Operation. Water Sci. Technol. 2011, 63, 2279–2286. [Google Scholar] [CrossRef] [PubMed]
- Ekwue, E.I.; Harrilal, A. Effect of Soil Type, Peat, Slope, Compaction Effort and Their Interactions on Infiltration, Runoff and Raindrop Erosion of Some Trinidadian Soils. Biosyst. Eng. 2010, 105, 112–118. [Google Scholar] [CrossRef]
- Levine, B.; Horne, D.; Burkitt, L.; Tanner, C.; Sukias, J.; Condron, L.; Paterson, J. The Ability of Detainment Bunds to Decrease Surface Runoff Leaving Pastoral Catchments: Investigating a Novel Approach to Agricultural Stormwater Management. Agric. Water Manag. 2021, 243, 1–10. [Google Scholar] [CrossRef]
- Tejedor, M.; Neris, J.; Jiménez, C. Soil Properties Controlling Infiltration in Volcanic Soils (Tenerife, Spain). Soil Sci. Soc. Am. J. 2013, 77, 202–212. [Google Scholar] [CrossRef]
- Dellantonio, S. Versickerungsfähige Pflanzbeete als Alternative zur konventionellen Regenwasserbewirtschaftung—Untersuchung und Bewertung von Wasserdurchlässigkeit und Speicherfähigkeit verschiedener Substratmischungen und deren Tauglichkeit für Bepflanzungen. Master’s Thesis, University of Natural Resources and Life Sciences, Vienna, Austria, 2017. [Google Scholar]
- Duble, R.L. Turfgrasses—Their Management and Use in the Southern Zone, 2nd ed.; Texas A&M University Press: College Town, TX, USA, 2004. [Google Scholar]
- Close, R.E.; Kielbaso, J.J.; Nguyen, P.V.; Schutzki, R.E. Urban vs. Natural Sugar Maple Growth: II. Water Relations. J. Arboric. 1996, 22, 187–192. [Google Scholar]
- Schneider, B.U.; Hüttl, R.F. Naturräumliche Ausstattung. In Historische Gärten und Klimawandel: Eine Aufgabe für Gartendenkmalpflege, Wissenschaft und Gesellschaft; Hüttl, R.F., David, K., Schneider, B.U., Eds.; De Gruyter Akademie Forschung: Berlin, Germany, 2019; pp. 151–153. ISBN 9783110607482. [Google Scholar]
- Kozlowski, T.T. Soil Compaction and Growth of Woody Plants. Scand. J. For. Res. 1999, 14, 596–619. [Google Scholar] [CrossRef]
- Gyssels, G.; Poesen, J. The Importance of Plant Root Characteristics in Controlling Concentrated Flow Erosion Rates. Earth Surf. Process. Landf. 2003, 28, 371–384. [Google Scholar] [CrossRef]
- Prosser, I.P.; Dietrich, W.E. Field Experiments on Erosion by Overland FLow and Their Implication for a Digital Terrain Model Ofchannel Initiation. Water Resour. Res. 1995, 31, 2867–2876. [Google Scholar] [CrossRef]
- Kutschera, L. Short Review of the Present State of Root Research. Dev. Agric. Manag. For. Ecol. 1991, 24, 1–8. [Google Scholar]
- Schrödter, H. Verdunstung—Anwendungsorientierte Meßverfahren und Bestimmungsmethoden, 1st ed.; Springer: Berlin/Heidelberg, Germany, 1985. [Google Scholar]
- Weiler, E.W.; Nover, L.; Nultsch, W. Allgemeine und Molekulare Botanik, 1st ed.; Georg Thieme: Stuttgart, Germany, 2008; ISBN 3131476613. [Google Scholar]
- Hallmann, C.A.; Sorg, M.; Jongejans, E.; Siepel, H.; Hofland, N.; Schwan, H.; Stenmans, W.; Müller, A.; Sumser, H.; Hörren, T.; et al. More than 75 Percent Decline over 27 Years in Total Flying Insect Biomass in Protected Areas. PLoS ONE 2017, 12, e0185809. [Google Scholar] [CrossRef] [PubMed] [Green Version]
- Chemnitz, C.; Gordon, D. Insektenatlas—Daten und Fakten über Nütz- und Schädlinge in der Landwirtschaft; Bund für Umwelt und Naturschutz Deutschland e.V.: Berlin, Germany, 2020. [Google Scholar]
- Sánchez-Bayo, F.; Wyckhuys, K.A.G. Worldwide Decline of the Entomofauna: A Review of Its Drivers. Biol. Conserv. 2019, 232, 8–27. [Google Scholar] [CrossRef]
- Da Silva, Y.; Hendry, L. How to Grow a Lawn That’s Better for Wildlife. Available online: https://www.nhm.ac.uk/discover/how-to-grow-a-better-lawn-for-wildlife.html (accessed on 10 September 2021).
- ZAMG Niederschläge Februar 2019 bis Februar 2021. Available online: https://www.wien.gv.at/statistik/lebensraum/tabellen/niederschlag.html (accessed on 10 September 2021).
- ZAMG. Lufttemperatur Februar 2019 bis Februar 2021. Available online: https://www.wien.gv.at/statistik/lebensraum/tabellen/lufttemperatur.html (accessed on 10 September 2021).
- Kottek, M.; Grieser, J.; Beck, C.; Rudolf, B.; Rubel, F. World Map of the Köppen-Geiger Climate Classification Updated. Meteorol. Z. 2006, 15, 259–263. [Google Scholar] [CrossRef]
- Köppen, W. Versuch einer Klassifikation der Klimatze, vorzugsweise nach ihren Beziehungen zur Pflanzenwelt. Geogr. Z. 1900, 6, 657–679. [Google Scholar]
- Kos, B. Untersuchungen zu Baumsubstraten und Straßenbäumen Mittels Ausgewählter Geotechnischer und Vegetationstechnischer Methoden im Rahmen des “SAVE”-Projekts der Stadt Wien. Master’s Thesis, University of Natural Resources and Life Sciences, Vienna, Austria, 2017. [Google Scholar]
- Lübke, K. Dezentrales Regenwassermanagement in der Stadt Multifunktionale Sickerflächen. Master’s Thesis, University of Natural Resources and Life Sciences, Vienna, Austria, 2019. [Google Scholar]
- Austrian Standards ÖNORM B 4422-2. Geotechnical Engineering (Foundation Engineering)—Soil Analysis—Determination of Water Permeability—Field Methods for Layer Near to the Surface; Austrian Standards International: Vienna, Austria, 2002; pp. 1–21. [Google Scholar]
- Austrian Standards ÖNORM EN 12616:2013. Sports Soils—Determination of Water Infiltration Rate; Austrian Standards International: Vienna, Austria, 2013; pp. 1–9. [Google Scholar]
- Austrian Research Association for Roads, Railways and Transport. RVS 11.06.27 Bestimmung der Durchlässigkeit von Tragschichtmaterial und Tragschichten; FSV: Vienna, Austria, 2018; pp. 1–9. [Google Scholar]
- Thelen-Germann, M. Entwicklung Eines Bewertungsschemas zur Beurteilung Krautiger Pflanzen bei Vegetationstechnischen Aufnahmen. Master’s Thesis, Universität für Bodenkultur, Vienna, Austria, 2015. [Google Scholar]
- Graf, R. Pflanzen für Versickerungsflächen—Weiterführende Vegetationsuntersuchungen an Einer Versuchsfläche in Ober-Grafendorf/Niederösterreich. Master’s Thesis, University of Natural Resources and Life Sciences, Vienna, Austria, 2018. [Google Scholar]
- Pichler, A. GrünStadtKlima—Dachbegrünung Auswirkung der Vegetationsentwicklung bei Dachbegrünungen auf Ausgewählte Mikroklimatische Parameter. Master’s Thesis, University of Natural Resources and Life Sciences, Vienna, Austria, 2013. [Google Scholar]
- Traxler, A. Handbuch des Vegetationsökologischen Monitorings—Methoden, Praxis, Angewandte Projekte Teil A: Methoden, 1st ed.; Umweltbundesamt: Vienna, Austria, 1997. [Google Scholar]
- Olesko, E. Decentralised Rainwatermanagement in Urban Areas. Master’s Thesis, University of Natural Resources and Life Sciences, Vienna, Austria, 2021. [Google Scholar]
- Doick, K.; Hutchings, T. Air Temperature Regulation by Urban Trees and Green Infrastructure; Forestry Commission: Farnham, UK, 2013. [Google Scholar]
- Austrian Standards ÖNORM B 2241. Gartengestaltung und Landschaftsbau—Werkvertragsnorm; Austrian Standards International: Vienna, Austria, 2013; pp. 1–30. [Google Scholar]
- Austrian Standards ÖNORM 2606-1. Sportplatzbeläge—Teil 1: Naturrasen; Austrian Standards International: Vienna, Austria, 2009; p. 24. [Google Scholar]
- Chakraborty, T.; Saha, S.; Reif, A. Decrease in Available Soil Water Storage Capacity Reduces Vitality of Young Understorey European Beeches (Fagus Sylvatica l.)—A Case Study from the Black Forest, Germany. Plants 2013, 2, 676–698. [Google Scholar] [CrossRef] [PubMed]
- BMLRT Bemessungsniederschlag 2020. Available online: https://ehyd.gv.at/# (accessed on 25 June 2021).
- Trimble, S.W. Vegetation and erosion. Processes and environments. In Geomorphic Effects of Vegetation Cover and Management: Some Time and Space Considerations in Prediction of Erosionand Sediment Yield; Thornes, J.B., Ed.; John Wiley & Sons: Chichester, UK, 1990; pp. 55–65. [Google Scholar]
- Cyrill, M.; Beeli, M.; Alewell, C.; Körner, C. Interrill Erosion at Disturbed Alpine Sites: Effects of Plant Functional Diversity and Vegetation Cove. Basic Appl. Ecol. 2010, 11, 619–626. [Google Scholar] [CrossRef]
- Klatz Beal, S. The Importance of Water in Seeds Germination. Available online: https://sciencing.com/the-importance-of-water-in-seeds-germination-12003533.html (accessed on 22 July 2021).
- DFB—Deutscher Fussball-Bund Sportplatzbau &-Erhaltung, 5th ed.; Deutscher Fussball-Bund: Frankfurt/Main, Germany, 2017.
- Neal, C. Planting for Pollinators: Establishing a Wildflower Meadow from Seed; University of New Hampshire: Durham, UK, 2019. [Google Scholar]
- Jarvis, D. Wildflower Meadow: Creation and Management in Land Regeneration. Available online: https://www.forestresearch.gov.uk/documents/2446/BPG_15.pdf (accessed on 10 September 2021).
- Sundermann, A.; Whelan, R.; Gaynor, B. Pratical Advice on Managing Wildflower Meadows. Available online: https://biodiversityireland.ie/practical-advice-on-managing-wildflower-meadows/ (accessed on 10 September 2021).
- METERGROUP Bodenfeuchte und Elektrische Leitfähigkeit. Available online: https://www.metergroup.com/de/environment/produkte/teros-12/ (accessed on 10 September 2021).
- METERGROUP ECRN-100 Rain Gauge (High Resolution). Available online: https://www.metergroup.com/environment/products/ecrn-100/ (accessed on 10 September 2021).
Figure 1.
Overview of the tested soil alternatives (R1, R2, E1–E8) in the linear seepage trough in Vienna, constructed in a randomized order and planted with the three different seed mixes (ST = standardized turf, FT = flowering turf, FL = flowering meadow).
Figure 1.
Overview of the tested soil alternatives (R1, R2, E1–E8) in the linear seepage trough in Vienna, constructed in a randomized order and planted with the three different seed mixes (ST = standardized turf, FT = flowering turf, FL = flowering meadow).

Figure 2.
Boxplots of infiltration rate for the tested soil alternatives for 2018–2020.
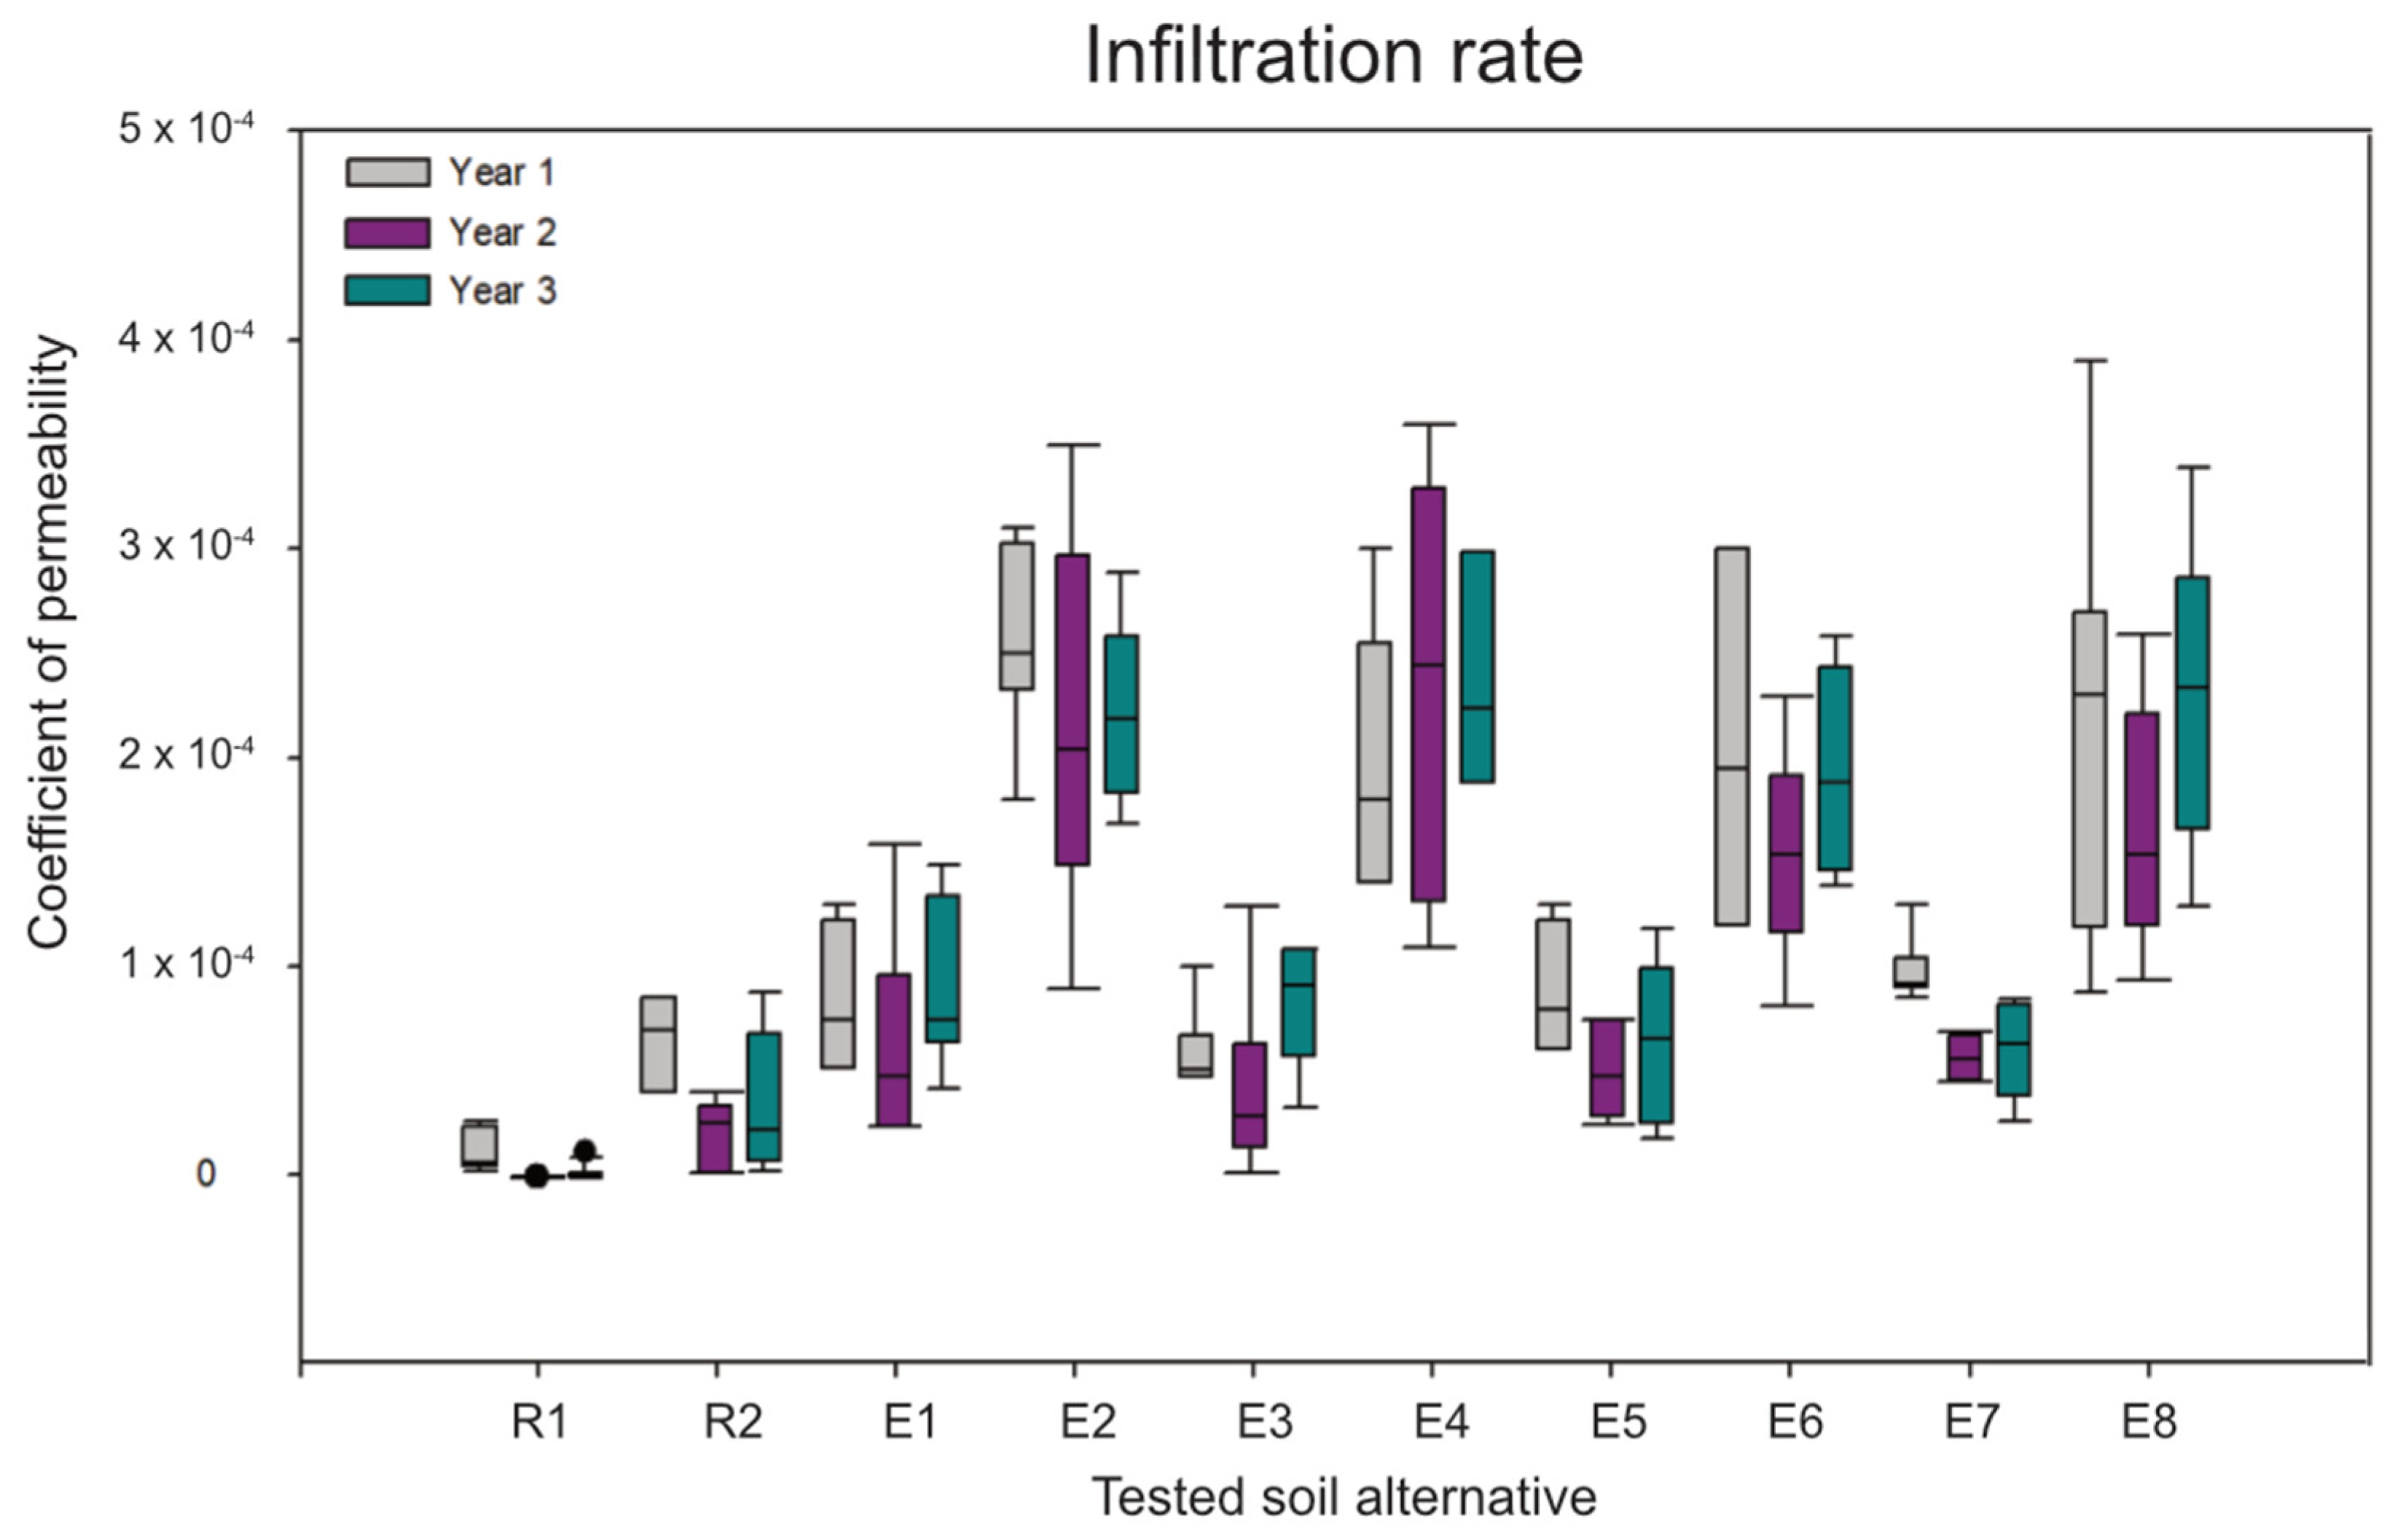
Figure 3.
Trend of soil moisture after a heavy rain event on 7 June 2019 (22.2 mm within 30 min) for R1, R2 and engineered soils E1, E2, E3, E4, E5 and E8.
Figure 3.
Trend of soil moisture after a heavy rain event on 7 June 2019 (22.2 mm within 30 min) for R1, R2 and engineered soils E1, E2, E3, E4, E5 and E8.
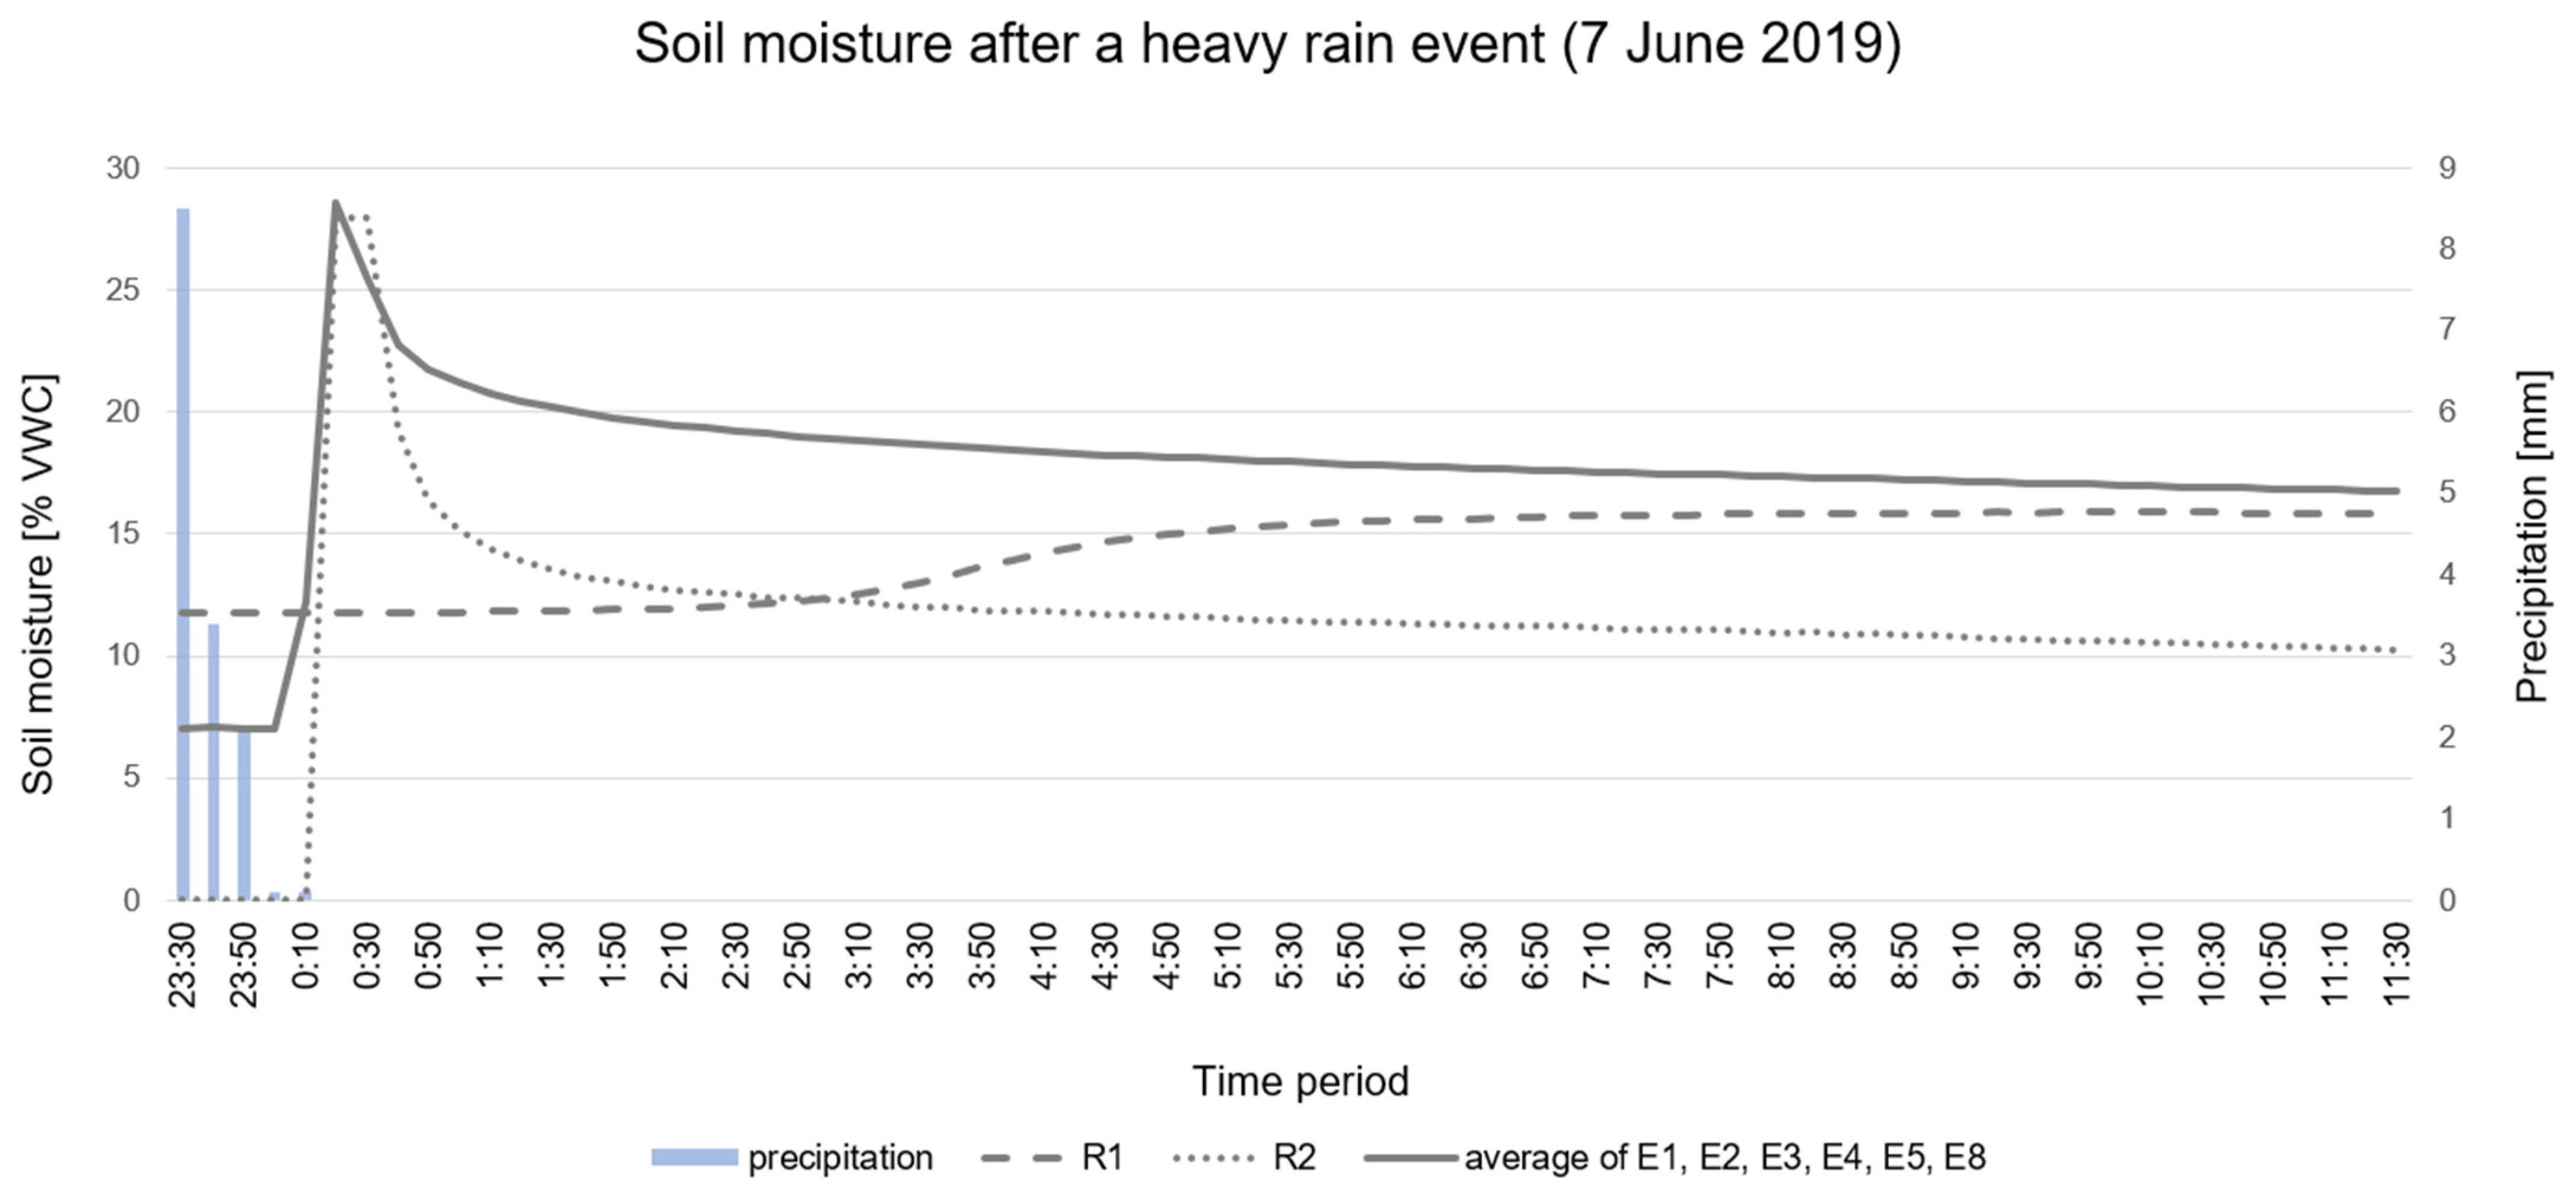
Figure 4.
Comparison of the different average cover ratios [%] of standardized turf for the tested soil alternatives in 2018–2020.
Figure 4.
Comparison of the different average cover ratios [%] of standardized turf for the tested soil alternatives in 2018–2020.
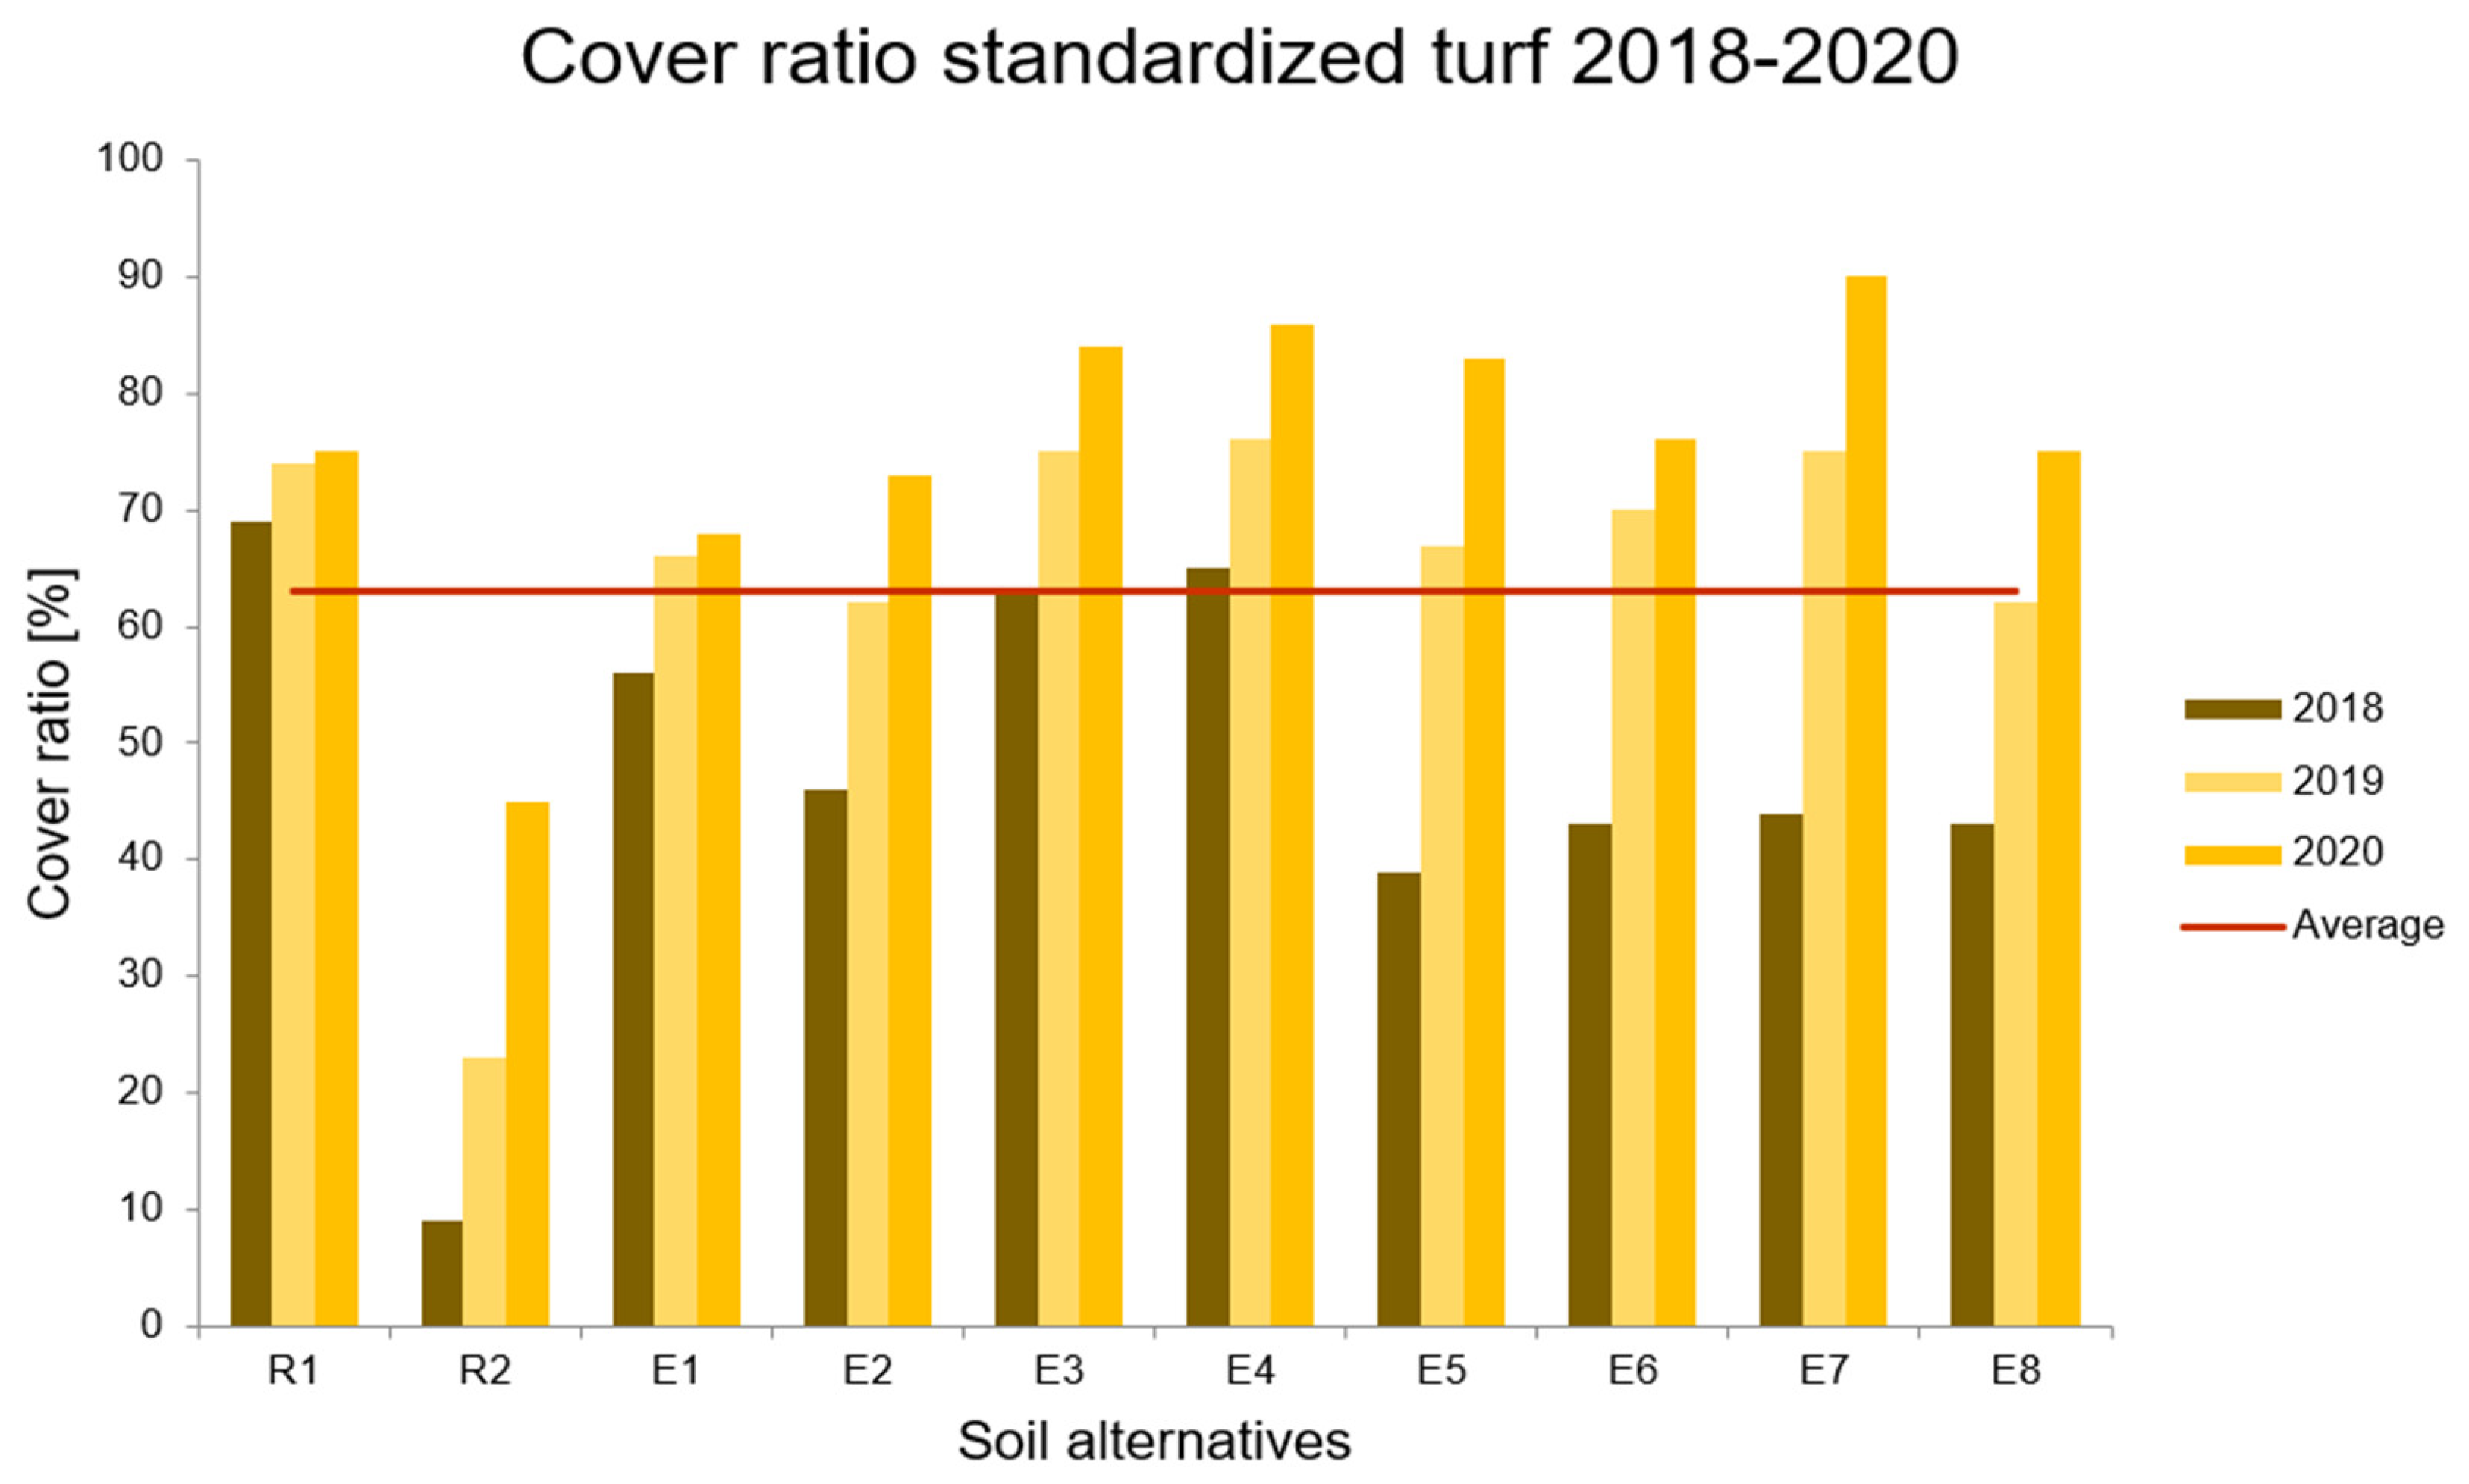
Figure 5.
Comparison of the different average cover ratios [%] of flowering turf for the tested soil alternatives in 2018–2020.
Figure 5.
Comparison of the different average cover ratios [%] of flowering turf for the tested soil alternatives in 2018–2020.

Figure 6.
Comparison of the different average cover ratios [%] of flowering meadow for the tested soil alternatives in 2018–2020.
Figure 6.
Comparison of the different average cover ratios [%] of flowering meadow for the tested soil alternatives in 2018–2020.

Figure 7.
Vitality trend of the tested soil alternatives in comparison to precipitation over the vegetation period 2019 and 2020 (grey bars = precipitation, lines = vitality trend).
Figure 7.
Vitality trend of the tested soil alternatives in comparison to precipitation over the vegetation period 2019 and 2020 (grey bars = precipitation, lines = vitality trend).
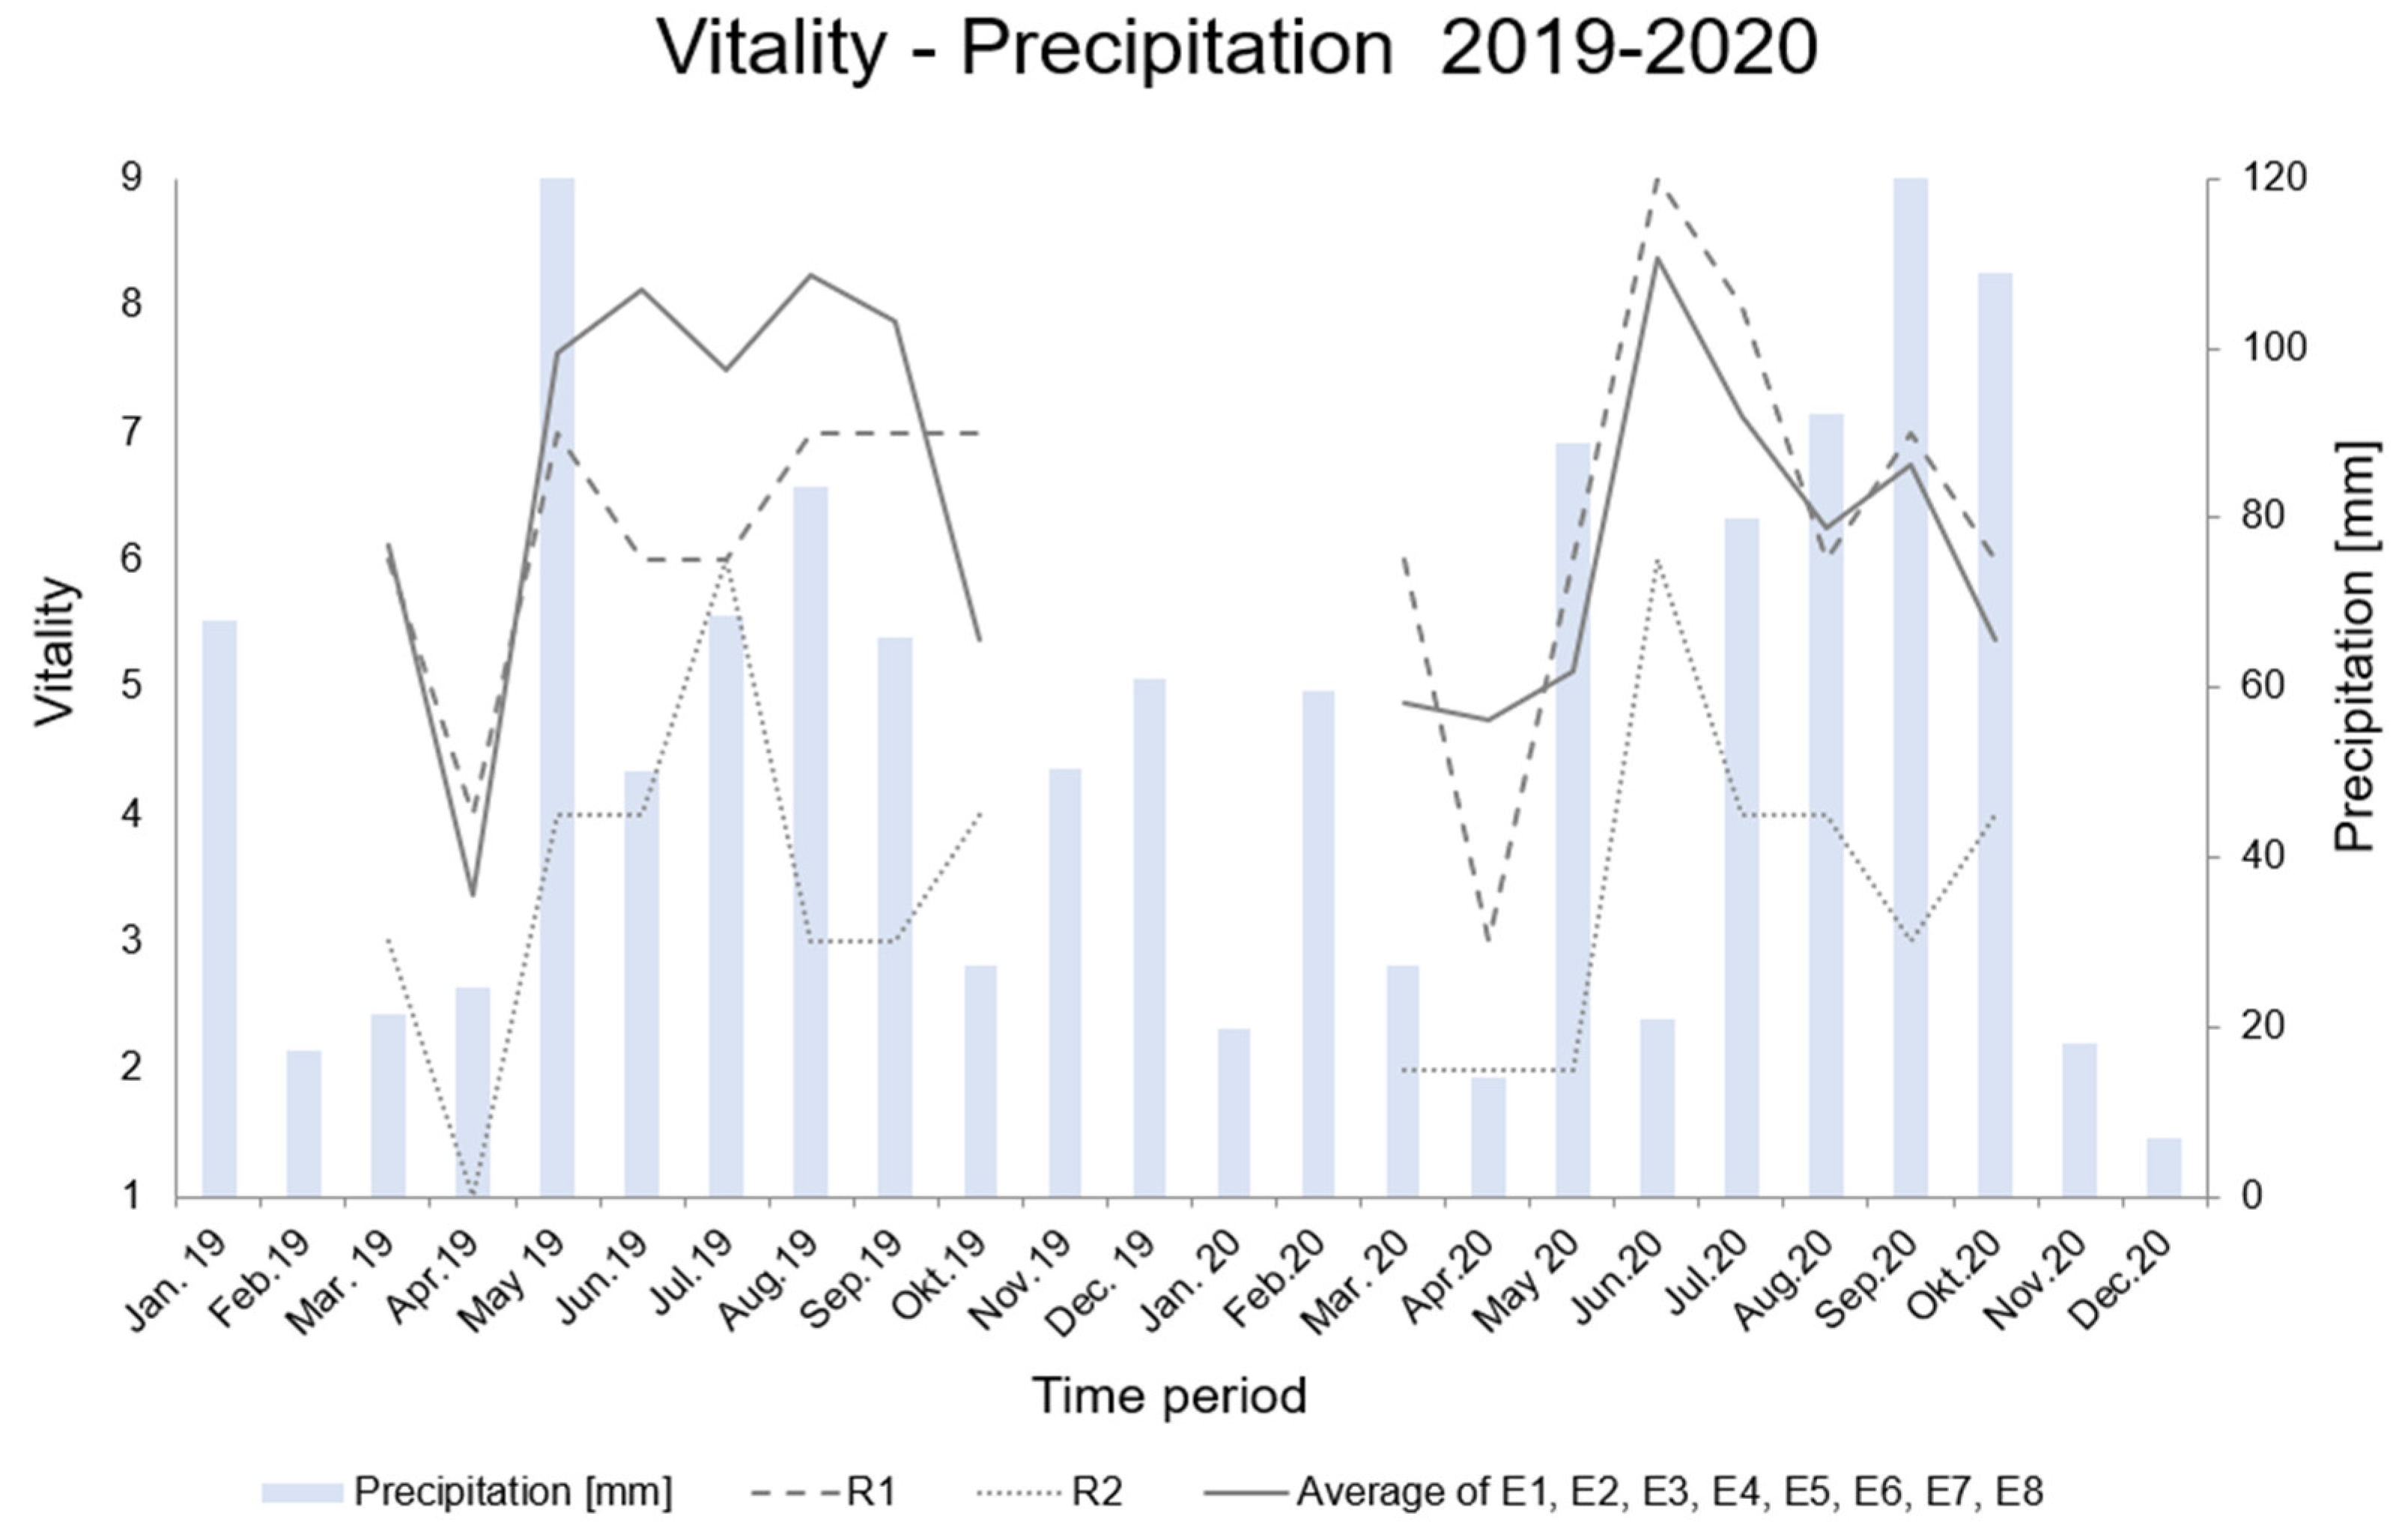
Table 1.
Overview of the tested soil alternatives.
| Tested Soil Alternative | Acronym |
|---|---|
| Topsoil (single-layered) | R1 |
| Tree engineered soil (coarse/fine-grained, multi-layered) | R2 |
| Perlite (single-layered) | E1 |
| Zeolite (single-layered) | E2 |
| Combi Perlite + Zeolite (single-layered) | E3 |
| Chalk (single-layered) | E4 |
| Retention substrate/Perlite (multi-layered) | E5 |
| Retention substrate/Zeolite (multi-layered) | E6 |
| Retention substrate/Combi Perlite + Zeolite (multi-layered) | E7 |
| Retention substrate/Chalk (multi-layered) | E8 |
Table 2.
Visual assessment index of the vitality and inflorescence classes [49].
Table 2.
Visual assessment index of the vitality and inflorescence classes [49].
| Vitality Stage | Points | Vitality | Inflorescence | |
|---|---|---|---|---|
| 1 | 9 | lush | healthy, vital, cover ratio well above specified target, vigorous growth, no effects of pest infestation, disease, deficiency or mechanical damage evident | >20 blossoms |
| 2 | 7 | vigorous | Healthy, vital, cover ratio above specified target, hardly any dead or impacted plants, hardly any impact from pest infestation, disease, deficiency or mechanical damage evident | 11–12 blossoms |
| 3 | 5 | average | Weakened, stagnant in growth, sufficient cover ratio, dead or impaired plants, effects of pest infestation, disease, deficiency or mechanical damage if any visible | 4–10 blossoms |
| 4 | 3 | puny | Heavily weakened, puny growth, insufficient cover ratio, many dead or impaired plants, visible pest infestation and/or disease and/or deficiency and/or mechanical damage | 1–3 blossoms |
| 5 | 1 | (partially) dead | dying, very low cover, predominantly dead | 0 blossoms |
Table 3.
Description of the rating system with and the weightings of the used indicators (based on Olesko 2021).
Table 3.
Description of the rating system with and the weightings of the used indicators (based on Olesko 2021).
| Indicator | Weighting |
|---|---|
| Infiltration rate | 3 |
| Cover ratio | 3 |
| Vitality | 2 |
| Inflorescence | 1 |
Table 4.
Overview of different vitality for the different seed mixes (standardized turf, flowering turf and flowering meadow) on tested soil alternatives in 2018–2020 (green = high vitality from 7–9, yellow = moderate vitality from 4–6, red = low vitality from 1–3).
Table 4.
Overview of different vitality for the different seed mixes (standardized turf, flowering turf and flowering meadow) on tested soil alternatives in 2018–2020 (green = high vitality from 7–9, yellow = moderate vitality from 4–6, red = low vitality from 1–3).
| Vitality | |||||
|---|---|---|---|---|---|
| Soil Alternative | Seed Mix | 2018 | 2019 | 2020 | Average Total |
| R1 | ST | 6.0 | 5.0 | 6.0 | 6.0 |
| FT | 6.0 | 6.0 | 6.0 | 6.0 | |
| FM | 6.0 | 6.0 | 7.0 | 6.0 | |
| R2 | ST | 2.0 | 3.0 | 2.0 | 2.0 |
| FT | 3.0 | 4.0 | 4.0 | 4.0 | |
| FM | 3.0 | 4.0 | 4.0 | 4.0 | |
| E1 | ST | 8.0 | 7.0 | 5.0 | 7.0 |
| FT | 8.0 | 7.0 | 5.0 | 7.0 | |
| FM | 8.0 | 8.0 | 7.0 | 8.0 | |
| E2 | ST | 6.0 | 7.0 | 6.0 | 6.0 |
| FT | 7.0 | 6.0 | 5.0 | 6.0 | |
| FM | 7.0 | 8.0 | 6.0 | 7.0 | |
| E3 | ST | 8.0 | 8.0 | 6.0 | 7.0 |
| FT | 4.5 | 7.0 | 7.0 | 6.0 | |
| FM | 8.0 | 8.0 | 6.0 | 7.0 | |
| E4 | ST | 4.0 | 7.0 | 6.0 | 6.0 |
| FT | 4.0 | 7.0 | 5.0 | 5.0 | |
| FM | 4.0 | 8.0 | 7.0 | 6.0 | |
| E5 | ST | 6.0 | 5.0 | 6.0 | 6.0 |
| FT | 9.0 | 7.0 | 7.0 | 8.0 | |
| FM | 9.0 | 7.0 | 7.0 | 8.0 | |
| E6 | ST | 7.0 | 6.0 | 6.0 | 6.0 |
| FT | 4.0 | 6.0 | 6.0 | 5.0 | |
| FM | 8.0 | 8.0 | 7.0 | 8.0 | |
| E7 | ST | 4.0 | 6.0 | 6.0 | 5.0 |
| FT | 8.0 | 8.0 | 7.0 | 8.0 | |
| FM | 8.0 | 7.0 | 7.0 | 7.0 | |
| E8 | ST | 6.0 | 5.0 | 5.0 | 5.0 |
| FT | 8.0 | 8.0 | 6.0 | 7.0 | |
| FM | 6.0 | 8.0 | 7.0 | 7.0 | |
Table 5.
Overview of different inflorescence for the different seed mixes (standardized turf, flowering turf and flowering meadow) on tested soil alternatives in 2018–2020 (green = high vitality from 7–9, yellow = moderate vitality from 4–6, red = low vitality from 1–3).
Table 5.
Overview of different inflorescence for the different seed mixes (standardized turf, flowering turf and flowering meadow) on tested soil alternatives in 2018–2020 (green = high vitality from 7–9, yellow = moderate vitality from 4–6, red = low vitality from 1–3).
| Inflorescence | |||||
|---|---|---|---|---|---|
| Soil Alternative | Seed Mix | 2018 | 2019 | 2020 | Average Total |
| R1 | ST | 5 | 5 | 5 | 5 |
| FT | 5 | 7 | 7 | 6 | |
| FM | 5 | 7 | 7 | 6 | |
| R2 | ST | 1 | 5 | 3 | 3 |
| FT | 1 | 5 | 5 | 4 | |
| FM | 1 | 7 | 7 | 5 | |
| E1 | ST | 5 | 7 | 7 | 6 |
| FT | 7 | 7 | 7 | 7 | |
| FM | 7 | 7 | 7 | 7 | |
| E2 | ST | 7 | 7 | 7 | 7 |
| FT | 5 | 7 | 7 | 6 | |
| FM | 7 | 9 | 7 | 8 | |
| E3 | ST | 7 | 7 | 7 | 7 |
| FT | 5 | 7 | 7 | 6 | |
| FM | 9 | 7 | 7 | 8 | |
| E4 | ST | 5 | 7 | 7 | 6 |
| FT | 7 | 9 | 7 | 8 | |
| FM | 9 | 9 | 7 | 8 | |
| E5 | ST | 5 | 5 | 7 | 6 |
| FT | 9 | 9 | 7 | 8 | |
| FM | 9 | 9 | 7 | 8 | |
| E6 | ST | 5 | 7 | 7 | 6 |
| FT | 5 | 7 | 7 | 6 | |
| FM | 9 | 9 | 7 | 8 | |
| E7 | ST | 5 | 7 | 7 | 6 |
| FT | 9 | 7 | 7 | 8 | |
| FM | 9 | 9 | 7 | 8 | |
| E8 | ST | 5 | 7 | 5 | 6 |
| FT | 9 | 7 | 7 | 8 | |
| FM | 9 | 9 | 7 | 8 | |
Table 6.
Overview of evaluation chart for the different seed mixes (standardized turf, flowering turf and flowering meadow) on tested soil alternatives in 2018–2020.
Table 6.
Overview of evaluation chart for the different seed mixes (standardized turf, flowering turf and flowering meadow) on tested soil alternatives in 2018–2020.
| Evaluation Chart | |||||||
|---|---|---|---|---|---|---|---|
| Soil Alternative | Seed Mix | 2018 | 2019 | 2020 | Total Points | Average Total | %-Total |
| R1 | ST | 13.0 | 13.0 | 18.0 | 44.0 | ||
| FT | 17.0 | 17.0 | 17.0 | 51.0 | 48.7 | 60 | |
| FM | 17.0 | 17.0 | 17.0 | 51.0 | |||
| R2 | ST | 16.0 | 16.0 | 15.0 | 47.0 | ||
| FT | 16.0 | 16.0 | 16.0 | 48.0 | 50.7 | 63 | |
| FM | 18.0 | 18.0 | 21.0 | 57.0 | |||
| E1 | ST | 23.0 | 23.0 | 21.0 | 67.0 | ||
| FT | 20.0 | 20.0 | 21.0 | 61.0 | 66.7 | 82 | |
| FM | 23.0 | 23.0 | 26.0 | 72.0 | |||
| E2 | ST | 23.0 | 23.0 | 21.0 | 67.0 | ||
| FT | 20.0 | 20.0 | 21.0 | 61.0 | 66.3 | 82 | |
| FM | 24.0 | 24.0 | 23.0 | 71.0 | |||
| E3 | ST | 23.0 | 23.0 | 21.0 | 67.0 | ||
| FT | 23.0 | 23.0 | 23.0 | 69.0 | 68.3 | 84 | |
| FM | 23.0 | 23.0 | 23.0 | 69.0 | |||
| E4 | ST | 23.0 | 23.0 | 23.0 | 69.0 | ||
| FT | 24.0 | 24.0 | 21.0 | 69.0 | 69.7 | 86 | |
| FM | 24.0 | 24.0 | 23.0 | 71.0 | |||
| E5 | ST | 21.0 | 21.0 | 21.0 | 63.0 | ||
| FT | 24.0 | 24.0 | 23.0 | 71.0 | 68.3 | 84 | |
| FM | 24.0 | 24.0 | 23.0 | 71.0 | |||
| E6 | ST | 23.0 | 23.0 | 21.0 | 67.0 | ||
| FT | 18.0 | 18.0 | 21.0 | 57.0 | 65.0 | 80 | |
| FM | 24.0 | 24.0 | 23.0 | 71.0 | |||
| E7 | ST | 23.0 | 23.0 | 21.0 | 67.0 | 71.0 | 88 |
| FT | 23.0 | 23.0 | 26.0 | 72.0 | |||
| FM | 24.0 | 24.0 | 26.0 | 74.0 | |||
| E8 | ST | 21.0 | 21.0 | 21.0 | 63.0 | 67.7 | 84 |
| FT | 23.0 | 23.0 | 23.0 | 69.0 | |||
| FM | 24.0 | 24.0 | 23.0 | 71.0 | |||
Publisher’s Note: MDPI stays neutral with regard to jurisdictional claims in published maps and institutional affiliations. |
© 2021 by the authors. Licensee MDPI, Basel, Switzerland. This article is an open access article distributed under the terms and conditions of the Creative Commons Attribution (CC BY) license (https://creativecommons.org/licenses/by/4.0/).
Share and Cite
MDPI and ACS Style
Weiss, O.; Minixhofer, P.; Werner, N.; Riedenbauer, S.; Olesko, E.; Lübke, K.; Scharf, B.; Pitha, U. Alternative Engineered Soils and Seed Mixes Used for Seepage Troughs. Land 2021, 10, 1152. https://doi.org/10.3390/land10111152
AMA Style
Weiss O, Minixhofer P, Werner N, Riedenbauer S, Olesko E, Lübke K, Scharf B, Pitha U. Alternative Engineered Soils and Seed Mixes Used for Seepage Troughs. Land. 2021; 10(11):1152. https://doi.org/10.3390/land10111152
Chicago/Turabian StyleWeiss, Oliver, Pia Minixhofer, Nadine Werner, Stefan Riedenbauer, Elisabeth Olesko, Katharina Lübke, Bernhard Scharf, and Ulrike Pitha. 2021. "Alternative Engineered Soils and Seed Mixes Used for Seepage Troughs" Land 10, no. 11: 1152. https://doi.org/10.3390/land10111152
Note that from the first issue of 2016, this journal uses article numbers instead of page numbers. See further details here.