
Integrating Quantity and Quality to Assess Urban Green Space Improvement in the Compact City


1
Institute of Geography, Humboldt Universität zu Berlin, Rudower Chaussee 16, 12489 Berlin, Germany
2
Helmholtz Centre for Environmental Research–UFZ, Department of Computational Landscape Ecology, 04318 Leipzig, Germany
3
Key Lab for Environmental Computation and Sustainability of Liaoning Province, Shenyang 110016, China
4
Key Lab of Pollution Ecology and Environmental Engineering, Institute of Applied Ecology, Chinese Academy of Sciences, Shenyang 110016, China
*
Author to whom correspondence should be addressed.
Land 2021, 10(12), 1367; https://doi.org/10.3390/land10121367
Submission received: 1 November 2021
/
Revised: 5 December 2021
/
Accepted: 8 December 2021
/
Published: 11 December 2021
(This article belongs to the Special Issue Human-Urban Green Space Interactions and Their Integration into Urban and Green Space Planning and Management)
Abstract
:Urban green space (UGS) has gained much attention in terms of urban ecosystems and human health. Measures to improve green space in compact cities are important for urban sustainability. However, there is a knowledge gap between UGS improvement and planning management. Based on the integration of quantity and quality, this research aims to identify UGS changes during urban development and suggest ways to improve green space. We analyse land use changes, conduct a hotspot analysis of land surface temperature (LST) between 2005 and 2015 at the city scale, and examine the changes in small, medium and large patches at the neighbourhood scale to guide decision-makers in UGS management. The results show that (i) the redevelopment of urban brownfields is an effective method for increasing quantity, with differences depending on regional functions; (ii) small, medium and large patches of green space have significance in terms of improving the quality of temperature mitigation, with apparent coldspot clustering from 2005 to 2015; and (iii) the integration of UGS quality and quantity in planning management is beneficial to green space sustainability. Green space improvement needs to emphasize the integration of UGS quantity and quality to accommodate targeted planning for local conditions.
1. Introduction
Sustainable Development Goal 11 of the United Nations (UN) 2030 Agenda emphasizes making cities and human settlements inclusive, safe, resilient, and sustainable [1]. Urban green space (UGS) plays a crucial role in urban human habitats, which are expected to support 68% of the world population by 2050 [2]. With the acceleration of urban problems, such as air pollution, urban flooding, urban heat, and human health crises, the need for UGS improvement to maintain human wellbeing and support urban ecosystems has increasingly been recognized [3,4].
UGS improvement has been discussed temporally in terms of a triad of concepts, namely, “nature in cities”, “nature for cities”, and the “nature of cities” [5], and spatially at the global, city and neighbourhood scales. UGS is generally defined as a space covered with vegetation and as the basic infrastructure of cities; it can take multiple forms, such as public parks, urban forests, community gardens, cemeteries, and natural conservation areas. Given that different forms of UGS have dynamic shapes, sizes, patterns, and ecosystem functions, more consideration should be given to specific local conditions for UGS improvement [6]. With land use modification and urban redevelopment [7], understanding how to improve UGS has become a key point for providing universal access to safe, inclusive and accessible green space worldwide [8].
Landscape ecology provides insight into UGS improvement [9], suggesting a principle of green space related to structures as well as ecological functions [10]. Generally, assessments of the amount and ecological functions of UGS have been adopted in numerous studies. In terms of UGS amount, the methods for measuring quantity include the percentage of green space, greening rate, normalized difference vegetation index (NDVI) [11,12], and green view index [13]. Taking into account UGS patches, the multifunctional management of land use is the basis of large, medium and small patches serving as urban green corridors and stepping stones in a UGS network [14]. With green wedges, green ways, and green extension, urban space strategies for expansion under urbanization have demonstrated good connections by guiding the locations and amounts of UGS [15].
Concerning ecological functions, the association between UGS patterns and ecosystem services provides potential for UGS quality improvement. The ecological functions of UGS provide benefits of mitigating temperature, storing carbon, purifying water and air, mitigating pollution, and promoting human mental and physical health [16,17,18,19]. Methods based on remote sensing are beneficial for calculating ecosystem functions to guide UGS planning [20]. For example, the spatial heterogeneity of land surface temperature (LST) identifies hot-cold spots that have a characteristic relationship with UGS patterns to enhance temperature mitigation [21,22]. Hotspots are defined as higher-temperature areas, while coldspots are defined as lower-temperature areas [23]. In general, the higher the quality of UGS is, the lower the temperature. Hotspot analysis has potential to optimize UGS planning based on the differential impact of patterns on ecological processes [13]. Combining the UGS amount and ecosystem functions, the integration of quantity and quality is needed to achieve UGS improvement, but insufficient attention has been paid to this issue.
With urban development and population growth, compact cities are facing competition for land to meet the demands of anthropogenic progress, which presents obstacles in terms of UGS development [24]. The compact city is being applied globally as an urban form for a sustainable urban future; the main characteristic is a higher density of urban living. To improve the UGS of compact cities, cities around the world have been exploring various strategies and designs. For example, some European and Chinese cities have expanded urban parks by transforming farmland into suburban areas [25,26], and brownfields have been converted into green space in American and European cities [27,28]. Community gardens and pocket parks in North America and Singapore and green belts in Europe have been established to strengthen UGS connections. In Finland, ecosystem services of carbon dioxide sequestration and recreation functions have been taken into account for the better design of green space to improve ecosystem quality [29]. UGS in Germany has a significant development goal of creating green space near residential areas [30]. Under the concept that “lucid waters and lush mountains are invaluable assets”, urban decision-makers in China are considering how to utilize UGS to drive economic growth [31]. In Singapore, UGS improvements are believed to support a sustainable economy by attracting talented and highly educated people [6]. Given the consideration of the economy, ecology, and society, UGS in compact cities under land competition emphasizes planning practices for decision-makers [32,33].
However, a gap between UGS quantity and quality and planning management exists for decision-makers in terms of improving UGS in compact metropolitan areas. Due to the importance of UGS quantity and quality, the identification of specific strategies could provide information for targeted planning. On the one hand, increasing the quantity of green spaces in a limited area requires refined land use management; on the other hand, climate adaptation, considered an important function of green space, can demonstrate the UGS quality of temperature mitigation. Therefore, this study aims to determine the integration of UGS quantity and quality to achieve UGS improvement and suggest planning management. We chose Berlin, one of the greenest cities in Europe and a compact city with a growing population, as the study city [34]. This research analyses spatiotemporal quantity changes in public UGS between 2005 and 2015 based on land use changes at the city scale, identifies quality changes using the hot-cold spots of LST, and specifically demonstrates the changes in large, medium and small patches at the neighbourhood scale.
Our study aims to answer the following questions:
- (i)
- What were the changes in UGS quantity and quality between 2005 and 2015?
- (ii)
- What specific green space management has been undertaken at the neighbourhood scale that we can detect in terms of both quantity and quality?
- (iii)
- What conclusions for other large cities can be drawn from the data analysis performed for Berlin for this 10-year period?
2. Materials and Methods
2.1. Study Area
Berlin (52°27′ N, 13°19′ E) is in northeast Germany. As the capital city of Germany, Berlin contains 12 administrative districts (Figure 1). The city covered 891.1 km2 and had 3.67 million people in 2019, and it is estimated that its population will reach 4 million by 2030 [35]. Berlin UGS consists of forests, parks, allotment gardens, cemeteries, transportation green space and other areas. Public green space covers approximately 30% of the city area, which was confirmed by considering 2800 public parks in 2014 [36]. According to the standard value in Berlin, accessibility to green space is defined as a minimum of 6 m2 per capita and a maximum walking time of 15 min to the nearest green space [37]. The statistics of public UGS distribution in 12 districts show differences, with suburban areas having the highest percentage [38]. Under conditions of population growth and urban development, the Berlin 2030 strategy demonstrates UGS implementation for the purpose of building a human-natural system and achieving a sustainable city [39].
2.2. Land Use Change Analysis and Greening Rate
This study applied the 2005 and 2015 land use data downloaded from the Berlin Senate Department of Urban Development and Housing (https://www.berlin.de/umweltatlas/en/land-use/ accessed on 19 February 2018). We further reclassified land use into five classes: built-up area, green space, farmland, brownfield, and water. Land use changes were applied in ArcGIS 10.7 to calculate the area of additional, remaining and decreased UGS between 2005 and 2015. This study focused on four types of public green space: forests, parks, cemeteries, and community gardens. The green rate of each district was illustrated by the green space percentage of the district area. For a further discussion on patch management, we divided the green space into three types according to patch area (PA)—small patches (PA ≤ 2 ha), medium patches (2 ha < PA ≤ 10 ha), and large patches (PA > 10 ha)—based on the sizes of pocket parks, which are generally less than 2 ha [40], and large forest areas, which are generally larger than 10 ha [41].
2.3. NDVI and LST Retrieval
Landsat 7 Enhanced Thematic Mapper Plus (ETM+) images in July 2006 and 2015 without clouds were downloaded from the United States Geological Survey (USGS) Earth Explorer (https://earthexplorer.usgs.gov/ accessed on 20 May 2019). LST was retrieved through the single-window method [42], where land surface emissivity was obtained by the NDVI threshold method [43]. NDVI is an index of vegetation calculated from the band 4-near-infrared band (30 m) and the band 3-visible band (30 m) [44].
2.4. Hotspot Analysis and Pearson Analysis
Hotspot analysis was conducted in ArcGIS 10.7 to calculate the Getis-Ord Gi * statistic and show the cluster pattern of LST hotspots, nonsignificant spots, and coldspots [45]. The Gi-Bin value was utilized to determine the statistical significance of hot- and coldspots. Hotspot analysis, as a method of spatial analysis in geographic information system (GIS), has received much attention regarding LST heterogeneity and its relationship with land use management [46,47]. Such analysis identifies a vector of the LST characteristics to identify the consistency of temperature with high-value clustering as hotspots and low-value clustering as coldspots. The pattern of hot-cold spot changes can show the neighbouring relationship among features [45] and has been confirmed to be an accurate and effective approach to mapping and analysing pattern clusters [48]. In the clustering pattern, hotspots are represented by high-LST-value clustering, nonsignificant spots represent areas with LST values ranging from high to low without apparent clustering, and coldspots are represented by low-LST-value clustering [49]. Additionally, Pearson analysis was used to analyse the correlation of LST and NDVI with PA.
2.5. Specific-Site Analysis at the Neighbourhood Scale
To further understand the planning practice of green space, three specific sites were chosen to present UGS improvement from the results of the hotspot analysis. We analysed changes in UGS quality and quantity at the neighbourhood scale. Further comparison of the planning practices was demonstrated through the related literature [39,50], the changes in large, medium, and small patches, and the cluster pattern of hot-cold spots.
3. Results
3.1. Quantity Changes at the City Scale
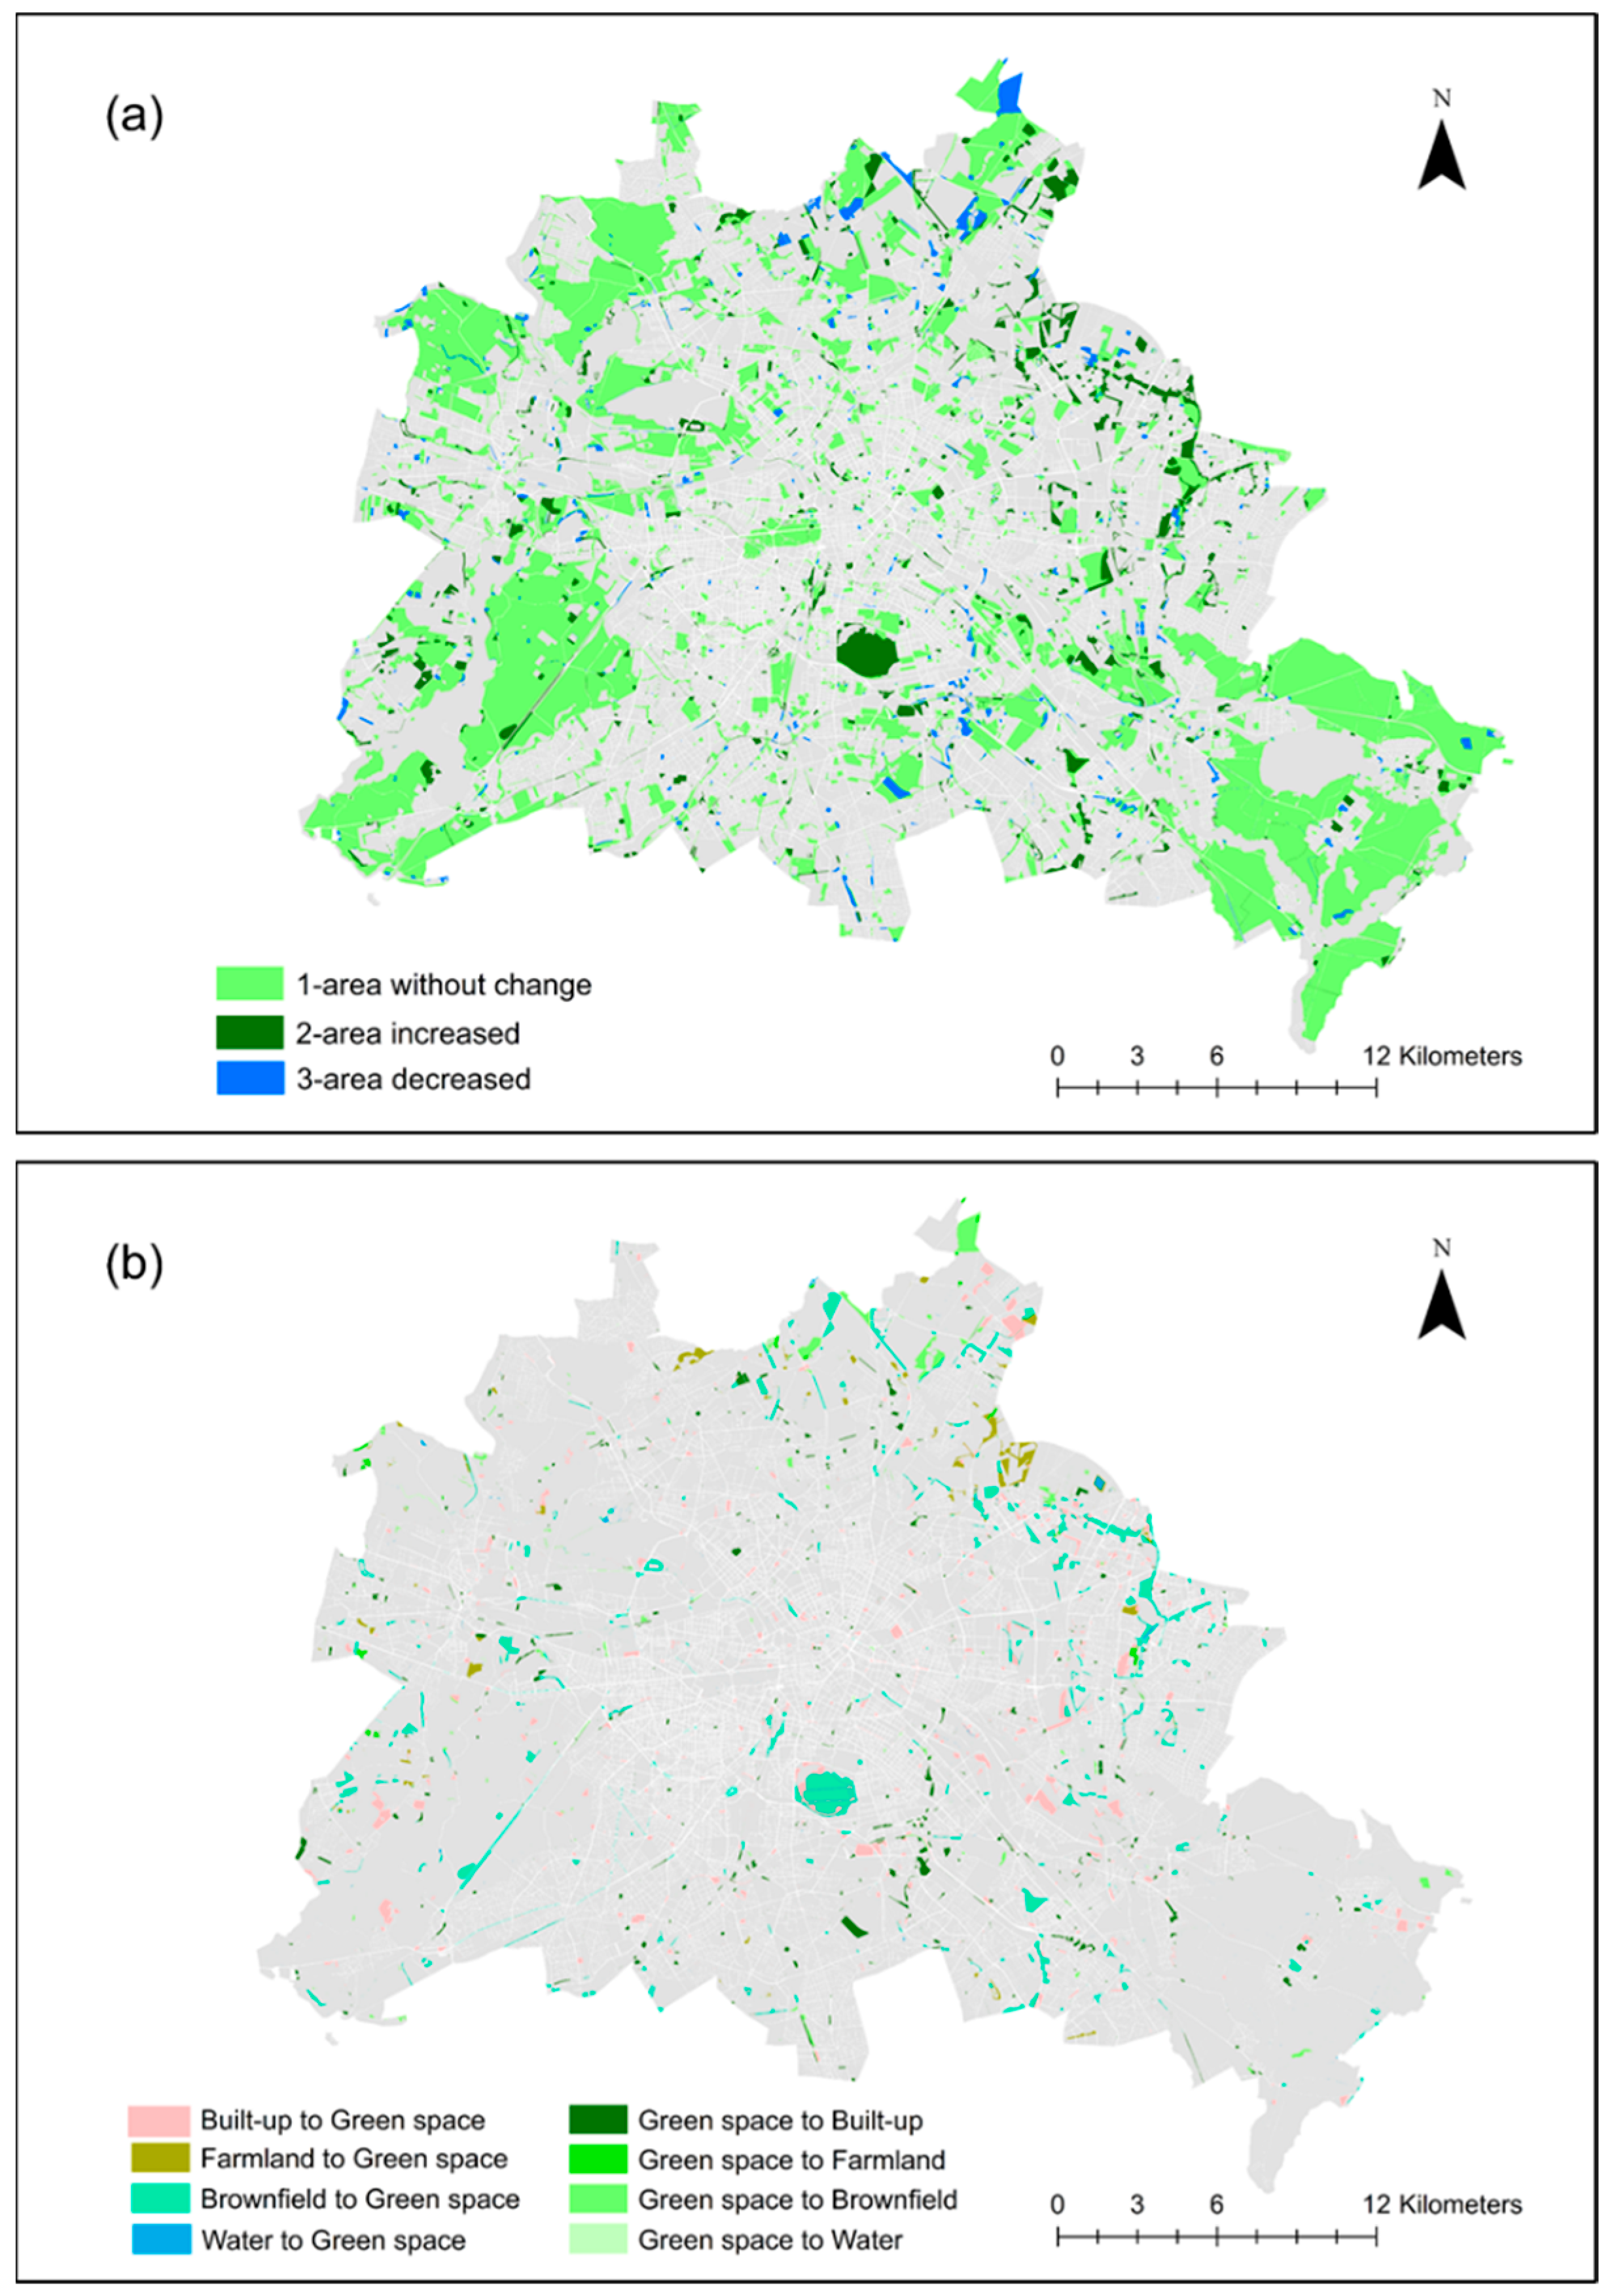
The analysis of land use changes in the studied decade showed a clearly apparent increase in green space and a decrease in built-up areas and farmlands. Total UGS increased by 1622.12 ha from 2005 to 2015. Figure 2 shows that the area increased was mainly attributable to the transformation from built-up areas (1236.55 ha) and brownfields (1422.34 ha). The quantity changes in the east were greater than those in the west, mainly because of changes from built-up areas, brownfields, and farmlands to green space. Furthermore, the 12 districts showed an overall increase in the quantity of green space with different kinds of changes. The three districts with the largest additional green space were Pankow, Marzahn-Hellersdorf, and Treptow-Köpenick at 436.53 ha, 435.39 ha, and 406.79 ha, respectively (Table 1). The districts with the highest rate of increase were Marzahn-Hellersdorf, Lichtenberg, and Tempelhof-Schöneberg, with rates of increase of 6.15%, 5.87%, and 5.49%, respectively. Mitte and Friedrichshain-Kreuzberg, as city cores, had less additional green space than the other districts. The quantity changes in UGS in each district depended on the regional functional conditions.
3.2. Quality Changes with LST Hot-Cold Spots at the Patch Scale
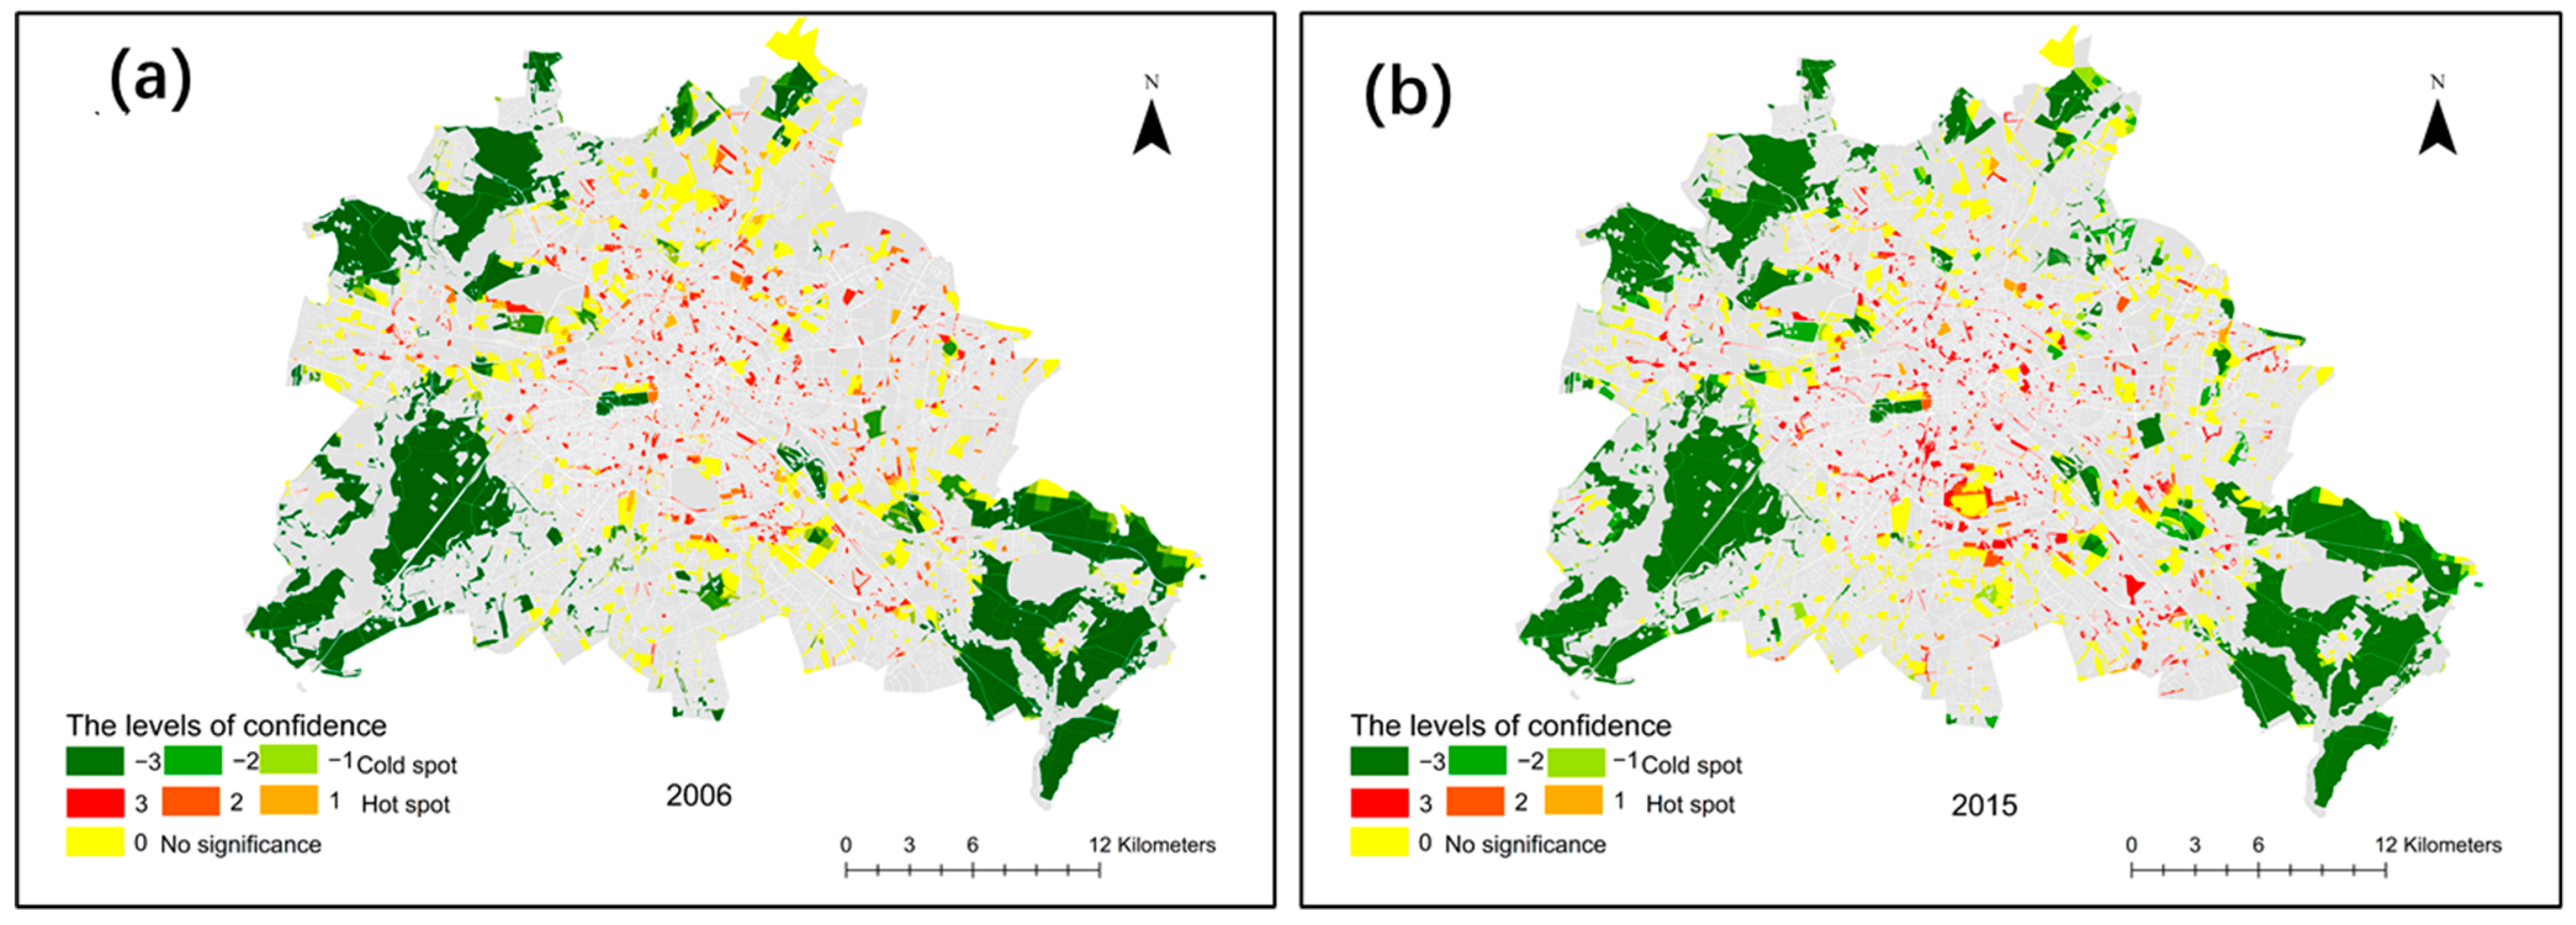
From the perspective of landscape ecology, large, medium, and small patches contribute to the quality of UGS modified through LST hotspot analysis. The minimum area of small patches in 2015 was less than that in 2005, and the maximum area of large patches in 2015 was larger than that in 2005. The number of large patches decreased from 372 to 371, with the area increasing by approximately 2000 ha and an average NDVI of more than 0.5. In comparison, medium patches increased in number, and their area rose by approximately 220 ha, with the average NDVI falling between 0.3 and 0.5. The number of small patches increased from 1295 to 1526, with an increase of approximately 110 ha, and the average NDVI between 0.3 and 0.5. Moreover, the hot- and coldspot pattern shown in Figure 3 demonstrates the changes in ecological functions to mitigate the temperature response to the pattern dynamics of the green space. In this decade, temperature mitigation effectively increased, as indicated by more coldspots in the LST. In addition, the remaining green space from 2005 to 2015 had Gi-Bin values from −1 to −3, which implied the strength of UGS quality, while some additional green space emerged in hotspots with G-Bin values larger than 1. Most hotspots were located in small and medium patches; in contrast, coldspots were distributed mainly in large patches. As shown in Figure 4, some large patches in the northeast were developed and present clusters of coldspots compared with those in 2005. Furthermore, Table 2 shows a significantly negative correlation between LST and PA in small, medium and large patches, while NDVI was positively correlated with PA. This finding implied that the PA of green space has a positive correlation with UGS quality.
3.3. Planning Practices at the Neighbourhood Scale
To investigate the integration of quality and quantity for improving UGS in compact cities, we further explored three site changes at the neighbourhood scale to provide guidance for decision-makers. First, increasing UGS quantity is considered during land redevelopment into large patches. Second, such a management link improves the UGS quality and UGS network. Third, increasing UGS with small and medium patches is practical in the city centre.
3.3.1. Site 1: Large Patches Increased by Redeveloping Brownfields
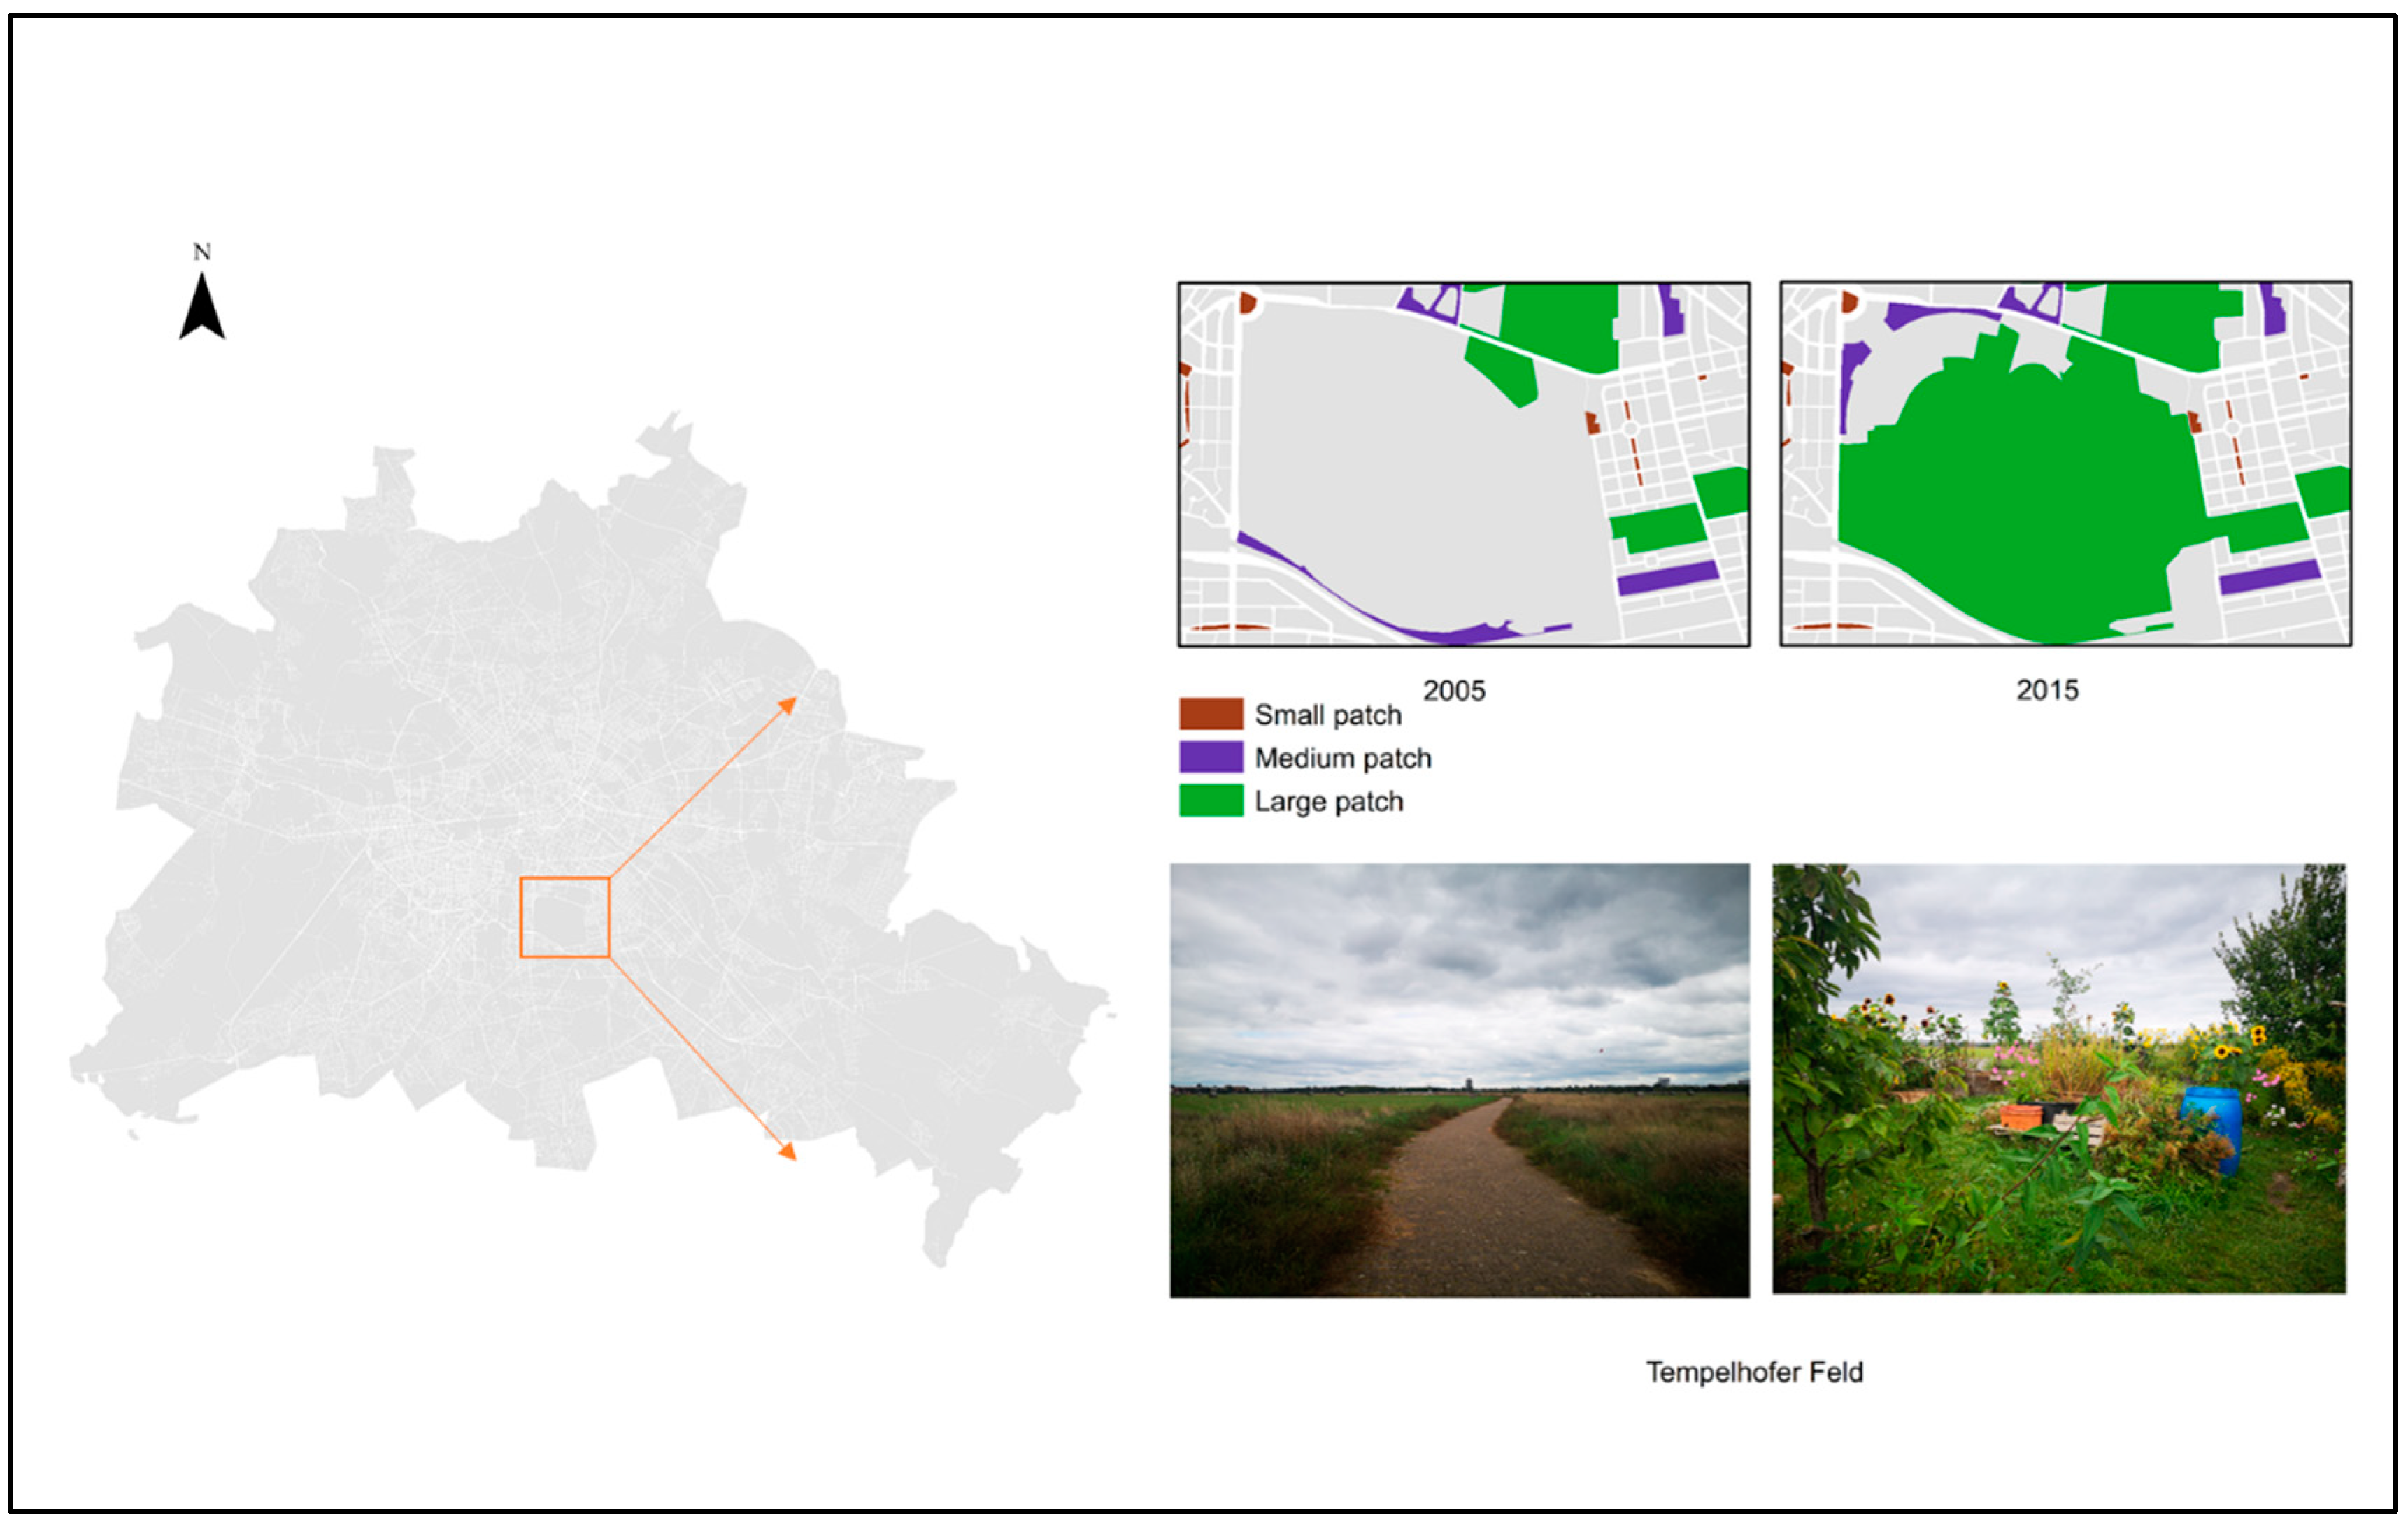
Increasing the quantity of large UGS patches by restoring brownfields could be an essential step in UGS improvement. Figure 4 shows the example of Tempelhofer Feld, which was converted from the Berlin-Tempelhof airport and planned as a large inner park to promote recreation and urban resilience. The airport was closed in 2008 and it was reopened for public use in 2010 as a public park with community participation [51]. As a flexible public space with resiliency goals, Tempelhofer Feld was designed to provide more space to develop ecological systems and human activities [52]. Community gardens, animal landscape conservation, history exhibition, project usage, and other recreational areas emerged in the park to provide multiple functions for both humans and nature. In the implementation processes, civic engagement played an important role in park events and activities [51].
3.3.2. Site 2: Medium and Large Patches for Improving Urban Green Networks
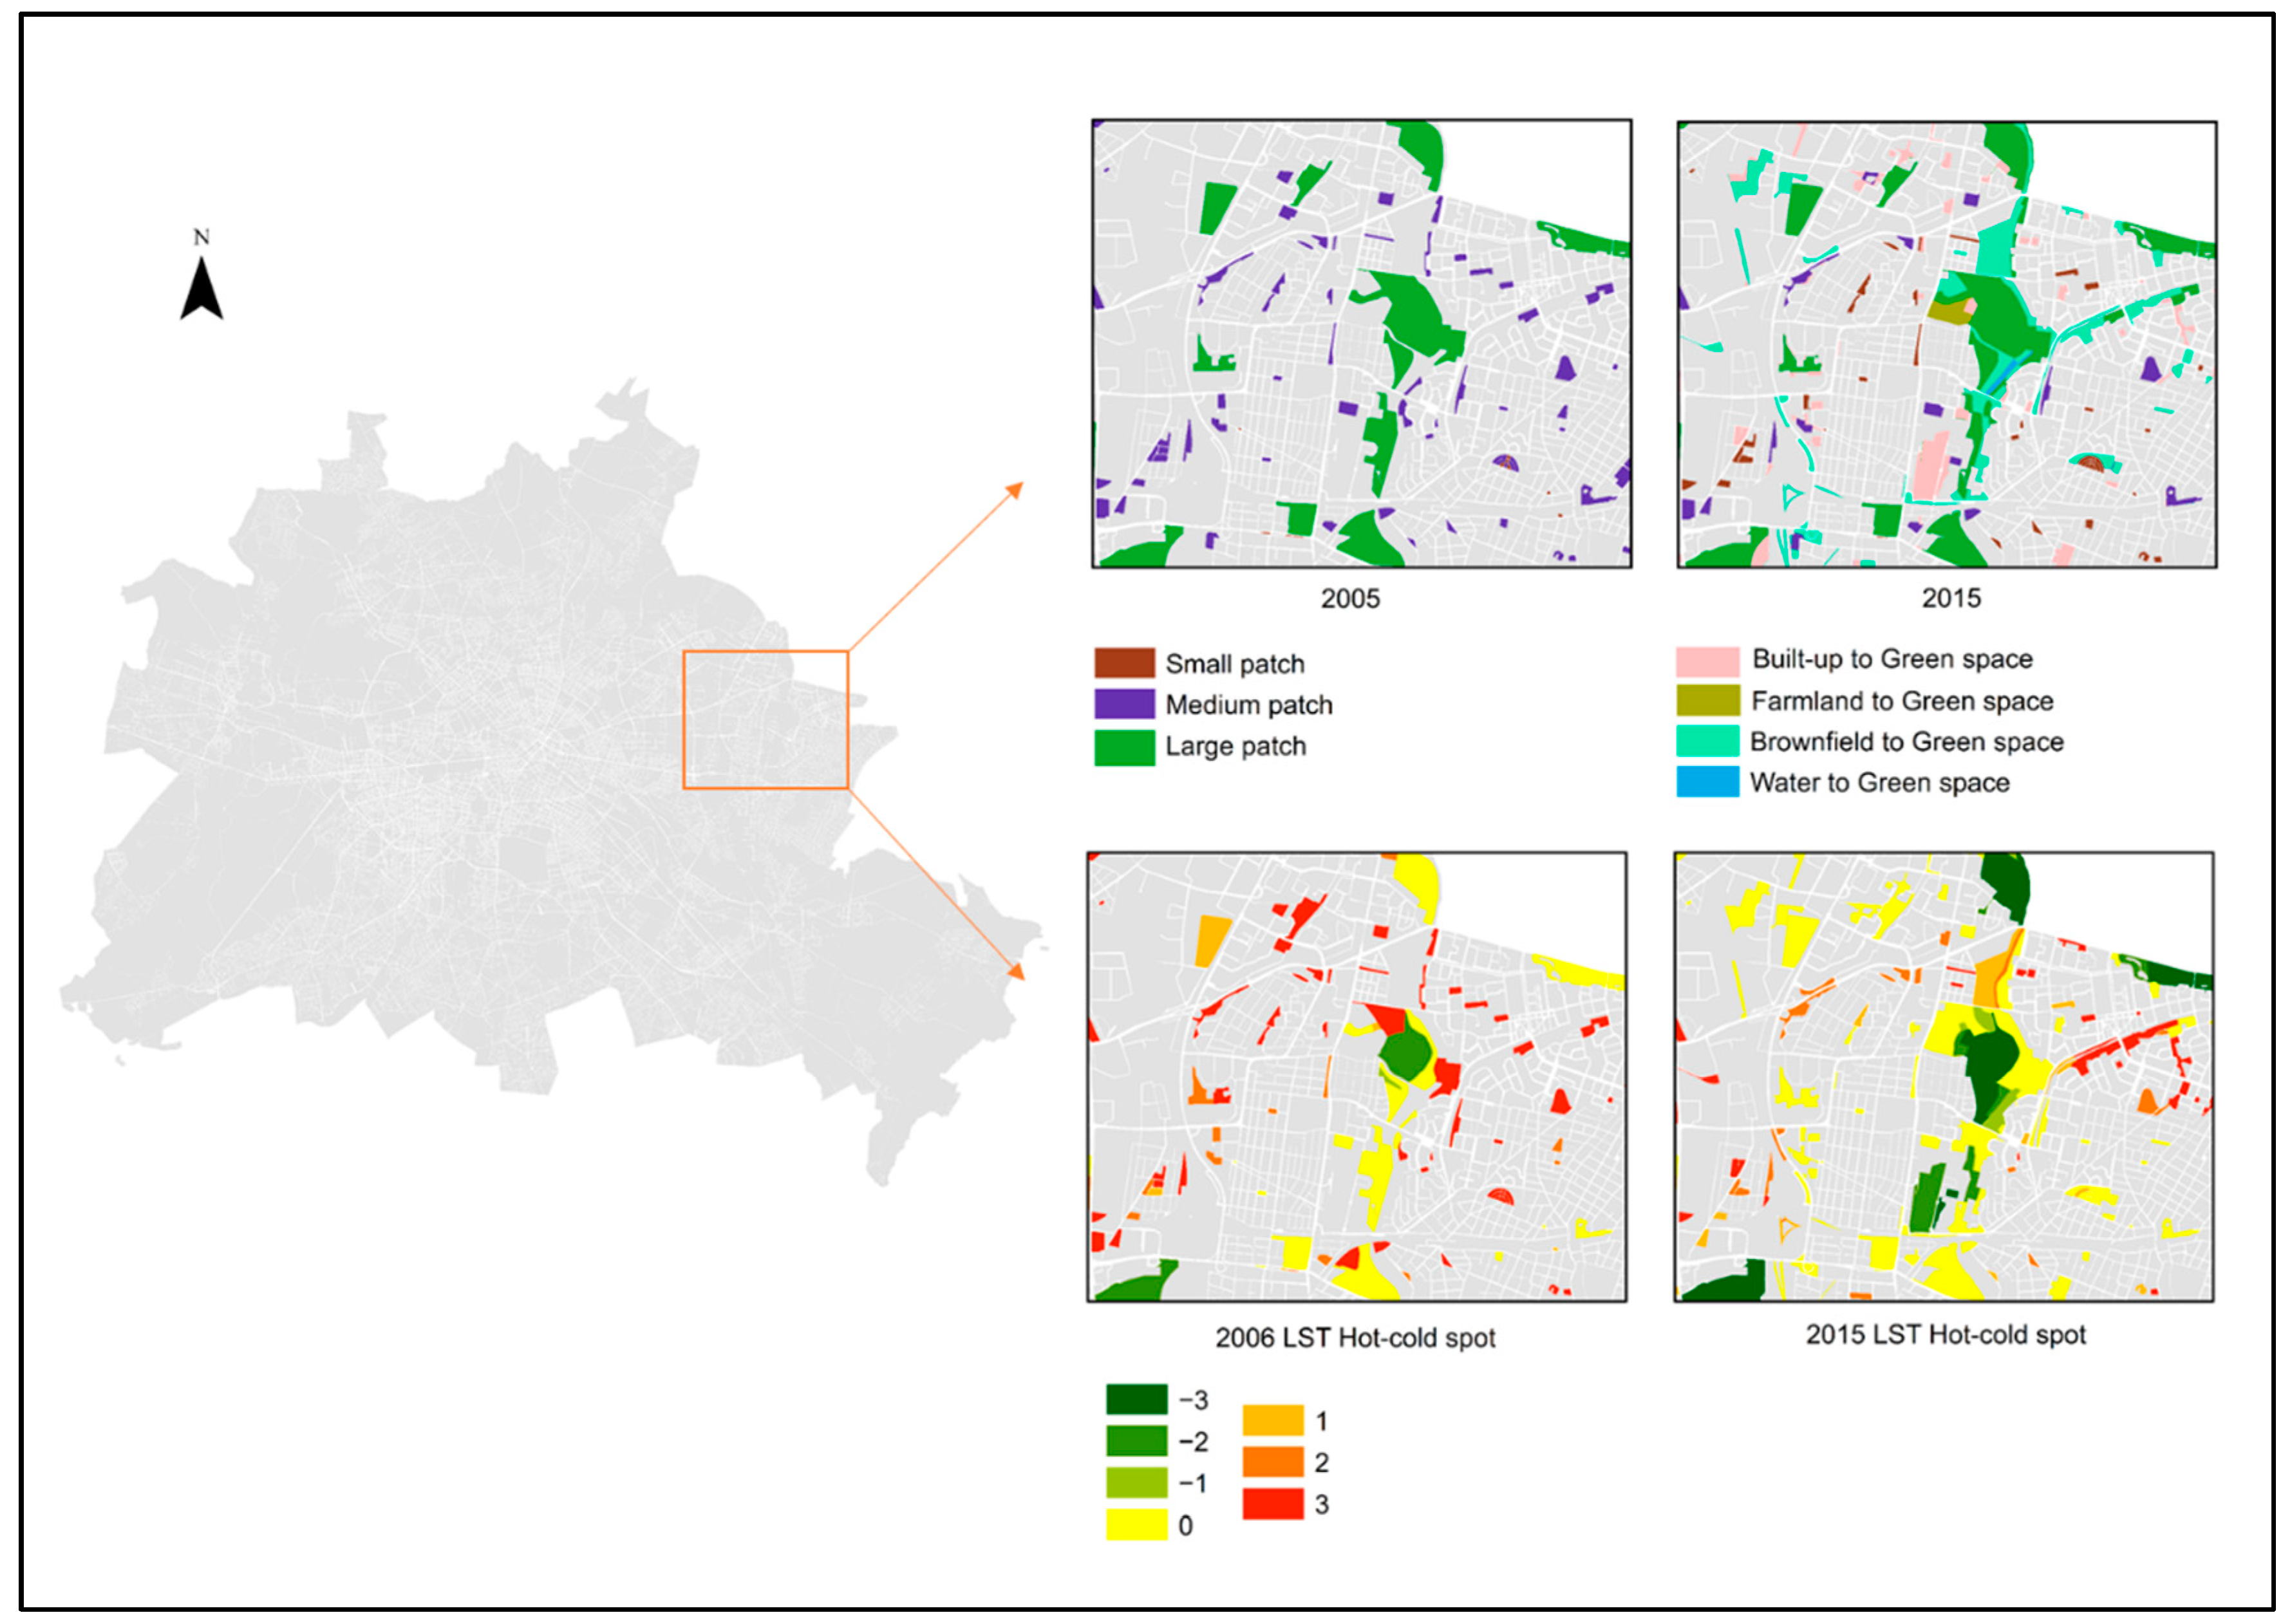
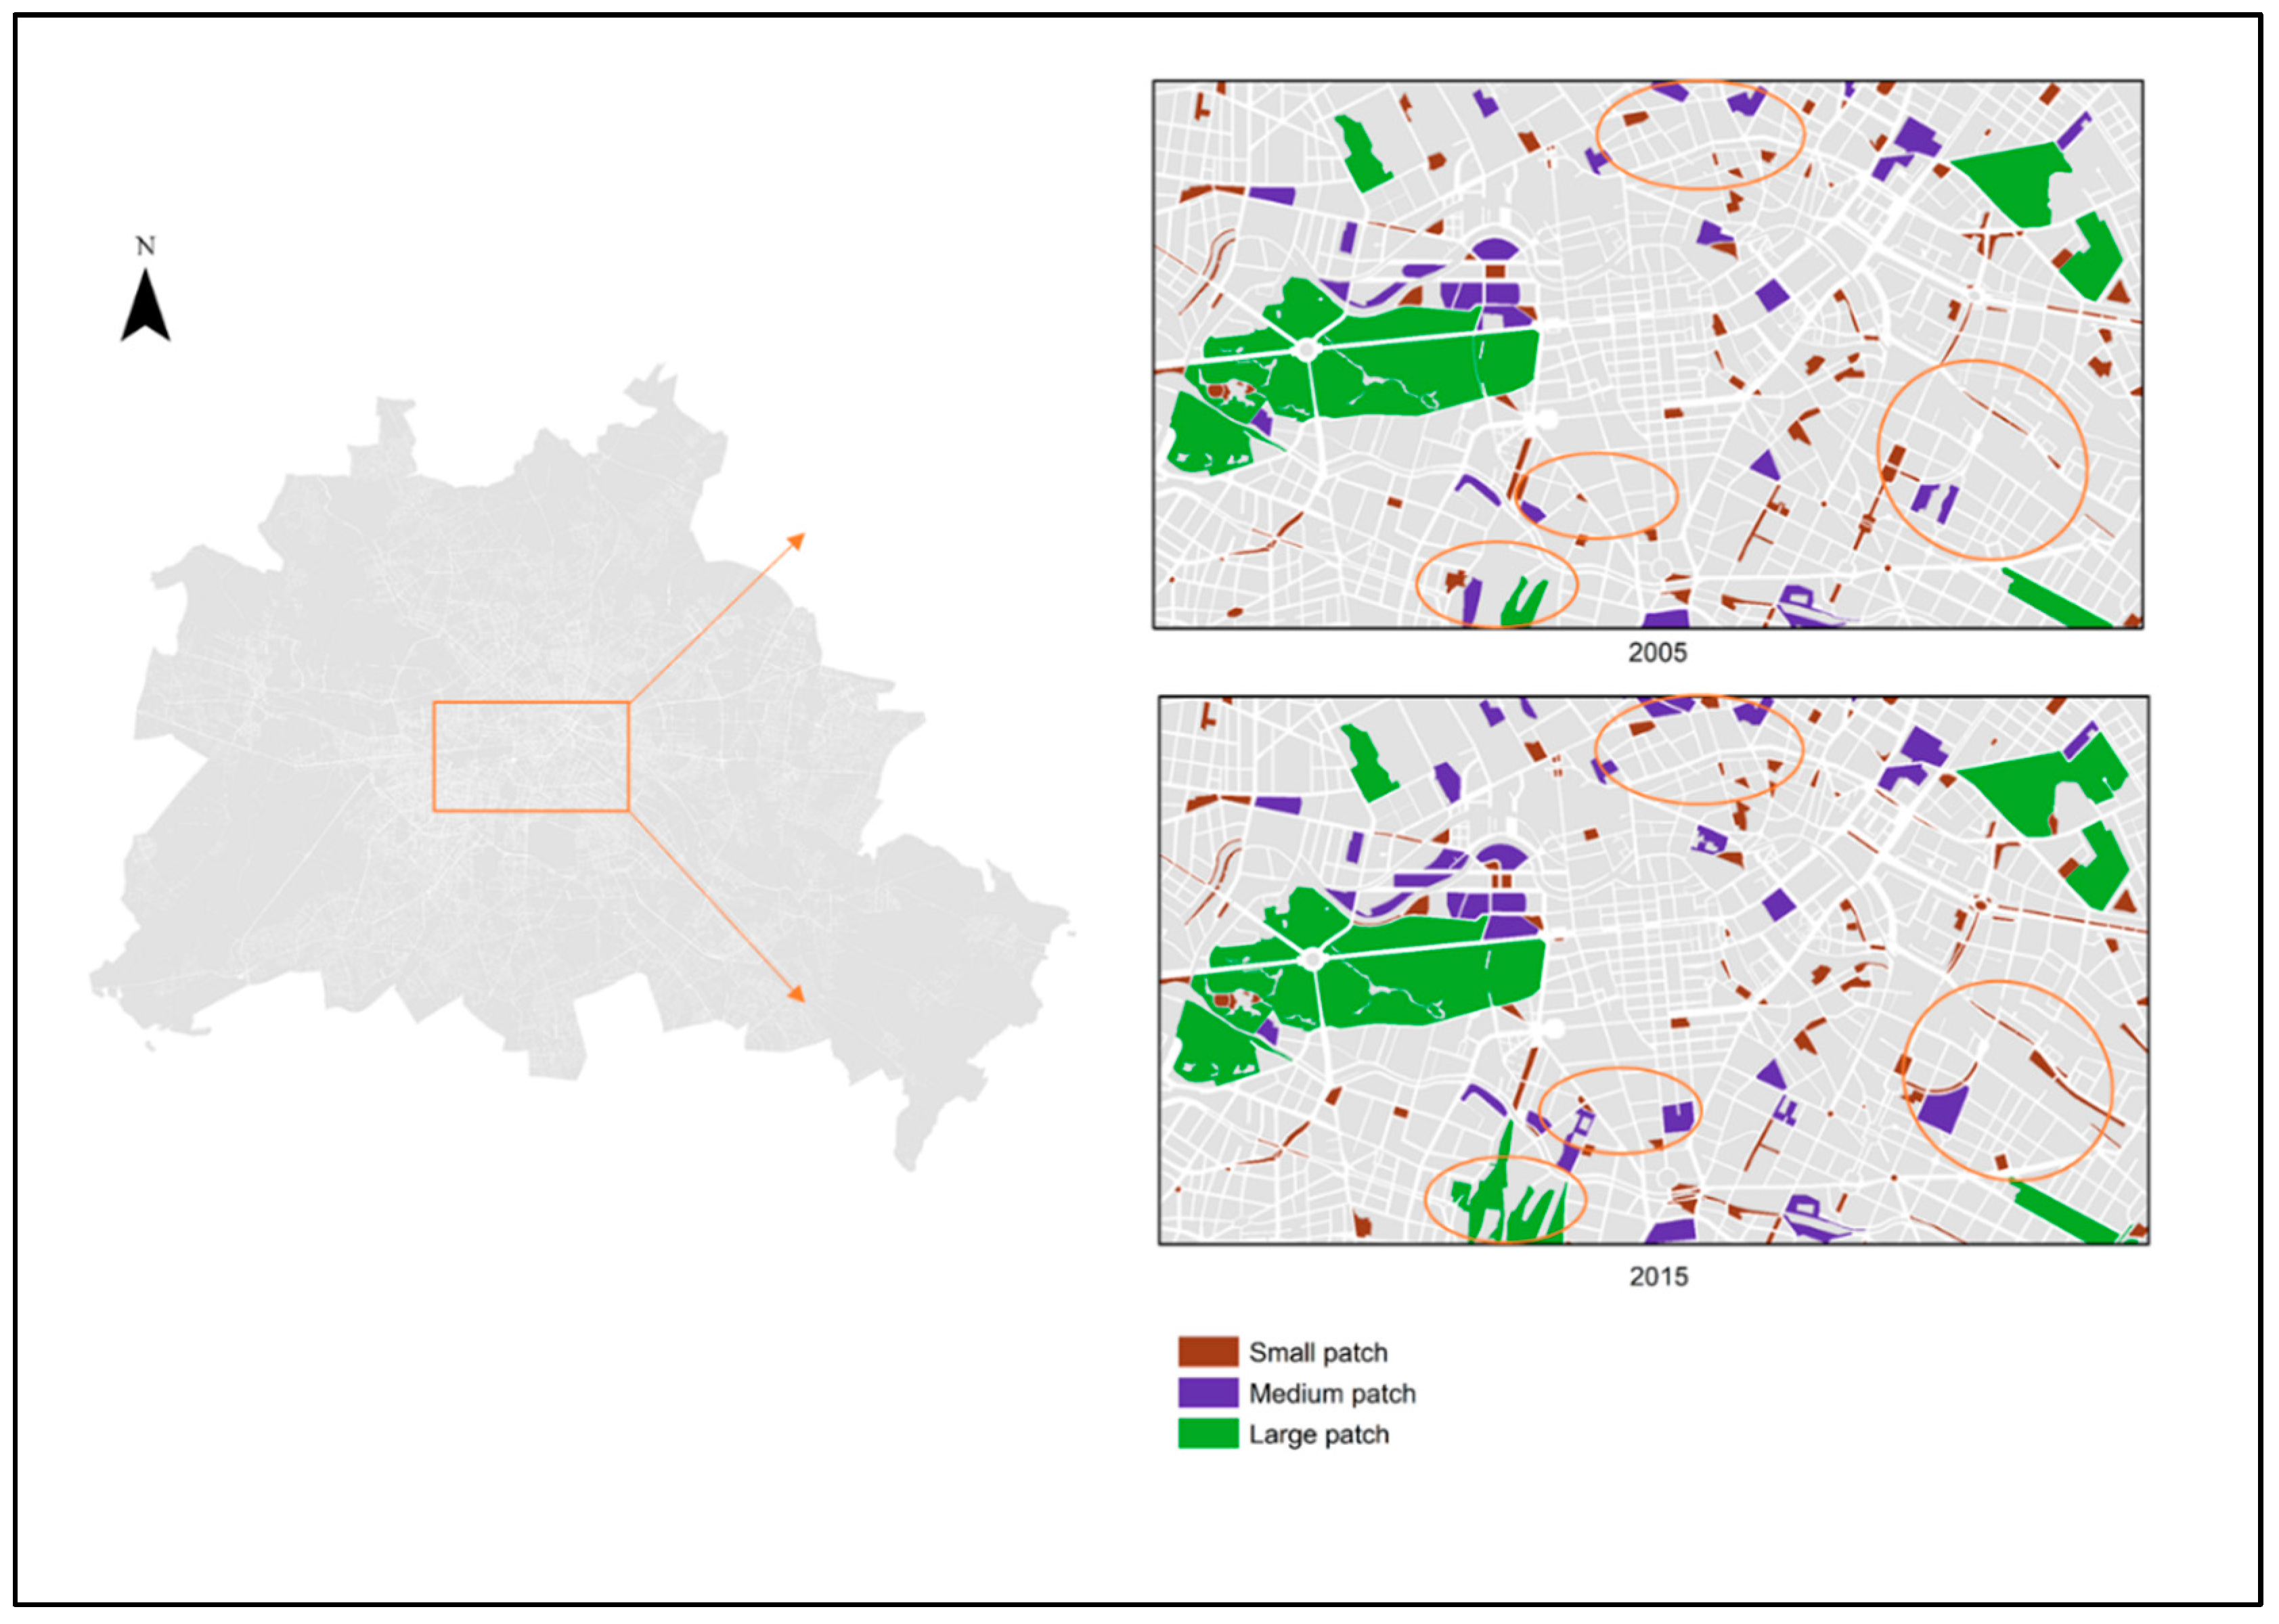
Green space quantity contributed to urban green networks in terms of strengthening UGS quality. Figure 5 shows the increase in the number of large, medium and small patches that developed into UGS networks and strengthened temperature mitigation. At this site, the small and medium patches increased through the transfer of the built-up area; similarly, the large patches were transformed mainly from brownfields and farmlands. Several polluted patches from postindustrial sites in 2005, such as Hobrechtswald, were redeveloped into green space with natural-based solutions for soil remediation by specific flora [17]. From the perspective of UGS quality, there were fewer LST hotspots in 2015 than in 2006, demonstrating a positive impact on temperature mitigation. This finding also showed that the linear green space of medium-sized patches was connected with large patches to a green network. Connectivity and networking provide better ecological functions than separate green spaces, which helps encompass the use of linear and nonlinear elements in UGS management [53]. UGS quantity helps enhance network connectivity, benefiting UGS quality [54]; thus, this issue may need more consideration by decision-makers in UGS planning [55].
3.3.3. Site 3: The Increase in Medium and Small Patches in the City Centre
City cores could have the potential to improve the quality and quantity of UGS despite the space limitations due to the high density of buildings and population. In Figure 6, the medium and small patches in the city cores increased linearly along with built-up areas and were connected with large patches to form green corridors. The largest patch, Tier Garden, a historically permanent green space in the city centre with an area of 210 ha, was initially built for royal hunting sports and gradually opened to the public. Due to its high ecological quality and long history, it is the most popular inner-city park and urban natural area in Berlin among local residents and visitors [56]. As shown in Figure 6, enhancing ecological quality and enlarging the PA of existing UGS could improve recreational and ecological functions in the city core. The strategic practices in the city centre include connecting the nearest green patches to large patches, enlarging small patches into medium patches, and establishing small patches as linear patches along with built-up areas and city streets.
4. Discussion
Due to the significance of green space in compact cities, this research shows evidence that more attention should be paid to the combination of UGS quantity and quality in the process of green space improvement. During the decade covered by this study in Berlin, land use management and planning practices had great potential to improve USG. Considering urban capacity to mitigate climate change, the impact of UGS quality on cooling effects can be enhanced by increasing green space through brownfield transformation. The results also demonstrate the positive correspondence of patch area and UGS quality by accessing NDVI and mapping the hot-cold spot clustering of LST. At the three specific sites, the small, medium, and large patches make different contributions to UGS quality and quantity and different applications in compact cities. Here, we demonstrate the following discussion on the Berlin inspiration, which provides suggestions for other compact cities.
4.1. Improvement in UGS Quantity and Quality
Improving the quantity and quality of green space in a compact city is necessary for urban sustainability. In our results, increasing the quantity of UGS depends on land use planning in terms of transforming built-up areas, brownfields, and farmland into green space. In the Berlin 2030 strategy, the implementation of land use planning emphasizes the bidirectional development of the human-natural environment {Berlin Senate, 2015 #25}. As Berlin is a postindustrial city, making comprehensive use of limited space is important for both urban systems and human wellbeing. Concerning the problems related to the management of urban shifts, our results demonstrate that transforming brownfields into green space is practical. In particular, the restoration of polluted areas requires natural-based solutions such as planting specific types of vegetation. Previous studies have also confirmed the potential of redeveloping brownfields [57]; for instance, improving green networks can increase human and urban animal mobility [58]. From the perspective of improving UGS quality with ecological functions, green space patterns directly affect ecological functional processes. In our research, the increase in LST coldspot clustering in 2015 demonstrates that the UGS quality of temperature mitigation had improved. Under climate change, temperature mitigation and adaptation in cities are receiving a great deal of attention. Green space providing shade and evapotranspiration can directly regulate climate at the microscale and regional scale, with heterogeneity in terms of patch size, shape, composition, and configuration. Previous studies have demonstrated that impervious surfaces that are converted to green space lack the presence of a cooling effect due to the underlying structures of the biotopes and soil [59]. As urban heat islands are common around the world, UGS improvement considering temperature mitigation and adaptation can enhance urban ecological functions [60]. Overall, improving UGS quantity with land transformation requires appropriate management to effectively strengthen green space.
4.2. Management Approaches for UGS Patches
This study on the 12 districts of Berlin shows different strategies for improving UGS. For instance, in city cores, small patches can be increased through building the linear green space along with built-up areas and streets to stimulate land potential. Numerous studies have confirmed the benefits of pocket parks in high-building-density areas [61]. Moreover, enlarging existing UGS can improve quality, a topic that has received less attention. To improve UGS in different districts, maximizing land use potential could be targeted, especially in compact cities. In addition, large, medium and small patches, as the foundations of green belts and corridors and as stepping stones in the UGS network, respectively, require specific management strategies depending on the surroundings. The utilization of landscape ecology provides guidelines for increasing ecological quality. Different patches could lead to different planning strategies to enhance UGS. Related research has studied the changes and lack of changes at the patch scale to measure loss, expansion and shrinkage to provide target-specific measurements for green space planners [62]. A larger patch size can enhance ecological functions more homogeneously in compact cities [54]. In our research, with general goals and systematic planning [63], the Berlin UGS strategy values local nature through integrated planning approaches. Different UGS patches are managed by multiple methods; for example, most large patches are managed based on wild nature management, and small patches are managed based on the biotope factor. Furthermore, urban wildness is an important forest management goal related to maintaining biodiversity [64]. To determine the green index, the biotope area factor (in German, Biotopflächenfaktor (BFF)) was first proposed in 1990 in a Berlin landscape planning and tree policy document [65]. This factor efficiently contributes to scientifically improving green quality according to the determined location for a green space in the city centre [66]. Therefore, UGS efforts require not only systematic planning and scientific management but also a scientific system to improve UGS for urban sustainability.
4.3. Improving UGS with Practice Planning
The increasing demand for UGS development in compact cities is influenced by the pursuit of green and healthy lifestyles [67] and environmental education [68]. Public engagement in UGS strategies highlights the contributions of citizens to USG planning and management, as in the case of Tempelhofer Feld. Previous research in Berlin has confirmed that the concept of ecosystem services in governance can promote greenspace and its benefits to citizens [69]. Decision-makers and planning practitioners need to consider residents’ requirements for UGS in terms of improving UGS and focus on the importance of urban governance to integrate UGS quantity and quality. Due to the demand for public participation in developing and developed cities, civic engagement can drive UGS development [70] by building environmental educational infrastructure, guiding the public in managing private gardens, and supporting public organizations to protect UGS [71]. Moreover, the involvement of multiple disciplines can address urban ecological problems by combining green space with public health, computer sciences, and biophysical chemistry to specifically improve UGS. For example, the Green Belt Berlin was established by integrating ecological, social, and cultural approaches [63]. Furthermore, multiple dialogues can provide opportunities in complex urban systems with practical cooperation from the original concept to implementation. For example, resilient city congresses can be organized by the local government to support sustainability by engaging in a global, multirole conversation and contributing to city goals [72]. At the city scale, Berlin has also assigned responsibility systems to different commission groups and institutions to support scientific methods and provide advice for UGS management. Urban development with different stakeholders has been confirmed to be important in systematic approaches to governance in response to urban heat [73]. In compact cities, public engagement and cooperation among multiple stakeholders are needed to improve UGS in the process of the development of sustainable cities.
5. Conclusions
Improving UGS in compact cities is a crucial urban strategy in response to climate change and human health crises. However, the knowledge gap between ecology research and planning management needs more attention in compact cities. The aim of our research was to illustrate the changes in quantity and quality among Berlin public green spaces and to provide inspiration for compact cities. First, this study conducted an analysis of land use changes between 2005 and 2015 to determine UGS quantity changes in different districts at the city scale. Second, to assess UGS quantity, we retrieved and compared the spatiotemporal changes in the NDVI and LST through hotspot analysis at the patch scale. Third, the three selected sites demonstrated changes in small, medium and large patches at the neighbourhood scale that improved green space. This research shows an analysis of UGS quantity and quality from the city scale to the neighbourhood scale to identify the potential to improve UGS in compact cities.
Our results demonstrate that UGS improvement requires targeted strategies in different functional urban regions. To increase UGS quantity, an effective strategy is to redevelop brownfields. In terms of managing UGS quality, the integration of small, medium, and large patches with different plans is required to contribute to temperature mitigation and adaptation. However, the research has limitations, namely in terms of its transferability to other climates and the impacts on green space there. Comparative studies investigating cities in different climate zones are strongly recommended for future research on the combination of UGS quality and quantity at e.g., continental or global scale. As shown by the study of Berlin, we suggest that more attention could be paid to land use management for maintaining and building different types of green spaces and specific planning implementation for adapting to environmental and social conditions. UGS improvement with the bidirectional development of UGS quality and quantity in compact cities is crucial to strengthen urban sustainable development.
Author Contributions
Conceptualization, S.C.; methodology, S.C.; software, S.C.; validation, S.C. formal analysis, S.C.; investigation, D.H., S.C. and B.X.; resources, S.C. and D.H.; data curation, S.C.; writing—original draft preparation, S.C.; writing—review and editing, D.H., S.Q., B.X., T.W.; visualization, S.C.; supervision, D.H. All authors have read and agreed to the published version of the manuscript.
Funding
This research received no external funding.
Institutional Review Board Statement
Not applicable.
Informed Consent Statement
Not applicable.
Data Availability Statement
The data that support the findings of this study are available from the corresponding author upon reasonable request and approval from the study sites representative coauthors.
Acknowledgments
Special thanks are given to the “China Scholarship Council” for graduate student scholarship (No. 201704910853) to Shanshan Chen, to the National Natural Science Foundation of China (No. 41971166) for funding to Bing Xue and to the Deutsche Bundesstiftung Umwelt–DBU (German Federal Environmental Foundation) for scholarship to Thilo Wellmann. Dagmar Haase was supported by the CLEARING HOUSE (Collaborative Learning in Research, Information-sharing and Governance on How Urban tree-based solutions support Sino-European urban futures) Horizon 2020 project (No. 821242). Dagmar Haase was additionally supported by the GreenCityLabHue Project (FKZ 01LE1910A1). We acknowledge support by the German Research Foundation (DFG) and the Open Access Publication Fund of Humboldt-Universität zu Berlin.
Conflicts of Interest
The authors declare no conflict of interest.
References
- UN (United Nations). Sustainable Development Goals, Goal 11 (SDG 11). 2015. Available online: https://www.un.org/sustainabledevelopment/cities/ (accessed on 12 April 2020).
- UN (United Nations). World Urbanization Prospects 2018: Highlights 2019. Available online: https://population.un.org/wup/Publications/Files/WUP2018-Highlights.pdf (accessed on 9 May 2020).
- Kremer, P.; Haase, A.; Haase, D. The future of urban sustainability: Smart, efficient, green or just? Introduction to the special issue. Sustain. Cities Soc. 2019, 51, 101761. [Google Scholar] [CrossRef]
- Bertram, C.; Rehdanz, K. The role of urban green space for human well-being. Ecol. Econ. 2015, 120, 139–152. [Google Scholar] [CrossRef] [Green Version]
- Pickett, S.T.; Cadenasso, M.L.; Childers, D.L.; McDonnell, M.J.; Zhou, W. Evolution and future of urban ecological science: Ecology in, of, and for the city. Ecosyst. Health Sustain. 2016, 2, e01229. [Google Scholar] [CrossRef]
- Tan, P.Y. Perspectives on Greening of Cities Through an Ecological Lens. In Greening Cities; Springer: Berlin/Heidelberg, Germany, 2017; pp. 15–39. [Google Scholar]
- Xue, B.; Zhang, L.; Geng, Y.; Mitchell, B.; Ren, W. Extended land-use coding system and its application in urban brownfield redevelopment: Case study of Tiexi District in Shenyang, China. J. Urban Plan. Dev. 2016, 142, 05015014. [Google Scholar] [CrossRef]
- Dye, C. Health and urban living. Science 2008, 319, 766–769. [Google Scholar] [CrossRef] [PubMed]
- Wu, J.J. Making the case for landscape ecology an effective approach to urban sustainability. Landsc. J. 2008, 27, 41–50. [Google Scholar] [CrossRef] [Green Version]
- Wu, J.; Jelinski, D.E.; Luck, M.; Tueller, P.T. Multiscale analysis of landscape heterogeneity: Scale variance and pattern metrics. Geogr. Inf. Sci. 2000, 6, 6–19. [Google Scholar] [CrossRef] [PubMed] [Green Version]
- Hope, A.; Kimball, J.; Stow, D. The relationship between tussock tundra spectral reflectance properties and biomass and vegetation composition. Int. J. Remote Sens. 1993, 14, 1861–1874. [Google Scholar] [CrossRef]
- Gascon, M.; Cirach, M.; Martínez, D.; Dadvand, P.; Valentín, A.; Plasència, A.; Nieuwenhuijsen, M.J. Normalized difference vegetation index (NDVI) as a marker of surrounding greenness in epidemiological studies: The case of Barcelona city. Urban For. Urban Green. 2016, 19, 88–94. [Google Scholar] [CrossRef]
- Gao, Z.; Song, K.; Pan, Y.; Malkinson, D.; Zhang, X.; Jia, B.; Xia, T.; Guo, X.; Liang, H.; Huang, S. Drivers of spontaneous plant richness patterns in urban green space within a biodiversity hotspot. Urban For. Urban Green. 2021, 61, 127098. [Google Scholar] [CrossRef]
- Zhang, Z.; Meerow, S.; Newell, J.P.; Lindquist, M. Enhancing landscape connectivity through multifunctional green infrastructure corridor modeling and design. Urban For. Urban Green. 2019, 38, 305–317. [Google Scholar] [CrossRef]
- Jim, C.Y.; Chen, S.S. Comprehensive greenspace planning based on landscape ecology principles in compact Nanjing city, China. Landsc. Urban Plan. 2003, 65, 95–116. [Google Scholar] [CrossRef]
- Yang, L.; Zhang, L.; Li, Y.; Wu, S. Water-related ecosystem services provided by urban green space: A case study in Yixing City (China). Landsc. Urban Plan. 2015, 136, 40–51. [Google Scholar] [CrossRef]
- Pataki, D.E.; Carreiro, M.M.; Cherrier, J.; Grulke, N.E.; Jennings, V.; Pincetl, S.; Pouyat, R.V.; Whitlow, T.H.; Zipperer, W.C. Coupling biogeochemical cycles in urban environments: Ecosystem services, green solutions, and misconceptions. Front. Ecol. Environ. 2011, 9, 27–36. [Google Scholar] [CrossRef]
- Tzoulas, K.; Korpela, K.; Venn, S.; Yli-Pelkonen, V.; Kaźmierczak, A.; Niemela, J.; James, P. Promoting ecosystem and human health in urban areas using Green Infrastructure: A literature review. Landsc. Urban Plan. 2007, 81, 167–178. [Google Scholar] [CrossRef] [Green Version]
- Wolch, J.R.; Byrne, J.; Newell, J.P. Urban green space, public health, and environmental justice: The challenge of making cities ‘just green enough’. Landsc. Urban Plan. 2014, 125, 234–244. [Google Scholar] [CrossRef] [Green Version]
- Wellmann, T.; Lausch, A.; Andersson, E.; Knapp, S.; Cortinovis, C.; Jache, J.; Scheuer, S.; Kremer, P.; Mascarenhas, A.; Kraemer, R. Remote sensing in urban planning: Contributions towards ecologically sound policies? Landsc. Urban Plan. 2020, 204, 103921. [Google Scholar] [CrossRef]
- Kong, F.; Yin, H.; Wang, C.; Cavan, G.; James, P. A satellite image-based analysis of factors contributing to the green-space cool island intensity on a city scale. Urban For. Urban Green. 2014, 13, 846–853. [Google Scholar] [CrossRef] [Green Version]
- Zhou, W.; Wang, J.; Cadenasso, M.L. Effects of the spatial configuration of trees on urban heat mitigation: A comparative study. Remote Sens. Environ. 2017, 195, 1–12. [Google Scholar] [CrossRef]
- Keramitsoglou, I.; Daglis, I.A.; Amiridis, V.; Chrysoulakis, N.; Ceriola, G.; Manunta, P.; Maiheu, B.; De Ridder, K.; Lauwaet, D.; Paganini, M.F. Evaluation of satellite-derived products for the characterization of the urban thermal environment. J. Appl. Remote Sens. 2012, 6, 061704. [Google Scholar] [CrossRef]
- Haaland, C.; van Den Bosch, C.K. Challenges and strategies for urban green-space planning in cities undergoing densification: A review. Urban For. Urban Green. 2015, 14, 760–771. [Google Scholar] [CrossRef]
- Lin, G.C. Reproducing spaces of Chinese urbanisation: New city-based and land-centred urban transformation. Urban Stud. 2007, 44, 1827–1855. [Google Scholar] [CrossRef]
- Goetz, S.J.; Jaksch, T. Agricultural Transformation and Land Use in Central and Eastern Europe; Routledge: Oxfordshire, UK, 2018. [Google Scholar]
- De Sousa, C.A. Turning brownfields into green space in the City of Toronto. Landsc. Urban Plan. 2003, 62, 181–198. [Google Scholar] [CrossRef]
- Doick, K.J.; Sellers, G.; Castan-Broto, V.; Silverthorne, T. Understanding success in the context of brownfield greening projects: The requirement for outcome evaluation in urban greenspace success assessment. Urban For. Urban Green. 2009, 8, 163–178. [Google Scholar] [CrossRef] [Green Version]
- Niemelä, J.; Saarela, S.R.; Söderman, T.; Kopperoinen, L.; Yli Pelkonen, V.; Väre, S.; Kotze, D.J. Using the ecosystem services approach for better planning and conservation of urban green spaces: A Finland case study. Biodivers. Conserv. 2010, 19, 3225–3243. [Google Scholar] [CrossRef]
- BMUB.National Biodiversity Strategy. Vom 7 2007, November 2007. Available online: http://www.biologischevielfalt.de/fileadmin/NBS/documents/broschuere_biolog_vielfalt_strategie_bf.pdf (accessed on 23 March 2020).
- Chen, J.; Gao, J.; Chen, W. Urban land expansion and the transitional mechanisms in Nanjing, China. Habitat Int. 2016, 53, 274–283. [Google Scholar] [CrossRef]
- Bibri, S.E.; Krogstie, J.; Kärrholm, M. Compact City planning and development: Emerging practices and strategies for achieving the goals of sustainable development. Dev. Built Environ. 2020, 4, 100021. [Google Scholar] [CrossRef]
- Dieleman, F.; Wegener, M. Compact city and urban sprawl. Built Environ. 2004, 30, 308–323. [Google Scholar] [CrossRef] [Green Version]
- Hansen, R.; Olafsson, A.S.; van der Jagt, A.P.; Rall, E.; Pauleit, S. Planning multifunctional green infrastructure for compact cities: What is the state of practice? Ecol. Indic. 2019, 96, 99–110. [Google Scholar] [CrossRef]
- Senatsverwaltung für Stadtentwicklung und Wohnen. Population Forecast for Berlin and the Districts 2018—2030. 2020. Available online: https://www.stadtentwicklung.berlin.de/planen/bevoelkerungsprognose/download/2018-2030/Bericht_Bevprog2018-2030.pdf (accessed on 12 June 2021).
- Kabisch, N.; Haase, D. Green justice or just green? Provision of urban green spaces in Berlin, Germany. Landsc. Urban Plan. 2014, 122, 129–139. [Google Scholar] [CrossRef]
- Coppel, G.; Wüstemann, H. The impact of urban green space on health in Berlin, Germany: Empirical findings and implications for urban planning. Landsc. Urban Plan. 2017, 167, 410–418. [Google Scholar] [CrossRef]
- SenUVK. (Senate Department for Environment Traffic and Climate Protection). Public Green Area in Berlin: Area Overview of the Districts. 2019. Available online: https://www.berlin.de/sen/uvk/_assets/natur-gruen/stadtgruen/daten-und-fakten/ausw_13.pdf (accessed on 19 October 2021).
- Berlin Senate. Berlin Strategy: Urban Development Concept Berlin 2030. 2015. Available online: https://www.stadtentwicklung.berlin.de/planen/stadtentwicklungskonzept/download/strategie/BerlinStrategie_Broschuere_en.pdf (accessed on 23 September 2019).
- Nielsen, A.B.; Van Den Bosch, M.; Maruthaveeran, S.; van den Bosch, C.K. Species richness in urban parks and its drivers: A review of empirical evidence. Urban Ecosyst. 2014, 17, 305–327. [Google Scholar] [CrossRef]
- Hashimoto, H.; Natuhara, Y.; Morimoto, Y. A habitat model for Parus major minor using a logistic regression model for the urban area of Osaka, Japan. Landsc. Urban Plan. 2005, 70, 245–250. [Google Scholar] [CrossRef]
- Weng, Q. Thermal infrared remote sensing for urban climate and environmental studies: Methods, applications, and trends. ISPRS J. Photogramm. Remote Sens. 2009, 64, 335–344. [Google Scholar] [CrossRef]
- Sobrino, J.; Raissouni, N. Toward remote sensing methods for land cover dynamic monitoring: Application to Morocco. Int. J. Remote Sens. 2000, 21, 353–366. [Google Scholar] [CrossRef]
- USGS. Landsat 7 Data Users Handbook-v1; Department of the Interior US Geological Survey: Reston, VA, USA, 2018.
- Ord, J.K.; Getis, A. Local spatial autocorrelation statistics: Distributional issues and an application. Geogr. Anal. 1995, 27, 286–306. [Google Scholar] [CrossRef]
- Tran, D.X.; Pla, F.; Latorre-Carmona, P.; Myint, S.W.; Caetano, M.; Kieu, H.V. Characterizing the relationship between land use land cover change and land surface temperature. J. Photogramm. Remote Sens. 2017, 124, 119–132. [Google Scholar] [CrossRef] [Green Version]
- Jamei, Y.; Rajagopalan, P.; Sun, Q.C. Spatial structure of surface urban heat island and its relationship with vegetation and built-up areas in Melbourne, Australia. Sci. Total Environ. 2019, 659, 1335–1351. [Google Scholar] [CrossRef] [PubMed]
- Kalinic, M.; Krisp, J.M. Kernel density estimation (KDE) vs. hot-spot analysis–detecting criminal hot spots in the City of San Francisco. In Proceedings of the GILE 2018 21st Conference on Geo-information science, Lund, Sweden, 12–15 June 2018. [Google Scholar]
- Govind, N.R.; Ramesh, H. The impact of spatiotemporal patterns of land use land cover and land surface temperature on an urban cool island: A case study of Bengaluru. Environ. Monit. Assess. 2019, 191, 1–20. [Google Scholar] [CrossRef] [PubMed]
- BMUB. White Paper: Green Spaces in the City. 2018. Available online: https://www.bmu.de/en/service/publications/ (accessed on 10 November 2019).
- Hilbrandt, H. Insurgent participation: Consensus and contestation in planning the redevelopment of Berlin-Tempelhof airport. Urban Geogr. 2017, 38, 537–556. [Google Scholar] [CrossRef]
- Hättasch, M. Permanent Reinvention: The Lives of Berlin’s Tempelhof Airport. Thresholds 2019, 47, 57–74. [Google Scholar] [CrossRef]
- Uy, P.D.; Nakagoshi, N. Application of land suitability analysis and landscape ecology to urban greenspace planning in Hanoi, Vietnam. Urban For. Urban Green. 2008, 7, 25–40. [Google Scholar] [CrossRef]
- Tian, Y.; Jim, C.Y.; Wang, H. Assessing the landscape and ecological quality of urban green spaces in a compact city. Landsc. Urban Plan. 2014, 121, 97–108. [Google Scholar] [CrossRef]
- Lin, Y.; An, W.; Gan, M.; Shahtahmassebi, A.; Ye, Z.; Huang, L.; Zhu, C.; Huang, L.; Zhang, J.; Wang, K. Spatial Grain Effects of Urban Green Space Cover Maps on Assessing Habitat Fragmentation and Connectivity. Land 2021, 10, 1065. [Google Scholar] [CrossRef]
- von Beyme, K. Kulturstadt und Kulturarchitektur in Berlin [City of Culture and Cultural Architecture in Berlin]. In Hauptstadt Berlin; Springer: Berlin/Heidelberg, Germany, 2019; pp. 219–226. [Google Scholar]
- Siikamaki, J.; Wernstedt, K. Turning brownfields into greenspaces: Examining incentives and barriers to revitalization. J. Health Politics Policy Law 2008, 33, 559–593. [Google Scholar] [CrossRef] [PubMed] [Green Version]
- Zhong, Q.; Zhang, L.; Zhu, Y.; Konijnendijk van den Bosch, C.; Han, J.; Zhang, G.; Li, Y. A conceptual framework for ex ante valuation of ecosystem services of brownfield greening from a systematic perspective. Ecosyst. Health Sustain. 2020, 6, 1743206. [Google Scholar] [CrossRef] [Green Version]
- Sun, R.; Chen, L. Effects of green space dynamics on urban heat islands: Mitigation and diversification. Ecosyst. Serv. 2017, 23, 38–46. [Google Scholar] [CrossRef]
- Heidt, V.; Neef, M. Benefits of urban green space for improving urban climate. In Ecology, Planning, and Management of Urban Forests; Springer: Berlin/Heidelberg, Germany, 2008; pp. 84–96. [Google Scholar]
- Lin, P.; Lau, S.S.Y.; Qin, H.; Gou, Z. Effects of urban planning indicators on urban heat island: A case study of pocket parks in high-rise high-density environment. Landsc. Urban Plan. 2017, 168, 48–60. [Google Scholar] [CrossRef]
- Wang, J.; Zhou, W.; Qian, Y.; Li, W.; Han, L. Quantifying and characterizing the dynamics of urban greenspace at the patch level: A new approach using object-based image analysis. Remote Sens. Environ. 2018, 204, 94–108. [Google Scholar] [CrossRef]
- Kowarik, I. The “Green Belt Berlin”: Establishing a greenway where the Berlin Wall once stood by integrating ecological, social and cultural approaches. Landsc. Urban Plan. 2019, 184, 12–22. [Google Scholar] [CrossRef]
- Rink, D. Wilderness: The nature of urban shrinkage? The debate on urban restructuring and restoration in Eastern Germany. Nat. Cult. 2009, 4, 275–292. [Google Scholar] [CrossRef]
- Meinel, G.; Hecht, R.; Socher, W. Urban Green Volume—New Baseline Indicator for Urban Ecology? Estimation Methodology and Evaluation of Results. In Proceedings of the CORP 2006 & Geomultimedia06, Wien, Austria, 13–16 February 2006. [Google Scholar]
- Reinwald, F.; Ring, Z.; Kraus, F.; Kainz, A.; Tötzer, T.; Damyanovic, D. Green Resilient City-A framework to integrate the Green and Open Space Factor and climate simulations into everyday planning to support a green and climate-sensitive landscape and urban development. In Proceedings of the IOP Conference Series: Earth and Environmental Science, Graz, Austria, 11–14 September 2019; p. 012082. [Google Scholar]
- Rosol, M. Public participation in post-Fordist urban green space governance: The case of community gardens in Berlin. Int. J. Urban Reg. Res. 2010, 34, 548–563. [Google Scholar] [CrossRef] [PubMed]
- Otto, S.; Pensini, P. Nature-based environmental education of children: Environmental knowledge and connectedness to nature, together, are related to ecological behaviour. Glob. Environ. Chang. 2017, 47, 88–94. [Google Scholar] [CrossRef]
- Kabisch, N. Ecosystem service implementation and governance challenges in urban green space planning—The case of Berlin, Germany. Land Use Policy 2015, 42, 557–567. [Google Scholar] [CrossRef]
- Rall, E.; Hansen, R.; Pauleit, S. The added value of public participation GIS (PPGIS) for urban green infrastructure planning. Urban For. Urban Green. 2019, 40, 264–274. [Google Scholar] [CrossRef]
- Buijs, A.; Hansen, R.; Van der Jagt, S.; Ambrose-Oji, B.; Elands, B.; Rall, E.L.; Mattijssen, T.; Pauleit, S.; Runhaar, H.; Olafsson, A.S. Mosaic governance for urban green infrastructure: Upscaling active citizenship from a local government perspective. Urban For. Urban Green. 2019, 40, 53–62. [Google Scholar] [CrossRef]
- Huck, A.; Monstadt, J. Urban and infrastructure resilience: Diverging concepts and the need for cross-boundary learning. Environ. Sci. Policy 2019, 100, 211–220. [Google Scholar] [CrossRef]
- Mahlkow, N.; Lakes, T.; Donner, J.; Köppel, J.; Schreurs, M. Developing storylines for urban climate governance by using Constellation Analysis—insights from a case study in Berlin, Germany. Urban Clim. 2016, 17, 266–283. [Google Scholar] [CrossRef]
Figure 1.
Study area map.

Figure 2.
(a) Changes in public UGS between 2005 and 2015; (b) land use changes.

Figure 3.
The level of confidence in hot- and coldspots (a) in 2006 and (b) in 2015. −3 represents 99% confidence in a coldspot, −2 represents 95% confidence in a coldspot, −1 represents 90% confidence in a coldspot, 0 represents no significance, 1 represents 99% confidence in a hotspot, 2 represents 95% confidence in a hotspot, and 3 represents 90% confidence in a hotspot.

Figure 4.
Tempelhof Park converted from a brownfield.

Figure 5.
Additional green space in the northeast.

Figure 6.
Green space in the city centre.


Table 1.
Changes in public UGS from 2005 to 2015 in 12 districts.
| District | Increased (ha) | Decreased (ha) | Greening Rate * | |
|---|---|---|---|---|
| 2005 | 2015 | |||
| Marzahn-Hellersdorf | 435.39 | 55.64 | 10.38 | 16.53 |
| Lichtenberg | 358.73 | 52.89 | 12.22 | 18.09 |
| Tempelhof-Schöneberg | 330.99 | 40.06 | 12.71 | 18.2 |
| Spandau | 287.19 | 13.63 | 25.83 | 28.81 |
| Neukölln | 125.24 | 12.57 | 16.99 | 19.5 |
| Friedrichshain-Kreuzberg | 63.13 | 13.26 | 9.75 | 12.2 |
| Steglitz-Zehlendorf | 221.79 | 55.84 | 32.57 | 34.19 |
| Treptow-Köpenick | 406.79 | 164.84 | 46.58 | 48.02 |
| Mitte | 68.27 | 22.65 | 16.98 | 18.14 |
| Reinickendorf | 156 | 67.81 | 31.14 | 32.12 |
| Charlottenburg-Wilmersdorf | 119.49 | 60.55 | 36.12 | 37.03 |
| Pankow | 436.53 | 349.26 | 26.31 | 27.15 |
* Greening rate is the percentage of green space in relation to the district area.
Table 2.
Pearson analysis of LST, NDVI and PA in 2005 and 2015.
| Correlation Coefficients | All Patches | Small Patches | Medium Patches | Large Patches |
|---|---|---|---|---|
| 2005 LST | −0.147 ** | 0.031 | −0.1561 ** | −0.360 ** |
| 2015 LST | −0.179 ** | −0.017 | −0.129 ** | −0.366 ** |
| 2005 NDVI | 0.192 ** | 0.014 | 0.165 ** | 0.336 ** |
| 2015 NDVI | 0.188 ** | 0.050 | 0.147 ** | 0.331 ** |
** p < 0.05.
Publisher’s Note: MDPI stays neutral with regard to jurisdictional claims in published maps and institutional affiliations. |
© 2021 by the authors. Licensee MDPI, Basel, Switzerland. This article is an open access article distributed under the terms and conditions of the Creative Commons Attribution (CC BY) license (https://creativecommons.org/licenses/by/4.0/).
Share and Cite
MDPI and ACS Style
Chen, S.; Haase, D.; Xue, B.; Wellmann, T.; Qureshi, S. Integrating Quantity and Quality to Assess Urban Green Space Improvement in the Compact City. Land 2021, 10, 1367. https://doi.org/10.3390/land10121367
AMA Style
Chen S, Haase D, Xue B, Wellmann T, Qureshi S. Integrating Quantity and Quality to Assess Urban Green Space Improvement in the Compact City. Land. 2021; 10(12):1367. https://doi.org/10.3390/land10121367
Chicago/Turabian StyleChen, Shanshan, Dagmar Haase, Bing Xue, Thilo Wellmann, and Salman Qureshi. 2021. "Integrating Quantity and Quality to Assess Urban Green Space Improvement in the Compact City" Land 10, no. 12: 1367. https://doi.org/10.3390/land10121367
Note that from the first issue of 2016, this journal uses article numbers instead of page numbers. See further details here.