
Soil Organic Carbon Storage in Australian Wheat Cropping Systems in Response to Climate Change from 1990 to 2060


1
Institute of Agricultural Resources and Regional Planning, Chinese Academy of Agricultural Sciences/Key Laboratory of Agricultural Remote Sensing, Ministry of Agriculture and Rural Affairs, Beijing 100081, China
2
College of Resources and Environment, University of Chinese Academy of Sciences, Beijing 100190, China
*
Author to whom correspondence should be addressed.
Land 2022, 11(10), 1683; https://doi.org/10.3390/land11101683
Submission received: 12 August 2022
/
Revised: 4 September 2022
/
Accepted: 23 September 2022
/
Published: 28 September 2022
Abstract
:It is important to examine the effects of climate change on temporal variations in SOC storage, in order to optimize management practices for sustainable grain production. Using the denitrification–decomposition (DNDC) model to simulate biogeochemical processes in agro-ecosystems, SOC variability was evaluated in the Australian wheat cropping system from 1990 to 2060, under the Representative Concentration Pathway 85 (RCP85) climate change scenario. We analyzed the impacts of temperature and precipitation on SOC variability and further simulated six management scenarios for wheat cultivation over 71 years, which included wheat cropping under common nitrogen fertilizer (N-fertilizer) application rate (12 kg N/ha), adequate N-fertilizer application rate (50 kg N/ha), and legume–wheat rotation with N fertilizer application rates at 0, 12, and 50 kg N/ha. The results indicated that the DNDC model provided a good simulation of biogeochemical processes associated with wheat growth; the normalized root mean square error (NRMSE) of wheat yield was 15.16%, and the NRMSE of SOC was 13.21%. The SOC (0–30 cm) decreased from 3994.1 kg C/ha in 1990 to 2848.0 kg C/ha in 2060, an average decrease of 0.4% per year. Temperature and precipitation were the important factors affecting SOC storage, with contributions of 13% and 12%, respectively. Furthermore, adding a legume phase increased SOC and wheat yield in the low N-fertilizer scenario. In contrast, adding a legume phase in the adequate N-fertilizer scenario decreased SOC and wheat yield.
1. Introduction
Recent studies on global climate change have focused on reducing carbon emissions from biogeochemical processes [1,2]. Soil represents the largest terrestrial reserve of carbon, with almost 2400 Gt (billion metric tons) to a depth of 2 m [3,4]. Farmlands are the most active and important reservoir of soil organic carbon (SOC) in terrestrial ecosystems [5]. Furthermore, increasing SOC in farmlands also regulates soil nutrients, soil structure, and water content, thus affecting crop yield and soil quality, reduced soil erosion [6].
The climate is one of the dominant controls of SOC storage, affecting the formation and decomposition of SOC [7,8]. Specifically, the decomposition and conversion of SOC can be inhibited or enhanced by variations in soil temperature and soil water content. These factors have also been shown to affect microbial activity, which significantly affects the soil respiration rate and consequently determines SOC turnover [9,10,11]. It is widely accepted that an increase in atmospheric temperature accelerates soil carbon decomposition rate and CO2 emission from soils [12]. Furthermore, the surface SOC content is significantly affected by soil water content and bulk density [13,14]. In addition to climate factors, anthropogenic activities such as tillage, fertilization, and irrigation can significantly affect the physical structure, temperature, and moisture of soils. These activities may alter the natural evolution of SOC in the short or long term [15,16].
Understanding the evolution of farmland SOC in response to climate change is crucial for sustaining crop yields, ensuring food security, and improving soil quality [17,18]. However, elucidating the dynamics of SOC storage in large-scale farmland is challenging when using process-based SOC models, because regional input parameters for the process model are difficult to obtain [19]. Specifically, quantifying SOC storage in farmland ecosystems requires long-term predictive analyses often spanning several centuries [20,21]. Previous studies have utilized biogeochemical models to simulate and predict SOC evolution under future climate change scenarios [22,23]. The denitrification–decomposition (DNDC) model has been utilized to elucidate the biogeochemical processes of carbon and nitrogen in agricultural ecosystems [24,25], including soil fertility and greenhouse gas emissions [26,27]. Li et al. (1997) simulated long-term (>20 years) SOC tendency using a DNDC model, comparing field observations at 11 plots in five field stations in Europe and Australia [20]. Khalil et al. (2019) simulated and validated long-term changes in soil organic carbon under permanent grassland by using the DNDC model, and proved that the model (R2 0.77–0.99/−0.99; p < 0.05–<0.0001) was sensitive to soil variables [22].
To serve future crop-management decisions in Australia, the typical broadacre wheat cropping system was selected as the study area in the current research. This cropping system is vulnerable to drought and frost damage, owing to low precipitation and drastic variations in temperature [5]. Wheat management strategies can directly affect grain yield and economic benefits [28]. Therefore, efficient management strategies are crucial for the sustainability of agricultural systems. In particular, variation in SOC storage is highly dependent on wheat management strategy. The three primary objectives of this study were: (1) to examine the effects of climate change on SOC in the Australian wheat cropping system over a period of 70 years under the RCP 85 climate change scenario; (2) to simulate organic carbon storage from 1990 to 2060 under the RCP 85 climate change scenario; and (3) to determine an improved management strategy for the Australian wheat cropping system, based on future estimates of SOC storage.
2. Materials and Methods
2.1. Study Area and Crop Data
The Australian wheat cropping system is primarily distributed in the northern, southern, and western areas of the country (https://grdc.com.au/about/our-industry/growing-regions, accessed on 1 April 2020). These regions are characterized by semiarid climates with insufficient rainfall. Australia was one of the earliest countries to establish a crop database comprising high-quality field observation data, and the available data cover the period since the 1960s [29]. Single cropping is common for wheat, and the rest of time the land is generally kept fallow. We assessed 19 observation sites to determine SOC evolution from 1990–2060. The observational data were obtained from Better Fertilizer Decisions for Cropping Systems in Australia (BFDC) (https://www.bfdc.com.au/interrogator/frontpage.vm, accessed on 1 April 2020). The 19 sites were evenly distributed across the major wheat growing regions. Data were obtained on wheat management practices, wheat yields, sowing and harvesting dates, and SOC content. The wheat planting area was further divided into three regional zones, i.e., northern wheat cropping system (Ⅰ), southern wheat cropping system (Ⅱ), and western wheat cropping system (Ⅲ), to reduce the effects of latitude. The names of the planting areas are consistent with the local agricultural zoning practices in Australia: https://grdc.com.au/about/our-industry/growing-regions, accessed on 1 April 2020. Each zone comprised 6–7 observation sites (Figure 1).
2.2. Model Parameterization
In this study, the DNDC biogeochemistry model (version 95) was selected to simulate wheat growth and SOC evolution from 1990 to 2060. The latest version of the DNDC model (version 95) was downloaded from the official website (http://www.dndc.sr.unh.edu, accessed on 1 April 2020). The DNDC model required data on four types of input parameters, i.e., climate, soil, crop, and management (Table 1).
The DNDC model assigned eight parameters for defining crop growth and variety [30,31]. These included maximum biomass production, biomass fraction (grain, leaf, stem, and root), and biomass C/N ratio (grain, leaf, stem, and root). These parameters were utilized to estimate carbon assimilation and crop yields. Notably, crops exposed to water or nitrogen stress do not attain maximum yield. The water demand parameter of the DNDC model was defined as the water requirement for crop growth. Crops experienced water stress when rainfall or irrigation did not meet the water requirements for crop growth. Annual N demand and the N fixation index determined the nitrogen stress in crops. Thermal degree, days for maturity, and optimum temperature represented crop phenology. The management parameters included different management strategies such as tillage, fertilization, irrigation, flooding, film mulching, and grazing. Different wheat harvesting and rotation measures significantly affect SOC storage [32]. This study assumed that wheat was harvested once a year and fallow land was maintained for the remainder of the year.
The parameters of the model are critical for its application and need to be repeatedly readjusted based on the direct observation data. Before conducting the simulation, we localized the input parameters of the DNDC model based on Australian wheat yield data. We set the plowing parameters to represent one plowing on the day of wheat planting, at a depth of 10 cm. Wheat in Australia is mostly a rain-fed crop, with no additional irrigation events employed other than rainfall. The fertilizers applied were chemical fertilizers, and the application of organic fertilizers was not considered. Mulching and grazing were not considered. The model assumed that annual harvesting included only the above-ground portion of the crop.
2.3. Climate Database
The climate parameters comprised daily maximum and minimum temperatures and precipitation. Historical climate data were obtained from the Australian National Weather Climate and Water Agency (ANWCWA) (http://www.bom.gov.au/index.php, accessed on 1 April 2020). Future climate data were obtained from the WorldClim Global Climate dataset (http://www.worldclim.org/node/1, accessed on 1 April 2020) [33].
The WorldClim dataset with 1 km spatial resolution was obtained from the Fifth Coupled Model Intercomparison Project (CMIP5), based on global climate models (GCMs) for four representative concentration pathways (RCP 26, RCP 45, RCP 60, and RCP 85) [34,35]. The spatial resolution of the selected data was 30 s of longitude and latitude. The RCP 85 database constitutes climate scenarios resulting from the most extreme climate change situation, and has been widely applied as a climate-driven dataset for climate change and model simulation research [36,37]. In this study, the medium resolution climate model (BCC-CSM2-MR) was selected as the global climate projection, and the RCP 85 database represented the future climate change scenario.
The effects of temperature and moisture conditions on SOC storage in the three wheat cropping systems were assessed based on the selected climate change patterns. The northern wheat cropping area was characterized by a continuous increase in temperature from 1990 to 2060 (Figure 2a). Specifically, from 1990 to 2060 the average annual temperature increased by 2.27 °C and the average annual precipitation increased by 9.44 mm. In the western region, a declining trend in precipitation was observed from January to June, followed by a gradual increase from July to December (the wheat growing season).
The southern wheat cropping region (Figure 2b) showed an increase in average annual temperature. Specifically, from 1990 to 2060 the average annual temperature increased by 1.94 °C and the annual precipitation increased by 9.43 mm. The increase in precipitation from July to December was less than in the northern region. The western wheat cropping region (Figure 2c) showed an increase in average annual temperature. Specifically, from 1990 to 2060 the average annual temperature increased by 2.0 °C and the average annual precipitation decreased by 7.91 mm (Figure 2d).
2.4. Soil Database
The soil parameters included soil texture, pH, bulk density, field capacity, wilting point, clay fraction, and initial SOC content. Soil data for the 19 sites were obtained from the Australian Soil Resource Information System (ASRIS) Dominant Soil Order (resolution: 250 m raster) (http://www.asris.csiro.au, accessed on 1 April 2020). These included data on texture, pH, bulk density, and clay fraction (Table 2). Field capacity and wilting point were automatically calculated by the DNDC model, based on the input values of soil texture and clay fraction. The initial SOC content was obtained from the BFDC database.
2.5. Scenarios Simulation Setting
Scenario simulation is an advantage of using crop models in agricultural production, and can provide optimized management strategies to increase crop yields and improve soil environments. Typically, Australian farmers do not apply enough N-fertilizer but rely more on soil N reserves, due to a unique “autumn break” which enhances SOC mineralization. Legume–wheat rotation practice was optimized to improve the cropping structure. The contribution of climate change to SOC mineralization remains unclear. Luo reported that ignorance of the impact on SOC dynamics brought about by changes in soil properties, C pool composition, and quantity and quality of C input is likely to be one of the main sources of uncertainty in SOC predictions acquired from process-based SOC models [3]. To explore these problems, we utilized the DNDC model to perform simulations of several wheat cropping scenarios (1990–2060).
Six scenarios under RCP 85 are defined in Table 3.
Based on common practice in Australia and the BFDC dataset, field trials have defined approximately 10 kg N/ha to be a common or low N-fertilizer level. From related references, about 50 kg N/ha has been suggested as an adequate N-fertilizer level and about 100 kg N/ha represents excess N-fertilizer level [38]. Therefore, in this study common N-fertilizer application levels were 12 kg N/ha and adequate N-fertilizer application was 50 kg N/ha. Legume parameters for DNDC initial inputs were taken from [39].
2.6. Accuracy and Uncertainty
2.6.1. Simulation Accuracy Assessment
Linear regression was performed to establish a simple linear relationship between the simulated and measured values (y = ax + b). The slope (a) and intercept (b) of the 1:1 line was utilized to measure consistency between the simulated and observed values. The coefficient of determination (R2) represented the deviation between simulated and observed values (Equation (1)). Root means square error (RMSE) and normalized root mean square error (NRMSE) were estimated, to assess the model simulation accuracy. RMSE represented the difference between simulated and measured values (Equation (2)). NRMSE was calculated in order to describe the model simulations’ accuracy (Equation (3)).
where n is the number of tests, Pi is the simulation value obtained from the DNDC model, is the average of Pi, Oi is the observed value obtained from the BFDC dataset, and is the average of Oi.
2.6.2. Sensitivity Analysis
A sensitivity analysis was applied to reflect the uncertainty in the DNDC model’s output. Uncertainty analysis can also indicate how SOC would differ without climate change, because current practices in the wheat industry may have large contributions to the mining of soil carbon and nitrogen, which is a key driver of SOC change before climate change is considered. The most important explanatory variables were soil, rotation, and amount of N-fertilizer. SOC can be affected by different sources of uncertainty in its inputs, called explanatory variables. In this study, we simulated the scenarios described above, employing temperature, precipitation, N-fertilizer amount (0/12/50 kg N/ha/year), and rotation (wheat–fallow/legume–wheat) as explanatory variables, to test the DNDC model’s sensitivity to SOC. Due to the residuals associated with long time simulations, we smoothed short-term fluctuations to highlight longer-term trends. The R2 of an explanatory variable represents that variable alone, which was an efficient way to summarize the influence of the variables on SOC. The sensitivity analysis equation (considering only the independent variable) was taken from [38]:
where Y is the SOC simulation value, Xi is the explanatory variables, α is the intercept, βi is the slope or coefficient, and e is error.
We used semi-partial R2 to evaluate model sensitivity under conditions of multifactor interaction. Different from R2, semi-partial R2 represents the contribution of the variable including its interaction with other variables:
where Y is the SOC simulation value via DNDC, Xi is the explanatory variables, α is the intercept, βi is the slope or coefficient, and e is error. When we obtained the slope or coefficient for each variable from the statistical model above, we were able to establish an evaluation method to calculate the contribution of variables, to reflect clearly the variables’ effects on SOC change. The evaluation method was:
where Ct(xi) represents the contribution of the variable i (%), βi is the coefficient of R2 or semi-partial R2 value.
3. Results
3.1. Simulation Performance Based on 1990–2000 Observations
Accuracy verification of simulation results has always been one of the important elements in the field of modeling. We collected wheat yield observation data and SOC observation data for 19 study sites from 1990 to 2000 (obtained from the BFDC dataset), to verify the accuracy of the model simulation. Results for the model validation suggested that the DNDC model exhibited good performance in simulating the wheat cropping system. As shown in Figure 3, the linear relationship between observation yield and simulation yield was y = 0.86x + 434.67, R2 = 0.86, where x represents simulation yield and y represents observation yield. The RMSE of wheat yield was 395.26 kg/ha and NRMSE was 15.16% (between 10–20%), indicating that the DNDC model had good performance for simulation of wheat yield in Australia. The linear relationship between observation SOC and simulation SOC was y = 0.85x + 322.68, R2 = 0.80. The RMSE of SOC was 307.07 kg/ha and NRMSE was 13.21% (between 10–20%), showing that the DNDC model also performed well in the SOC simulation. Therefore, these results suggest that the DNDC model could simulate the biogeochemical processes underlying the Australian wheat cropping system with reasonably good accuracy.
3.2. Change in SOC from 1990–2060 with Common Practice
The 0–10 cm soil layer is the most active layer in the physical and chemical processes of soil, and 0–10 cm SOC content change could best reflect changes of soil productivity. Figure 4a presents the SOC (0–10 cm) variation curves for the 19 sites. All sites indicated a decrease in SOC from 1990–2060 under the RCP 85 climate change scenario, with wheat–fallow rotation and different N-fertilizer application amounts. The total SOC (0–10 cm) decreased by 424.8 kg/ha on average across the 19 sites (average decrease rate: 6.0 kg/ha per year). Site 17 showed the largest decrease in SOC (1126.6 kg/ha; average decrease rate: 15.9 kg/ha per year), while Site 13 had the smallest decrease (34.6 kg/ha; decrease rate: 0.5 kg/ha per year). The average decrease rates (SOC 0–10 cm) for the northern, southern, and western wheat cropping regions were 4.9, 5.45, and 7.5 kg/ha per year, respectively (Figure 4b). The highest and lowest decreases in SOC (0–10 cm) were observed in the western and northern wheat cropping regions, respectively. The 10–30 cm soil layer is the main soil layer from which wheat roots absorb nutrients. Among the three cropping systems, the southern wheat cropping system had the largest SOC in the 10–30 cm layer, as shown in Figure 4c,d. The SOC content of the northern wheat cropping system was larger than that of the western system in the 10–20 cm soil layer, while SOC content difference between the northern and western wheat cropping systems was not obvious. Soil quality, temperature, precipitation, and crop management strategies should be closely monitored in the western wheat cropping area.
3.3. Scenarios Simulation
Scenario simulation provided average results for 19 sites, shown in Table 4. The SOC had decreased for all six scenarios by the end of 2060. The smallest decrease for SOC was in Scenario Ⅵ (165.8 kg/ha) and the largest was in Scenario Ⅰ (1351.3 kg/ha). With the increase of N-fertilizer application rate, SOC decreased for both wheat–fallow rotation and legume–wheat rotation. The SOC (0–30 cm) at the start of 1990 for wheat–fallow rotation was 3712.9 kg/ha on average, and 2470.3 kg/ha by the end of 2060. The SOC (0–30 cm) at the start of 1990 for legume–wheat rotation was 3912.6 kg/ha on average and 3530.97 kg/ha by the end of 2060 (Table 4), which indicated that legume–wheat rotation could effectively reduce SOC loss. Mineral N is a key factor for SOC change, and has a close relationship with N-fertilizer rate, which inhibits C mineralization and promotes SOC increase. With the increase of N-fertilizer rate (0/12/50 kg N/ha/year), mineral N values for wheat–fallow rotation were 2.5/3.0/3.1 kg N/ha/year by the end of 2060, and for legume–wheat rotation were 7.9/6.7/5.9 kg N/ha. There was a positive relationship between N-fertilizer rate and mineral N for wheat–fallow rotation, and an inverse relationship for legume–wheat rotation.
Since our study focused primarily on the impact of cropland management strategies on SOC, we added two parameters to the uncertainty analysis, i.e., mineral N (mainly affected by N-fertilizer) and rotation, based on Luo’s conclusion. Therefore, our uncertainty analysis input parameters included C input, soil properties, initial SOC, climate factors (temperature, precipitation), N-fertilizer, and rotation. Clay is one of the most sensitive parameters of soil in the DNDC model, because clay not only determines soil texture but also affects other soil parameters (such as coefficient of withering, field capacity, saturated water capacity, carbon pool, etc.) [26]. Therefore, clay was used to represent soil parameters for the uncertainty analysis (Table 2).
The sensitivity analysis (Figure 5) indicated that during 1990–2060, the most influential variables on SOC change rate were average C input amount (20%), mineral N (19%), soil properties (18%), temperature (13%), precipitation (12%), initial SOC stock at the beginning of the trials (12%), and rotation (7.0%). The contribution order of these seven factors was roughly the same across four different time periods (1990–2007, 2008–2025, 2026–2042, and 2043–2060). In conclusion, in addition to C input amount and soil properties, mineral N was the most significant variable for SOC, and its amount was determined by N-fertilizer application rate. SOC was also sensitive to temperature and precipitation changes.
4. Discussion
4.1. Impacts of Climate Factors Change on SOC
We analyzed the relative relationships between annual average temperature, precipitation, and SOC, from 1990–2060 (Figure 6). These variables were normalized to eliminate the effects of units. Temperature and precipitation in Australia significantly increased from 1990–2060 according to RCP 85 scenario prediction, thus increasing the microbial activity of soil and consequently the decomposition of soil organic matter [40]. In particular, precipitation and temperature were inversely correlated with SOC content in all regions except one. Specifically, the western wheat growing region exhibited a proportional relationship between precipitation and SOC content.
In general, temperature and precipitation are expected to increase under drastic climate change scenarios. Previous studies have indicated similar relationships between precipitation, temperature, and SOC content [41,42]. High temperatures and sufficient water availability could increase microbial activity [43]. An increase in microbial activity has been shown to increase the decomposition rate of organic matter [23]. Therefore, soil organic matter is readily decomposed under favorable precipitation and temperature conditions. Furthermore, a large quantity of SOC is consumed during wheat growth. We found that an optimal increase in temperature and precipitation was beneficial to wheat growth.
4.2. Effects of N-Fertilizer Rate on SOC
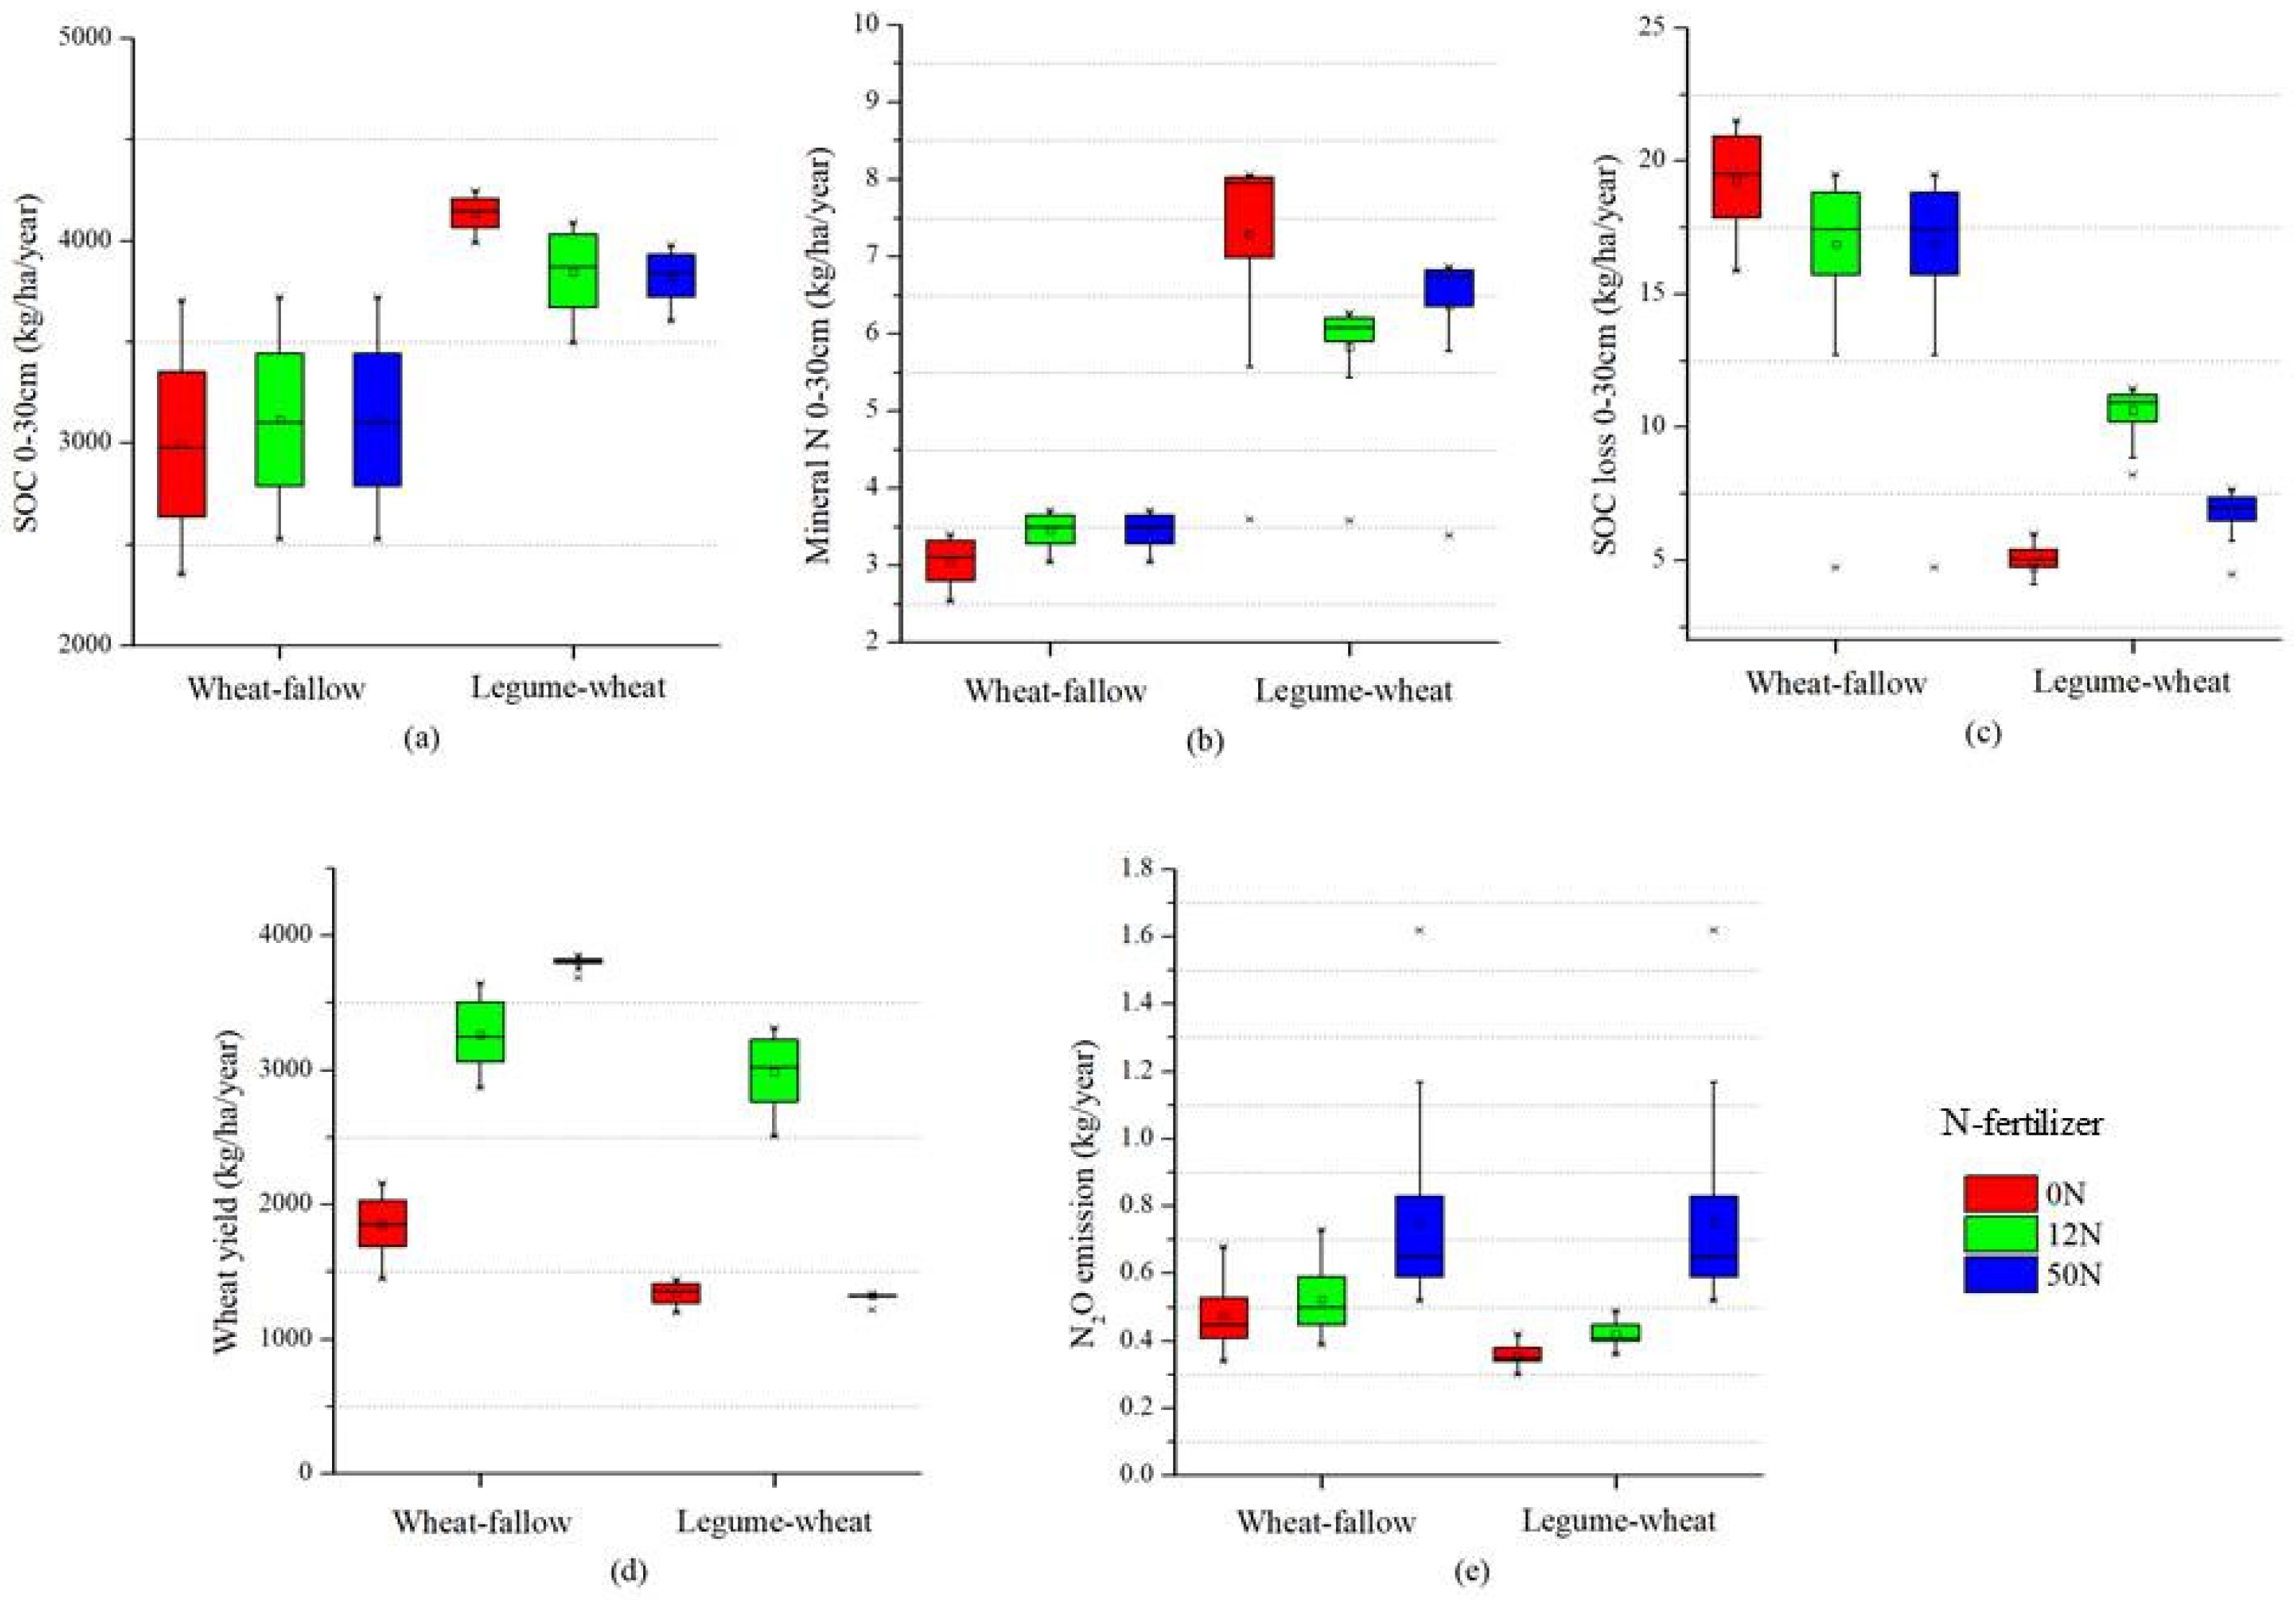
The most efficient way to increase wheat yield and SOC, particularly for wheat–fallow rotation, is to increase N-fertilizer rate. Awareness of the potential positive influence on wheat yields of SOC and N-fertilizer rate is of great interest to farmers and scholars, because such influence is important for wheat yield, economic costs of fertilizer, soil quality, and climate. Against a background of RCP 85, the impact of climate change on the process of wheat growth is unknown, and blindly applying large amounts of N-fertilizer may result in excess economic costs without increase of wheat yield, which may cause serious imbalance between economic input and wheat yield output. In addition, a large amount of N-fertilizer will release N2O, which is a greenhouse gas that can damage the soil environment and cause nonpoint source nitrogen pollution. According to the simulation results of the DNDC model under six scenarios, even against a background of RCP85 climate change, wheat–fallow rotation with a large amount of N-fertilizer was detrimental to wheat yield and SOC storage. When the N-fertilizer rate increased to 50 kg N/ha/year, compared with 0 kg N/ha/year, the wheat yield increased by 1945.4 kg/ha per year on average (Figure 7d), the SOC (0–30 cm) increased by 118.5 kg/ha per year on average (Figure 7a), SOC loss was well inhibited (Figure 7c), and N2O emission increased by 0.28 kg/ha pear year. However, with legume–wheat rotation, this rule did not hold true. Furthermore, the simulations did not consider the effects of special management strategies such as new high yielding cultivars, sowing densities, or high residual rates.
4.3. Effects of Rotation on SOC
Due to the interaction processes of N-fertilization and legume rotation, the influence of rotation on SOC change was indirect and complex. On the one hand, adequate N-fertilization rates and N returned in the residues of N-fixing legumes increased C mineralization and decreased SOC. On the other, adequate N from fertilization and legume N-fixing increased crop yield and SOC. Thus, resulting SOC change represents a trade-off between the two processes. While SOC change relied on the benefit ratio of legume biomass to N returned to the soil, adding a legume rotation benefited SOC in the low N-fertilization scenario (Figure 7a). This trade-off is complicated by the increase of legume yield, which may lead to more N being returned to the soil. However, in the high N-fertilization scenario, adding a leguminous phase during wheat rotation was disadvantageous for increasing SOC, because the legumes incorporate less biomass C into the soil carbon pool than other crops [44]. That explains why the SOC amount for 0 kg N-fertilization was larger than for 12 or 50 kg N-fertilization, as shown in Figure 7a. Our findings are consistent with those of similar modelling studies [38,43]. According to this discussion, it is recommended to add a legume phase to increase wheat yield in the low fertilizer scenario. However, in the high fertilizer scenario, adding legume rotation was not found to be beneficial to wheat yield. This is of great strategic significance for optimizing wheat cropping management strategies, adjusting the relationship between economic input and wheat yield, and coping with the negative effects of global climate change for wheat production in Australia.
5. Conclusions
Our study highlights the advantages of utilizing crop models for predicting agricultural production under the impacts of climate change. The results provide implications for agricultural management and food security. The major findings of this study are summarized:
- (1)
- It is predicted that there will be an increase in the average temperature and average precipitation in the Australian wheat cropping system from 1990–2060, under the RCP 85 climate change scenario.
- (2)
- The DNDC model indicated good performance when simulating the biogeochemical processes of the Australian wheat cropping system. The NRMSE of the wheat yield simulation was 15.16%, and for SOC was 13.21%.
- (3)
- In this scenario, the SOC (0–30 cm) in Australia’s three wheat cropping systems will decrease to 2848.0 kg C/ha on average by 2060, decreasing at an average rate of 0.4% per year from 1990 onwards.
- (4)
- The most influential variables on SOC change rate were the average C input amount (20%), mineral N (19%), soil properties (18%), temperature (13%), and precipitation (12%).
- (5)
- Compared to continuous wheat cropping, adding a legume phase can increase SOC and wheat yield in the low N-fertilizer scenario. However, adding a legume phase in the adequate N-fertilizer scenario will decrease SOC and wheat yield.
Author Contributions
Conceptualization, Q.L.; methodology, Q.L.; software, Q.L.; validation, M.G. and Z.-L.L.; formal analysis, Q.L., M.G. and Z.-L.L.; investigation, M.G. and Z.-L.L.; resources, Q.L. and M.G.; data curation, M.G. and Q.L.; writing-original draft preparation, Q.L.; writing-review and editing, Q.L., M.G. and Z.-L.L.; visualization, Q.L.; supervision, M.G. and Z.-L.L.; project administration, M.G.; funding acquisition, M.G. All authors have read and agreed to the published version of the manuscript.
Funding
This research was funded by the National Natural Science Foundation of China (grant number 41921001) and the Agricultural Science and Technology Innovation Program of the Chinese Academy of Agricultural Sciences (CAAS-2022-IARRP-GJ2022-20-2).
Data Availability Statement
Not applicable.
Conflicts of Interest
The authors declare no conflict of interest.
References
- Fleming, A.; Howden, S. Ambiguity: A new way of thinking about responses to climate change. Sci. Total Environ. 2016, 571, 1271–1274. [Google Scholar] [CrossRef]
- Teixeira, E.I.; de Ruiter, J.; Ausseil, A.-G.; Daigneault, A.; Johnstone, P.; Holmes, A.; Tait, A.; Ewert, F. Adapting crop rotations to climate change in regional impact modelling assessments. Sci. Total Environ. 2018, 616–617, 785–795. [Google Scholar] [CrossRef] [PubMed]
- Luo, Z.; Feng, W.; Luo, Y.; Baldock, J.; Wang, E. Soil organic carbon dynamics jointly controlled by climate, carbon inputs, soil properties and soil carbon fractions. Glob. Chang. Biol. 2017, 23, 4430–4439. [Google Scholar] [CrossRef] [PubMed]
- Hillel, D.; Rosenzweig, C. The Role of Soils in Climate Change. In Handbook of Climate Change and Agroecosystems: Impacts, Adaptation, and Mitigation; Imperial College Press: London, UK, 2014; pp. 11–13. [Google Scholar]
- Luo, Z.; Wang, E.; Baldock, J.; Xing, H. Potential soil organic carbon stock and its uncertainty under various cropping systems in Australian cropland. Soil Res. 2014, 52, 463–475. [Google Scholar] [CrossRef]
- Hoyle, F.C.; Baldock, J.A.; Murphy, D.V. Soil Organic Carbon–Role in Rainfed Farming Systems; Springer: Dordrecht, The Netherlands, 2011; p. 11. [Google Scholar]
- Smith, P.; Martino, D.; Cai, Z.; Gwary, D.; Smith, J. Greenhouse gas mitigation in agriculture. Philos. Trans. R. Soc. B-Biol. Sci. 2008, 363, 789–813. [Google Scholar] [CrossRef]
- Stockmanna, U.; Adamsa, M.A.; Crawforda, J.W.; Henakaarchchia, D.; Jenkinsa, M.; Minasnya, B.; Mcbratneya, A.B.; Courcellesa, V.; Singha, K. The knowns, known unknowns and unknowns of sequestration of soil organic carbon. Agric. Ecosyst. Environ. 2013, 164, 80–89. [Google Scholar] [CrossRef]
- Saxton, K.E.; Rawls, W.J. Soil Water Characteristic Estimates by Texture and Organic Matter for Hydrologic Solutions. Soil Sci. Soc. Am. J. 2006, 70, 0117. [Google Scholar] [CrossRef]
- Crowther, T.W.; Todd-Brown, K.E.O.; Rowe, C.W.; Wieder, W.R.; Carey, J.C.; Machmuller, M.B.; Snoek, B.L.; Fang, S.; Zhou, G.; Allison, S.D.; et al. Quantifying global soil carbon losses in response to warming. Nature 2016, 540, 104–108. [Google Scholar] [CrossRef]
- Rabot, E.; Wiesmeier, M.; Schlüter, S.; Vogel, H.-J. Soil structure as an indicator of soil functions: A review. Geoderma 2018, 314, 122–137. [Google Scholar] [CrossRef]
- Davidson, E.A.; Janssens, I.A. Temperature sensitivity of soil carbon decomposition and feedbacks to climate change. Nature 2006, 440, 165–173. [Google Scholar] [CrossRef] [Green Version]
- Saint-Laurent, D.; Arsenault-Boucher, L. Soil properties and rate of organic matter decomposition in riparian woodlands using the TBI protocol. Geoderma 2019, 358, 113976. [Google Scholar] [CrossRef]
- Hou, R.-J.; Li, T.-X.; Fu, Q.; Liu, D.; Li, M.; Zhou, Z.-Q.; Yan, J.-W.; Zhang, S. Research on the distribution of soil water, heat, salt and their response mechanisms under freezing conditions. Soil Tillage Res. 2020, 196, 104486. [Google Scholar] [CrossRef]
- West, T.O.; Post, W.M. Soil organic carbon sequestration rates by tillage and crop rotation: A global data analysis. Soil Sci. Soc. Am. 2002, 66, 1930–1946. [Google Scholar] [CrossRef]
- Von Lützow, M.; Kögel-Knabner, I.; Ekschmitt, K.; Matzner, E.; Flessa, H. Stabilization of organic matter in temperate soils: Mechanisms and their relevance under different soil conditions—A review. Eur. J. Soil Sci. 2010, 57, 426–445. [Google Scholar] [CrossRef]
- Jobbágy, E.G.; Jackson, R.B. The Vertical Distribution of Soil Organic Carbon and Its Relation to Climate and Vegetation. Ecol. Appl. 2000, 10, 423–436. [Google Scholar] [CrossRef]
- Ferreira, A.D.O.; Sá, J.C.D.M.; Lal, R.; Tivet, F.; Briedis, C.; Inagaki, T.M.; Gonçalves, D.R.P.; Romaniw, J. Macroaggregation and soil organic carbon restoration in a highly weathered Brazilian Oxisol after two decades under no-till. Sci. Total Environ. 2017, 621, 1559–1567. [Google Scholar] [CrossRef]
- Capalbo, S.M.; Antle, J.M.; Seavert, C. Next generation data systems and knowledge products to support agricultural producers and science-based policy decision making. Agric. Syst. 2017, 155, 191–199. [Google Scholar] [CrossRef]
- Li, C.; Frolking, S.; Crocker, G.J.; Grace, P.R.; Klír, J.; Körchens, M.; Poulton, P.R. Simulating trends in soil organic carbon in long-term experiments using the DNDC model. Geoderma 1997, 81, 45–60. [Google Scholar] [CrossRef]
- Xie, Z.; Zhu, J.; Liu, G.; Cadisch, G.; Hasegawa, T.; Chen, C.; Sun, H.; Tang, H.; Zeng, Q. Soil organic carbon stocks in China and changes from 1980s to 2000s. Glob. Chang. Biol. 2007, 13, 1989–2007. [Google Scholar] [CrossRef]
- Khalil, M.I.; Fornara, D.A.; Osborne, B. Simulation and validation of long-term changes in soil organic carbon under permanent grassland using the DNDC model. Geoderma 2019, 361, 114014. [Google Scholar] [CrossRef]
- Steinbeiss, S.; Gleixner, G.; Antonietti, M. Effect of biochar amendment on soil carbon balance and soil microbial activity. Soil Biol. Biochem. 2009, 41, 1301–1310. [Google Scholar] [CrossRef]
- Abdalla, M.; Wattenbach, M.; Smith, P.; Ambus, P.; Jones, M.; Williams, M. Application of the DNDC model to predict emissions of N2O from Irish agriculture. Geoderma 2009, 151, 327–337. [Google Scholar] [CrossRef]
- Cai, Z.; Sawamoto, T.; Li, C.; Kang, G.; Boonjawat, J.; Mosier, A.; Wassmann, R.; Tsuruta, H. Field validation of the DNDC model for greenhouse gas emissions in East Asian cropping systems. Glob. Biogeochem. Cycles 2003, 17, 1107. [Google Scholar] [CrossRef]
- Li, C.; Frolking, S.; Frolking, T.A. A model of nitrous oxide evolution from soil driven by rainfall events: 1. Model structure and sensitivity. J. Geophys. Res. Earth Surf. 1992, 97, 9759–9776. [Google Scholar] [CrossRef]
- Gao, M.; Li, Z.-L.; Liu, S.; Gao, Y.; Leng, P.; Duan, S. Drought loss assessment combining remote sensing and a crop growth model for maize in Yunnan Province, China. Int. J. Remote Sens. 2018, 40, 2151–2165. [Google Scholar] [CrossRef]
- Ali, S.; Schwenke, G.D.; Peoples, M.B.; Scott, J.F.; Herridge, D.F. Nitrogen, Yield and Economic Benefits of Summer Legumes for Wheat Production in Rainfed Northern Pakistan. J. Agron. 2002, 1, 15–19. [Google Scholar] [CrossRef]
- Anderson, G.C.; Peverill, K.I.; Brennan, R.F. Soil sulfur-crop response calibration relationships and criteria for field crops grown in Australia. Crop Pasture Sci. 2013, 64, 523–534. [Google Scholar] [CrossRef]
- Kariyapperuma, K.A.; Wagner-Riddle, C.; Furon, A.C.; Li, C. Assessing Spring Thaw Nitrous Oxide Fluxes Simulated by the DNDC Model for Agricultural Soils. Soil Sci. Soc. Am. J. 2011, 75, 678–690. [Google Scholar] [CrossRef]
- Mu, L.; Liang, Y.; Xue, Q.; Chen, C.; Lin, X. Using the DNDC model to compare soil organic carbon dynamics under different crop rotation and fertilizer strategies. Span. J. Agric. Res. 2014, 12, 265. [Google Scholar] [CrossRef]
- Zhao, X.; Hu, K.; Stahra, K. Simulation of SOC content and storage under different irrigation, fertilization and tillage conditions using EPIC model in the North China Plain. Soil Tillage Res. 2013, 2, 128–135. [Google Scholar] [CrossRef]
- Fick, S.E.; Hijmans, R.J. WorldClim 2: New 1-km spatial resolution climate surfaces for global land areas. Int. J. Climatol. 2017, 37, 4302–4315. [Google Scholar] [CrossRef]
- Lang, C.; Fettweis, X.; Erpicum, M. Future climate and surface mass balance of Svalbard glaciers in an RCP8.5 climate scenario: A study with the regional climate model MAR forced by MIROC5. Cryosphere 2015, 9, 945–956. [Google Scholar] [CrossRef]
- Qin, Y.; Wang, C.; Zhao, Z.; Pan, X.; Li, Z. Climate change impacts on the global potential geographical distribution of the agri-cultural invasive pest, Bactrocera dorsalis (Hendel) (Diptera: Tephritidae). Clim. Chang. 2019, 155, 145–156. [Google Scholar] [CrossRef]
- Bellenger, H.; Guilyardi, E.; Leloup, J.; Lengaigne, M.; Vialard, J. ENSO representation in climate models: From CMIP3 to CMIP5. Clim. Dyn. 2013, 42, 1999–2018. [Google Scholar] [CrossRef]
- Wang, C.; Zhang, L.; Lee, S.-K.; Wu, L.; Mechoso, C.R. A global perspective on CMIP5 climate model biases. Nat. Clim. Chang. 2014, 4, 201–205. [Google Scholar] [CrossRef]
- Godde, C.M.; Thorburn, P.J.; Biggs, J.S.; Meier, E.A. Understanding the Impacts of Soil, Climate, and Farming Practices on Soil Organic Carbon Sequestration: A Simulation Study in Australia. Front. Plant Sci. 2016, 7, 661. [Google Scholar] [CrossRef]
- Muschietti-Piana, P.; McBeath, T.M.; McNeill, A.M.; Cipriotti, P.A.; Gupta, V.V.S.R. Combined nitrogen input from legume residues and fertilizer improves early nitrogen supply and uptake by wheat. J. Plant Nutr. Soil Sci. 2020, 183, 355–366. [Google Scholar] [CrossRef]
- Chen, F.; Wang, J.; Jin, L.; Zhang, Q.; Li, J.; Chen, J. Rapid warming in mid-latitude central Asia for the past 100 years. Front. Earth Sci. China 2009, 3, 42–50. [Google Scholar] [CrossRef]
- Burke, I.C.; Yonker, C.M.; Parton, W.J.; Cole, C.V.; Schimel, D.S. Texture, climate, and cultivation effects on soil organic matter content in US grassland soils. Soil Sci. Soc. Am. J. 1989, 53, 800–805. [Google Scholar] [CrossRef]
- Schjønning, P.; Thomsen, I.K.; Moldrup, P.; Christensen, B.T. Linking Soil Microbial Activity to Water- and Air-Phase Contents and Diffusivities. Soil Sci. Soc. Am. J. 2003, 67, 156–165. [Google Scholar] [CrossRef]
- Dalal, R.C.; Strong, W.M.; Weston, E.J.; Cooper, J.E.; Wildermuth, G.B.; Lehane, K.J.; King, A.J.; Holmes, C.J. Sustaining productivity of a Vertisol at Warra, Queensland, with fertilisers, no-tillage, or legumes. 5. Wheat yields, nitrogen benefits and water-use ef-ficiency of chickpea-wheat rotation. Aust. J. Exp. Agric. 1998, 38, 489–501. [Google Scholar] [CrossRef]
- Yao, Z.; Zhang, D.; Yao, P.; Zhao, N.; Li, Y.; Zhang, S.; Zhai, B.; Huang, D.; Ma, A.; Zuo, Y.; et al. Optimizing the synthetic nitrogen rate to balance residual nitrate and crop yield in a leguminous green-manured wheat cropping system. Sci. Total Environ. 2018, 631–632, 1234–1242. [Google Scholar] [CrossRef]
Figure 1.
Location of the study area and the distribution of observation sites.

Figure 2.
Climate change trends (1990–2060) for the three wheat cropping systems. AT and AP represent monthly average temperature and monthly average precipitation, respectively. (a) The northern wheat cropping region, (b) the southern wheat cropping region, (c) the western wheat cropping region, (d) variation in temperature and precipitation (1990–2060) for the three wheat cropping regions.

Figure 3.
DNDC simulation accuracy for wheat yield and SOC between 1990–2000 for 19 sites in Australia.
Figure 3.
DNDC simulation accuracy for wheat yield and SOC between 1990–2000 for 19 sites in Australia.

Figure 4.
SOC changes during 1990–2060. (a) The 0–10 cm SOC change for the 19 observation sites. (b), (c), and (d) show 0–10, 10–20, 20–30 cm average SOC for the three wheat cropping regions, respectively. In (d), the lines representing the ‘northern wheat cropping system’ and ‘western wheat cropping system’ overlap.
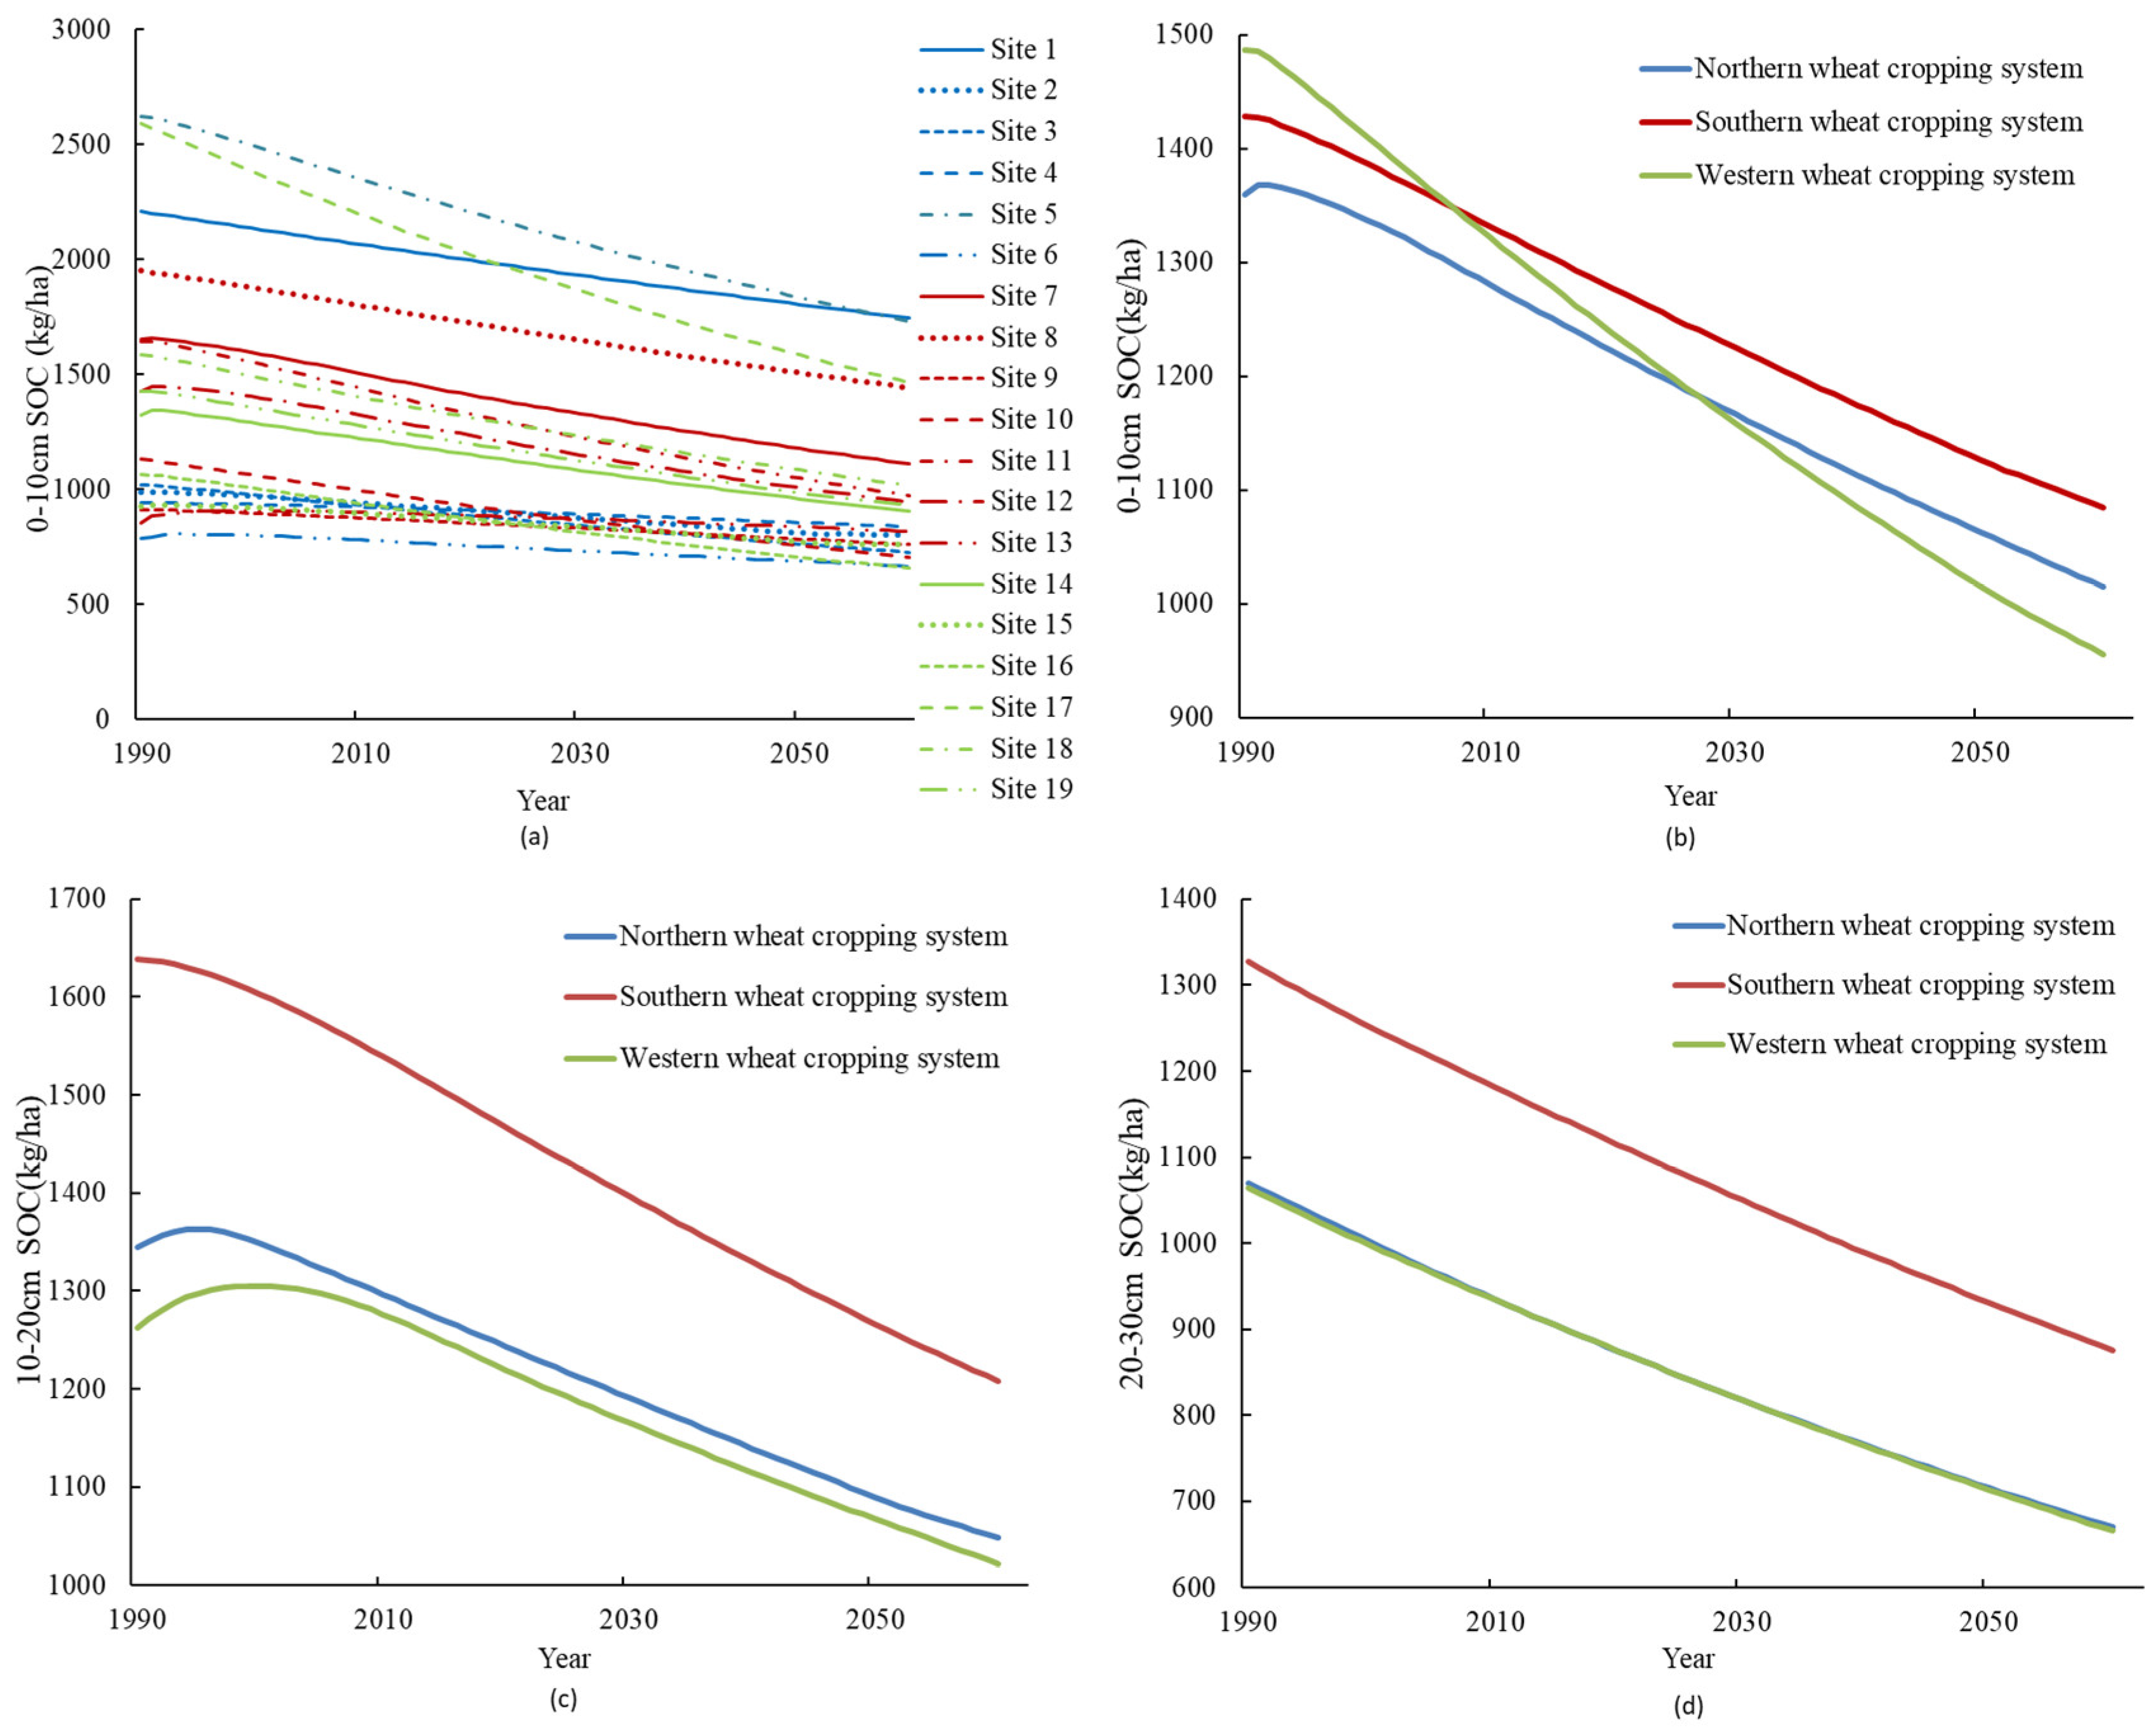
Figure 5.
Contribution of factors (C input, soil properties, temperature (Temp.), precipitation (Prec.), mineral N, and rotation) to SOC for the periods 1990–2007 (a), 2008–2025 (b), 2026–2042 (c), and 2042–2060 (d), respectively. R2 and semi-partial R2 represent the contribution to SOC variance of each variable alone and the contribution of the variable including its interaction with other variables, respectively.

Figure 6.
Relative relationships between temperature, precipitation, and SOC for the three wheat cropping systems. (a) The northern wheat cropping area, (b) the southern wheat cropping area, (c) the western wheat cropping area.
Figure 6.
Relative relationships between temperature, precipitation, and SOC for the three wheat cropping systems. (a) The northern wheat cropping area, (b) the southern wheat cropping area, (c) the western wheat cropping area.
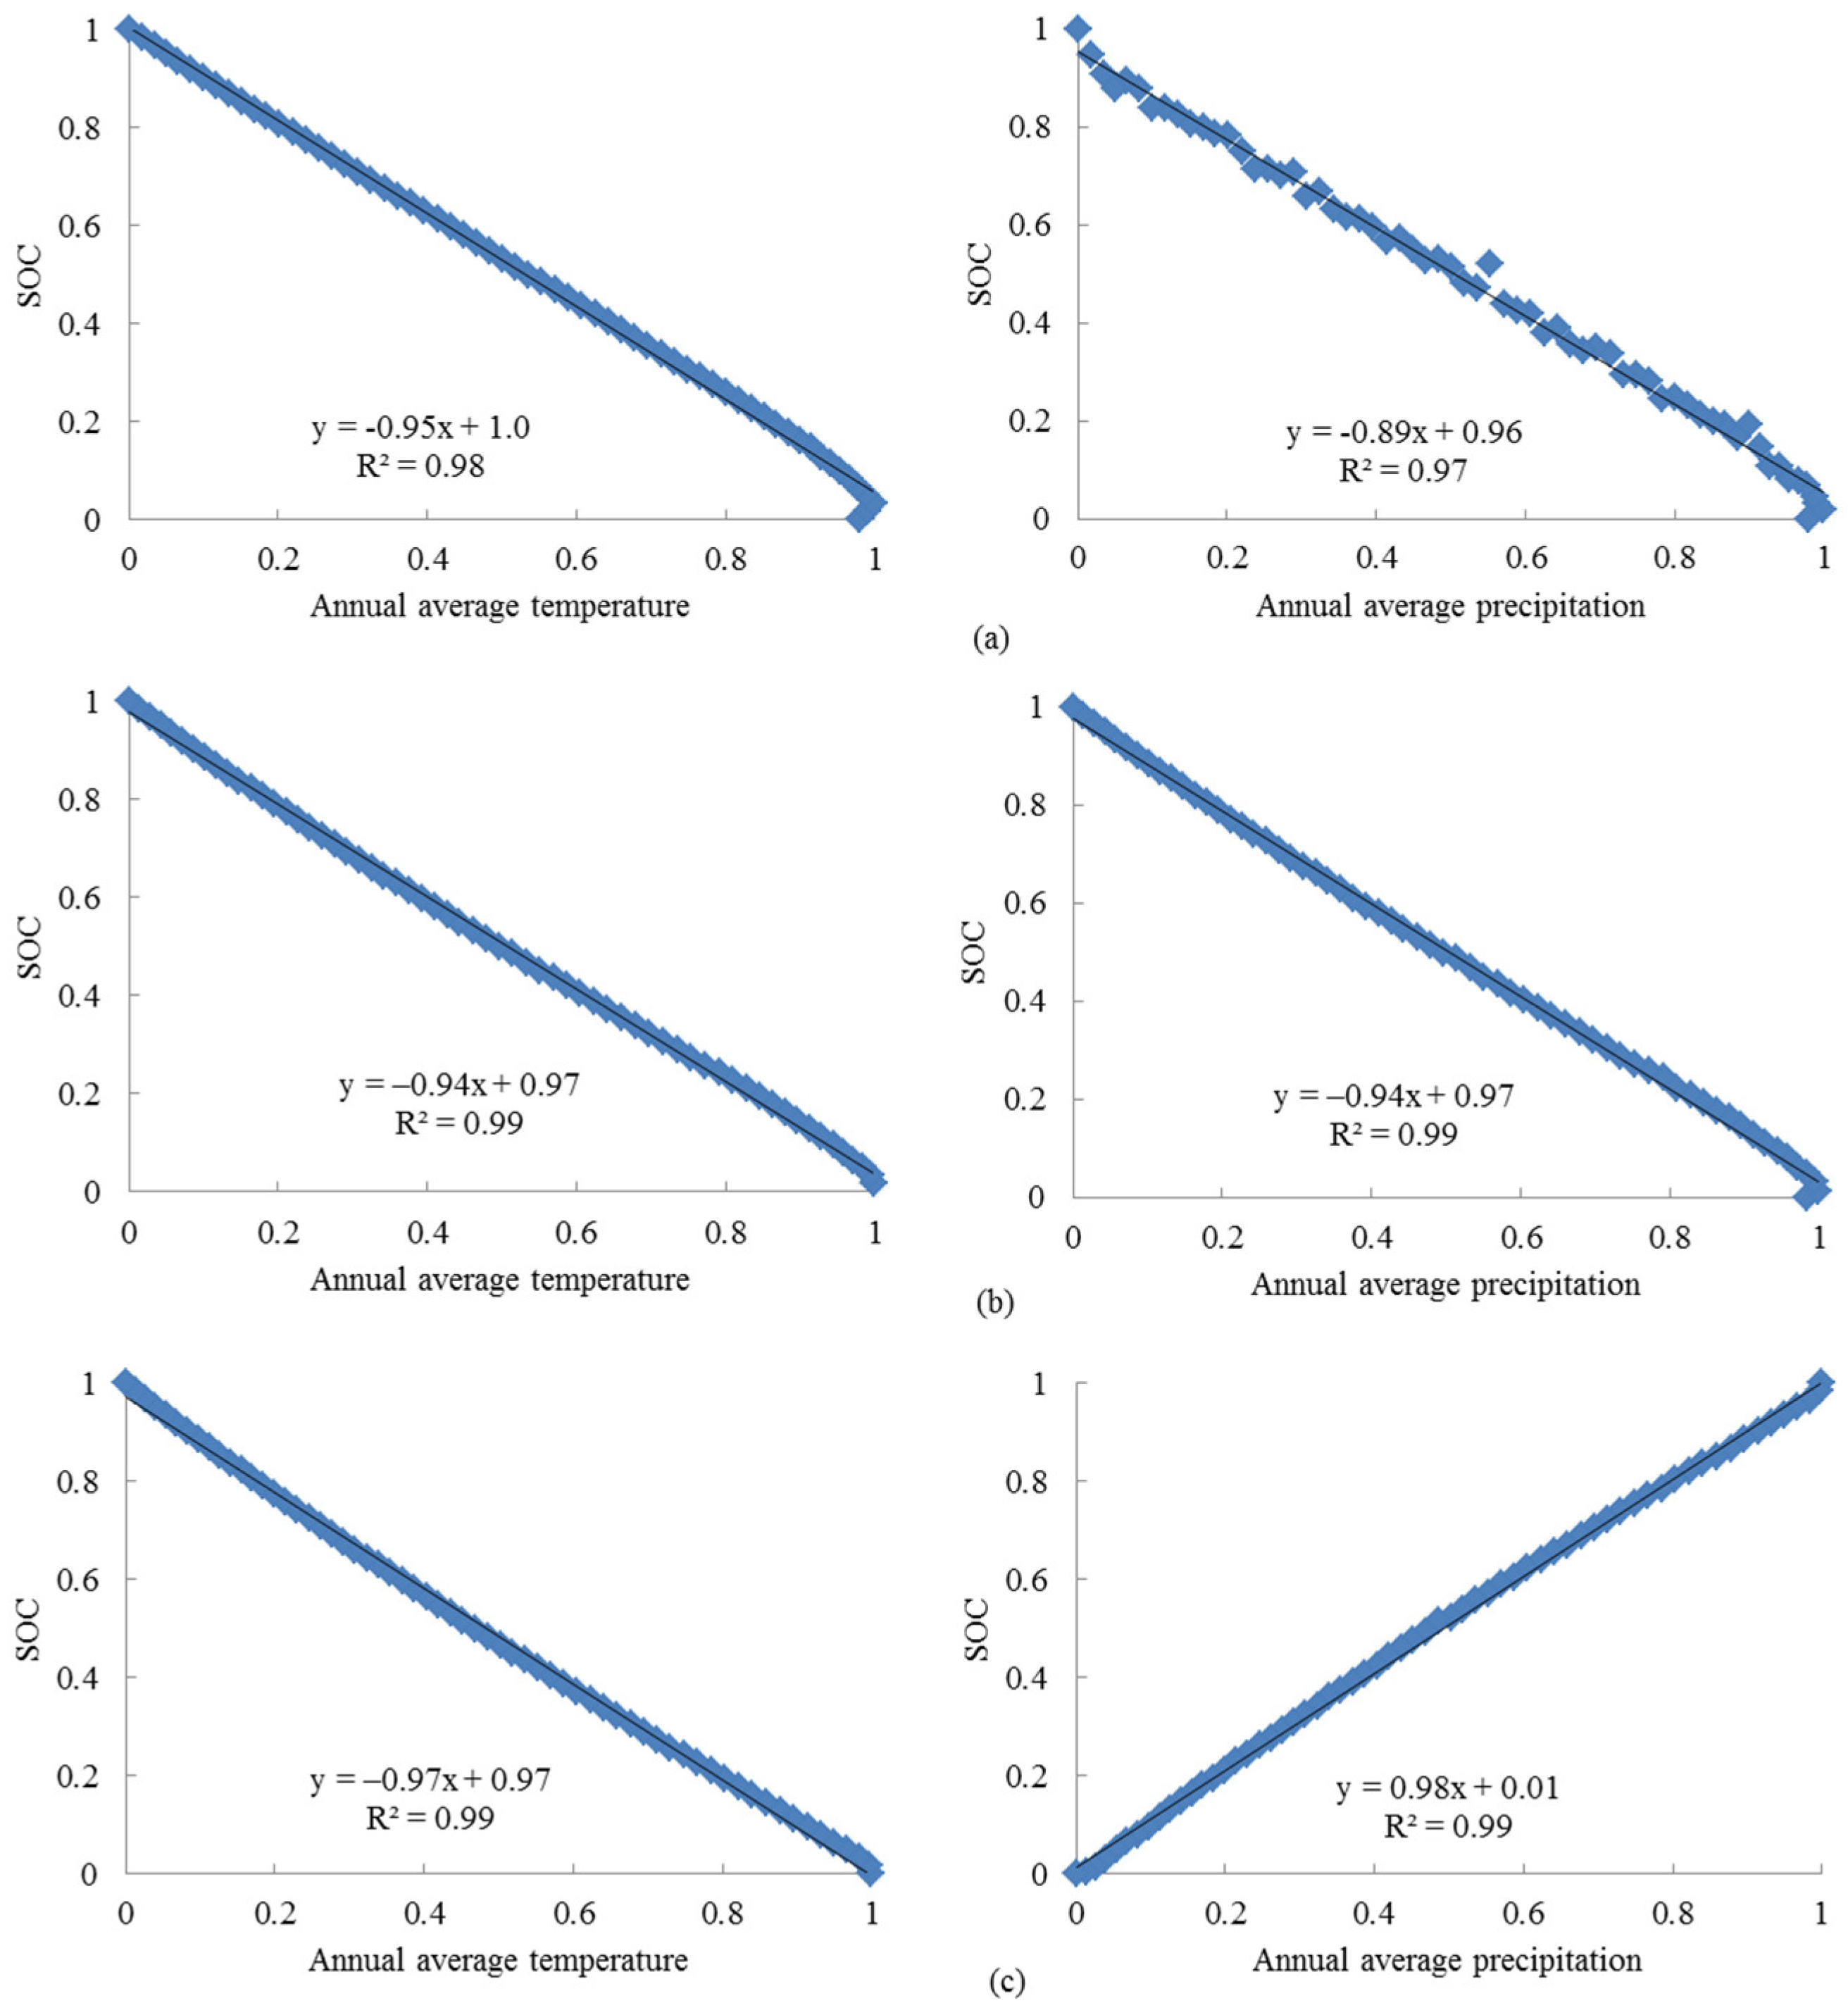
Figure 7.
Influence of fertilization rate on (a) SOC (0–30 cm), (b) mineral N (0–30 cm), (c) SOC loss (0–30 cm), (d) wheat yield, and (e) N2O emission.
Figure 7.
Influence of fertilization rate on (a) SOC (0–30 cm), (b) mineral N (0–30 cm), (c) SOC loss (0–30 cm), (d) wheat yield, and (e) N2O emission.

Table 1.
Main input parameters for the DNDC model.
| Items | Unit | |
|---|---|---|
| Climate | Daily max temperature | °C |
| Daily min temperature | °C | |
| Daily precipitation | mm | |
| Soil | Texture | - |
| pH | - | |
| Bulk density | g/cm3 | |
| Field capacity | g/kg | |
| Wilting point | g/kg | |
| Clay fraction | % | |
| Initial SOC content | kg/kg | |
| Crop | Max biomass production | kg C/ha/year |
| Biomass fraction (Grain/Leaf/Stem/Root) | % | |
| Biomass C/N ratio (Grain/Leaf/Stem/Root) | % | |
| Annual N demand | kg C/ha/year | |
| Thermal degree days for maturity | °C | |
| Water demand | g water/g DM | |
| N fixation index | - | |
| Optimum temperature | °C | |
| Management | Duration of vegetation period | day |
| Fertilization | kg N/ha | |
| Straw return rate | % |
Table 2.
Soil texture for 19 sites in Australia.
| Site ID | Texture | pH | Bulk Density (g/cm3) | Clay (%) |
|---|---|---|---|---|
| 1 | Chromosol | 5.5 | 1.44 | 18 |
| 2 | Tenosol | 5.1 | 1.44 | 11 |
| 3 | Vertosol | 6.5 | 1.60 | 30 |
| 4 | Kandosol | 5.2 | 1.23 | 27 |
| 5 | Kandosol | 5.8 | 1.42 | 22 |
| 6 | Sodosol | 6.4 | 1.44 | 16 |
| 7 | Chromosol | 5.9 | 1.00 | 23 |
| 8 | Kandosol | 5.9 | 1.49 | 17 |
| 9 | Chromosol | 7.3 | 1.44 | 35 |
| 10 | Vertosol | 6.8 | 1.27 | 52 |
| 11 | Vertosol | 6.7 | 1.24 | 57 |
| 12 | Kandosol | 5.9 | 1.43 | 12 |
| 13 | Vertosol | 6.5 | 1.60 | 30 |
| 14 | Calcarosol | 7.4 | 1.42 | 12 |
| 15 | Calcarosol | 8.0 | 1.39 | 24 |
| 16 | Calcarosol | 7.7 | 1.41 | 15 |
| 17 | Calcarosol | 7.4 | 1.42 | 12 |
| 18 | Dermosol | 7.3 | 1.42 | 36 |
| 19 | Sodosol | 5.2 | 1.40 | 15 |
Table 3.
Settings of simulation scenarios (1990–2060) for Australian wheat cropping systems.
| Rotation | N-Fertilizer (Wheat, kg/ha) | N-Fertilizer (Legume, kg/ha) | Climate Scenario | |
|---|---|---|---|---|
| Scenario Ⅰ | wheat–fallow | 0 | - | RCP85 |
| Scenario Ⅱ | wheat–fallow | 12 | - | RCP85 |
| Scenario Ⅲ | wheat–fallow | 50 | - | RCP85 |
| Scenario Ⅳ | legume–wheat | 0 | 0 | RCP85 |
| Scenario Ⅴ | legume–wheat | 12 | 0 | RCP85 |
| Scenario Ⅵ | legume–wheat | 50 | 0 | RCP85 |
Table 4.
Changes of soil characteristics in six scenario simulations for 1990–2060.
| Scenario Ⅰ | Scenario Ⅱ | Scenario Ⅲ | Scenario Ⅳ | Scenario Ⅴ | Scenario Ⅵ | |
|---|---|---|---|---|---|---|
| N-fertilizer (wheat, kg N/ha) | 0 | 12 | 50 | 0 | 12 | 50 |
| Rotation | wheat–fallow | wheat–fallow | wheat–fallow | legume–wheat | legume–wheat | legume–wheat |
| Initial SOC of 19 sites (kg/ha) | 1.1 ± 0.3 | 1.1 ± 0.3 | 1.1 ± 0.3 | 1.1 ± 0.3 | 1.1 ± 0.3 | 1.1 ± 0.3 |
| Sum of mineral N (0–30 cm, kg/ha) at the start of 1990 | 3.3 | 3.4 | 3.4 | 3.6 | 3.58 | 3.4 |
| Sum of mineral N (0–30 cm, kg/ha) at the end of 2060 | 2.5 | 3.0 | 3.1 | 7.9 | 6.7 | 5.9 |
| SOC 0–30 cm at the start of 1990 (kg/ha) | 3705.4 | 3711.7 | 3721.6 | 3771.3 | 3976.7 | 3989.8 |
| SOC 0–30 cm at the end of 2060 (kg/ha) | 2354.1 | 2528.5 | 2528.4 | 3605.5 | 3496.0 | 3491.4 |
| SOC decrease amount (kg/ha) | 1351.3 | 1183.2 | 1193.2 | 165.8 | 480.7 | 498.4 |
Publisher’s Note: MDPI stays neutral with regard to jurisdictional claims in published maps and institutional affiliations. |
© 2022 by the authors. Licensee MDPI, Basel, Switzerland. This article is an open access article distributed under the terms and conditions of the Creative Commons Attribution (CC BY) license (https://creativecommons.org/licenses/by/4.0/).
Share and Cite
MDPI and ACS Style
Li, Q.; Gao, M.; Li, Z.-L. Soil Organic Carbon Storage in Australian Wheat Cropping Systems in Response to Climate Change from 1990 to 2060. Land 2022, 11, 1683. https://doi.org/10.3390/land11101683
AMA Style
Li Q, Gao M, Li Z-L. Soil Organic Carbon Storage in Australian Wheat Cropping Systems in Response to Climate Change from 1990 to 2060. Land. 2022; 11(10):1683. https://doi.org/10.3390/land11101683
Chicago/Turabian StyleLi, Qiang, Maofang Gao, and Zhao-Liang Li. 2022. "Soil Organic Carbon Storage in Australian Wheat Cropping Systems in Response to Climate Change from 1990 to 2060" Land 11, no. 10: 1683. https://doi.org/10.3390/land11101683
Note that from the first issue of 2016, this journal uses article numbers instead of page numbers. See further details here.