

Assessment and Decomposition of Regional Land Use Efficiency of the Service Sector in China

1
School of Economics, Institute of Population and Economic Development, Shandong University of Finance and Economics, Jinan 250014, China
2
School of Management Engineering, Shandong Jianzhu University, Jinan 250101, China
*
Author to whom correspondence should be addressed.
Land 2022, 11(11), 1911; https://doi.org/10.3390/land11111911
Submission received: 29 September 2022
/
Revised: 22 October 2022
/
Accepted: 24 October 2022
/
Published: 27 October 2022
(This article belongs to the Special Issue Impacts of Land Use Pattern in Metropolitan Area)
Abstract
:High land use efficiency is the key to improving total factor productivity, and also an important force behind achieving sustained economic growth. Existing studies have mainly focused on the land use efficiency of the industry sector. Yet, the issue of land use efficiency of the service sector (SLUE) has been largely overlooked. This study examines regional differences and efficiency decomposition by using a slack based model (SBM) of undesirable output, and the Malmquist productivity index (MPI) under a data envelopment analysis framework. The results reveal that: (1) In China, the land use efficiency of the service sector is unbalanced, showing an inverted growth law of “low in developed areas and high in backward areas”. (2) The land use efficiency of the service sector can be decomposed into technical progress, pure technical efficiency, and scale efficiency. From the decomposition results, the growth rate of pure technical efficiency presents a trend of “low in the east and high in the west”; the scale efficiency also falls into the situation of weak group growth. Technological progress has maintained steady improvement. (3) The coordinated improvement of land use efficiency of the service sector needs to focus on resolving the “beggar-thy-neighbor” issue caused by existing large regional differences. In this article, the puzzle of land use efficiency differences in the service industry is well solved, and thus provides valuable enlightenment for the benign growth of service industries in countries and regions around the world.
1. Introduction
Land use efficiency (LUE) refers to economic benefits of each unit of land, which is an important indicator to determine the efficiency of land allocation. With the acceleration of urbanization, LUE plays a crucial role in urban operation efficiency and sustainable development [1,2,3]. Sustainable development, first proposed in 1972, is an economic growth model that focuses on long-term development. It refers to the development that not only meets the needs of contemporary people, but also does not harm future generations to meet their needs. It is one of the basic requirements of the Scientific Outlook on Development. As an important type of urban land, land for the service section plays an important role in the process of sustainable and high-quality urban development, carrying important functions, such as improving urban management level, enhancing the overall function of the city, improving the living environment, and promoting the optimization, integration, and rational allocation of land resources [4,5,6]. As an indicator reflecting the degree of scientific utilization of land for the service section, land use efficiency of the service sector (SLUE) should be paid attention to and researched. SLUE, namely the land use efficiency of the service industry, is an indicator that should be used effectively in the current resource utilization. SLUE is an important issue that the service sector pays close attention to.
With the rapid development of urbanization, the high frequency exchange and drastic transformation of urban land function attributes become a land use law of urbanization [7,8,9]. Economic development oriented towards the service industry plays a unique role in the adjustment of urban land use structure and the transformation of urban landscape in China [10,11]. This leads to the large-scale expansion of land for the service section. According to the China Urban Construction Statistical Yearbook, the area of service industry construction land increased by 36% from 19,902.4 km2 in 2011 to 27,092.5 km2 in 2017. Two intuitive facts are: (1) Urban sprawl is intensifying, urban boundaries are extending, and a large amount of agricultural land is being converted into urban land [12], especially land for the service section. (2) Industrial land in cities is gradually giving way to land for the service section; more and more factories are moving out of cities. These facts have much to do with the government’s regulation and control of land. On the one hand, facing the incentive of economic performance assessment, local governments have a high dependence on land finance. The government tends to seek more land transfer benefits by arranging urban planning space and land planning indicators, which are important means for the government to obtain financial revenue [11]. On the other hand, compared with the manufacturing industry, the service industry is environmentally friendly and has a high degree of land intensification. The supply of land for the service industry is more in line with the demand under the dual pressure of land resource scarcity and environmental pollution [13]. However, the transformation of land structure caused by the acceleration of urbanization may lead to inefficient land use status, such as disordered land use and fragmented land use [14,15,16,17]. In this context, it is urgent to study the spatial cooperative improvement of SLUE.
At present, the research on SLUE is relatively scarce, but the research on LUE of other land types can provide certain reference for us to measure SLUE. In terms of efficiency evaluation methods, the Data Envelopment Analysis (DEA) and the Stochastic Frontier Analysis are commonly used [12,18]. Among them, the DEA is a widely used method in LUE evaluation because it does not need to set the form of production function and can consider multiple inputs and outputs simultaneously [19]. With people’s increasing attention to environmental issues, it has become a trend for LUE evaluation to include undesirable output factors in the efficiency measurement [19,20]. Since the development of China’s service industry still has the extensive characteristics of high emissions [21], the measurement of SLUE should also consider environmental pollution and other undesirable outputs. Compared with the defects of the traditional DEA model, the slack based model (SBM) proposed by Tone [22] can not only handle the undesirable outputs, but also solve the input-output slack issue in efficiency evaluation [19]. This model can measure efficiency more accurately [23]. On this basis, the Malmquist productivity index (MPI) can describe the change trend and evolution characteristics of efficiency [24]. Thus, the combination of the SBM model of undesirable output and the Malmquist productivity index can accurately measure SLUE and its dynamic trend under environmental constraints.
In terms of the measurement of regional differences, quantitative analysis methods for the degree of regional differences mostly involve the Theil index [25], the Gini coefficient [26], the kernel density estimation [27] and spatial autocorrelation [28]. The Theil index, proposed by Theil [29], was first used to describe income differences among countries. Since it could measure the contribution of different types of differences to total differences, it was later widely used to describe individual differences. From the perspective of research, many scholars discussed the regional differences of land use from the perspectives of urban agglomeration [30], basin [31], and specific provinces [32,33]. In reality, there is a significant regional difference in the economic output of land for the service section. For example, the unit output value of land for the service section in Beijing was nearly four times that of Xinjiang in 2017. Therefore, it is necessary to measure the regional difference of SLUE. The division of four traditional regions in China provides us with a research perspective.
In addition, in the selection of research objectives, existing research mainly focuses on the measurement of the overall urban construction land efficiency [34], industrial LUE [35], and agricultural LUE [36]. However, few studies have measured LUE from the perspective of the service industry. As the service industry has the highest proportion of added value in GDP in China, it is necessary to measure SLUE and its regional differences. This raises two challenges. First, can the distribution pattern and regional differences of LUE in different provinces and four major regions of China be analyzed from the perspective of the service industry? Second, what effective strategies can be used to improve both SLUE and synergistic development in these regions? If these two problems cannot be solved in time, the benign growth in terms of services will be hard to achieve.
The main objectives of this study are as follows: First, this article measures the SLUE of 30 provinces in China and compares the differences between the provinces. Second, the Malmquist productivity index method is used to decompose the SLUE and find the source of the driving force that affects the spatial differences of the SLUE. Third, the Theil index method is used to quantitatively analyze regional differences in SLUE and investigate the size and source of regional differences in SLUE. Finally, this article proposes a differentiated regional governance strategy to narrow the spatial differences of SLUE and reduce the deadweight efficiency loss. The research of this article is expected to form and identify the reasons behind the spatial differences in SLUE and the path to achieve spatial coordinated promotion. Furthermore, theoretical support is provided for countries and regions at different development stages that will help these areas to improve their SLUE. Therefore, our efforts are beneficial in terms of filling the gaps in academic differences in related fields.
The remaining sections of this article are arranged as follows: Section 2 introduces the model and data used in this paper. Section 3 analyzes the regional differences and the dynamic trend and efficiency decomposition of SLUE. Section 4 provides a discussion of the findings. Section 5 presents the research contributions and implications, and Section 6 presents the study’s conclusions and policy suggestions.
2. Methods and Data
2.1. Efficiency Assessment Model
2.1.1. The Global SBM-Undesirable Model
The DEA method, first proposed by Charnes et al. [37] in the United States, is a commonly used model for measuring efficiency. The advantage of DEA is that there is no requirement to set the specific form of function, and it can objectively evaluate the actual production process of multiple inputs and multiple outputs [38]. Traditional DEA models, such as the CCR (Charnes, Cooper, and Rhodes) [37] and the BCC (Banker, Charnes, and Cooper) [39], do not consider the input-output slack improvements in angle and radial selection, and they cannot accurately measure the efficiency with undesirable outputs. However, within the background of resource and environment constraints, SLUE evaluation should emphasize the coordination among the economy, resources, and the environment. In addition to the single economic benefit indicators, the DEA’s evaluation indicator system should also include ecological benefit indicators, such as the waste discharged in the land use process of a service industry, and other undesirable outputs. With regard to considering undesirable outputs, we hope to obtain as many desirable outputs as possible while minimizing the number of undesirable outputs.
Compared with the defects of the traditional DEA model, the undesirable output SBM model proposed by Tone [22] can not only solve the slack issue of variable in angle and radial selection, but also accurately measure the efficiency with undesirable output. This provides a new idea for the measurement of efficiency under environmental constraints [23]. In addition, due to the differences in production frontiers in different periods, the efficiency measured based on the best production frontiers in different periods does not have intertemporal comparability and circularity. The global DEA method proposed by Pastor and Lovell [40] effectively solves this problem by constructing frontiers of production technology based on global reference.
Taking provinces as decision making units (DMUs), we assume that there are DMUs. Each DMU uses inputs to produce desirable outputs and undesirable outputs . The global SBM-undesirable model is constructed as follows:
where . is the efficiency of the unit being evaluated and ; represents the input, desirable output and undesirable output in the DMU, respectively. Also, represents the slack variables of input, desirable output and undesirable output, respectively, and represents the weight.
2.1.2. Malmquist Productivity Index (MPI)
This research further constructs the DEA-Malmquist productivity model to investigate the efficiency evolution of land use in China’s service industry, based on a static analysis of the global SBM-undesirable model. The Malmquist index between two periods and can be formulated as follows:
where represents the output vector, and is the input vector; is the distance function, refers to the Malmquist productivity index. The is calculated as the relationships between the distances of DMUs from technological frontiers. Also, represents improvements in SLUE, and vice versa. In order to identify the different components that contribute to improvements in productivity, can be decomposed into efficiency change (EC) and technical change (TC) [41]. That is:
where the first term denotes the efficiency changes between the period and the period . This factor is called . Here, means that technical efficiency improves, and vice versa. The second term denotes the technology changes between two periods. This factor is called . In this case, means the technology has advanced, or otherwise degenerated. According to the CRS and VRS decomposition of the traditional Malmquist productivity index, we can further decompose efficiency change () into scale efficiency change () and pure technical efficiency change () [39]. That is: . Details are as follows:
The component evaluates the effect of the change in scale of DMUs on their productivity. The component measures whether the DMU under evaluation is closer to (or further away from) the frontiers of production technology. The component indicates whether the frontiers of production technology have shifted over time. If the value of any of the components is less than 1, it means regress; a value greater than 1 denotes progress, while a value of 1 implies a constant situation.
2.2. Regional Difference Analysis
This paper uses the Theil index to measure regional differences in SLUE. Then, the additivity of the Theil index is used to decompose the overall differences into intra-regional differences and inter-regional differences. The smaller the Theil index is, the smaller are the regional differences, and vice versa. Here, China is divided into east, central, west, and northeast regions. According to Theil [29], Bourguignon [42], Cowell [43] and Shorrocks [44], the Chinese SLUE Theil index construction and decomposition formulas are defined as follows:
where represents the overall Theil index, is the intra-regional Theil index, is the inter-regional Theil index, and . Suppose provinces are divided into groups; represents the number of provinces in the region ; represents the SLUE of province, and and represent the average value of SLUE in the region and the whole region, respectively. Next, is the overall Theil index in the region. In addition, the intra-regional contribution is the rate of the intra-regional and the overall Theil index. That is: ; the inter-regional contribution is the rate of inter-regional and overall Theil index. That is: .
2.3. Dataset and Variables
2.3.1. Dataset
The SLUE of 30 provinces in China, from 2011 to 2017, was evaluated. Tibet, Hong Kong, Macao, and Taiwan were excluded from the study sample due to a lack of data. According to the traditional area partition method, China can be divided into the eastern area, the central area, the western area, and the northeastern area [45]. Table 1 shows the division according to the classification method of the National Bureau of Statistics of China. Then, Figure 1 shows the visual distribution of the four regions in the research area. The data in this paper are from the China Urban Construction Statistical Yearbook, provincial statistical yearbooks, the National Bureau of Statistics, economic databases, and the Carbon Emission Accounts & Datasets (CEADs). Among them, CO2 data are directly from CEADs.
2.3.2. Input and Output Variables
Indicators should be selected to fully reflect the economic, social, and environmental aspects of urbanization [46]. Therefore, according to land use characteristics and existing research results [47], this article constructs a SLUE evaluation index system with three inputs and three outputs. Specifically, the input index must fully reflect the three factors of land, capital, and labor, while the output index starts from the three aspects of economic benefit, social benefit, and negative environmental effect.
The inputs include the area of built districts in the service industry, fixed capital stock in the service industry, and the number of people in employment in the service industry. Areas of built districts in a service industry include the following six types of land use: (1) commercial and business facilities; (2) logistics and warehouse; (3) road, street and transportation; (4) administration and public services; (5) municipal utilities; (6) green space and square. The fixed capital stock of a service industry is calculated by using the perpetual inventory method.
The outputs include value-added of tertiary industry, the average wage of employed persons, and the amount of CO2 emissions in the service industry. The value-added of tertiary industry reflects the direct economic performance of land use in the service sector. The average wage of employed persons reflects the social benefits obtained by the service industry in the process of urbanization. Considering the availability of data, the undesirable outputs mainly involve the CO2 emissions from the land use processes of the service industry. Table 2 shows the indicator system that has been constructed for this article to measure SLUE.
3. Results
3.1. Temporal and Spatial Pattern of Regional Differences in SLUE
According to the results shown in Table 3, from 2011 to 2017, the SLUE showed an upward trend in China, with a national average increase of 27.21%. Also, the SLUE of the four major regions showed different degrees of growth. However, the overall SLUE in China is still at a low level, at an average of 0.4258. The average SLUE values of the eastern, western, central, and northeastern regions are 0.5554, 0.4556, 0.2500, and 0.2357, respectively. Regardless of any year, the efficiency ratings in the eastern and western regions are much higher than those of the central and northeastern regions. This finding indicates that there is still a long way to go in terms of improving the SLUE in the central and northeastern regions. In terms of regional differences, obvious regional differences do exist, and only a few provinces have achieved high levels of efficiency. Among the 30 provinces, only seven had SLUE values above the national average level. Of those seven provinces, five are located in the eastern region, namely Shanghai, Beijing, Tianjin, Jiangsu, and Hainan. The other two provinces are located in the western region, namely Qinghai and Ningxia. The remaining 23 regions that do not exceed the national average level are mainly concentrated in nine western provinces, six central provinces, and five eastern provinces. In particular, the average efficiency ratings of provinces in the central and northeastern regions are lower than the national average. These results intuitively show that large differences exist in SLUE among China’s different regions. Moreover, one can clearly see that, whether looking at the four major regions or just within the eastern and western regions in Figure 2, the SLUE has obvious unbalanced distribution characteristics.
Furthermore, Figure 3 plots the dynamic density distribution variations of the SLUE index for the whole country and the four regions in 2011, 2014, and 2017. This is used to track the changes in SLUE over time. Nationally, SLUE values were mainly concentrated between 0.2 and 0.4. In addition, the density function curve has the characteristics of moving to the right, with the left peak falling and the right peak moving upward. This indicates that the average value of national SLUE trended upward from 2011 to 2017. At the same time, SLUE in the four regions showed a trend of improvement. There are also great development differences, both between regions and within regions. The analysis results are consistent with the above.
3.2. The “Beggar-Thy-Neighbor” Situation in the SLUE Regional Differences
According to the above analysis, SLUE in China has obvious characteristics of unbalanced regional development. In order to further explore the sources of this unbalance, the Theil index is used to measure the regional differences of SLUE in China, as shown in Figure 4. The results show that the overall regional differences in Chinese SLUE have narrowed; the intra-regional differences are the main source of the overall regional differences, and the intra-regional differences in the eastern and western regions have made an important contribution to the intra-regional differences.
First, as shown in Figure 4a, the SLUE’s Thiel index fell from 0.1627 in 2011 to 0.1601 in 2017, with regional differences rising in 2012 and then slowly declining. Second, with regard to the sources of regional differences, as shown in Figure 4b, the overall regional differences of SLUE in China mainly come from intra-regional differences, with the contribution rate remaining at between 65.00% and 78.00%. Both the overall regional differences and the intra-regional differences of SLUE show the same decreasing trend of fluctuation, while the inter-regional differences show an increasing trend. The contribution rate of intra-regional differences to the overall regional differences of SLUE is always greater than that of inter-regional differences. This result indicates that it is difficult for inter-regional differences to become the decisive force affecting the overall regional differences of SLUE in a short time. Therefore, narrowing the intra-regional differences is the main path to further realizing the coordinated development of regional SLUE. However, attention must still be paid to changes in inter-regional differences. Finally, the regional contribution of intra-regional differences is further analyzed through the decomposition of the sources of intra-regional differences. As shown in Figure 4c, the intra-regional differences are relatively large. The intra-regional differences in the eastern and central regions show an unstable state over time, while the intra-regional differences in the central and northeastern regions are relatively stable. In general, the eastern and western regions contribute the most to the intra-regional differences, while the central and northeastern regions contribute less to the intra-regional differences.
3.3. Dynamic Trend and Efficiency Decomposition of SLUE in China
The above analysis is only a static comparative study of SLUE. In order to further explore the trends and sources of SLUE changes in different periods in China, we calculated the MPI of land use in the service sector and its decomposition index to observe whether a positive catch-up effect of land use in the service sector exists in different provinces concerning technology and scale. The results are as shown in Table 4 and Figure 5.
Table 4 shows that the overall allocation of land use related resources in the service sector is reasonable, but it is unbalanced in terms of regional growth. Low-efficiency regions are shown to have a positive catch-up effect, while some high-efficiency regions fall into negative growth. From 2011 to 2017, the national SLUE growth rate trended upward, with an average annual growth rate of 2.70%. Except for the negative growth in the eastern region, the other three regions showed positive growth. Among them, northeastern China ranked first in growth, with an annual growth rate of 6.93%, followed by the central, western, and eastern regions, with annual growth rates of 5.60%, 3.39%, and −0.65%, respectively. Specifically, the SLUE of most provinces in China showed positive growth. Provinces with low efficiency, such as Hunan, Liaoning, and Hubei, are shown to have a positive catch-up effect. In addition, nine provinces also fell into negative growth; the average efficiency of four of the nine provinces, namely Beijing, Shanghai, Jiangsu, and Hainan, was greater than the national average. From the perspective of spatial distribution, six of the nine provinces are from the eastern region, showing that SLUE in the eastern region is in a state of weak growth. In short, China’s SLUE trended upward while remaining at a low level. At the same time, SLUE in China has experienced unbalanced regional development, showing an inverted growth law of “low in developed areas and high in backward areas”.
The structural composition of SLUE shows that, during the study period, all provinces had positive growth in technological progress, while most regions are in the double dilemma of pure technical efficiency and scale efficiency deterioration. With regard to technological progress, the average annual growth rate of China and the four main regions all maintained steady improvement. The growth rate of pure technical efficiency presents a trend of “low in the east and high in the west”. With the exception of the negative growth experienced in the eastern region, the other three regions had a positive growth trend. Every region faces the severe situation of weak growth of scale efficiency, and is deteriorating to different degrees. Among them, the northeastern region deteriorated the most. As can be observed in Beijing, Shanghai, Guangdong, Chongqing, and other developed regions where the service industry is widely concentrated, scale efficiency showed a downward trend. In addition, one can find that the fluctuation of scale efficiency is weak. One possible reason for this finding is policy stability.
4. Discussion
4.1. Spatio-Temporal Distribution of SLUE
In this study, the undesirable output SBM model was used to measure the SLUE of each province and the four major regions in China. As shown in Table 3 and Figure 2, SLUE in China presents unbalanced distribution characteristics. Most of the efficient provinces are located in the developed eastern regions and a few western regions. Among them, Shanghai, Beijing, Tianjin, Qinghai, and Ningxia are relatively stable in high-value regions. The allocation of capital, labor, and land in the service industry in these provinces is relatively reasonable. Therefore, the SLUE in these provinces has always been in the forefront of the region. Among them, due to the developed service industry, high level of industrial agglomeration, and dense population, the intensive degree of land for the service section in the eastern region is relatively high. It is worth noting that, although Qinghai and Ningxia are located in the western regions with relatively backward economic development, the SLUE of these regions is relatively high. The possible reasons for this finding are that although the speed of economic development in these regions is relatively slow, the land for service section is better able to meet the needs of economic development. Therefore, the development speed of the urban service industry is relatively synchronized with the region’s economic development speed. Most of the inefficient provinces are located in the central and northeastern regions, such as Liaoning, Hubei, and Henan, and the potential for the intensive use of land resources in the service sector needs to be further explored. The land supply of the service industry in these areas is sufficient, but the vitality of the stock land is not enough, and the incremental land use is decentralized, leading to the low SLUE. However, as one of the four major municipalities, Chongqing is relatively poor in terms of land use in the service sector. One reason is that Chongqing has a high proportion of secondary industry and lacks innovation power [48].
4.2. Regional Differences of SLUE
This paper uses the Theil index to further explore the regional differences in SLUE and their sources. As is shown in Figure 4, intra-regional differences are the main source of regional differences. The large intra-regional differences in SLUE lead to significant regional differences, which can be further explained from the “beggar-thy-neighbor” perspective of land use in the service sector. Similar to Gao et al. [49], we believe that advanced service regions or developed regions may siphon off superior resources in adjacent regions. Such actions intensify the vicious competition between adjoining regions, and lead to a decline of LUE in these regions. However, the vicious competition for service resources in adjacent areas will aggravate the differences between regions. Therefore, resolving the “beggar-thy-neighbor” problem of SLUE is the key to realizing the coordinated improvement of spatial utility. The “beggar-thy-neighbor” issue of SLUE refers to the fact that the performance of regional SLUE is often subject to the region’s adjacent central cities; the crowding out effect is also formed to transfer inferior resources to adjacent regions. For example, the IT service sector in India is concentrated in first-tier cities, such as Bangalore and New Delhi. The industry attracts superior resources to the metropolises and further aggravates resource differences [50]. In fact, the reverse situation can be explained by the siphon effect. The siphon effect refers to the ability of a city to attract superior resources from adjacent small cities [51], thereby crowding out inferior resources. The siphon effect results in the centralization of land for service section supply due to the regional aggregation capacity of urban resources. Meanwhile, the land for service section in the adjacent area tends to be relatively scattered and less intensive. That combination of factors leads to low LUE, thus exacerbating the imbalance of SLUE in the region.
4.3. Dynamic Trend of SLUE
The results of MPI and its decomposition index show the variation trend and source of SLUE. As is shown in Table 4 and Figure 5, it was found that the growth rate of pure technical efficiency shows a trend of “low in the east and high in the west”, and scale efficiency also belongs to the situation of weak group growth. As is well known, the eastern region is most developed in China, while the western region is relatively backward [52]. However, the pure technical efficiency and scale efficiency of land use in the service sector in the eastern region trended downward during the study period, while the pure technical efficiency in the western region increased slowly. This finding seems to be contrary to the level of economic development. This phenomenon is worth pondering. One reason for this finding may be that, as a large number of service factors are concentrated in the eastern region, the negative utility generated by the unreasonable management and utilization of land for the service section offsets the positive effect brought by high quality technical bases and factors. In recent years, with the transfer of many industries from eastern China to western China, the western region can promote economic growth and attract the inflow of high-end technologies by taking in these industries [53]. This same approach could also promote the improvement of SLUE.
In addition, the scale efficiency of land use in China’s service sector generally shows a downward trend. This article further analyzes this phenomenon from the perspective of the excessive agglomeration of the service industry. Some scholars [54] believe that the factor behind the decline of scale efficiency in the service industry is the insufficient agglomeration of factors. However, this view does not apply to developed regions, where the service industry is highly developed and agglomerated. For example, the high degree of agglomeration of the service industries in Beijing, Tokyo [55], and Silicon Valley [56] has produced adverse reactions. The high agglomeration of the service industry in developed regions is currently an issue that needs to be addressed. Excessive agglomeration of a service industry means that, with the acceleration of urbanization, the service industry is highly concentrated in several regions, and presents an efficiency loss mode of a high attrition rate, fast rotation rate, and short periodicity. Those conditions will make it difficult for the service industry to play the role of scale economy in the process of land use. The strong economic foundation of developed regions attracts a large-scale inflow of population and resources, and industries are more likely to show the characteristics of agglomeration development. However, the people flowing to these regions need the support of the service industry. Yet, due to rapid population growth, the service industry’s supply speed can easily lead to a situation of excessive growth under the pressure of enormous demand. This, in turn, results in a series of negative situations, such as the excessive agglomeration of the service industry. At present, Beijing, Shanghai, Guangdong, and other developed regions in China have fallen into the dilemma of scale efficiency deterioration. This conclusion can provide a warning for Silicon Valley in the United States, Tokyo in Japan, and other high-agglomeration regions of service industry in the world. For backward regions, the scale of service industry agglomeration is still not high. Owing to the resource endowment, rapid urbanization expansion, and the orientation of government policies, it is difficult to form a reasonable layout of factors and achieve the orderly development of the service industry in these regions. For example, in order to pursue urban expansion, Ethiopia transferred some farmland to urban commercial, residential, and other land use in the service sector. However, this type of land for the service section is not fully utilized [57,58]. Therefore, these regions have large growth space in scale efficiency.
In fact, the continuous reduction of scale efficiency may be related to the regional differentiated land supply policy. Land supply policies favoring the central and western regions lead to spatial misallocation of land resources [59], which hinders the improvement of scale efficiency. The same is true of SLUE. From 2011 to 2017, compared with the average value of the central and western regions, the average annual growth rate of land area of the service industry in the eastern region was nearly 0.5 times that of the central and western regions (China Urban Construction Statistics Yearbook). For backward areas, the rapid expansion of land for the service industry aggravates the situation of disordered and fragmented land use. Because this decentralized land use mode difficultly exerts the agglomeration effect on the service industry, the loss of scale efficiency is inevitable. Especially in areas with population outflow, such as northeast China, the redundancy of land for the service industry makes it difficult to form economies of scale in land use, leading to inefficient use of land for service industry. Moreover, the disordered land use will also result in an invalid matching between the supply of land resources and the production efficiency [59]. The aggravation of land resource mismatch will further lead to excess land supply or overcapacity [5], which will inhibit the improvement of SLUE. In fact, the large supply of land will also lead to the repeated construction of homogeneous industries [60], which will form a dependent path for inefficient land use in the service industry. For the eastern region, although there is a high degree of intensive land use for the service industry, the excessive agglomeration of the service industry hinders the scale effect due to insufficient land supply.
5. Research Implications and Research Contributions
5.1. Research Implications
The evaluation of SLUE in this paper has rich practical significance for the optimization of land management systems and related policies, the layout planning of the service industry, cross-regional coordination and interaction, and the equalization of services.
We thus examine the promotion of the optimization and improvement of land management systems and related policies. Through accurate evaluation of the SLUE in 30 provinces, this paper captures the real situation of the SLUE of each region, and discovers the unreasonable situation of the land resource distribution of the service industry in China. The above analysis provides valuable data reference for further improvement of the land management system and related policies. The improvement of land systems and related policies is conducive to reducing idle land waste, revitalizing the stock of land resources, and thus improving SLUE.
We also examine the promotion of the scientific layout of the service industry development plan. Based on the analysis of SLUE in 30 provinces, this paper further discusses the dynamic evolution trend and efficiency decomposition of SLUE in each region, and fully explores the regional characteristics of the service industry. The above analysis provides scientific reference for the government in the inter-regional and the intra-regional development norms of the service industry, and then puts forward targeted development planning suggestions for the service industry. Urban development in developed areas should formulate a set of long-term service industry layout plans. A pattern of multiple agglomeration regions should be formed instead of multiple scattered points. In this way, the development of the service industry can avoid falling into a situation of having too high a local agglomeration level. The inefficiency of service industry land caused by too many scattered points could also be avoided. The promotion of SLUE in backward areas should focus on solving the medium- and long-term spatial layout problem so as to form an intensive and efficient mode of service industry agglomeration. Moreover, the development quality of the service industry cannot be measured only by superficial indicators, such as the increase of the proportion of the service industry and the expansion of service industry scale. Finally, an effective plan will avoid the occurrence of low-level circular lock and the excessive agglomeration of the service industry.
We also examine the promotion of the establishment of services across the regional coordination and interaction mechanism. In this paper, the source of regional disparity in SLUE is deeply discussed, and the results show that the intra-regional disparity in SLUE is quite serious. The above analysis provides directional guidance and policy reference for the establishment of an institutional coordination mechanism for the service industry, and helps to ensure the effective implementation of a scientific development plan for the service industry. At the same time, this paper puts forward some practical suggestions for the establishment of cross-regional coordination and interaction mechanism within the service industry. In the process of service industry development, the layout of the regional industrial structure should be optimized, and the integrated development between regions should be strengthened according to regional resource endowments and geographical location. Through the industrial division of labor and cooperation, the complementary and dislocation linkage development of interregional industries can be promoted. Also, inferior repeated construction and homogeneous competition of service industries must be avoided so as to weaken the negative impact of the siphon effect and to improve SLUE.
We also examine the promotion of the service industry development policy of “balance”. To realize the sustainable improvement of SLUE, it is necessary to actively cultivate labor force with advanced technology and management experience. Taking into account the differences between developed and backward regions, a “balanced” development policy needs to be fully considered. For example, a relative equalization of urban capital and technology support policies will further encourage the transfer and agglomeration of superior production factor resources, such as knowledge, technology, and innovation, to relatively backward regions [61]. This would be conducive to the intensive development of land use in the service industry, and would thus narrow the regional differences in SLUE.
We also examine the promotion of the service industry growth pole to nurture and develop competitive advantage. This paper focuses on the low-efficiency areas of land use in the service sector, compares and analyzes the high-efficiency areas, and seeks the catch-up path for the low-efficiency areas according to their own factors. Low-efficiency regions need to focus on building their own service industry levels and characteristics, attracting and retaining more and superior production factors with their own advantages, and accelerating the agglomeration of production factors. By constantly absorbing the superior resources of adjacent high-efficiency regions, they can catch up with those high-efficiency regions and form the advantage of backwardness.
5.2. Research Contributions
This study is an early literature on the land use efficiency gap in the service industry. The imbalance of regional development in China provides a good model for the study of the spatial land use efficiency gap in the service industry. We innovatively evaluate the SLUE of 30 provinces and four regions in China, which makes for a very rich sample. In addition, we have adopted a good measurement method, combining the SBM model of undesirable output with the Malmquist productivity index. This combined method can better overcome the incomplete problem of index construction and the research of spatial-temporal dimensions.
This article provides some valuable implications for the SLUE improvement problem, particularly given the increasing shortage of industrial land all around the world. First, developed countries and regions should pay more attention to the low efficiency of land use caused by the excessive agglomeration of service industries. Meanwhile, developing countries and regions should focus more on the transformation of technology application and the spatial optimization of service industry layout so as to avoid some unnecessary efficiency loss. Second, for the coordinated improvement of SLUE, countries need to pay attention to the “beggar-thy-neighbor” problem caused by the large differences within a region. These practical contributions will provide important enlightenments for a new pattern of service industry development in the future.
6. Conclusions and Limitations
This article evaluates the SLUE of 30 provinces from 2011 to 2017 in China using the SBM model of undesirable output and the Malmquist productivity index. Then, the regional differences are further investigated, and suggestions are made for the regional collaborative improvement of SLUE. The main conclusions are as follows: (1) The SLUE in China presents obvious unbalanced distribution characteristics; the SLUE in the eastern and western region is also much higher than that in the central and northeastern regions. Further analysis shows that obvious regional differences exist in Chinese SLUE, and the intra-regional differences are the main source of overall regional differences. (2) From 2011 to 2017, China’s SLUE generally achieved positive growth, with an average annual growth rate of 2.70%. The SLUE of the four regions shows an inverted growth law of “low in developed areas and high in backward areas”. (3) The SLUE is decomposed into technological progress, pure technical efficiency, and scale efficiency. From the decomposition results, technological progress is shown to have maintained steady improvement. The growth rate of pure technical efficiency presents a trend of “low in the east and high in the west”, while the scale efficiency shows a downward trend in the four regions. (4) Finally, the study discusses the path of SLUE, with a view to achieving collaborative improvement. The coordinated improvement of SLUE needs to focus on resolving the issues in large differences within regions and also on reduced scale efficiency.
However, some research limitations remain. First, evaluating SLUE at the provincial level is relatively macro. Future studies could add some micro-evidence at the enterprise level. In particular, what kind of internal structure exists in the loss of land use efficiency within service enterprises? This question should be thoroughly investigated and answered. Second, this study only calculates the LUE of the overall service industry during the period from 2011 to 2017. Future studies could be expanded to sub-sectors of the service industry, as well as a longer time horizon. In addition, as the trend of industrial integration intensifies, the interaction between service and manufacturing industries will become increasingly stronger. There will be some linkage laws between SLUE and the efficiency of manufacturing land, which is another research direction for the future.
Author Contributions
Conceptualization, M.Z. and Y.S.; methodology, M.Z. and Z.L.; software, M.Z. and H.L.; validation, M.Z. and H.L.; investigation, M.Z.; resources, M.Z.; writing—original draft preparation, M.Z.; funding acquisition, M.Z.; formal analysis, H.L. and C.C.; writing—review and editing, Y.S. and Z.L.; supervision, Y.S. and Z.L.; data curation, X.Z.; visualization, Z.L. All authors have read and agreed to the published version of the manuscript.
Funding
This research was funded by the “Study on the evolution mechanism and optimization strategy of population distribution structure under the “flow space” effect of high-speed rail network” (Grant No. ZR2022QG005); “Effect of high-speed rail network on urban population distribution pattern in Shandong province” (Grant No. 20DRKJ02); “Theoretical and economic research-oriented innovation team” of the youth innovation talent introduction and education plan of colleges and universities in Shandong Province (Grant No. 201901); Taishan Scholars Program (Grant No. tsqn201909135); “Employment polarization effect of low-carbon development constraint from the perspective of unequal opportunities” (Grant No. ZR2020QG040).
Data Availability Statement
The land input data were obtained from the China Urban Construction Statistical Yearbook. The data of capital input, workforce input, and desirable output were from the National Bureau of Statistics, provincial statistical yearbooks, and economic databases. Undesirable output data came from the China Carbon Emission Accounts & Datasets (CEADs).
Acknowledgments
The author thanks the support of the “Theoretical Economics Research Innovation Team” of Shandong Provincial University Youth Innovation Talent Introduction and Education Plan, the Shandong Digital Yellow River Industrial Chain System Construction Innovation Team of Youth Innovation Team of Shandong Colleges and Universities.
Conflicts of Interest
The authors declare no conflict of interest.
References
- Jiang, X.; Lu, X.H.; Liu, Q.; Chang, C.; Qu, L.L. The effects of land transfer marketization on the urban land use efficiency: An empirical study based on 285 cities in China. Ecol. Indic. 2021, 132, 108296. [Google Scholar] [CrossRef]
- Li, H.J.; Qu, J.S.; Wang, D.; Meng, P.; Lu, C.Y.; Zeng, J.J. Spatial-temporal integrated measurement of the efficiency of urban land use in Yellow River Basin. Sustainability 2021, 13, 8902. [Google Scholar] [CrossRef]
- Ge, X.J.; Liu, X.X. Urban land use efficiency under resource-based economic transformation—A case study of Shanxi Province. Land 2021, 10, 850. [Google Scholar] [CrossRef]
- Muhammad, S.; Pan, Y.C.; Agha, M.H.; Umar, M.; Chen, S.Y. Industrial structure, energy intensity and environmental efficiency across developed and developing economies: The intermediary role of primary, secondary and tertiary industry. Energy 2022, 247, 123576. [Google Scholar] [CrossRef]
- Zhou, D.; Huang, Q.; Chong, Z.H. Analysis on the effect and mechanism of land misallocation on carbon emissions efficiency: Evidence from China. Land Use Policy 2022, 121, 106336. [Google Scholar] [CrossRef]
- Song, X.Q.; Feng, Q.; Xia, F.Z.; Li, X.Y.; Scheffran, J. Impacts of changing urban land-use structure on sustainable city growth in China: A population-density dynamics perspective. Habitat Int. 2021, 107, 102296. [Google Scholar] [CrossRef]
- Huang, Y.C.; Yang, B.G.; Wang, M.; Liu, B.W.; Yang, X.D. Analysis of the future land cover change in Beijing using CA-Markov chain model. Environ. Earth Sci. 2020, 79, 60. [Google Scholar] [CrossRef]
- Shi, L.; Halik, U.; Mamat, Z.; Aishan, T.; Abliz, A.; Welp, M. Spatiotemporal investigation of the interactive coercing relationship between urbanization and ecosystem services in arid northwestern China. Land Degrad. Dev. 2021, 32, 4105–4120. [Google Scholar] [CrossRef]
- Li, Y.; Ye, H.P.; Gao, X.; Sun, D.Q.; Li, Z.H.; Zhang, N.H.; Leng, X.J.; Meng, D.; Zheng, J. Spatiotemporal patterns of urbanization in the three most developed urban agglomerations in China based on continuous nighttime light data (2000–2018). Remote Sens. 2021, 13, 2245. [Google Scholar] [CrossRef]
- Lin, G.C.S. Toward a post-Socialist city? Economic tertiarization and urban reformation in the Guangzhou Metropolis, China. Eurasian Geogr. Econ. 2004, 45, 18–44. [Google Scholar] [CrossRef]
- Chen, J.L.; Gao, J.L.; Chen, W. Urban land expansion and the transitional mechanisms in Nanjing, China. Habitat Int. 2016, 53, 274–283. [Google Scholar] [CrossRef]
- Yang, L.; Han, B.Y.; Ma, Z.L.; Wang, T.; Lin, Y.C. Analysis of the urban land use efficiency in the new-type urbanization process of China’s Yangtze River Economic Belt. Int. J. Environ. Res. Public Health 2022, 19, 8183. [Google Scholar] [CrossRef] [PubMed]
- Kang, R.; Feng, C. Developing service industry to solve environment conflict: A case of Yuyang district, China. Procedia–Soc. Behav. Sci. 2016, 220, 159–165. [Google Scholar] [CrossRef] [Green Version]
- Bai, Y.; Zhou, W.; Guan, Y.J.; Li, X.; Huang, B.H.; Lei, F.C.; Yang, H.; Huo, W.M. Evolution of policy concerning the readjustment of inefficient urban land use in China based on a content analysis method. Sustainability 2020, 12, 797. [Google Scholar] [CrossRef] [Green Version]
- Dong, G.L.; Ge, Y.B.; Jia, H.W.; Sun, C.Z.; Pan, S.Y. Land use multi-suitability, land resource scarcity and diversity of human needs: A new framework for land use conflict identification. Land 2021, 10, 1003. [Google Scholar] [CrossRef]
- Xu, W.Y.; Jin, X.B.; Liu, J.; Zhou, Y.K. Analysis of influencing factors of cultivated land fragmentation based on hierarchical linear model: A case study of Jiangsu Province, China. Land Use Policy 2021, 101, 105119. [Google Scholar] [CrossRef]
- Cui, X.F.; Huang, S.S.; Liu, C.C.; Zhou, T.T.; Shan, L.; Zhang, F.Y.; Chen, M.; Li, F.; De Vries, W.T. Applying SBM-GPA model to explore urban land use efficiency considering ecological development in China. Land 2021, 10, 912. [Google Scholar] [CrossRef]
- Kottas, A.T.; Bozoudis, M.N.; Madas, M.A. Turbofan aero-engine efficiency evaluation: An integrated approach using VSBM two-stage network DEA. Omega 2020, 92, 102167. [Google Scholar] [CrossRef]
- Wang, A.P.; Lin, W.F.; Liu, B.; Wang, H.; Xu, H. Does smart city construction improve the green utilization efficiency of urban land? Land 2021, 10, 657. [Google Scholar] [CrossRef]
- Fu, Y.H.; Zhou, T.T.; Yao, Y.Y.; Qiu, A.G.; Wei, F.Q.; Liu, J.Q.; Liu, T. Evaluating efficiency and order of urban land use structure: An empirical study of cities in Jiangsu, China. J. Clean. Prod. 2021, 283, 124638. [Google Scholar] [CrossRef]
- Wang, R.Z.; Hao, J.; Wang, C.N.; Tang, X.; Yuan, X.Z. Embodied CO2 Emissions and Efficiency of the Service Sector: Evidence from China. J. Clean. Prod. 2020, 247, 119116. [Google Scholar] [CrossRef]
- Tone, K. Dealing with undesirable outputs in DEA: A slacks-based measure (SBM) approach. In Proceedings of the North American Productivity Workshop, Toronto, ON, Canada, 23–25 June 2004; pp. 44–45. [Google Scholar]
- Tang, Y.K.; Wang, K.; Ji, X.M.; Xu, H.; Xiao, Y.Q. Assessment and spatial-temporal evolution analysis of urban land use efficiency under green development orientation: Case of the Yangtze River Delta urban agglomerations. Land 2021, 10, 715. [Google Scholar] [CrossRef]
- Färe, R.; Grosskopf, S.; Norris, M.; Zhang, Z. Productivity growth, technical progress, and efficiency change in industrialized countries. Am. Econ. Rev. 1994, 84, 66–83. [Google Scholar]
- Xue, D.; Yue, L.; Ahmad, F.; Draz, M.U.; Chandio, A.A.; Ahmad, M.; Amin, W. Empirical investigation of urban land use efficiency and influencing factors of the Yellow River basin Chinese cities. Land Use Policy 2022, 117, 106117. [Google Scholar] [CrossRef]
- Duro, J.A.; Lauk, C.; Kastner, T.; Erb, K.; Haberl, H. Global inequalities in food consumption, cropland demand and land-use efficiency: A decomposition analysis. Glob. Environ. Change 2020, 64, 102124. [Google Scholar] [CrossRef]
- Lu, X.H.; Kuang, B.; Li, J. Regional difference decomposition and policy implications of China’s urban land use efficiency under the environmental restriction. Habitat Int. 2018, 77, 32–39. [Google Scholar] [CrossRef]
- Cao, X.; Liu, Y.; Li, T.; Liao, W. Analysis of spatial pattern evolution and influencing factors of regional land use efficiency in China based on ESDA-GWR. Sci. Rep. 2019, 9, 520. [Google Scholar] [CrossRef] [Green Version]
- Theil, H. Economics and Information Theory; North-Holland Publishing Company: Amsterdam, The Netherlands, 1967. [Google Scholar]
- Ge, K.; Zou, S.; Chen, D.L.; Lu, X.H.; Ke, S.A. Research on the spatial differences and convergence mechanism of urban land use efficiency under the background of regional integration: A case study of the Yangtze River Economic Zone, China. Land 2021, 10, 1100. [Google Scholar] [CrossRef]
- Chen, Z.H.; Zhang, Q.X.; Li, F.; Shi, J.L. Comprehensive evaluation of land use benefit in the Yellow River Basin from 1995 to 2018. Land 2021, 10, 643. [Google Scholar] [CrossRef]
- Pang, Y.Y.; Wang, X.J. Land-use efficiency in Shandong (China): Empirical analysis based on a super-SBM model. Sustainability 2020, 12, 10618. [Google Scholar] [CrossRef]
- Yao, M.C.; Zhang, Y.H. Evaluation and optimization of urban land-use efficiency: A case study in Sichuan Province of China. Sustainability 2021, 13, 1771. [Google Scholar] [CrossRef]
- Gao, J.X.; Song, J.B.; Wu, L.F. A new methodology to measure the urban construction land-use efficiency based on the two-stage DEA model. Land Use Policy 2022, 112, 105799. [Google Scholar] [CrossRef]
- Jiang, H.L. Spatial-temporal differences of industrial land use efficiency and its influencing factors for China’s central region: Analyzed by SBM model. Environ. Technol. Innov. 2021, 22, 101489. [Google Scholar] [CrossRef]
- Souza, G.D.E.; Gomes, E.G.; Alves, E.R.D.; Gasques, J.G. Technological progress in the Brazilian agriculture. Socio-Econ. Plan. Sci. 2020, 72, 100879. [Google Scholar] [CrossRef]
- Charnes, A.; Cooper, W.W.; Rhodes, E. Measuring the efficiency of decision making units. Eur. J. Oper. Res. 1978, 2, 429–444. [Google Scholar] [CrossRef]
- Cooper, W.W.; Seiford, L.M.; Tone, K. Data Envelopment Analysis: A Comprehensive Text with Models, Applications, References and DEA-Solver Software; Kluwer Academic Publishers: New York, NY, USA, 2007. [Google Scholar]
- Banker, R.D.; Charnes, A.; Cooper, W.W. Some models for estimating technical and scale inefficiencies in data envelopment analysis. Manag. Sci. 1984, 30, 1078–1092. [Google Scholar] [CrossRef] [Green Version]
- Pastor, J.T.; Lovell, C.A.K. A global Malmquist productivity index. Econ. Lett. 2005, 88, 266–271. [Google Scholar] [CrossRef]
- Fare, R.; Grosskopf, S. Malmquist productivity indexes and fisher ideal indexes. Econ. J. 1992, 102, 158–160. [Google Scholar] [CrossRef]
- Bourguignon, F. Decomposable income inequality measures. Econometrica 1979, 47, 901–920. [Google Scholar] [CrossRef] [Green Version]
- Cowell, F.A. On the structure of additive inequality measures. Rev. Econ. Stud. 1980, 47, 521–531. [Google Scholar] [CrossRef]
- Shorrocks, A.F. The class of additively decomposable inequality measures. Econometrica 1980, 48, 613–625. [Google Scholar] [CrossRef]
- Lin, S.F.; Lin, R.Y.; Sun, J.; Wang, F.; Wu, W.X. Dynamically evaluating technological innovation efficiency of high-tech industry in China: Provincial, regional and industrial perspective. Socio-Econ. Plan. Sci. 2021, 74, 100939. [Google Scholar] [CrossRef]
- Wey, W.; Hsu, J. New urbanism and smart growth: Toward achieving a smart National Taipei University District. Habitat Int. 2014, 42, 164–174. [Google Scholar] [CrossRef]
- Zhou, Y.; Chen, Y.; Hu, Y. Assessing efficiency of urban land utilisation under environmental constraints in Yangtze River Delta, China. Int. J. Environ. Res. Public Health 2021, 18, 12634. [Google Scholar] [CrossRef] [PubMed]
- Yu, J.Q.; Zhou, K.L.; Yang, S.L. Land use efficiency and influencing factors of urban agglomerations in China. Land Use Policy 2019, 88, 104143. [Google Scholar] [CrossRef]
- Gao, X.; Zhang, A.L.; Sun, Z.L. How regional economic integration influence on urban land use efficiency? A case study of Wuhan metropolitan area, China. Land Use Policy 2020, 90, 104329. [Google Scholar] [CrossRef]
- Rao, P.M.; Balasubrahmanya, M.H. The rise of IT services clusters in India: A case of growth by replication. Telecommun. Policy 2017, 41, 90–105. [Google Scholar] [CrossRef] [Green Version]
- Zhao, Q.Y.; Xu, H.; Wall, R.S.; Stavropoulos, S. Building a bridge between port and city: Improving the urban competitiveness of port cities. J. Transp. Geogr. 2017, 59, 120–133. [Google Scholar] [CrossRef]
- Gai, M.; Wang, X.Q.; Qi, C.L. Spatiotemporal evolution and influencing factors of ecological civilization construction in China. Complexity 2020, 14, 8829144. [Google Scholar] [CrossRef]
- Chen, W.; Shen, Y.; Wang, Y.A.; Wu, Q. The effect of industrial relocation on industrial land use efficiency in China: A spatial econometrics approach. J. Clean. Prod. 2018, 205, 525–535. [Google Scholar] [CrossRef]
- Hu, Y.H.; Wang, M.M. Impact of resource reconfiguration on total factor productivity of service industry. Int. J. Electr. Eng. Educ. 2020. [Google Scholar] [CrossRef]
- Zheng, X.P. Determinants of agglomeration economies and diseconomies: Empirical evidence from Tokyo. Socio-Econ. Plan. Sci. 2001, 35, 131–144. [Google Scholar] [CrossRef]
- Kemeny, T.; Osman, T. The wider impacts of high-technology employment: Evidence from US cities. Res. Policy 2018, 47, 1729–1740. [Google Scholar] [CrossRef]
- Dadi, D.; Azadi, H.; Senbeta, F.; Abebe, K.; Taheri, F.; Stellmacher, T. Urban sprawl and its impacts on land use change in Central Ethiopia. Urban For. Urban Green. 2016, 16, 132–141. [Google Scholar] [CrossRef]
- Koroso, N.H.; Zevenbergen, J.A.; Lengoiboni, M. Urban land use efficiency in Ethiopia: An assessment of urban land use sustainability in Addis Ababa. Land Use Policy 2020, 99, 105081. [Google Scholar] [CrossRef]
- Yang, L.L.; Wang, J.; Feng, Y.H.; Wu, Q. The impact of the regional differentiation of land supply on Total Factor Productivity in China: From the perspective of Total Factor Productivity decomposition. Land 2022, 11, 1859. [Google Scholar] [CrossRef]
- Peng, S.; Wang, J.; Sun, H.; Guo, Z. How does the spatial misallocation of land resources affect urban industrial transformation and upgrading? evidence from China. Land 2022, 11, 1630. [Google Scholar] [CrossRef]
- Zhang, Y.H.; Chen, J.L.; Gao, J.L.; Jiang, W.X. The impact mechanism of urban land use efficiency in the Yangtze River Delta from the perspective of economic transition. J. Nat. Resour. 2019, 34, 1157–1170. [Google Scholar] [CrossRef]
Figure 1.
Visual distribution map of four regions in China.

Figure 2.
Spatial and temporal distribution and evolution trend of SLUE in China.
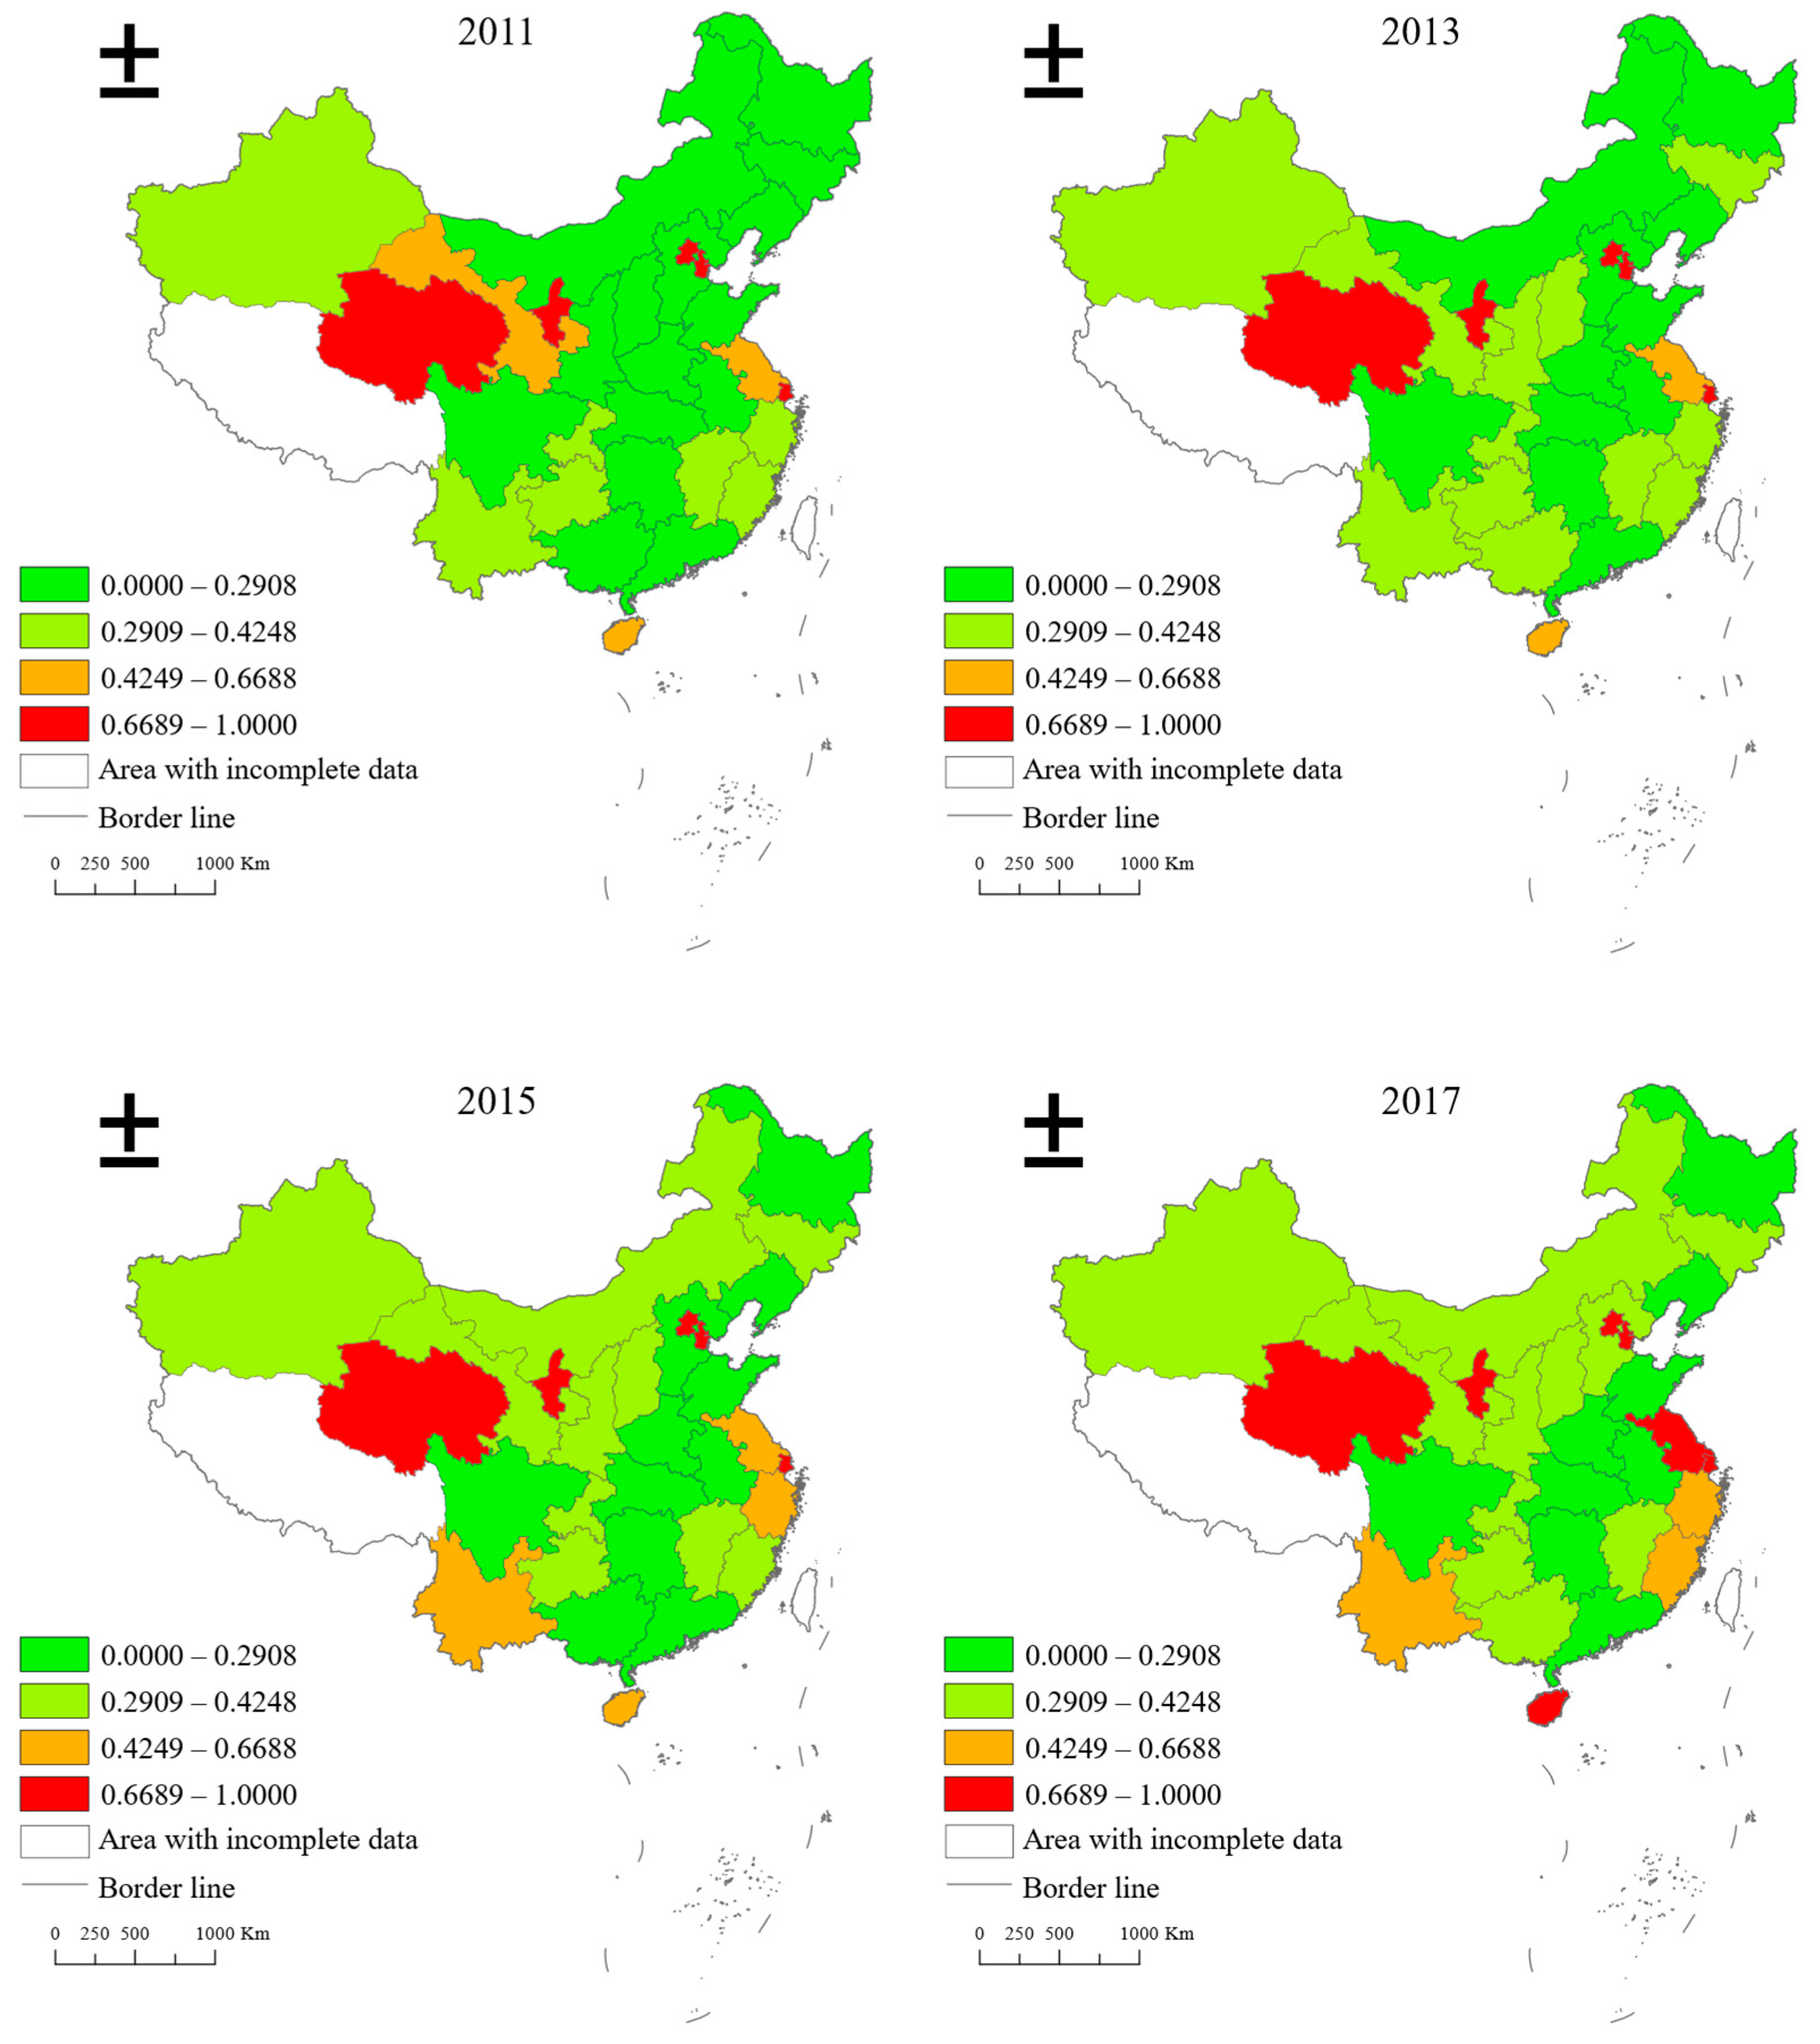
Figure 3.
Distribution of SLUE density by region.
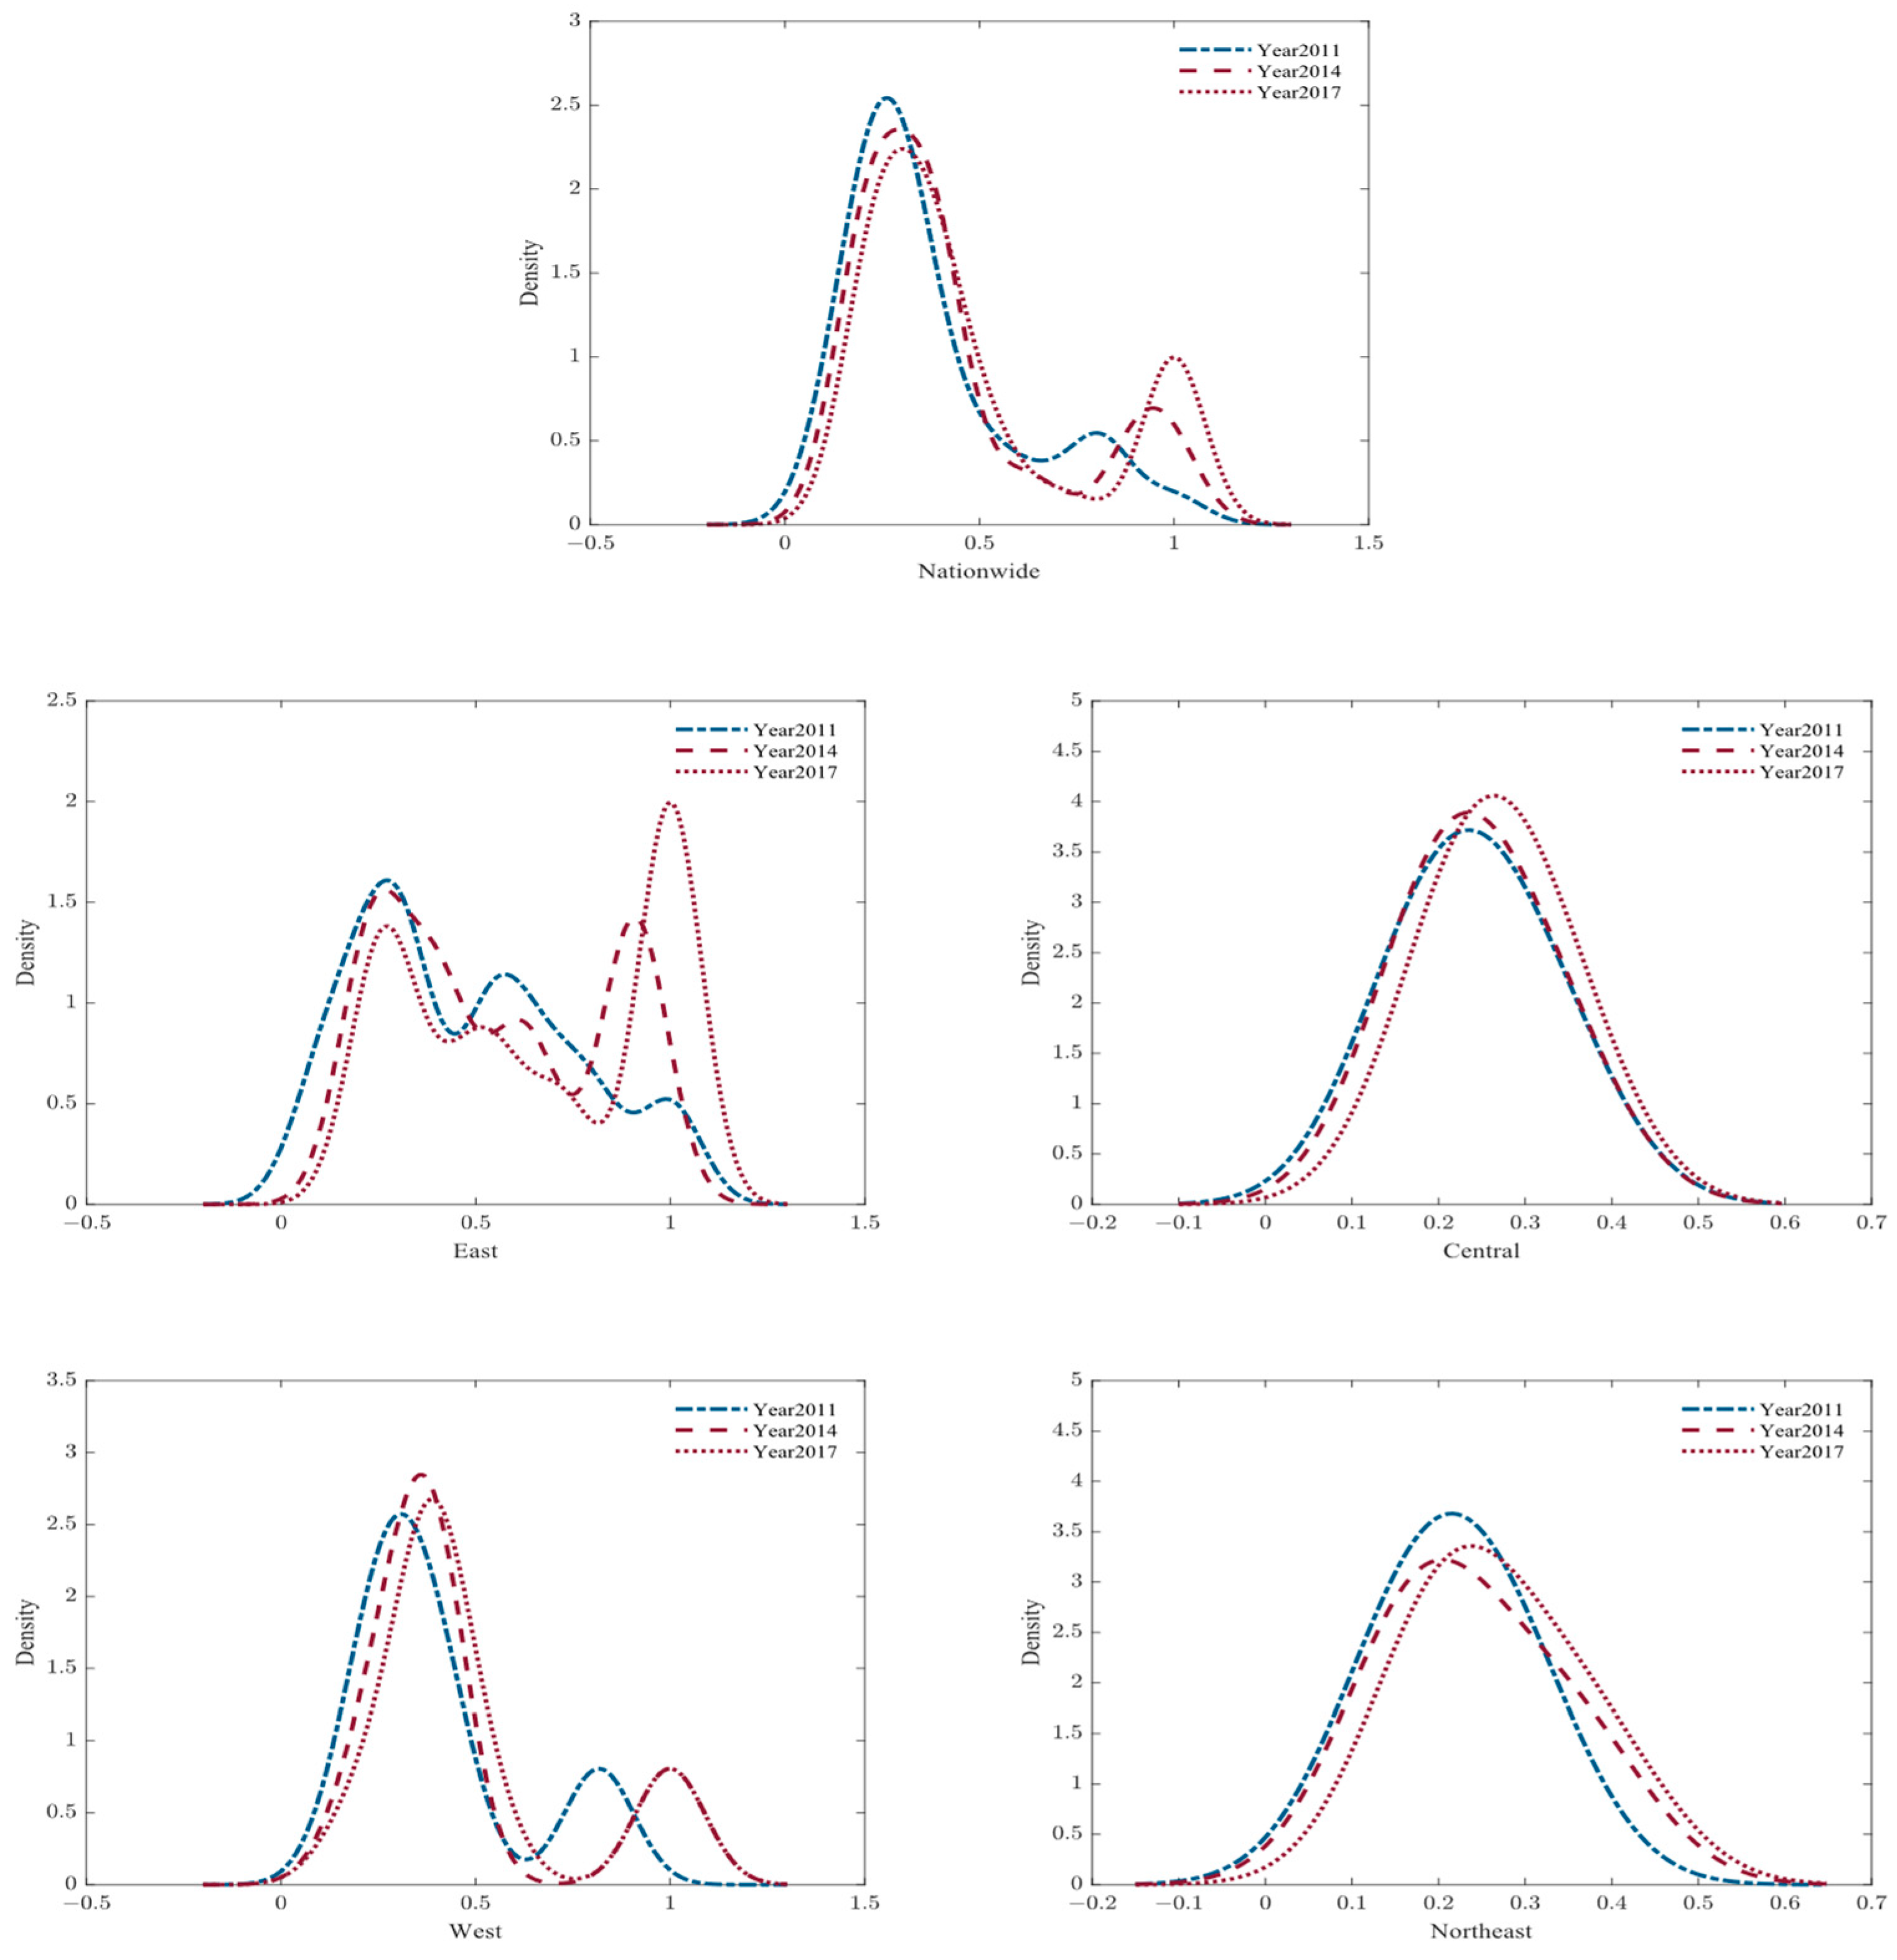
Figure 4.
Spatial differences and contribution rates in SLUE in China. (a) Variation trend in the Theil index in China; (b) Contribution rates of and ; (c) Contribution rates of regional differences.
Figure 4.
Spatial differences and contribution rates in SLUE in China. (a) Variation trend in the Theil index in China; (b) Contribution rates of and ; (c) Contribution rates of regional differences.
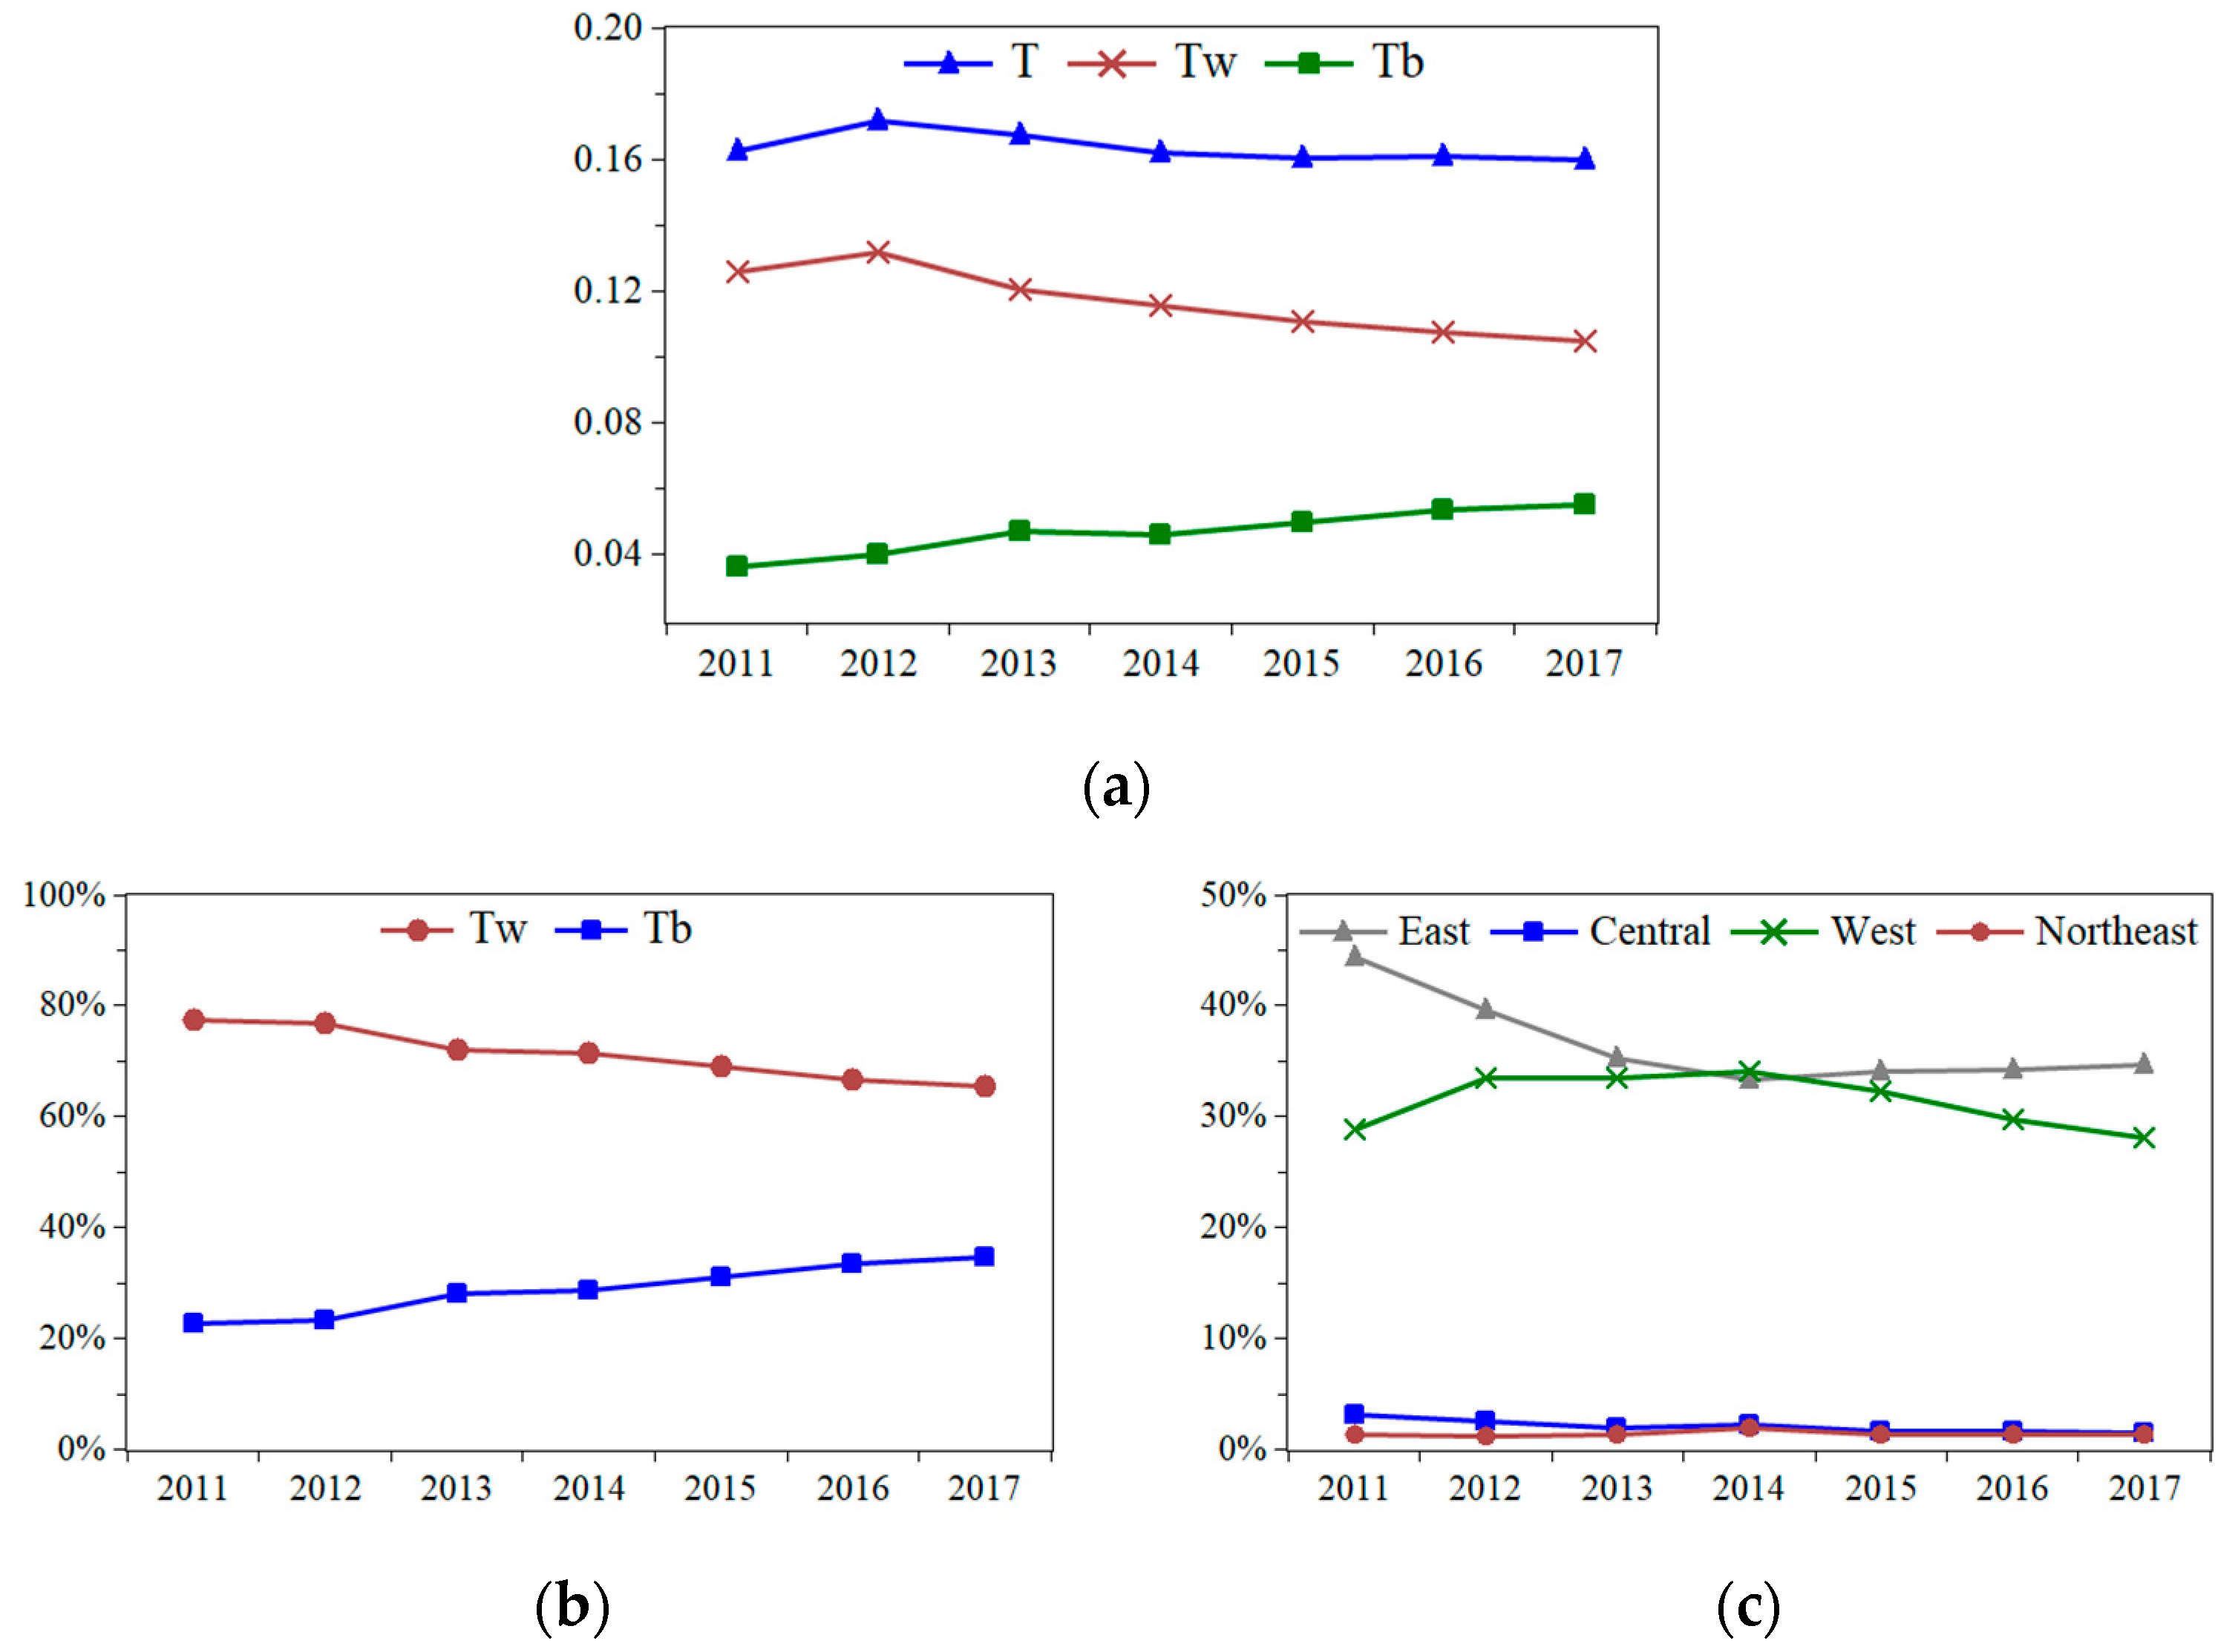
Figure 5.
Drivers of SLUE growth by region.


Table 1.
Regional division in China.
| Region | Provinces, Municipalities, and Autonomous Regions |
|---|---|
| Eastern | Beijing, Tianjin, Shanghai, Hebei, Shandong, Jiangsu, Zhejiang, Fujian, Guangdong, Hainan |
| Central | Henan, Shanxi, Anhui, Hubei, Hunan, Jiangxi |
| Western | Gansu, Guizhou, Ningxia, Qinghai, Shaanxi, Yunnan, Xinjiang, Sichuan, Chongqing, Inner Mongolia, Guangxi, Tibet |
| Northeastern | Liaoning, Heilongjiang, Jilin |
Table 2.
Indicator system for evaluating SLUE.
| Category | Indicator | Specific Indicator | Unit |
|---|---|---|---|
| Inputs | Land input | Area of built districts | Square kilometers |
| Capital input | Fixed capital stock | 100 million yuan | |
| Workforce input | Employment | 10 thousand persons | |
| Desirable outputs | Economic output | Value-added of tertiary industry | 100 million yuan |
| Social output | Average wage of employed persons | Yuan | |
| Undesirable outputs | Environmental output | CO2 emissions | Million tons |
Table 3.
SLUE in 30 Chinese provinces from 2011 to 2017.
| Region | Province | 2011 | 2012 | 2013 | 2014 | 2015 | 2016 | 2017 | Average |
|---|---|---|---|---|---|---|---|---|---|
| Eastern | Shanghai | 1.0000 | 1.0000 | 1.0000 | 0.9441 | 1.0000 | 1.0000 | 1.0000 | 0.9920 |
| Beijing | 0.7977 | 0.8166 | 0.8633 | 0.8823 | 0.9216 | 0.9428 | 1.0000 | 0.8892 | |
| Tianjin | 0.6708 | 0.7204 | 0.8884 | 0.9019 | 0.9176 | 0.9413 | 1.0000 | 0.8629 | |
| Jiangsu | 0.5164 | 0.5213 | 0.5616 | 0.5788 | 0.6548 | 0.8484 | 1.0000 | 0.6688 | |
| Hainan | 0.5722 | 0.6034 | 0.6049 | 0.6586 | 0.5871 | 0.6829 | 0.7244 | 0.6334 | |
| Zhejiang | 0.3381 | 0.3524 | 0.3768 | 0.4013 | 0.4328 | 0.4892 | 0.5666 | 0.4224 | |
| Fujian | 0.3142 | 0.3397 | 0.3947 | 0.4081 | 0.4229 | 0.4481 | 0.4717 | 0.3999 | |
| Guangdong | 0.2476 | 0.2592 | 0.2759 | 0.2653 | 0.2512 | 0.2456 | 0.2589 | 0.2577 | |
| Hebei | 0.1907 | 0.2071 | 0.2221 | 0.2520 | 0.2731 | 0.2722 | 0.3168 | 0.2477 | |
| Shandong | 0.0941 | 0.0964 | 0.1843 | 0.1987 | 0.2164 | 0.2368 | 0.2320 | 0.1798 | |
| Average | 0.4742 | 0.4916 | 0.5372 | 0.5491 | 0.5678 | 0.6107 | 0.6570 | 0.5554 | |
| Central | Jiangxi | 0.3546 | 0.3602 | 0.3378 | 0.3492 | 0.3354 | 0.3565 | 0.3617 | 0.3508 |
| Shanxi | 0.2765 | 0.2811 | 0.2925 | 0.2992 | 0.2926 | 0.2878 | 0.3060 | 0.2908 | |
| Anhui | 0.2704 | 0.2355 | 0.2344 | 0.2366 | 0.2455 | 0.2617 | 0.2709 | 0.2507 | |
| Hunan | 0.2126 | 0.2494 | 0.2244 | 0.2295 | 0.2338 | 0.2451 | 0.2609 | 0.2365 | |
| Henan | 0.1905 | 0.1907 | 0.1789 | 0.1836 | 0.1836 | 0.1978 | 0.2153 | 0.1915 | |
| Hubei | 0.1471 | 0.1570 | 0.1812 | 0.1795 | 0.1996 | 0.1940 | 0.1983 | 0.1795 | |
| Average | 0.2419 | 0.2457 | 0.2415 | 0.2463 | 0.2484 | 0.2572 | 0.2688 | 0.2500 | |
| Western | Qinghai | 0.8159 | 1.0000 | 1.0000 | 1.0000 | 1.0000 | 1.0000 | 1.0000 | 0.9737 |
| Ningxia | 0.8185 | 0.8933 | 1.0000 | 1.0000 | 0.9929 | 0.9795 | 1.0000 | 0.9549 | |
| Gansu | 0.4457 | 0.4560 | 0.4119 | 0.4087 | 0.4154 | 0.4167 | 0.4191 | 0.4248 | |
| Yunnan | 0.3239 | 0.3370 | 0.3999 | 0.4051 | 0.4514 | 0.4812 | 0.5343 | 0.4190 | |
| Xinjiang | 0.4196 | 0.4246 | 0.3918 | 0.3877 | 0.3658 | 0.3555 | 0.3473 | 0.3846 | |
| Chongqing | 0.3324 | 0.3426 | 0.3540 | 0.3970 | 0.3893 | 0.4047 | 0.4218 | 0.3774 | |
| Guizhou | 0.3557 | 0.3628 | 0.3582 | 0.3644 | 0.3639 | 0.3636 | 0.3643 | 0.3619 | |
| Shaanxi | 0.2556 | 0.3156 | 0.3641 | 0.3502 | 0.3482 | 0.3881 | 0.3974 | 0.3456 | |
| Inner Mongolia | 0.2722 | 0.2866 | 0.2866 | 0.2716 | 0.3035 | 0.3541 | 0.4128 | 0.3125 | |
| Guangxi | 0.2341 | 0.2327 | 0.2971 | 0.2789 | 0.2840 | 0.2897 | 0.2966 | 0.2733 | |
| Sichuan | 0.1704 | 0.1790 | 0.1782 | 0.1904 | 0.2025 | 0.1826 | 0.1856 | 0.1841 | |
| Average | 0.4040 | 0.4391 | 0.4584 | 0.4594 | 0.4652 | 0.4741 | 0.4890 | 0.4556 | |
| Northeastern | Jilin | 0.2874 | 0.2974 | 0.3220 | 0.3523 | 0.3262 | 0.3398 | 0.3699 | 0.3279 |
| Heilongjiang | 0.2131 | 0.1995 | 0.1987 | 0.1998 | 0.1980 | 0.2003 | 0.2184 | 0.2040 | |
| Liaoning | 0.1496 | 0.1544 | 0.1712 | 0.1682 | 0.1825 | 0.1917 | 0.2104 | 0.1754 | |
| Average | 0.2167 | 0.2171 | 0.2306 | 0.2401 | 0.2356 | 0.2439 | 0.2662 | 0.2357 | |
| Nationwide | Average | 0.3763 | 0.3957 | 0.4185 | 0.4248 | 0.4331 | 0.4533 | 0.4787 | 0.4258 |
Table 4.
Annual growth rate of MPI, TC, PTE, SE in 30 provinces of China.
| Province | MPI | TC | PTE | SE | Province | MPI | TC | PTE | SE |
|---|---|---|---|---|---|---|---|---|---|
| Guangxi | 14.3 | 3.8 | 9.9 | 0.2 | Sichuan | 1.5 | 2.8 | 0.5 | −1.7 |
| Jilin | 12.6 | 3.3 | 10.1 | −0.9 | Chongqing | 0.6 | 4.2 | −2.1 | −1.4 |
| Hunan | 11.7 | 3.7 | 7.4 | 0.2 | Henan | 0.5 | 2.7 | 2.0 | −4.0 |
| Shanxi | 10.6 | 4.4 | 3.8 | 2.1 | Shandong | 0.1 | 3.8 | −4.8 | 1.3 |
| Gansu | 9.3 | 5.1 | 6.0 | −1.8 | Anhui | 0.0 | 2.3 | −3.5 | 1.2 |
| Liaoning | 8.7 | 3.4 | 4.0 | 1.0 | Inner Mongolia | 0.0 | 3.1 | 0.9 | −3.9 |
| Jiangxi | 8.2 | 3.1 | 4.8 | 0.2 | Hainan | −0.4 | 3.4 | −5.4 | 1.8 |
| Zhejiang | 6.4 | 4.7 | 1.5 | 0.1 | Heilongjiang | −0.5 | 4.0 | −0.2 | −4.1 |
| Ningxia | 4.0 | 4.0 | 0.0 | 0.0 | Xinjiang | −0.6 | 3.9 | −2.4 | −1.9 |
| Guizhou | 3.8 | 2.6 | 0.1 | 1.1 | Shaanxi | −0.7 | 3.9 | −3.8 | −0.7 |
| Tianjin | 3.1 | 3.1 | 0.0 | 0.0 | Jiangsu | −1.4 | 1.5 | −1.6 | −1.2 |
| Qinghai | 3.1 | 3.1 | 0.0 | 0.0 | Shanghai | −2.1 | 2.9 | −3.5 | −1.4 |
| Hubei | 2.6 | 3.3 | 5.2 | −5.6 | Hebei | −2.1 | 2.2 | −4.1 | −0.2 |
| Yunnan | 2.0 | 3.1 | 0.2 | −1.3 | Beijing | −3.5 | 5.0 | −8.0 | −0.1 |
| Fujian | 1.9 | 3.2 | −1.9 | 0.6 | Guangdong | −8.5 | 2.7 | −9.5 | −1.5 |
Publisher’s Note: MDPI stays neutral with regard to jurisdictional claims in published maps and institutional affiliations. |
© 2022 by the authors. Licensee MDPI, Basel, Switzerland. This article is an open access article distributed under the terms and conditions of the Creative Commons Attribution (CC BY) license (https://creativecommons.org/licenses/by/4.0/).
Share and Cite
MDPI and ACS Style
Zhang, M.; Liu, H.; Su, Y.; Zhou, X.; Li, Z.; Chen, C. Assessment and Decomposition of Regional Land Use Efficiency of the Service Sector in China. Land 2022, 11, 1911. https://doi.org/10.3390/land11111911
AMA Style
Zhang M, Liu H, Su Y, Zhou X, Li Z, Chen C. Assessment and Decomposition of Regional Land Use Efficiency of the Service Sector in China. Land. 2022; 11(11):1911. https://doi.org/10.3390/land11111911
Chicago/Turabian StyleZhang, Mingzhi, Hongyu Liu, Yangyue Su, Xiangyu Zhou, Zhaocheng Li, and Chao Chen. 2022. "Assessment and Decomposition of Regional Land Use Efficiency of the Service Sector in China" Land 11, no. 11: 1911. https://doi.org/10.3390/land11111911
Note that from the first issue of 2016, this journal uses article numbers instead of page numbers. See further details here.