
Agricultural Production Services, Farm Size and Chemical Fertilizer Use in China’s Maize Production

1
School of Public Policy and Management, Tsinghua University, Beijing 100084, China
2
China Institute for Rural Studies, Tsinghua University, Beijing 100084, China
*
Author to whom correspondence should be addressed.
Land 2022, 11(11), 1931; https://doi.org/10.3390/land11111931
Submission received: 15 September 2022
/
Revised: 24 October 2022
/
Accepted: 27 October 2022
/
Published: 30 October 2022
(This article belongs to the Special Issue Effects of Conservation Agriculture on Restoring Soil Quality and Crop Yield Performance)
Abstract
:Although various previous studies have explored the relationship between agricultural service adoption and its economic impact, little is known about how it may affect environmental quality, especially chemical fertilizer application. Our study examines the effects of agricultural production services (APSs) on chemical fertilizer use, as well as the effects mediated by farm size, using a national representative survey data set comprising 1321 farm households from 132 villages in China. We show that farms adopting APSs tend to decrease the usage of chemical fertilizer and, thus, have less deviation from optimal chemical fertilizer application. Farms with large sizes are more likely to reduce the usage of chemical fertilizer. Moreover, farm size has a significant mediating effect on the relationship between APS adoption and chemical fertilizer use. In particular, farms adopting APSs are more likely to expand farm size, resulting in chemical fertilizer reduction. Our results suggest that APSs contribute to promoting the scale operation and environmental quality in agriculture.
1. Introduction
Chemical fertilizers are comprehensively used in agricultural production and contribute to increasing crop yields and ensuring food security [1]. However, the overuse of chemical fertilizers has caused various problems in developing countries, such as food insecurity, human health, soil degradation and greenhouse gas emissions, especially in China [2,3,4]. Due to the excessive use of chemical fertilizers in agriculture, the ecological balance and social well-being of these countries have been greatly threatened and, thus, the overuse of chemical fertilizers has become a public concern [5].
China had 8.57% of world farmland but consumed 24.97% fertilizers (by nutrients) in 2018. According to the data from National Bureau of Statistics of China [6], the consumption of chemical fertilizers started to increase in 1978, reached its peak at 60.33 million tons in 2015 and gradually decreased to 52.5 million tons in 2020. Meanwhile, the chemical fertilizer use of crops in China has increased sharply from 58.89 kg/ha in 1978 and reached its peak at 362.5 kg/ha in 2014, as shown in Figure 1. To reduce the overuse of chemical fertilizers and pesticides (CFPs) and develop green production, the Chinese government implemented “Plan of Zero Growth in Chemical Fertilizer Use by 2020” and “Plan of Zero Growth in Pesticide Use by 2020” in 2015. Although there was a slight decrease after these policies were implemented, the amount of chemical fertilizer application remains large. There were 313.49 kg/ha of chemical fertilizers applied in 2020. It is still urgent to explore effective ways to decrease chemical fertilizer application.
China’s agriculture is characterized by a smallholder farming system. About 210 million farm households operate on cropland less than 0.667 hectares and the average farm size is 0.497 hectares [7]. The farm size is only one-third of that in South Korea and one-quarter of that in Japan. Since the implementation of the Household Contract Responsibility System in 1979, China’s agricultural production has been dominated by smallholder farmers. In the meantime, rural reforms and open policies implemented in 1979 resulted in a massive temporary rural to urban labor migration. With the increase in the differences in wage rate between the rural and urban sectors after the 2000s, labor migration has accelerated [8,9]. Consequently, the labor supply in the agricultural sector has witnessed a sharp decrease, which has raised a concern about the agricultural productivity in the country [10].
However, the unfavorable land and labor resource do not seem to be affecting China’s agricultural production, with yield of 68.285 million tons and unit yield of 5805 kg/ha in 2021, increasing from 33.212 million tons and 2785 kg/ha in 1979, respectively [6]. It is believed that agricultural mechanization and custom services are conducive to improving productivity [11,12] and can help explain this paradox [8,9,13]. Meanwhile, the Chinese government has built a well-functioning agricultural cooperative system to develop agricultural services, including extension services, technical services and marketing services [14], and agricultural production services (APSs) developed quite well in rural China.
APSs refer to various agricultural services provided by new business entities that directly engage in agricultural production, including pre-production services, mid-production services, post-production services, etc. [15]. APSs enable smallholders to access advanced agricultural technologies and machines at a relatively low cost. Under the comprehensive support from the government, APSs have developed rapidly. There were 950 thousand specialized service providers, the area of agricultural services provided exceeded 111.33 million hectares and more than 780 million smallholder farmers benefited in 2021 [16].
There have been studies aiming to explore the economic impact of APSs. The ecological and environmental effects of APSs, however, are unclear and rarely explored. Interestingly, several recent studies examined the relationship between agricultural machinery services and CFP application and showed that the impact of machinery services on reducing pesticide application is still limited [17]. Apparently, the service scale plays an increasingly important role in pesticide reduction with the land consolidation, since it can improve the mechanization level of smallholder farmers in grains production [18]. A more recent study also showed that agricultural cooperative membership can contribute to fertilizer and pesticide reduction among family farms; in particular, production services can help decrease fertilizer and pesticide use, while marketing services can only decrease pesticide use [14]. However, these studies fail to investigate the optimal usage of chemical fertilizer and examine the relationship between production services and chemical fertilizer, as well as the influence mechanism. Moreover, most of the existing literature discussed the relationship between production services and CFPs, with little evidence focus on chemical fertilizer use and few studies have been conducted for China. To fill in the literature gap, our study provides a robust estimation of the effects of APSs on chemical fertilizer use and the mediating role of farm size in China’s maize production.
In this study, we focus on maize production, mainly because corn is one of the most important grain crops in China. It is the most productive grain variety and plays a crucial role in ensuring food security in China. Corn production in China has steadily risen from 55.945 million tons in 1978 to 260.665 million tons in 2020 and the yield increased from 2803 kg/ha to 6317 kg/ha, respectively [6]. The Chinese government suspended the system of temporary purchase and storage of corn, resulting in a decrease in sown area. In the meantime, the maize production systems deployed by smallholders in China have tended towards extremely intensive planting and excessive use of fertilizers, which has caused serious environmental impacts, in order to meet the food demands of a growing population [19]. Hence, identifying the factors that contribute to reducing chemical fertilizer use is vital for setting up effective policies and programs to promote agricultural sustainability in China and developing countries with similar conditions.
To explore the impact of APSs on chemical fertilizer use, we use a data set comprising 1321 farm households from 13 maize-producing provinces in China. The objectives of this study are three-fold. The first is to estimate the optimal quantity and deviant quantity of chemical fertilizer use as the proxy for chemical fertilizer use. We do so via an ordinary least squares (OLS) regression on the Cobb–Douglas (C–D) function to obtain the output elasticity of chemical fertilizer, based on the “profit-maximization principle” of farmers’ producing behavior. The second is to provide a robust estimation on the impact of APS adoption decision on farm households’ chemical fertilizer use by applying a Probit model to construct an index capturing the probability for farm households to adopt APSs. The third objective is to examine how farm household decisions regarding APS adoption and farm size affect chemical fertilizer use in maize production through a mediation model.
2. Literature Review and Conceptual Framework
The existing literature has addressed the relationship between economic growth and rural environment. In developing countries, fertilizer input is deemed as an important factor to increase agricultural production [20]. However, the deterioration of environment associated with the overuse of chemical fertilizer has resulted in damaging economic growth and posing a threat to the social well-being [4,21,22]. Some studies argue that farm size and market-oriented incentives affect the farm household’s decision regarding fertilizer application in developing countries [21,23]. However, little is known about the effects of APSs on chemical fertilizer use, especially within a Chinese context, featured by unfavorable resource endowment, including small-scale farm size, severe fragmentation and labor shortage in the agricultural sector.
In terms of the impact of APSs, a wide range of literature focuses on its economic impacts and shows that APSs are conducive for productivity and efficiency improvement, households’ income and rural development in rural areas [8,9]. An interesting question arises, whether the adoption of APSs can decrease the use of chemical fertilizer, which is an imperative input in agricultural production. However, we still have little knowledge about whether and how APSs affect chemical fertilizer use.
Some studies have examined the relationship between agricultural extension services and the application of chemical fertilizer and found that access to extension services significantly promotes adoption of chemical fertilizer in Ghana [24]. Given the differences between APSs and extensive services, the former is considered a market-oriented behavior while the latter is seen as a policy-driven measure, so the influence mechanism of APSs on chemical fertilizer use may not be the same. Similarly, Liu and Wu [14] suggest that agricultural cooperative, one of the main APS providers, can help reduce the application of fertilizers and pesticides. In particular, compared with individual farms, APS providers, including cooperatives, family farms, agricultural enterprises, etc., can obtain economies of scale by gathering resources and promoting agricultural specialization [25]. These organizations provide input purchasing services, production services from seeding to harvesting stages and marketing services. Meanwhile, most of them have built up formal standards for their members’ chemical inputs [26], which would contribute to ecological environment protection [27]. Farmers tend to adopt good practices and, thus, use less CFPs with help from the cooperative service teams [14]. For instance, in Heilongjiang province in China, cooperatives apply precision farming technology and advanced application machinery, resulting in 10% of fertilizers being reduced in crops, such as rice, corn and soybean. Interestingly, a more recent study also showed that a fertilization outsourcing service can help reduce the fertilizer input of part-time farmers [28]. However, none of these studies accounted for the impact of APSs on chemical fertilizer use, as well as the mediating effect of farm size.
In fact, APSs, as an important part of the reform of farming system in China, are viewed as an alternative mode for farmland transfer and consolidation to realize the “service-scale economy” from the “land-scale economy” [11]. Nevertheless, the existing literature shows that the use of mechanization services can replace labor [13], which enables the farm households to reallocate resources, such as expanding size and, thus, reducing chemical fertilizer use [21]. More importantly, according to Wu et al. [29], the smallholders have a larger deviation from the optimal amount of fertilizer use. Both small farms and large farms are deviant from the optimal amount of fertilizer use, but the deviation degree of small farms is larger than that of large farms. In other words, the fertilizer application is likely to decrease with the expansion of farm size. Hence, the agricultural services may have not only a direct impact on chemical fertilizer use but also an indirect effect through the adjustment of farm size.
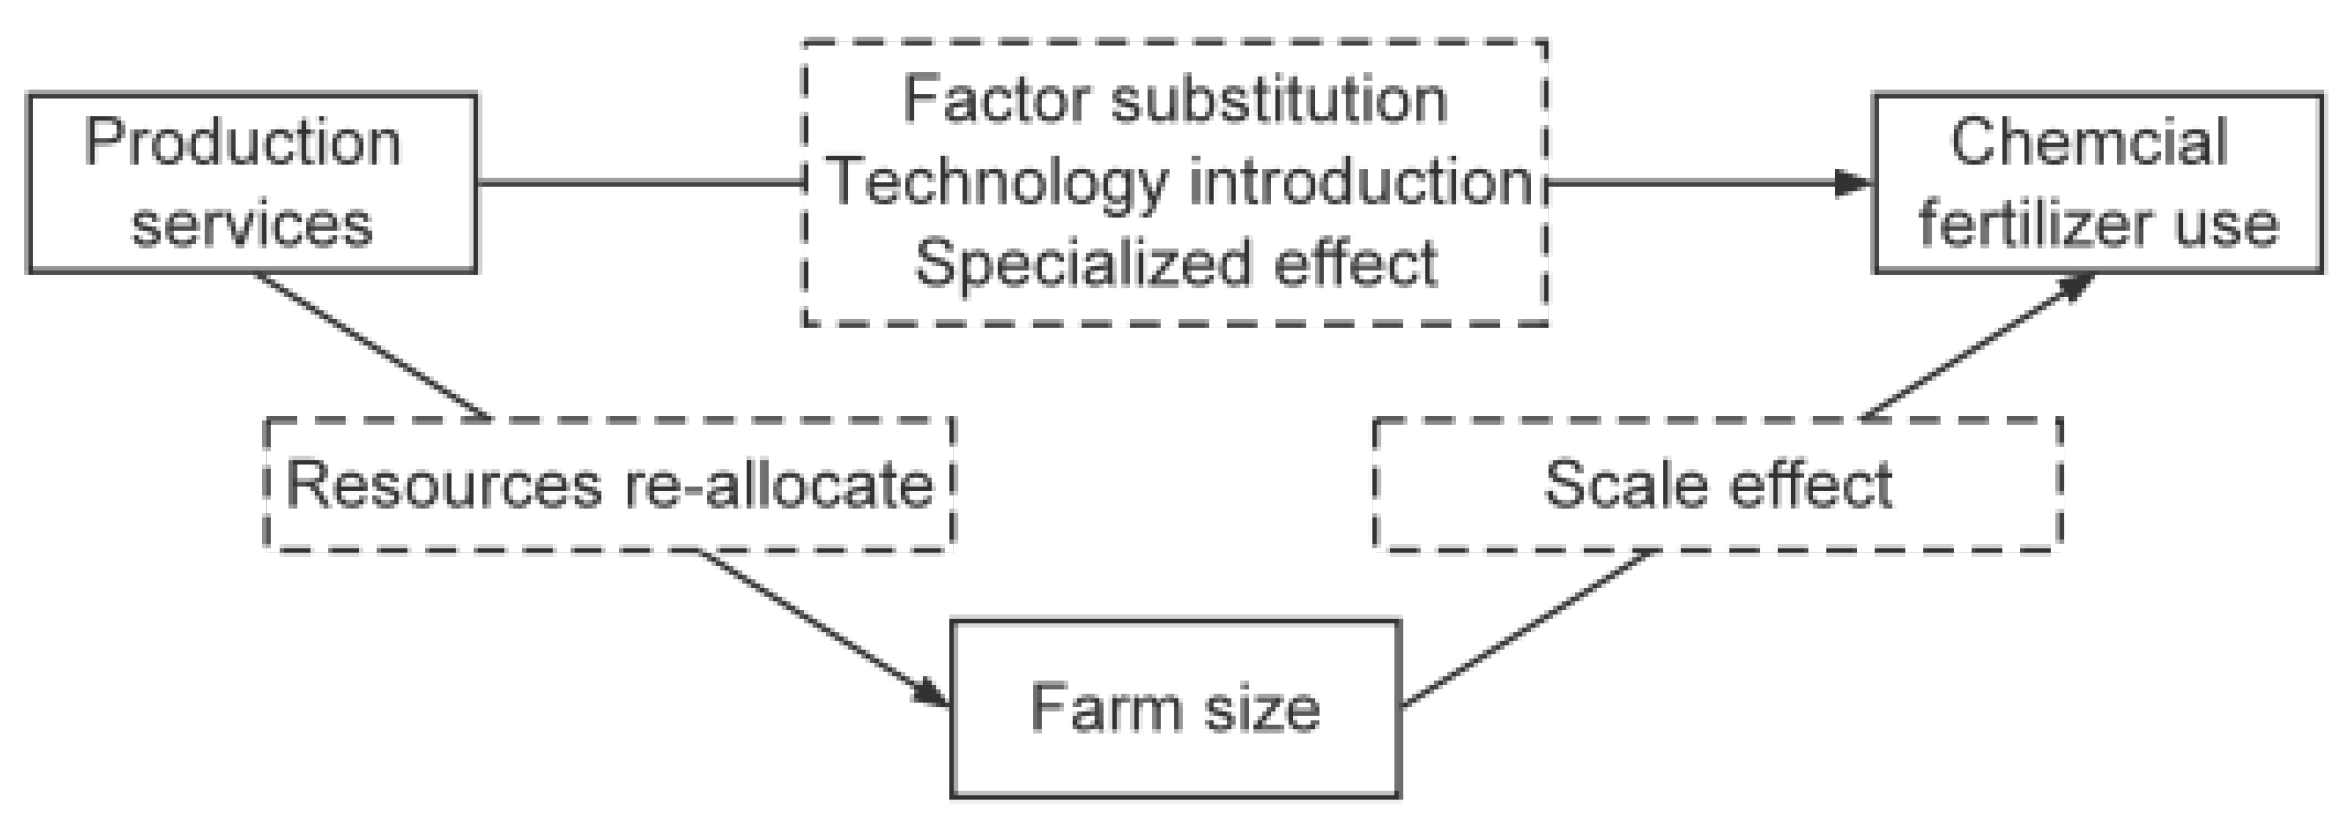
The relationship among APSs, farm size and chemical fertilizer use is shown in Figure 2. On the one hand, APSs can directly affect chemical fertilizer use through factor substitution, technologies introduction and specialization effect. On the other hand, APSs can indirectly affect chemical fertilizer use by expanding farm size through reallocating resources and, thus, reducing chemical fertilizer use through the scale effect.
Factor substitution
As an important production factor, APSs can be used by farmers to substitute other inputs, including labor and fertilizers. For instance, if a farm household chooses to adopt fertilization services, they do not have to use chemical fertilizer by themselves. The use of APSs can substitute and reduce chemical fertilizer use.
Technology introduction
The existing literature has illustrated that fertilizer application is determined by technology adoption [30,31]. Farms adopting more desirable technologies and practices are more likely to apply less fertilizers [32]. According to Sheng and Chancellor [33], small farms are likely to access the same benefits of newly developed technologies as their counterparts do, through capital outsourcing, a typical APS. In words, compared with those non-adopters, farm households adopting APSs have better access to new techniques and, thus, use less fertilizers. A more recent study also shows that the adoption of agricultural mechanization technologies and soil test fertilization technologies can help mitigate the adverse impacts of land fragmentation on chemical fertilizer reduction [34].
Specialized effect
Generally, the APS providers are mainly large-scale operators, including agricultural cooperatives, family farms and enterprises, which can obtain economies of scale by gathering resources and promoting agricultural specialization [25]. Farm households that adopt APSs are likely to adopt good practices and minimize the overuse of chemical fertilizers with the APS provider’s help [14]. The agricultural production practice conducted by specialized service providers, for example, cooperatives, contributed to ecological environment protection [27].
Mediating effect through farm size
The existing studies show that the small-scale households tend to adopt more fertilizer and, thus, are more deviant from the optimal fertilizer application than the large-scale ones [29]. The adoption of APSs can replace labor, which enables the farm households to reallocate resources, such as expanding size [35] and, thus, reducing chemical fertilizer use [21].
Based on the above observations, we hypothesize that APS adoption has a significant negative impact on chemical fertilizer use, both the actual amount and deviant amount of chemical fertilizer use, which is mediated by farm size. In other words, APSs can not only directly reduce chemical fertilizer use but also indirectly reduce it by promoting the farm size.
3. Methodology and Data
3.1. Source of Data
This study uses a household-level survey data set administered by the National Agricultural and Rural Development Research Institute (NARI) at the China Agricultural University in 2019. The survey was conducted in the spring of 2019 and collected information of farm households in 2018, which includes the inputs and outputs of agricultural production, farm management, farmland characteristics, household characteristics and farmer characteristics. As our aim is to examine the impacts of APSs on chemical fertilizer use and the role of farm size, in China’s maize production, we only keep those samples that engage in maize production. The final data set comprises 1321 observations, covering 132 villages from 13 provinces, including Hebei, Liaoning, Jiangsu, Shandong, Inner Mongolia, Jilin, Heilongjiang, Anhui, Henan, Hubei, Hunan, Sichuan and Gansu.
3.2. Estimation Strategy
3.2.1. Estimation of Deviant Amount of Chemical Fertilizer Use
The deviant usage of chemical fertilizer is defined when the actual amount of chemical fertilizers applied is deviant from the economically optimum level. According to the principle of economics, households are assumed to maximize economic profit in production [36]. Suppose that the household applies multiple inputs, i.e., chemical fertilizer, labor, capital and other inputs, to produce one output (maize). The production function can be written as:
where Y is farm i’s output of maize production; f (·) is a function following the Cobb–Douglas specification; F is the amount of chemical fertilizer; Z is a vector of the amount of other inputs. Hence, the profit maximization problem regarding chemical fertilizer use can be expressed as:
where is the profit; and refer to the price of the output and chemical fertilizer, respectively. The first-order condition of profit maximization for fertilizer use can be written as:
Here, we can obtain the economically optimum amount of chemical fertilizers ().
where denotes the production elasticity of chemical fertilizer; hence, we can determine the deviant amount of chemical fertilizer per mu farmland by using the economically optimum amount of chemical fertilizer subtracting the actual amount of chemical fertilizer applied. Let denote the deviant amount of chemical fertilizer, which can be calculated as:
3.2.2. Probit Model for APS Adoption Analysis
To address the potential endogeneity, we apply a two-stage procedure that considers the endogenous treatment variable. In the first-stage estimation, we apply a probit model to estimate the probability of APS adoption and then use the fitted values to depict APS adoption in the second-stage estimation [37]. In our case, the model for APS adoption can be set as:
In this setting, Service i is a dummy variable, referring to whether farm i adopts APSs (Service i=1) or not (Service i=0) and Service i* is a latent variable; is a vector of variables that affects APS adoption, including, for example, farm size, labor migration, fixed assets, land fragmentation, land quality, farmer characteristics and region characteristics; is a random error term. Since a dummy variable may not accurately describe the degree of service adoption in grains production [12,35], we use the estimated probability of APS adoption, instead, in the mediation model.
3.2.3. Mediation Model for Mediating Effects
In order to better understand the mechanism of how APSs affect chemical fertilizer use, we further apply a mediation model to investigate if farm size mediates the effect of APSs on chemical fertilizer use. The mediating effect examines the impacts of farm size on affecting the relationship between APSs and chemical fertilizer use. Following the methodology of Wang et al. [38], we apply the three-model system to analyze the mediating effects of farm size. The model can be set as follows:
Here, is the usage of chemical fertilizer of farm i, which is estimated using the above-mentioned methodology. represents probability of farm i’s decision regarding service adoption, is the size of farm i, i.e., the mediator, is a vector of control variables affecting APS adoption, farm size and chemical fertilizer use of the farm.
In particular, we first examine the direct effects of APS adoption on chemical fertilizer use without considering farm size in Equation (7). Second, we investigate the impacts of APS adoption on farm size in Equation (8). Last, we explore the impacts of APS adoption and farm size on chemical fertilizer use in Equation (9).
3.3. Variable and Descriptive Statistics
The dependent variable is the actual usage and deviant usage of chemical fertilizer. To obtain the deviant usage of chemical fertilizer, we first employ an OLS to estimate the output elasticity of chemical fertilizer based on the Cobb–Douglas function. The output variable is the quantity of maize production per mu. The input variables include unit quantity of labor, fertilizer and capital, i.e., the depreciation expenses of agricultural fixed asset investment in maize production and other expenses, including seeds, organic fertilizer, irrigation and machine renting per mu.
In our study, APS adoption decision is the main independent variable. Although some studies use a dummy variable to measure service adoption [39], a binary measure cannot describe the probability of APS adoption. Meanwhile, there might be a concern about endogeneity issue since those unobservables correlated with chemical fertilizer use may affect the farmer’s APS adoption decisions. It is also possible that farms that did not adopt APSs were less motivated to decrease the usage of fertilizer and, thus, were more deviant from the optimum usage of chemical fertilizer. To address the endogeneity issue, we apply a probit model and use the fitted values as an instrumental variable (IV) for APS adoption.
In addition, to identify the influence mechanism of the effects of APSs on chemical fertilizer use, we investigate the mediating effects of farm size on the relationship between service adoption and chemical fertilizer use.
Controlling for the farm household and farmer characteristics in farmers’ APS, adoption decision and chemical fertilizer use are important features in our study. Following the existing literature [14,35,40,41,42], we control for farmer characteristics, i.e., age, gender and education of household head, other household characteristics, such as social capital, labor migration, technical guidance and region characteristics. Moreover, we control for policy factors, i.e., the machinery purchasing subsidy, which is considered to be affecting farmers’ decision regarding service adoption, since those farms that obtained machinery purchasing subsidy are more likely to purchase machines instead of adopting APSs.
Farmland characteristics, including, for example, number of plots, structure and terrain of farmland, are considered to be determinants of technology adoption [13,43]. Further, land is deemed as an asset to farmers, such that the self-reported land quality might have an impact on farmers’ decisions because of the endowment effects. Therefore, we control for self-reported land, which is considered to be affecting APS adoption decision. In addition, we control for land use right certification, which is considered to reduce chemical usage, given that tenure insecurity contributes to the degradation of land resource and capability of sustainable production [44]. The variable and definition are shown in Table 1.
4. Results and Discussion
4.1. Descriptive Statistics
Table 2 reports the descriptive statistics of variables of interest. We can see that there are 689 farms that adopted APSs, accounting for 52.16% of the total farms in 2018. The average maize yield of farms adopting APSs was statistically smaller than that of farms using self-owned machines or traditional techniques. A possible explanation is that these non-adopters are likely to use self-owned large machineries and, thus, achieve higher productivity than APS adopters. The average farm size is 19.395 mu (1.293 hectares), which is extremely small compared with Western countries, for instance, Australia, Canada and the US. Moreover, farms adopting APSs produced on smaller-sized farmland than the larger farms, though the t-statistic is insignificant.
The average labor input of farms adopting APS was larger than non-adopters, for which large farms are more likely to use self-owned machines or hire labor to replace family labor and, thus, use less labor. In addition, the average chemical fertilizer input in farms that adopted APSs is slightly smaller than their counterparts. The same trend is shown in the estimated optimum and deviant amount of chemical fertilizer. In particular, the optimum amount of chemical fertilizer of farms adopting APS is significantly less than non-adopters, which implies that APS adoption in maize production might help reduce chemical fertilizer use, enabling farms to approach the optimum amount of chemical fertilizer application.
Intuitively, the descriptive statistics suggest that APS adoption is strongly correlated to the optimal amount of chemical fertilizer use. However, given the APS-related characteristics, it is hard to tell how APS adoption, farm size and chemical fertilizer use interact with each other and whether APSs significantly affect the actual amount and deviant amount of chemical fertilizer use, as well as the role of farm size. We have to apply more desirable empirical strategies to further explore the mechanism.
4.2. The Deviant Amount of Chemical Fertilizer Use
In this study, we aim to examine the relationship between APSs and chemical fertilizer use, as well as the mediating effects of farm size. We first conduct an OLS estimation based on the Cobb–Douglas function to obtain the output elasticity of chemical fertilizer and then calculate the optimum usage and deviant usage of chemical fertilizer.
Table 3 reports the OLS estimation results. It shows that the output elasticity of chemical fertilizer is −0.059, which implies an increase in chemical fertilizer input is likely to decrease the yield per acreage operated farmland. In particular, the coefficient of labor is not statistically significant, which denotes that the extensive labor use would not necessarily increase the output in maize production. The increase in capital and other expenses can promote the output.
The optimal quantity and deviant quantity of chemical fertilizer can be obtained according to Equation (4) and Equation (5), respectively, which are shown in Table 2. We can see from the table that the optimal quantity of chemical fertilizer use is 10.094 kg/mu and the deviant quantity is 15.831 kg/mu, which suggests that the overuse of chemical fertilizer is quite serious in China’s maize production. The results are consistent with the existing findings [28,29].
4.3. Determinants of the Service Adoption Decisions (Probit Model Results)
As discussed above, the estimated value of Probit model results is used as an explanatory variable in the mediating effect estimation. Hence, we first present the results of Probit model and then proceed to the results from mediating effect estimation. Here, we discuss the Probit model results where the determinants of farm households’ decision regarding APSs are elaborated. Table 4 reports the Probit model estimation results. The OLS regression results are provided for comparison.
We can see that the coefficient of farm size is not significant in all models, which is not consistent with the existing findings [43]. To further examine the relationship between farm size and APSs, we introduced a squared term into the model and re-ran the regression, following the study of Qiu and Luo [45]. The results show that the coefficient of farm size squared term is still not significant, suggesting that farm size may not be a crucial determinant of APS adoption.
Moreover, labor migration has a significant and positive impact on APS adoption, which suggests that APSs, to some extent, can reduce drudgery and deliberate labor from heavy manual agricultural activities and enable them to engage in off-farm activities [13,46]. Further, land fragmentation, measured as the number of plots, has a significantly negative impact on APS adoption, which is consistent with the findings of Wang et al. [43]. The coefficients of flat land ratio and slope land ratio (hilly land ratio) are significant and positive (negative), which implies that unfavorable farmland terrain obstructs farm households’ decision regarding APS adoption, as APSs, especially large machinery services, may not be able to reach remote rural areas with hills and mountains, resulting in a higher price for APSs.
4.4. Mediation Model Results
To explore the impacts of APS adoption on chemical fertilizer use, as well as its mechanism, we apply a mediation model. Table 5 reports the mediating effect estimation results, where columns (1)–(3) show the mediating effects of farm size on the actual quantity of chemical fertilizer usage and columns (4)–(6) on the deviant quantity. The empirical results showed that APS adoption can not only directly but also indirectly affect the chemical fertilizer use through adjustment of farm size. In particular, the direct effect of APS adoption on actual quantity of chemical fertilizer use is −20.066, while on the deviant quantity is −18.034. It suggests that APSs can help reduce the chemical usage in production, which is consistent with the existing findings [1,28]. Further, the coefficient of APS adoption on farm size is significantly positive, which means that farms adopting APSs are more likely to expand farm size. Particularly interesting is that APS adoption affects farm size, but not vice versa, as shown in Table 4 and Table 5 (Probit model results).
First, we can see from columns (1)–(3) in Table 5 that the coefficient of APS adoption is significantly negative when all mediators are introduced into the regression, which means the effects of APS adoption on the actual usage of chemical fertilizer are partially mediated by farm size. Particularly interesting is that the descriptive statistics show that APS adopters operate on smaller cropland. This is plausible because the Chinese government has strived to promote scale operation of farmland by land concentration for decades. The large operators are emerging in rural areas, although Chinese agricultural production is still dominated by smallholder farmers. The results that APS adoption has a significant impact on farm size imply that APSs are conducive to scale operation in rural China, which helps explain the paradox that with the increasing scale of rural to urban labor migration, the children, female and aged are left behind in rural areas, while the food production has witnessed a steady increase for decades [8,9]. Moreover, the expansion of farm size helps to reduce the actual usage of chemical fertilizer, which is consistent with the findings of Wu et al. [29].
Second, we can see from columns (4)–(6) in Table 5 that the coefficient of APS adoption is significantly negative when all mediators are introduced into the regression, which means the effects of APS adoption on the deviant usage of chemical fertilizer are partially mediated by farm size. The results suggest that farms adopting APSs tend to expand farm size, which enables them to reduce the actual usage and decrease the deviation degree of optimal fertilizer use.
The empirical results imply that APSs enable farm households to reallocate resources so as to expand farm size, which is a complementary means for land transfer in the land scale operation practice in China [11]. These two different modes are popular in the Northeast Plain and North China Plain, the largest and second-largest plains in China, respectively. Due to the implementation of the land ownership reforms becoming slower and slower, the development of APSs, especially mechanization services, is currently greatly encouraged by the Chinese Government. APSs have basically been deemed as an alternative for land concentration to promote scale operation in academia. More importantly, our results show that APS adoption has a significantly negative impact on the overuse of chemical fertilizer in rural China, where smallholder farmers have dominated for decades.
4.5. Discussion: The Effect of APS Adoption on Chemical Fertilizer Use under Different Circumstances
To further explore the impacts of APS adoption on chemical fertilizer use under different circumstances, we categorize our sample into six different groups, whether the farm household transferred farmland from others, whether the farm household used traditional farming techniques and whether the farm household adopted APSs in fertilizer purchasing or pest-control stages. The estimation results of actual usage and deviant usage of chemical fertilizers using OLS regression are shown in Table 6 and Table 7, respectively.
We can see from column 1 to column 2 of Table 6 and Table 7 that, for farms that transferred farmland, the impact of APS adoption is not significant on actual quantity, while it is negative, statistically significant at the 10% level, on deviant quantity of fertilizer use. However, for farms that did not transfer farmland, the coefficients of APS adoption are negative on both actual quantity and deviant quantity of chemical fertilizer use, statistically significant at the 1% level. Meanwhile, the absolute value of the coefficients of both increased sharply. It suggests that APS adoption is conducive for chemical fertilizer reduction for farms to operate on their own farmland. A possible explanation is that farms that transferred land tend to be large-scale ones and tend to purchase and own machinery instead of adopting APSs and, thus, APS adoption has no significant impact on the actual quantity of fertilizer use. The farms that did not transfer land, however, are more likely to be smallholders. The adoption of APSs helped reduce chemical fertilizer use.
For farms using traditional farming techniques, as is shown in column 3 of Table 6 and Table 7, the coefficient of APS adoption on both actual quantity and deviant quantity of chemical fertilizer use is not statistically significant. For farms using mechanized farming techniques, however, the coefficient of APS adoption on both actual quantity and deviant quantity of chemical fertilizer use is negative, statistically significant at the 1% level, as shown in column 4 of Table 6 and Table 7. It implies that for farm produce using large machines, APSs can reduce the use of chemical fertilizer, while for those using self-owned machines, APS adoption cannot generate the same effect, as expected. On the contrary, farms using traditional manual procedures tend to be farms with extremely small farm size and operate on their own small and fragmented farmland. They may use old-fashioned farming techniques, instead of adopting APSs and APS adoption has no significant impact on chemical fertilizer use.
To further examine whether the impact of APS adoption on chemical fertilizer use is generated by fertilizer-use-related services, we compared the estimation results on two groups of samples, one with farms that adopted fertilizer-use-related services and another that did not adopt any fertilizer-use-related services. As shown in column 5 and 6 of Table 6 and Table 7, APS adoption has significant negative effects on both the actual quantity and deviant quantity of chemical fertilizer use. However, for farms that adopted fertilizer purchasing services or pest-control services, the coefficient of APS adoption is much larger than that for farms that did not adopt any fertilizer-use-related services. It denotes that APSs can not only affect chemical fertilizer use through the fertilizer-use-related services but also can affect chemical fertilizer use through non-fertilizer-use-related services.
Based on the above observations, we suggest that APSs contribute to chemical fertilizer reduction and the impact is highly related to farm size.
5. Conclusions and Policy Implications
Our aim is to explore the relationship between APSs and chemical fertilizer use, as well as the mediating effect of farm size. For this purpose, at first, we construct a conceptual framework of APS adoption—farm size—for chemical fertilizer application. Utilizing a mediation model with an index of APS adoption estimated using a Probit model to address the endogeneity issue, we use a farm-level survey data set comprising 1321 samples collected in 2019 to investigate the effects of APS adoption on chemical fertilizer use and its influence mechanism. The results clearly indicated that APS adoption has a significant negative effect on the actual usage and deviant usage of chemical fertilizer in China’s maize production. The direct effect of APS adoption is significantly negative on the actual usage and deviant usage of chemical fertilizer. That means that by reducing chemical fertilizer use, APSs can contribute to the improvement in environmental protection in agriculture. Further, APS adoption affects chemical fertilizer use through farm size. In particular, the adoption of APSs is conducive to expanding farm size, resulting in chemical fertilizer reduction. Moreover, the probability of adopting APSs will be increased by concentrating on factors, including increasing off-farm employment opportunities, reducing land fragmentation, providing technical guidance, etc.
Hence, the policies should be focused on promoting the availability of APSs in farming operations and the development of APSs in the agricultural sector. The sustainable development of the maize industry will require investment in APSs, especially under the background of the growing amount of rural to urban migration, with female and aged groups left behind in rural areas. Therefore, policy makers should take into account the essential role of APSs in agricultural sustainability and pay more attention to the development of APSs. More importantly, this study suggests that APSs can effectively replace labor for farm households and enable them to promote the cultivated area of grains, to reduce chemical fertilizer application, which provides practical references and policy implications for other countries faced with the similar conditions as China.
Our study makes two main contributions to the existing literature. First, we apply a Probit model to address the potential endogeneity of APS adoption, arising from sample selection bias. The estimated probability of APS adoption is then used to examine its impact on chemical fertilizer use. Second, our analysis reveals the mechanism that APS adoption affects chemical fertilizer use via farm size. Specifically, APS adoption changes farm size, resulting in a reduction in chemical fertilizer use. To our knowledge, this study is among the first to examine the impacts of APS adoption on chemical fertilizer use through farm size in China.
Certainly, our study has limitations. For instance, the study uses cross-sectional data instead of panel data due to limited data availability and resource allocation. The sample may not be sufficient to reflect the whole picture of maize production in China but can contribute to developing understanding about the impacts of APSs on chemical fertilizer use in maize production. Moreover, as a supporting tool, the mediating effect model can contribute to the debate on mediating effects of farm size on the relationship between APSs and chemical fertilizer use, along with the impact of APS adoption related to economic, social and environmental factors. Therefore, there is space for researchers to apply the model according to necessity.
Author Contributions
Conceptualization, M.H. and S.Z.; methodology, M.H. and S.Z.; software, M.H.; validation, M.H. and S.Z.; formal analysis, M.H.; investigation, M.H.; resources, S.Z.; data curation, S.Z.; writing—original draft preparation, M.H.; writing—review and editing, M.H. and S.Z.; visualization, S.Z.; supervision, M.H. and S.Z.; project administration, M.H. and S.Z.; funding acquisition, M.H. and S.Z. All authors have read and agreed to the published version of the manuscript.
Funding
This research was funded by the China Institute for Rural Studies, Tsinghua University (Grant No. CIRS2022-11).
Data Availability Statement
The associated data set in the study is available upon request.
Acknowledgments
We acknowledge the National Agricultural and Rural Development Research Institute at China Agricultural University and all the people who contributed to the survey. We also acknowledge the anonymous reviewers for their comments and suggestions, which contributed to the further improvement of this paper.
Conflicts of Interest
The authors declare no conflict of interest.
References
- Zheng, W.L.; Luo, B.L.; Hu, X.Y. The determinants of farmers’ fertilizers and pesticides use behavior in China: An explanation based on label effect. J. Clean. Prod. 2020, 272, 123054. [Google Scholar] [CrossRef]
- Li, Y.X.; Zhang, W.F.; Ma, L.; Huang, G.Q.; Oenema, O.; Zhang, F.S.; Dou, Z.X. An Analysis of China’s Fertilizer Policies: Impacts on the Industry, Food Security, and the Environment. J. Environ. Qual. 2013, 42, 972–981. [Google Scholar] [CrossRef] [PubMed]
- Huang, W.; Jiang, L. Efficiency performance of fertilizer use in arable agricultural production in China. China Agric. Econ. Rev. 2019, 11, 52–69. [Google Scholar] [CrossRef]
- Pan, D.; He, M.M.; Kong, F.B. Risk attitude, risk perception, and farmers’ pesticide application behavior in China: A moderation and mediation model. J. Clean. Prod. 2020, 276, 124241. [Google Scholar] [CrossRef]
- Yang, L.; Tang, K.; Wang, Z.H.; An, H.Z.; Fang, W. Regional eco-efficiency and pollutants’ marginal abatement costs in China: A parametric approach. J. Clean. Prod. 2017, 167, 619–629. [Google Scholar] [CrossRef]
- NBSC. China Statistical Yearbook 2021; China Statistics Press: Beijing, China, 2021.
- NBSC. Bulletin of the Third Agricultural Census; China Statistics Press: Beijing, China, 2018.
- Yang, J.; Huang, Z.H.; Zhang, X.B.; Reardon, T. The Rapid Rise of Cross-Regional Agricultural Mechanization Services in China. Am. J. Agric. Econ. 2013, 95, 1245–1251. [Google Scholar] [CrossRef]
- Zhang, X.B.; Yang, J.; Thomas, R. Mechanization outsourcing clusters and division of labor in Chinese agriculture. China Econ. Rev. 2017, 43, 184–195. [Google Scholar] [CrossRef]
- Zhang, X.B.; Yang, J.; Wang, S.L. China has reached the Lewis turning point. China Econ. Rev. 2011, 22, 542–554. [Google Scholar] [CrossRef] [Green Version]
- Luo, B.L. 40-year reform of farmland institution in China: Target, effort and the future. China Agric. Econ. Rev. 2018, 10, 16–35. [Google Scholar] [CrossRef]
- Qiu, T.W.; Choy, S.T.B.; Luo, B.L. Is small beautiful? Links between agricultural mechanization services and the productivity of different-sized farms. Appl. Econ. 2022, 54, 430–442. [Google Scholar] [CrossRef]
- Wang, X.B.; Yamauchi, F.; Huang, J.K. Rising wages, mechanization, and the substitution between capital and labor: Evidence from small scale farm system in China. Agric. Econ. 2016, 47, 309–317. [Google Scholar] [CrossRef]
- Liu, T.S.; Wu, G. Does agricultural cooperative membership help reduce the overuse of chemical fertilizers and pesticides? Evidence from rural China. Environ. Sci. Pollut. Res. 2022, 29, 7972–7983. [Google Scholar] [CrossRef] [PubMed]
- Huan, M.L.; Li, Y.J.; Chi, L.; Zhan, S.G. The Effects of Agricultural Socialized Services on Sustainable Agricultural Practice Adoption among Smallholder Farmers in China. Agronomy 2022, 12, 2198. [Google Scholar] [CrossRef]
- Government of the People’s Republic of China. The Area of Agricultural Socialized Services Provided in China Has Exceeded 1.67 billion mu. Available online: http://www.gov.cn/xinwen/2021-02/08/content_5585835.htm. (accessed on 14 September 2021).
- Gao, J.J.; Gai, Q.G.; Liu, B.B.; Shi, Q.H. Farm size and pesticide use: Evidence from agricultural production in China. China Agric. Econ. Rev. 2021, 13, 912–929. [Google Scholar] [CrossRef]
- Ying, R.; Xu, B. Effects of regional pest control adoption on pesticides application. China Popul. Resour. Environ. 2017, 27, 8. [Google Scholar]
- Ren, H.; Han, K.; Liu, Y.E.; Zhao, Y.L.; Zhang, L.H.; He, Q.J.; Li, Z.H.; Zhang, J.B.; Liu, P.; Wang, H.Z.; et al. Improving smallholder farmers’ maize yields and economic benefits under sustainable crop intensification in the North China Plain. Sci. Total Environ. 2021, 763, 143035. [Google Scholar] [CrossRef] [PubMed]
- Takeshima, H.; Adhikari, R.P.; Shivakoti, S.; Kaphle, B.D.; Kumar, A. Heterogeneous returns to chemical fertilizer at the intensive margins: Insights from Nepal. Food Policy 2017, 69, 97–109. [Google Scholar] [CrossRef]
- Ju, X.T.; Gu, B.J.; Wu, Y.Y.; Galloway, J.N. Reducing China’s fertilizer use by increasing farm size. Glob. Environ. Chang. 2016, 41, 26–32. [Google Scholar] [CrossRef]
- Xiang, T.; Malik, T.H.; Nielsen, K. The impact of population pressure on global fertiliser use intensity, 1970–2011: An analysis of policy-induced mediation. Technol. Forecast. Soc. Chang. 2020, 152, 119895. [Google Scholar] [CrossRef]
- Mason, N.M.; Jayne, T.S. Fertiliser Subsidies and Smallholder Commercial Fertiliser Purchases: Crowding Out, Leakage and Policy Implications for Zambia. J. Agric. Econ. 2013, 64, 558–582. [Google Scholar] [CrossRef]
- Emmanuel, D.; Owusu-Sekyere, E.; Owusu, V.; Jordaan, H. Impact of agricultural extension service on adoption of chemical fertilizer: Implications for rice productivity and development in Ghana. NJAS-Wagening. J. Life Sci. 2016, 79, 41–49. [Google Scholar] [CrossRef]
- Yang, D.; Liu, Z. Does farmer economic organization and agricultural specialization improve rural income? Evid. China. Econ. Model. 2012, 29, 4. [Google Scholar] [CrossRef]
- Zhou, J.H.; Yang, Z.Y.; Li, K.; Yu, X.H. Direct intervention or indirect support? The effects of cooperative control measures on farmers’ implementation of quality and safety standards. Food Policy 2019, 86, 101728. [Google Scholar] [CrossRef]
- Li, H.Z.; Zeng, E.Y.; You, J. Mitigating Pesticide Pollution in China Requires Law Enforcement, Farmer Training, and Technological Innovation. Environ. Toxicol. Chem. 2014, 33, 963–971. [Google Scholar] [CrossRef]
- Zheng, X.; Zhang, X.; Lin, Q.; Guo, J. The influence of fertilization outsourcing service on Fertilizer input reduction of part-time farmers. J. Agrotech. Econ. 2022, 2, 199–215. [Google Scholar]
- Wu, H.X.; Hao, H.T.; Lei, H.Z.; Ge, Y.; Shi, H.T.; Song, Y. Farm Size, Risk Aversion and Overuse of Fertilizer: The Heterogeneity of Large-Scale and Small-Scale Wheat Farmers in Northern China. Land 2021, 10, 111. [Google Scholar] [CrossRef]
- Huang, J.K.; Huang, Z.R.; Jia, X.P.; Hu, R.F.; Xiang, C. Long-term reduction of nitrogen fertilizer use through knowledge training in rice production in China. Agric. Syst. 2015, 135, 105–111. [Google Scholar] [CrossRef]
- Pan, D.; Kong, F.B.; Zhang, N.; Ying, R.Y. Knowledge training and the change of fertilizer use intensity: Evidence from wheat farmers in China. J. Environ. Manag. 2017, 197, 130–139. [Google Scholar] [CrossRef]
- Zhang, C.; Sun, Y.D.; Hu, R.F.; Yang, F.; Shen, X. The impact of rural-urban migration experience on fertilizer use: Evidence from rice production in China. J. Clean. Prod. 2021, 280, 124429. [Google Scholar] [CrossRef]
- Sheng, Y.; Chancellor, W. Chancellor, Exploring the relationship between farm size and productivity: Evidence from the Australian grains industry. Food Policy 2019, 84, 196–204. [Google Scholar] [CrossRef]
- Chi, L.; Han, S.Q.; Huan, M.L.; Li, Y.J.; Liu, J.F. Land Fragmentation, Technology Adoption and Chemical Fertilizer Application: Evidence from China. Int. J. Environ. Res. Public Health 2022, 19, 8147. [Google Scholar] [CrossRef]
- Huan, M.L.; Dong, F.X.; Chi, L. Mechanization services, factor allocation, and farm efficiency: Evidence from China(dagger). Rev. Dev. Econ. 2022, 26, 1618–1639. [Google Scholar] [CrossRef]
- Sun, Y.; Hu, R.; Zhang, C. Does the adoption of complex fertilizers contribute to fertilizer overuse? Evidence from rice production in China. J. Clean. Prod. 2019, 219, 9. [Google Scholar] [CrossRef]
- Wooldridge, J.M. Econometric Analysis of Cross Section and Panel Data; The MIT Press: Cambridge, MA, USA, 2010. [Google Scholar]
- Wang, J.J.; Li, J.J.; Chang, J. Product co-development in an emerging market: The role of buyer supplier compatibility and institutional environment. J. Oper. Manag. 2016, 46, 69–83. [Google Scholar] [CrossRef]
- Yi, Q.; Chen, M.Y.; Sheng, Y.; Huang, J.K. Mechanization services, farm productivity and institutional innovation in China. China Agric. Econ. Rev. 2019, 11, 536–554. [Google Scholar]
- Chang, H.H.; Mishra, A.K. Chemical usage in production agriculture: Do crop insurance and off-farm work play a part? J. Environ. Manag. 2012, 105, 76–82. [Google Scholar] [CrossRef]
- Guo, L.L.; Li, H.J.; Cao, X.X.; Cao, A.D.; Huang, M.J. Effect of agricultural subsidies on the use of chemical fertilizer. J. Environ. Manag. 2021, 299, 113621. [Google Scholar] [CrossRef]
- Yuan, F.; Tang, K.; Shi, Q. Does Internet use reduce chemical fertilizer use? Evidence from rural households in China. Environ. Sci. Pollut. Res. 2021, 28, 6005–6017. [Google Scholar] [CrossRef] [PubMed]
- Wang, X.B.; Yamauchi, F.; Huang, J.K.; Rozelle, S. What constrains mechanization in Chinese agriculture? Role of farm size and fragmentation. China Econ. Rev. 2020, 62, 101221. [Google Scholar] [CrossRef]
- Otsuka, K.; Suyanto, S.; Sonobe, T.; Tomich, T.P. Evolution of land tenure institutions and development of agroforestry: Evidence from customary land areas of Sumatra. Agric. Econ. 2001, 25, 85–101. [Google Scholar] [CrossRef]
- Qiu, T.W.; Luo, B.L. Do small farms prefer agricultural mechanization services? Evidence from wheat production in China. Appl. Econ. 2021, 53, 2962–2973. [Google Scholar] [CrossRef]
- Reardon, T.; Taylor, J.E.; Stamoulis, K.; Lanjouw, P.; Balisacan, A. Effects of non-farm employment on rural income inequality in developing countries: An investment perspective. J. Agric. Econ. 2000, 51, 266–288. [Google Scholar] [CrossRef]
Figure 1.
The chemical fertilizer application of crops in China (1978–2020).
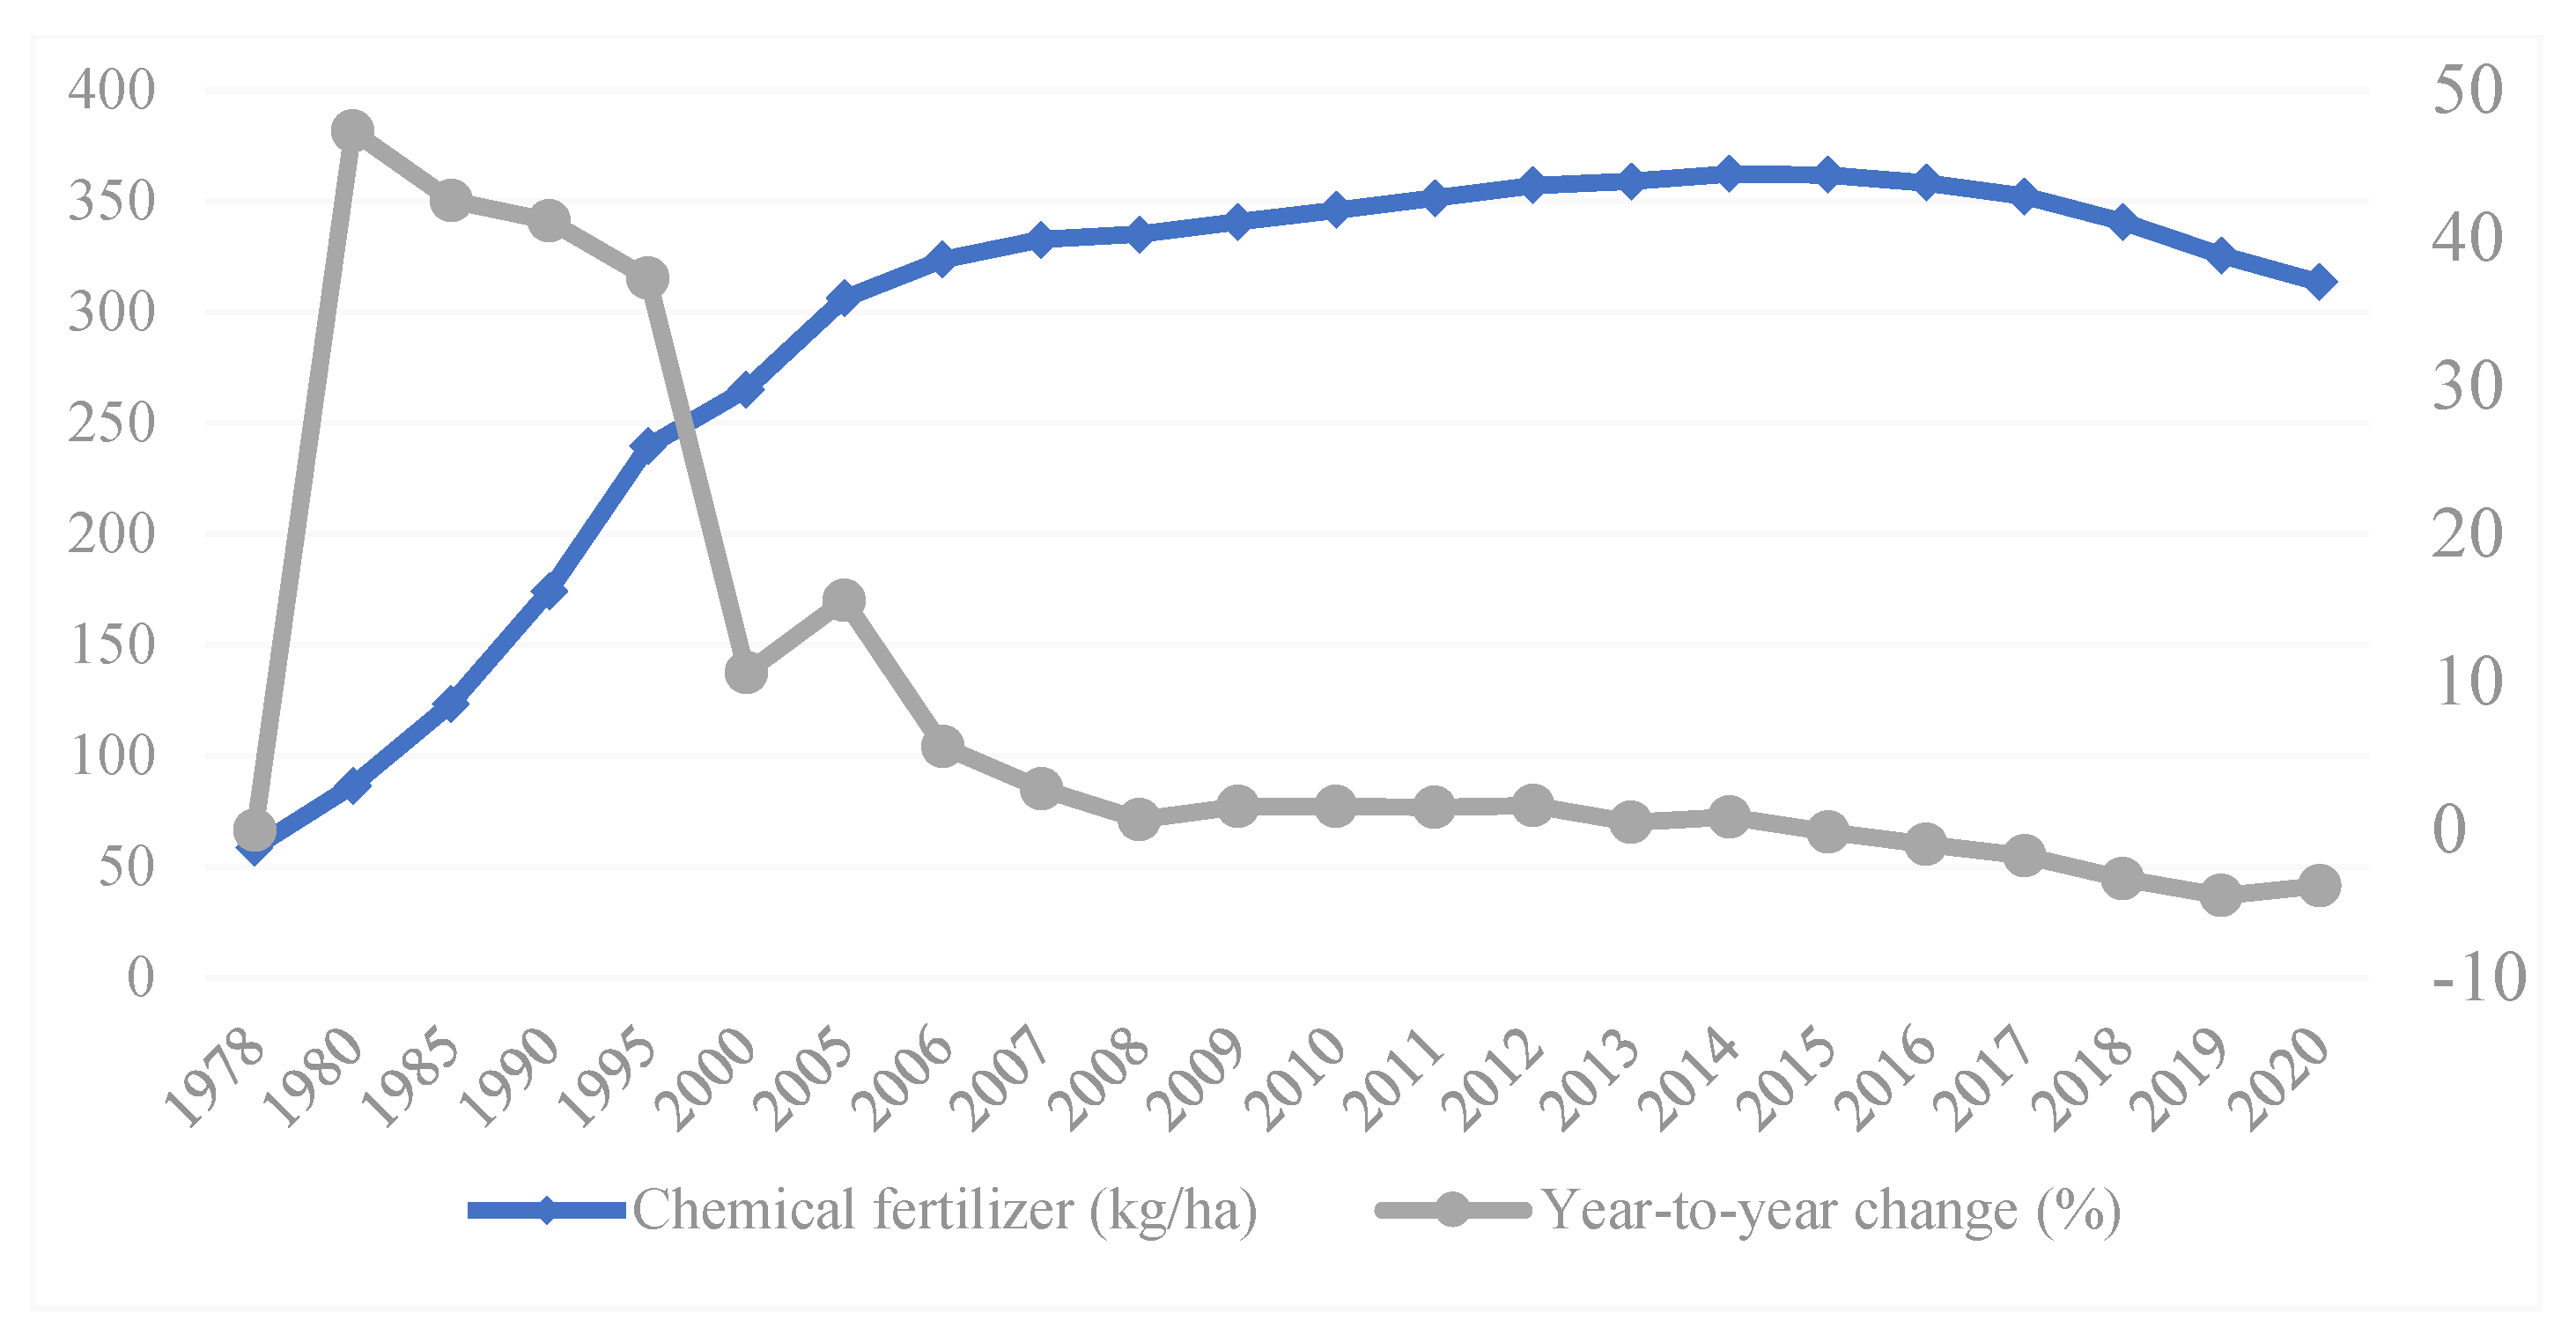
Figure 2.
The conceptual framework.

Table 1.
Variable and definition.
| Variable | Definition and Descriptions |
|---|---|
| Yield | Quantity of maize production per mu (kg/mu) |
| Labor | Number of days work on farm in maize production per mu (days/mu) |
| Fertilizer | Quantity of chemical fertilizer input in maize production per mu (kg/mu) 1 |
| Capital | The depreciation expenses of fixed assets investment of maize per mu (CNY/mu) 2 |
| Other | The sum of the expenses of seeds, organic fertilizer, irrigation, renting machines and other inputs in maize production per mu (CNY/mu) |
| CF | Quantity of chemical fertilizer usage in maize production per mu (kg/mu) |
| F_optimal | Quantity of optimum usage of chemical fertilizer per mu (kg/mu) |
| F_deviation | Chemical fertilizer usage deviation, measured using the quantity of chemical fertilizer subtract the quantity of optimum usage of chemical fertilizer (kg/mu) |
| APS adoption | “1” if the household adopt APSs, i.e., seeds purchasing, tillage, sowing, pest control, irrigation or harvesting, transportation, drying services, “0” otherwise |
| Farm size | The operated area of maize cropland (mu) |
| Labor migration | The ratio of labor employment in non-agricultural sector to household population |
| No. of plot | The number of plot of operated land, proxy of land fragmentation |
| Flat land | The percentage of the area of flat land to total operated land area |
| Sloped land | The percentage of the area of slope land to total operated land area |
| Hilly land | The percentage of the area of hill land to total operated land area 3 |
| Paddy land | The percentage of the area of paddy land to total operated land area |
| Dry land | The percentage of the area of dry land to total operated land area |
| Land quality | The self-rated quality of the operated land, “1” if the land is barren, “2” if is moderate or of low quality, “3” if is medium, “4” if is medium to high quality, “5” if is extremely fertile |
| Inward transfer | “1” if the household lease land to engage in maize production, “0” otherwise |
| Outward transfer | “1” if the household transfer land to engage in maize production, “0” otherwise |
| Land use rights | “1” if the land use rights were registered and certificated, “0” otherwise |
| Age | Age of the household head |
| Education | Education of the household head, “1” if illiterate, “2” if graduated from primary school, “3” if graduated middle school, “4” if graduated from high school or vocational high school, “5” if attended three-year college, “6” if attended university or graduate school |
| Male | “1” if household head is male, “0” otherwise |
| Official | “1” if the member of the household worked for the government, “0” otherwise |
| Organic_fer | “1” if the household used organic fertilizer, “0” otherwise |
| Technical guidance | “1” if the household received technical guidance, “0” otherwise |
| Social capital | The amount of friends and relatives the household reached to via WeChat, phone calls or meetings during spring festival |
| Fixed assets | The depreciation expenses of total fixed asset investment (CNY) |
| Machinery subsidy | “1” if the household received agricultural machinery purchasing subsidy, “0” otherwise |
| Hired labor | The days of hired labor divided by the total days input in maize production |
| Crop structure | The share of sales revenue of grains in agricultural income |
| East | “1” if located in eastern region, “0” otherwise |
| Central | “1” if located in central region, “0” otherwise |
| West | “1” if located in western region, “0” otherwise 4 |
1 We use the quantity of fertilizers, i.e., the unit expenses of fertilizers of each farm divided by the provincial price of fertilizers of maize production in 2018, as the measurement of fertilizer input variables. The provincial price of fertilizer is calculated using provincial unit cost of fertilizer divided by the provincial quantity of fertilizer used per unit land in 2018, which is from the “Compilation of Cost-benefit Data of Agricultural Products in China (2019)”. 2 The capital variable is measured using the unit cost of fixed asset investment of maize, where the fixed asset investment of maize is calculated using the total depreciation expenses of fixed assets times the ratio of maize’s output value to the total agricultural revenue. We use the provincial fixed asset investment price index in 2018, which is from “China Statistical Yearbook (2019)”, to eliminate the price factor. 3 The terrain of farmland is categorized into three types: flat land, sloped land and hilly land. 4 The sample provinces are categorized into three regions based on their geographic location.
Table 2.
Sample summary statistics.
| Variable | APS Adopters N = 689 | Non-Adopters N = 632 | t-Test Mean Diff. | t Statistic |
|---|---|---|---|---|
| Yield (kg/mu) | 519.80 (6.44) | 551.42 (6.36) | 31.62 *** (9.07) | 3.49 |
| Labor (days/mu) | 16.93 (0.90) | 11.89 (1.59) | −5.04 *** (1.86) | −2.71 |
| Fertilizer (kg/mu) | 24.12 (0.42) | 24.86 (0.53) | 0.74 (0.67) | 1.11 |
| F_deviation (kg/mu) | 15.52 (0.41) | 16.17 (0.47) | 0.64 (0.62) | 1.04 |
| F_optimum (kg/mu) | 9.50 (0.16) | 10.74 (0.16) | 1.24 *** (0.23) | 5.38 |
| Farm size (mu) | 18.37 (1.59) | 20.51 (1.43) | 2.14 (2.15) | 0.99 |
Note: One mu equals 0.0667 hectare. Standard errors are in parenthesis, *** p < 0.01.
Table 3.
Estimation results of output elasticity of chemical fertilizer.
| Dependent Variable: Ln Yield | ||
|---|---|---|
| Variable | Coef. | St.Err. |
| Ln Labor | 0.001 | 0.007 |
| Ln Fertilizer | −0.059 *** | 0.012 |
| Ln capital | 0.024 *** | 0.004 |
| Ln other | 0.096 *** | 0.011 |
| Age | 0.000 | 0.001 |
| Education | −0.015 | 0.009 |
| Male | 0.063 *** | 0.019 |
| No. of plot | 0.001 | 0.002 |
| Inward transfer | 0.076 *** | 0.020 |
| Land quality | 0.041 *** | 0.010 |
| Flat land | 0.045 * | 0.025 |
| Sloped land | −0.076 ** | 0.035 |
| Paddy land | −0.121 ** | 0.049 |
| _cons | 5.795 *** | 0.084 |
| Obs. | 1321 | |
Note: *** p < 0.01, ** p < 0.05, * p < 0.1.
Table 4.
Probit model estimation: probability to adopt production services index.
| Variable | (1) | (2) | (3) | (4) |
|---|---|---|---|---|
| Probit | Probit | OLS | OLS | |
| Ln Farm size | 0.139 | 0.070 | 0.048 | 0.016 |
| (0.137) | (0.045) | (0.046) | (0.015) | |
| Ln Farm size ^2 | −0.013 | −0.006 | ||
| (0.025) | (0.008) | |||
| Labor migration | 0.334 *** | 0.336 *** | 0.114 *** | 0.115 *** |
| (0.098) | (0.098) | (0.033) | (0.033) | |
| No. of plot | −0.036 *** | −0.037 *** | −0.008 *** | −0.008 *** |
| (0.011) | (0.011) | (0.003) | (0.003) | |
| Flat land | 0.532 *** | 0.529 *** | 0.191 *** | 0.190 *** |
| (0.128) | (0.128) | (0.041) | (0.041) | |
| Sloped land | 0.890 *** | 0.879 *** | 0.299 *** | 0.295 *** |
| (0.173) | (0.172) | (0.057) | (0.056) | |
| Paddy land | −0.535 ** | −0.532 ** | −0.180 ** | −0.181 ** |
| (0.268) | (0.268) | (0.083) | (0.083) | |
| Dry land | −0.113 ** | −0.113 ** | −0.009 ** | −0.009 ** |
| (0.050) | (0.050) | (0.004) | (0.004) | |
| Age | 0.005 | 0.005 | 0.002 | 0.002 |
| (0.004) | (0.004) | (0.001) | (0.001) | |
| Education | 0.083 * | 0.083 * | 0.029 * | 0.029 * |
| (0.046) | (0.046) | (0.015) | (0.015) | |
| Male | 0.166 * | 0.168 * | 0.055 * | 0.056 * |
| (0.090) | (0.090) | (0.030) | (0.030) | |
| Social capital | 0.002 | 0.002 | 0.001 | 0.001 |
| (0.002) | (0.002) | (0.001) | (0.001) | |
| Technical guidance | 0.223 ** | 0.225 ** | 0.074 ** | 0.075 ** |
| (0.103) | (0.103) | (0.034) | (0.034) | |
| Machinery subsidy | −0.186 | −0.186 | −0.060 | −0.060 |
| (0.230) | (0.230) | (0.078) | (0.078) | |
| East | 1.442 *** | 1.450 *** | 0.461 *** | 0.464 *** |
| (0.152) | (0.151) | (0.045) | (0.045) | |
| Central | 0.950 *** | 0.953 *** | 0.285 *** | 0.286 *** |
| (0.153) | (0.153) | (0.045) | (0.045) | |
| Ln Fixed assets | −0.014 | −0.014 | −0.004 | −0.004 |
| (0.012) | (0.012) | (0.004) | (0.004) | |
| _cons | −2.209 *** | −2.148 *** | −0.253 ** | −0.225 ** |
| (0.363) | (0.344) | (0.117) | (0.109) | |
| Obs. | 1321 | 1321 | 1321 | 1321 |
Note: Standard errors are in parenthesis, *** p < 0.01, ** p < 0.05, * p < 0.1
Table 5.
Mediation model estimation results.
| Variable | (1) | (2) | (3) | (4) | (5) | (6) |
|---|---|---|---|---|---|---|
| Fertilizer | Ln Farm Size | Fertilizer | F_deviation | Ln Farm Size | F_deviation | |
| Service_p | −20.066 *** | 2.487 *** | −17.480 *** | −18.034 *** | 2.487 *** | −12.846 ** |
| (5.503) | (0.421) | (5.560) | (5.156) | (0.421) | (5.150) | |
| Ln Farm size | −1.040 *** | −2.086 *** | ||||
| (0.361) | (0.334) | |||||
| Labor migration | 3.147 *** | −0.769 *** | 2.347 ** | 3.355 *** | −0.769 *** | 1.751 * |
| (1.013) | (0.078) | (1.047) | (0.949) | (0.078) | (0.970) | |
| Organic_fer | −2.157 ** | 0.031 | −2.125 ** | −2.959 *** | 0.031 | −2.894 *** |
| (0.917) | (0.070) | (0.915) | (0.860) | (0.070) | (0.848) | |
| Official dummy | 2.014 ** | 0.069 | 2.085 ** | 1.794 ** | 0.069 | 1.938 ** |
| (0.943) | (0.072) | (0.941) | (0.884) | (0.072) | (0.871) | |
| Technical guidance | 1.219 | −0.020 | 1.197 | 1.295 | −0.020 | 1.252 |
| (0.964) | (0.074) | (0.961) | (0.903) | (0.074) | (0.890) | |
| Crop structure | −2.106 ** | 0.537 *** | −1.547 * | −2.810 *** | 0.537 *** | −1.689 ** |
| (0.894) | (0.068) | (0.912) | (0.838) | (0.068) | (0.845) | |
| Land use rights | 2.617 | 0.224 | 2.850 | 2.573 | 0.224 | 3.041 |
| (2.753) | (0.211) | (2.747) | (2.580) | (0.211) | (2.544) | |
| No. of plot | 0.079 | 0.112 *** | 0.195 ** | 0.032 | 0.112 *** | 0.265 *** |
| (0.081) | (0.006) | (0.091) | (0.076) | (0.006) | (0.084) | |
| Flat land | 5.487 *** | −0.443 *** | 5.026 *** | 5.049 *** | −0.443 *** | 4.124 *** |
| (1.473) | (0.113) | (1.478) | (1.381) | (0.113) | (1.369) | |
| Sloped land | 1.599 | −0.794 *** | 0.774 | 2.417 | −0.794 *** | 0.761 |
| (2.047) | (0.157) | (2.061) | (1.918) | (0.157) | (1.909) | |
| Hired labor | −1.888 | 0.407 *** | −1.465 | −2.100 | 0.407 *** | −1.251 |
| (1.448) | (0.111) | (1.452) | (1.357) | (0.111) | (1.345) | |
| Land quality | 1.266 *** | 0.060 * | 1.329 *** | 0.418 | 0.060 * | 0.544 |
| (0.416) | (0.032) | (0.416) | (0.390) | (0.032) | (0.385) | |
| Age | 0.030 | −0.025 *** | 0.004 | 0.054 * | −0.025 *** | 0.002 |
| (0.033) | (0.003) | (0.034) | (0.031) | (0.003) | (0.032) | |
| Education | −0.181 | −0.204 *** | −0.394 | 0.310 | −0.204 *** | −0.116 |
| (0.424) | (0.032) | (0.429) | (0.397) | (0.032) | (0.397) | |
| Male | −0.319 | 0.070 | −0.246 | −0.904 | 0.070 | −0.757 |
| (0.829) | (0.063) | (0.827) | (0.777) | (0.063) | (0.766) | |
| East | 14.767 *** | −0.693 *** | 14.046 *** | 12.920 *** | −0.693 *** | 11.474 *** |
| (2.893) | (0.221) | (2.895) | (2.711) | (0.221) | (2.682) | |
| Central | 6.302 *** | 0.222 | 6.533 *** | 5.757 *** | 0.222 | 6.220 *** |
| (2.034) | (0.156) | (2.030) | (1.906) | (0.156) | (1.880) | |
| _cons | 14.634 *** | 2.200 *** | 16.922 *** | 7.370 * | 2.200 *** | 11.960 *** |
| (4.034) | (0.309) | (4.100) | (3.780) | (0.309) | (3.798) | |
| Obs. | 1321 | 1321 | 1321 | 1321 | 1321 | 1321 |
Note: Standard errors are in parenthesis, *** p < 0.01, ** p < 0.05, * p < 0.1
Table 6.
Direct effect of APS on actual usage of chemical fertilizer.
| Variable | (1) | (2) | (3) | (4) | (5) | (6) |
|---|---|---|---|---|---|---|
| Transferred Land | Didn’t Transfer Land | Used Traditional Techniques | Used Mechanized Techniques | Used Fertilizer Service | Didn’t Use Fertilizer Service | |
| Service_p | −11.298 | −24.628 *** | −15.238 | −19.420 *** | −30.165 ** | −17.633 *** |
| (8.537) | (7.371) | (19.929) | (5.796) | (12.372) | (6.128) | |
| Labor migration | −2.133 | 3.981 *** | 3.868 | 2.263 ** | 1.339 | 2.969 *** |
| (2.092) | (1.208) | (2.970) | (1.095) | (2.236) | (1.138) | |
| Organic_fer | −7.438 *** | −0.708 | −9.614 *** | −0.700 | 5.175 *** | −4.622 *** |
| (1.954) | (1.069) | (2.507) | (1.001) | (1.706) | (1.085) | |
| Official dummy | 2.674 | 1.567 | 2.212 | 2.048 ** | −0.434 | 2.221 ** |
| (1.637) | (1.147) | (2.573) | (1.012) | (1.927) | (1.078) | |
| Technical guidance | −3.461 * | 2.764 ** | 4.018 | 0.433 | 2.223 | 0.998 |
| (1.799) | (1.160) | (2.912) | (1.040) | (1.897) | (1.099) | |
| Crop structure | −1.267 | −1.767 * | −7.169 ** | −1.267 | −5.475 *** | −1.621 |
| (1.740) | (1.060) | (3.090) | (0.943) | (2.062) | (0.999) | |
| Land use rights | 3.439 | 2.605 | −9.002 | 4.589 | 8.994 | 2.169 |
| (5.221) | (3.219) | (8.342) | (2.919) | (9.939) | (2.892) | |
| No. of plot | 0.056 | 0.184 | −0.093 | 0.077 | −0.046 | 0.095 |
| (0.116) | (0.148) | (0.317) | (0.085) | (0.318) | (0.087) | |
| Flat land | 7.290 *** | 5.833 *** | 4.950 | 5.780 *** | 16.206 *** | 4.389 *** |
| (2.638) | (1.814) | (4.314) | (1.589) | (3.860) | (1.612) | |
| Sloped land | −2.528 | 3.827 | 4.808 | 1.452 | 8.156 | 0.615 |
| (3.414) | (2.603) | (6.137) | (2.192) | (5.252) | (2.231) | |
| Hired labor | 1.446 | −3.631 * | −1.226 | −1.964 | −8.126 * | −0.505 |
| (2.332) | (1.923) | (4.038) | (1.544) | (4.472) | (1.553) | |
| Land quality | 0.461 | 1.643 *** | 2.073 ** | 1.013 ** | −1.373 | 1.558 *** |
| (0.841) | (0.476) | (0.966) | (0.460) | (1.146) | (0.450) | |
| Age | 0.115 | 0.012 | −0.040 | 0.033 | 0.081 | 0.018 |
| (0.074) | (0.038) | (0.087) | (0.036) | (0.069) | (0.037) | |
| Education | −1.575 * | 0.089 | 0.783 | −0.411 | 1.297 | −0.356 |
| (0.894) | (0.487) | (1.225) | (0.452) | (0.788) | (0.501) | |
| Male | −2.919 * | 0.464 | −3.049 | 0.188 | 2.297 | −0.753 |
| (1.597) | (0.983) | (2.242) | (0.897) | (1.837) | (0.924) | |
| East | 5.788 | 18.013 *** | 16.870 | 12.824 *** | 18.454 ** | 13.591 *** |
| (4.614) | (3.845) | (10.459) | (3.049) | (7.868) | (3.213) | |
| Central | −1.347 | 8.502 *** | 10.327 | 4.121 * | 7.871 | 5.319 ** |
| (3.586) | (2.638) | (6.994) | (2.172) | (6.201) | (2.229) | |
| _cons | 22.731 *** | 11.314 ** | 26.120 ** | 14.746 *** | 5.737 | 15.820 *** |
| (7.947) | (4.726) | (11.844) | (4.306) | (12.321) | (4.377) | |
| Obs. | 341 | 980 | 194 | 1127 | 227 | 1094 |
Note: Standard errors are in parenthesis, *** p < 0.01, ** p < 0.05, * p < 0.1.
Table 7.
Direct effect of APS on deviant usage of chemical fertilizer.
| Variable | (1) | (2) | (3) | (4) | (5) | (6) |
|---|---|---|---|---|---|---|
| Transferred Land | Didn’t Transfer Land | Used Traditional Techniques | Used Mechanized Techniques | Used Fertilizer Service | Didn’t Use Fertilizer Service | |
| Service_p | −13.996 * | −19.796 *** | −0.895 | −20.015 *** | −25.189 ** | −16.669 *** |
| (8.289) | (6.839) | (17.489) | (5.470) | (12.197) | (5.660) | |
| Labor migration | −2.175 | 3.909 *** | 3.343 | 2.845 *** | −0.573 | 3.473 *** |
| (2.031) | (1.121) | (2.607) | (1.034) | (2.204) | (1.051) | |
| Organic_fer | −5.991 *** | −2.649 *** | −8.963 *** | −1.887 ** | 2.870 * | −5.196 *** |
| (1.897) | (0.992) | (2.200) | (0.945) | (1.682) | (1.002) | |
| Official dummy | 2.309 | 1.528 | 1.485 | 1.939 ** | −0.547 | 2.272 ** |
| (1.590) | (1.064) | (2.258) | (0.955) | (1.900) | (0.995) | |
| Technical guidance | −1.555 | 1.998 * | 4.343 * | 0.393 | 3.032 | 0.762 |
| (1.747) | (1.076) | (2.556) | (0.982) | (1.870) | (1.015) | |
| Crop structure | −1.953 | −2.678 *** | −5.792 ** | −2.134 ** | −8.049 *** | −1.890 ** |
| (1.690) | (0.983) | (2.711) | (0.890) | (2.033) | (0.923) | |
| Land use rights | 3.012 | 2.415 | −17.770 ** | 5.546 ** | 14.317 | 1.562 |
| (5.069) | (2.987) | (7.320) | (2.754) | (9.798) | (2.671) | |
| No. of plot | 0.011 | 0.175 | 0.136 | 0.006 | −0.051 | 0.052 |
| (0.112) | (0.137) | (0.278) | (0.080) | (0.313) | (0.080) | |
| Flat land | 7.130 *** | 5.080 *** | −1.402 | 6.169 *** | 11.445 *** | 4.533 *** |
| (2.561) | (1.683) | (3.785) | (1.499) | (3.805) | (1.489) | |
| Sloped land | −0.802 | 4.563 * | 1.247 | 3.132 | 5.591 | 1.851 |
| (3.315) | (2.415) | (5.385) | (2.069) | (5.178) | (2.061) | |
| Hired labor | 1.271 | −3.027 * | −0.972 | −2.178 | −9.571 ** | −0.460 |
| (2.264) | (1.784) | (3.543) | (1.457) | (4.409) | (1.434) | |
| Land quality | 0.242 | 0.582 | 1.732 ** | 0.077 | −1.324 | 0.571 |
| (0.816) | (0.441) | (0.848) | (0.434) | (1.130) | (0.415) | |
| Age | 0.119 * | 0.034 | −0.057 | 0.062 * | 0.102 | 0.036 |
| (0.072) | (0.035) | (0.077) | (0.034) | (0.068) | (0.034) | |
| Education | −1.585 * | 0.705 | 0.319 | 0.237 | 1.683 ** | 0.117 |
| (0.868) | (0.452) | (1.075) | (0.427) | (0.777) | (0.462) | |
| Male | −1.784 | −0.814 | −4.122 ** | −0.295 | 1.214 | −1.121 |
| (1.551) | (0.912) | (1.967) | (0.846) | (1.811) | (0.853) | |
| East | 5.956 | 15.004 *** | 8.445 | 12.431 *** | 24.683 *** | 11.717 *** |
| (4.479) | (3.568) | (9.178) | (2.877) | (7.756) | (2.968) | |
| Central | −2.114 | 7.845 *** | 5.617 | 4.560 ** | 18.168 *** | 4.212 ** |
| (3.481) | (2.448) | (6.138) | (2.050) | (6.113) | (2.059) | |
| _cons | 14.990 * | 5.021 | 32.046 *** | 5.720 | −13.067 | 9.490 ** |
| (7.716) | (4.385) | (10.394) | (4.064) | (12.146) | (4.042) | |
| Obs. | 341 | 980 | 194 | 1127 | 227 | 1094 |
Note: Standard errors are in parenthesis, *** p < 0.01, ** p < 0.05, * p < 0.1
Publisher’s Note: MDPI stays neutral with regard to jurisdictional claims in published maps and institutional affiliations. |
© 2022 by the authors. Licensee MDPI, Basel, Switzerland. This article is an open access article distributed under the terms and conditions of the Creative Commons Attribution (CC BY) license (https://creativecommons.org/licenses/by/4.0/).
Share and Cite
MDPI and ACS Style
Huan, M.; Zhan, S. Agricultural Production Services, Farm Size and Chemical Fertilizer Use in China’s Maize Production. Land 2022, 11, 1931. https://doi.org/10.3390/land11111931
AMA Style
Huan M, Zhan S. Agricultural Production Services, Farm Size and Chemical Fertilizer Use in China’s Maize Production. Land. 2022; 11(11):1931. https://doi.org/10.3390/land11111931
Chicago/Turabian StyleHuan, Meili, and Shaoguo Zhan. 2022. "Agricultural Production Services, Farm Size and Chemical Fertilizer Use in China’s Maize Production" Land 11, no. 11: 1931. https://doi.org/10.3390/land11111931
Note that from the first issue of 2016, this journal uses article numbers instead of page numbers. See further details here.