
Spatial Accessibility of Multiple Facilities for Affordable Housing Neighborhoods in Harbin, China


1
Law School, Zhejiang University City College, Hangzhou 310015, China
2
School of Management, Lanzhou University, Lanzhou 730000, China
3
School of Architecture and Civil Engineer, Heilongjiang University of Science and Technology, Harbin 150022, China
4
College of Urban Construction, Zhejiang Shuren University, Hangzhou 310015, China
5
School of Public Administration, Zhejiang Gongshang University, Hangzhou 310018, China
*
Author to whom correspondence should be addressed.
Land 2022, 11(11), 1940; https://doi.org/10.3390/land11111940
Submission received: 25 September 2022
/
Revised: 28 October 2022
/
Accepted: 28 October 2022
/
Published: 31 October 2022
(This article belongs to the Special Issue Territorial Infrastructures, Real Estate and Socio-Economic Impacts)
Abstract
:The spatial mismatch between affordable housing neighborhoods and public services/facilities significantly reduces the well-being of low-income dwellers, which has risen to a typical issue of spatial injustice. Previous studies on accessibility evaluation most focus on a single type of service, lacking empirical studies exploring the integrated spatial accessibility of multiple services for low-income residents. Taking Harbin City in northeast China as an example, this study assessed the spatial accessibility of transit, education, healthcare, shopping, and recreation facilities for affordable housing neighborhoods, using the Gaussian-based 2SFCA method. The pattern of accessibility for each type of facility in Harbin showed obvious spatial differentiation between the urban core and the city periphery, for both affordable housing neighborhoods and other neighborhoods. The sample household survey indicated that low-income households who were generally characterized as elderly, less-educated, under-employed or unemployed had extremely restricted and passive residence choices. In comparison to non-low-income households, the spatial accessibility of higher-level facilities for low-income households was relatively poorer. Particularly, affordable housing neighborhoods had much lower accessibility of subway stations, though more than 97% of low-income respondents living in affordable housing neighborhoods chose to solve the daily trip demand by taking a bus or the subway. With respect to equity-oriented urban planning, more importance should be attached to the spatial accessibility of public services and facilities when planning affordable housing projects for low-income households.
1. Introduction
The issue of spatial injustice and social exclusion among low-income groups has attracted global attention [1,2,3]. Referring to the theory of spatial justice [4,5,6,7], the concept of spatial justice embodies physical justice, urbanization of social justice, and the right to the city [7,8]. Housing is one of the most important rights to the city that is not affordable for low-income families. To eliminate housing difficulties for low-income families, numerous countries have made great efforts to promote affordable housing programs, such as public housing in the U.S. [9], affordable and social housing in the UK [10], social housing in France [11], public housing in Japan [12], public housing flats in Singapore [13], etc. Since the late 20th century, China has been successively promoting various types of affordable housing1, consisting of low-rent housing, economic and comfortable housing, public rental housing, and shared ownership housing [14,15]. However, the grim fact remains that the distribution of affordable housing in most countries suffers from inferior location [16,17], especially in the earlier phases, which limits the spatial accessibility of low-income dwelling neighborhoods [18,19,20]. It also implies a mismatch between the neighborhoods where low-income families dwell and the distribution of spatial resources, based on the spatial mismatch hypothesis [21]. The location of housing neighborhoods and the frequently visited service/facility locations are important “anchors” of daily activity spaces [22]. Compared with non-low-income groups, low-income groups tend to have lower mobility [22,23], being isolated from activities in space and time and deprived of equitable access to spatial resources. Previous studies have focused on the spatial accessibility of public services/facilities [24,25], which is closely related to human health and life quality [23,26]. Evidence shows that inequalities in the ability to access available resources, especially public services/facilities, can produce further inequalities in living standards and physical/mental health, resulting in a weaker sense of belonging and lower satisfaction among those who live in affordable housing [27]. From this perspective, it is a prominent spatial injustice phenomenon if low-income dwelling neighborhoods are equipped with lower spatial accessibility [28].
Although a certain amount of the literature pertains to accessibility evaluation, most of these studies focus on a single type of facility, particularly the spatial accessibility of public transport [23,29], green spaces [30,31], educational services [32,33], and healthcare services [34,35]. Few empirical studies have evaluated the integrated spatial accessibility of multiple types of public facilities (except [24,27]). There have been various categories of accessibility measures [36,37], and the most commonly used methods in recent research include travel impedance (straight line/network distance or time) to the nearest service analysis [38,39], gravity-based models [40], the two-step floating catchment area (2SFCA) method [41,42], and their enhanced models [35,43,44,45]. These methods have their advantages and limitations [37,42], in terms of the two components (i.e., availability and proximity) of spatial accessibility [41]. For instance, the nearest service impedance method only measures proximity between the locations of service providers and the population, with no account taken of availability, which depends on the capacity of the service provider and the scale of the population [42]. The gravity-based model has remarkable advantages in capturing supply and demand features while considering distance decay effects [40], but was always criticized for the difficulty in empirically determining the frictional coefficient β in the distance decay function [37,43]. While the 2SFCA method has most of the advantages of the gravity model and is more intuitive to interpret [41], it is accused of uniform catchment size, which means that all facilities have the same attraction [31,46]. An enhanced two-step floating catchment area (E2SFCA) method was proposed [43], by introducing weights to different travel time zones within a catchment to account for the distance decay, with the travel time zones derived based on the ArcGIS Network Analyst tool. The E2SFCA method has the advantages of being more consistent with intuition and more spatially explicit than the conventional 2SFCA method [43]; however, it does not differentiate the accessibility within a zone [45]. To rectify the above defect, a Gaussian-based 2SFCA method was developed [45], by integrating the Gaussian function to continuously discount the access within a catchment. The Gaussian-based 2SFCA method has been applied to effectively delineate the spatial accessibility of green spaces [30,31,46,47], recreation services [48], and healthcare services [49,50], thus having the potential for estimating access to multiple public facilities.
Based on the above discussions, comparatively inadequate research has been conducted into the spatial mismatch of multiple public facilities for low-income dwelling neighborhoods. Even so, the previous methods and existing case studies are of significant reference for this paper. This paper adds to the literature on the spatial accessibility of affordable housing neighborhoods by conducting a synthetic evaluation of accessibility of multiple public facilities, with Harbin City as the study area. The Gaussian-based 2SFCA method is adopted to measure the access to public facilities for each census population grid, based on the 2020 Census and POI data of public transit facilities, educational facilities, healthcare facilities, commercial facilities, and recreation facilities. A comparative analysis between accessibility measures of affordable housing neighborhoods and those of other housing neighborhoods is conducted. Furthermore, this study also includes perceptions toward spatial accessibility from affordable housing neighborhood residents through a sample household survey. The results will contribute to an understanding of spatial deprivation in the accessibility of multiple facilities/services from the perspective of spatial justice, and to providing better policies for equity-oriented planning for affordable housing, which are of great significance for the improvement of public health and urban livability for low-income residents.
The rest of this paper is organized as follows. Section 2 depicts the study area, data, and methods. Section 3 presents the evaluation results of spatial access to public services/facilities in the study area and the accessibility deprivation of affordable housing neighborhoods compared with reference housing neighborhoods. Section 4 analyzes low-income households’ perceptions of spatial accessibility based on a questionnaire survey of low-income residents in affordable housing neighborhoods, and discusses the policy implications of the analysis. Finally, Section 5 summarizes the findings and proposes a future research agenda.
2. Materials and Methods
2.1. Public Rental Housing in Harbin
Harbin (125°42′–130°10′ E, 44°04′–46°40′ N) is a mega-city in northeast China, the capital of Heilongjiang Province, with an area of 53,100 km2. The seventh national census showed that the resident population of Harbin was 10.99 million in 2020, a 5.89% decline from that of the sixth national census in 2010. Although it is not a city with a net inflow of population, Harbin still has a certain demand for affordable rental housing, according to the statement of Heilongjiang Province’s 14th Five-Year Plan for Urban Housing Development in 2021. Harbin City has been implementing the comfortable housing project since 1995. However, the housing units were collected mainly through the acquisition of previously owned houses in the market before 2007; thus, the quantity was limited. In 2007, it was stipulated that 2% of new residential projects should be allocated as low-rent housing. Subsequently, it was stipulated that public rental housing should account for 5% of new residential projects in 2011. Thereby, a housing security system was gradually established, with public rental housing security as the dominant component. Harbin City ceased incremental construction of public rental housing in 2015, and gradually shifted to a rental subsidies-based housing security system. Up to 2021, the city had 52,000 families eligible for affordable housing2, and all of them were covered by housing apportion or rental subsidies. From 2007 to 2021, the total amount of households covered by the public rental housing policy gradually increased from 240 to 34,000. The distribution of these public rental housing units is concentrated in the districts of Daoli, Daowai, Nangang, Xiangfang, Pingfang, and Songbei. Thereby, the above six districts are selected as the study area in this paper (Figure 1), which covers a total area of 2460 km2 and is planned as a polycentric layout that consists of the main center and several clusters, according to the 2017 version of the Harbin Urban Master Plan (2011–2020).
Public rental housing units between 2018 and 2021 (Table 1) were collected from the Harbin Municipal Government website, http://www.harbin.gov.cn/ (accessed on 23 May 2022). The authors plotted the location of 185 public rental housing neighborhoods between 2018 and 2021 and other housing neighborhoods in 2020 based on the Gaode map (Figure 2a) and converted the GCJ02 coordinate system to the WGS84 coordinate system. The number of public rental housing units allocated in each district is determined by the number of eligible applicants who have passed the annual audit in the pool of public rental housing. In 2018, three categories of families and priority families were allocated public rental housing at a ratio of 1:1 and 1:1.2, respectively. In 2019, there were 11,547 units of public rental housing available for the first and second categories of ordinary families, and there were 27,054 applicants, with a winning rate of 42.68%. There were 2755 units of public rental housing allocated at a ratio of 1:1.1 to 2499 families in 2020. In 2021, only 4785 units of housing were available to 15,700 families who were declared as the first and second categories of public rental housing applicants, and each district matched the housing units with an average winning rate of approximately 30.4%.
2.2. Correction of Demographic Data
Census units were mostly employed as research units for residential neighborhoods in previous accessibility studies. However, the smallest census unit (i.e., the sub-district) in China is much bigger than a residential neighborhood [27]. An alternative approach to improve the spatial resolution is to divide the urban study area into regular grids [49]. This study adopted 1000 × 1000 m grids as the basic analytical units, thereby making the demand for public services/facilities be delineated in a fine spatial resolution. The 1000 × 1000 m fishnets were created based on the China 100 m population data obtained from the WorldPop 2020 population distribution raster dataset3. The dataset applies a spatialization method of population data based on the random forest model, which is well documented in Lloyd et al. [51] for details of the methodology and technical validation. Furthermore, a correcting calculation of the China 100 m population data was conducted combined with the seventh national census of Harbin sub-districts in 2020, which was obtained from the Harbin Bureau of Statistics. Finally, the 1 km × 1 km cells were assigned the number of residents (Figure 2b), among which the cells of Lujia Street, Tongda Street, Quxian Street, Xinle Street, Jingyu Street, Daxing Street, Hongqi Street, Minsheng Road Street, Xiangfang Street, and Anjing Street are relatively densely populated. The overall layout shows that residents concentrated in the main center of Harbin city, while the population density of other urban clusters was at a slightly lower level.
2.3. POI Data of Public Services/Facilities
Public service facilities generally consist of transportation, medical care, education, leisure, culture, commerce, social security, community services, etc. Based upon a survey of the literature [23,24,27,29,31], the present study selected the most often studied facilities, namely transit, education, healthcare, shopping, and recreation facilities, to investigate the spatial distribution relationship between public services/facilities and public rental housing neighborhoods. In terms of transit facilities, the main travel mode for low-income households is public transportation; thus, the point data of bus stops and subway stations were selected for transportation accessibility analysis. Junior schools, primary schools, and kindergartens were selected as the objects of educational facilities. With the improvement in living standards, people are more and more concerned about their health, and the accessibility of healthcare facilities such as hospitals and community health centers was of concern. The central urban areas have gathered most of the city’s high-quality medical resources. Hospitals in the peripheral areas of the city are fewer in quantity or inferior in quality, while the distribution of community health centers is relatively more uniform. Malls, supermarkets, and convenience stores were selected as commercial facilities in this study. Recreation facilities such as municipal parks, museums, and exhibition halls were collected, which impact residents’ mental health significantly. Most of the above facilities exhibit a higher density in the urban center and become more dispersed further toward the suburbs. Meanwhile, several public service sub-centers have emerged in the peripheral urban areas of Harbin, which is perceived as a polycentric city. The POI data of public services/facilities, obtained from the Gaode map in 2021, were purified and converted from the GCJ02 coordinate system to the WGS84 coordinate system.
2.4. The Gaussian-Based 2SFCA Method
Although there are mild differences among the factors for measuring the accessibility of different categories of public facilities, they are generally consistent in common factors such as the distribution of the surrounding population (i.e., demand factor), the number and layout of service facilities (i.e., supply factor), and transportation connection [52,53,54,55,56,57]. By advancing the 2SFCA method based on a Gaussian function, the Gaussian-based 2SFCA method continuously differentiates access within the catchment of each neighborhood [30,45], assuming public facilities beyond this catchment to be inaccessible to the residents [31]. The Gaussian-based 2SFCA method can be realized in two steps [31,46]: The first step is to search all residents within the catchment for each supply center and calculate the supply-to-demand ratio for each supply center; The second step is to set the catchment for each demand center and sum all the supply-to-demand ratio that falls within the catchment of that demand center.
In the first step, the supply-to-demand ratio of supply center i (Ri) is written as [46]:
where is the capacity of public service/facility at location i; is the travel cost (distance or time) between supply center i (i.e., public service/facility location) and demand center j (i.e., population location); d0 denotes the catchment size (i.e., the threshold travel cost); is the residents of demand center j whose centroid falls into the catchment (i.e., ) of supply center i. For each public service/facility location i, search all population locations (j) that are within the distance of from i, thus formulating the catchment for the public service/facility at i. Residents at j will be weighted using a weighted distance decay function (G), regarding the weighted residents within the catchment as the potential users for the public service/facility at i. G is the friction-of-distance listed below:
In the second step, the supply-to-demand ratio of demand center j (Aj) is written as [46]:
where i denotes all public services/facilities within the catchment of population location j, and all other notations are the same as in Equation (1). The accessibility score (Aj) suggests the number of public services/facilities for every 10,000 residents in a neighborhood. For each population location j, search all public service/facility i within the threshold distance d0 from j, thus formulating the catchment for the population at j. Discount each Ri using the Gaussian function and sum up discounted Ri within the catchment area for j to obtain the spatial accessibility at population location j.
An operational measure of travel distance is important for evaluating spatial accessibility. The most popular measure at present is the shortest path based on road networks [18,30,44], which has set stringent requirements for road network data. In cases when the road network data are not available or out of date, the straight-line (or Euclidian) distance is a reasonable proxy for travel cost [27,58]. It has been shown that straight-line distance is highly correlated with travel time [58] and that the shortest path distance is between 1.2 and 1.4 times the straight-line distance [59]. Therefore, this study employed straight-line distance to estimate the access from population grids to facilities.
It is vital to choose the appropriate catchment size (d0) according to the service/impact range of each category/level of facility. The service radius of public facilities varies from municipal facilities to community facilities [24], and from higher-level facilities to lower-level facilities [27]. Hence, thresholds ranging from 1 km to 5 km were adopted in this study (Table 2), with reference to previous research and the Urban Residential Community Planning and Design Standards (GB50180-2018). Although the service radius of municipal services such as hospitals, museums, and municipal parks is supposed to cover the entire city, this study designated 5 km as a reasonable catchment size for facilities s5, s9, and s10, referring to [38,60], to compare the disparity between one community and another. The service radius of community facilities is within a 2 km range [24]; hence, the catchment sizes of junior schools (s3) and malls and supermarkets (s7) were set as 2 km. The service radius of neighborhood facilities is typically in the 1 km range [24]; accordingly, a catchment size of 1km was assigned to the other facilities such as subway stations (s1), bus stations (s2), primary schools, and kindergartens (s4), community health centers (s6), and convenience stores (s8). Furthermore, this study took the “edge effect” into account, where it is commonly recognized that residents within the border may use facilities outside of the study area and vice versa. A 5 km buffer was obtained surrounding the study area (Figure 1), assuming that the residents in the study area would only routinely utilize facilities within this boundary and would not regularly go beyond it.
3. Results
3.1. Accessibility Scores of Multiple Sub-Types of Facilities
In Harbin, urban areas where most of the population gather are also areas where public facilities are densely located. The older urban area, which is more densely populated, has a greater density of facilities, whereas the facilities in the new urban area are more scattered and often smaller. Therefore, it is difficult to distinguish the spatial mismatch between public services/facilities supply and population distribution with the naked eye. The spatial accessibility of various types of public facilities was evaluated using the Gaussian-based 2SFCA method based on different catchments (Figure 3). The accessibility score represents the number of public facilities per ten thousand residents. With regard to the uneven scales, the accessibility scores for each sub-type of the facility are classified into five levels using the “Jenks natural breaks classification” method in ArcGIS. The five levels of accessibility are further reclassified as 1, 2, 3, 4, and 5, referring to low, medium-low, medium, medium-high, and high level.
The average accessibility of subway stations for population cells was 0.04, and its standard deviation (S.D.) was 0.20. There were 2494 cells (93.02%) that belonged to low level of subway accessibility, 111 cells belonged to medium-low level or medium level, and only 76 cells (2.83%) belonged to medium-high or high level. For the sub-type facility of bus stops, the mean value and S.D. of accessibility were 9.20 and 16.09, respectively, with 65.42% cells at low level and 7.27% cells at medium-high or high level. Accessibility scores for junior schools at a 2 km catchment size averaged out to 0.21, with a fraction of cells at medium-high or high level (3.54%), and more than three-quarters low-level cells, though at a smaller catchment size, the average accessibility of primary schools and kindergartens (about 1.13) was higher than that of junior schools. For this sub-type of facility, there were 1954 population cells (72.88%) evaluated as low level, and 178 cells (6.64%) evaluated as medium-high or high level. The mean accessibility levels of hospitals (0.11) and of community health centers (0.45) were relatively low, with low-accessibility-level cells accounting for 71.39% and 84.89%, respectively. In terms of the accessibility scores for malls and supermarkets, there were 2141 cells (79.86%) that belonged to low level, and only 50 cells (1.86%) that belonged to medium-high or high level. The accessibility of convenience stores was evaluated at a smaller catchment size in comparison to malls and supermarkets, while the average score for convenience stores (4.22) far exceeded the average for malls and supermarkets (0.34). The mean accessibility score for museums and exhibition halls was only 0.13, while the mean municipal park accessibility score was even lower (0.06), at a 5 km catchment size. For these two sub-types of facilities, population cells at low accessibility level accounted for 8.05% and 4.63%, respectively, while the percentages of medium-high- or high-level accessibility cells were 66.80% and 70.12%, respectively. In addition, without any regard for scale and quality of supply, the law of accessibility deprivation under one sub-type facility was irregular compared to the other. Only dealing with the number of facilities, the spatial pattern of cells at high accessibility or low accessibility of various sub-types of facilities was not exactly the same.
3.2. Integrated Accessibility Level and Its Spatial Pattern
The overall accessibility level of all facilities can be computed from the accessibility level of individual facilities. According to Amartya Sen’s capability theory, low-income groups should be provided equal potential opportunities to choose or achieve what they value as other residents [61], even if they do not use some higher-level facilities frequently [27]. Whether it is necessary to assign different weights to each sub-type of facility based on resident attitude and the frequency of utilization has not reached a consensus [62]. The applicability of using equal weights for summing scores has been indicated through a comparison of the impact of uniform versus use-frequency weights in a previous study [27], as they found that the general results would not be significantly affected by using different weights. In this study, accordingly, an equal weight is assigned to each type of facility, as well as each sub-type of facility. The integrated accessibility level (IA), as shown in Figure 4f, was computed from the accessibility levels of five types of facilities (Figure 4a–e). The values of IA ranged from one to four, and were classified into three levels that correspond to high, moderate, and low spatial access using the “Jenks natural breaks classification” method (Figure 4f). The classification result of IA described approximately 9.21% of cells (1 km × 1 km) as high access and 30.66% as moderate access, while 60.13% of cells were classified as low access.
Each type of facility has its own pattern of spatial accessibility in Harbin. Access to healthcare and shopping facilities differs between the urban center and peripheral areas. The spatial accessibility of healthcare facilities (Figure 4c) is the highest in the main center, and relatively lower in other urban clusters. In contrast, the accessibility of shopping facilities in some clusters equals or even exceeds the level in the main center (Figure 4d), especially in Qianjin, Qunli, and Hannan. The spatial pattern of transit accessibility and education accessibility is dispersed. Areas along the subway lines and peripheral areas near bus stops have the highest value of accessibility scores for public transit facilities (Figure 4a). Although a large portion of high education accessibility cells were located in the suburban areas (Figure 4b), areas in the main center still have much higher access to schools than the average level of the whole city. While the main center and all the urban clusters fared quite well in the accessibility of recreation facilities, the southwestern and northwestern parts of suburban areas also displayed a moderate accessibility level (Figure 4e). Indicated by the spatial pattern of IA, the most distinguished hot spots of high accessibility level appeared in the main center, Qianjin, and Hannan. Though some sporadic high accessibility cells occurred, outlying suburban areas had the least well-equipped services and the least access to facilities.
3.3. Low-Income Households’ Perceptions of Spatial Accessibility
A household survey was conducted with a sample of affordable housing neighborhoods in different districts of Harbin, consisting of 8 in Daoli district, 17 in Daowai district, 2 in Nangang district, 1 in Pingfang district, 16 in Songbei district, and 8 in Xiangfang district. Within each neighborhood, households were selected using the simple random method; 300 questionnaires were delivered to households, and 266 (88.67%) valid responses were returned. The questionnaire survey was conducted in 2021 with the help of a class of undergraduates at The School of Architecture and Civil Engineering, Heilongjiang University of Science and Technology. The questionnaire investigated the following information: (1) households’ attributes (e.g., age, education, occupation, income, household number); (2) travel behavior (e.g., commuting to workplace, school, healthcare, shopping, recreation places); (3) housing preference; and (4) satisfaction with the neighborhood.
As shown in Table 3, more than 95% of the 266 respondents suffering from lower incomes had an annual household income of less than CNY 30,000. The elderly accounted for a large proportion of respondents, as 43.98% were elders over sixty, and 52.26% were between thirty and sixty. About three-quarters of respondents were retired or unemployed, and more than 90% had only attained junior school or high school education. These data indicate that low-income households always have lower educational levels and poorer occupations, in comparison with non-low-income groups. Their attributes severely restrict the flexibility and diversity of residence choices. The size of public rental housing ranged from 20 m2 to 70 m2, while three in every five interviewed households applied for a size between 30 m2 and 50 m2. Moreover, their duration of residence was generally longer than two years, and almost three in ten low-income households had lived in affordable housing for over five years. A total of 94.73% of respondents showed a strong inclination to maintain the status quo, rather than relocate to other places, for the next couple of years at least.
Among the factors that impact the housing choices of low-income households (Figure 5), the importance of the spatial accessibility of healthcare services ranked second only to housing rents, followed by factors of security, internal environment, and accessibility of shopping areas, neighborhood relationships, housing size, accessibility of recreation facilities, and composition of neighbors. In contrast to the preference for being close to healthcare services, shopping areas, and recreation facilities, the respondents attached far less importance to school accessibility and workplace accessibility. That could probably be attributed to their group characteristics; they were mostly unemployed or had reached retirement age. The healthcare demands of the elderly are much higher than the young and middle-aged; thus, correspondingly, healthcare accessibility was one of the most essential factors influencing their housing preference. A big surprise in this survey was that nearly 70% of low-income households presented a positive answer (i.e., satisfied or extremely satisfied) in terms of the question about their overall satisfaction with the neighborhood. However, less than half of the respondents felt satisfied with the accessibility of healthcare services and recreation facilities, and they had a lower sense of belonging in the neighborhood (Figure 6).
3.4. Accessibility Deprivation of Affordable Housing Neighborhoods
Table 4 shows the descriptive statistics for the accessibility score for each sub-type of facility provided for the 185 affordable housing neighborhoods, taking those of 3102 housing neighborhoods as a comparison. The public rental housing units in Harbin were located further away from the urban center, in comparison with neighborhoods in the control group. Among the 185 public rental housing neighborhoods, only 10.81% were within the first ring road (1st Ring), and more than three-quarters (140 neighborhoods) were within the second ring road (2nd Ring). In contrast, 52.42% of the neighborhoods in the control group were located within the 1st Ring and 43.84% were within the 2nd Ring. Affordable housing neighborhoods (20) accounted for approximately one percent of the 1626 neighborhoods within the 1st Ring, whereas over one-fourth of the neighborhoods within the third ring road (3rd Ring) were affordable housing neighborhoods (25).
It was clearly indicated that the spatial accessibility of one type of facility was extremely discrepant from another. For both the treatment group and the control group, the accessibility scores for municipal parks fell far behind the average level, while convenience stores led other sub-type facilities substantially in the accessibility score. Furthermore, the access scores for lower-level facilities were much larger than those for higher-level facilities. On average, for neighborhoods from the control group, the number of kindergartens accessible to every 10,000 residents was 3.54, but the number of junior schools they could get access to was only 0.31. A similar difference occurred between the mean value of accessibility scores for community health centers (2.52) and that of hospitals (0.94), whereas the opposite was true for the differences in access to higher-level facilities and lower-level facilities. Due to the scarcity of supply, the accessibility scores for higher-level facilities were low in all neighborhoods, with smaller mean values and S.D.s whereas, representative of lower-level facilities, convenience stores and bus stops were two of the most densely located and well-equipped facilities in Harbin.
The spatial disparities of accessibility among neighborhoods in different areas shared some similar characteristics, for both the treatment group and the control group. In general, the neighborhoods in the 1st Ring were areas that corresponded to the highest spatial accessibility level, and the accessibility level mostly decreased systematically from the 1st Ring to the 3rd Ring. The mean accessibility score for subway stations, junior schools, hospitals, community health centers, museums and exhibition halls in neighborhoods in the 1st Ring was significantly higher than for the 2nd Ring or the 3rd Ring. For example, on average, there were 1.26 accessible hospitals per 10,000 residents (within the catchment size of 5 km) for the 1st Ring housing neighborhoods from the control group, which means people living inside the first ring road can easily access high-level healthcare facilities. However, every 10,000 residents who lived in the 2nd Ring housing neighborhoods from the control group could only access 0.61 hospitals within a distance of 5 km, and the number dropped to 0.30 for those living in the 3rd Ring. Similarly, the scores for hospitals for affordable housing neighborhoods in the 1st Ring, 2nd Ring, and 3rd Ring were 1.1, 0.47, and 0.37, respectively. Such a diminishing tendency was remarkable in the accessibility scores for subway stations as well. The average accessibility score for subway stations for affordable housing neighborhoods was 0.47 in the 1st Ring, decreasing to 0.34 in the 2nd Ring and even dropping to 0.05 in the 3rd Ring. The mean scores for access to shopping facilities were high in housing neighborhoods in the 1st Ring and 2nd Ring but descended steeply in the 3rd Ring. In contrast, the mean scores for access to bus stops, kindergartens, primary schools, and municipal parks were higher in housing neighborhoods in the 3rd Ring than those in the 1st Ring or 2nd Ring. Housing neighborhoods in the 2nd Ring had the largest S.D. of access score for various types of facilities, except for community health centers and education facilities.
Meanwhile, great differences in spatial accessibility between neighborhoods in the treatment group and those in the control group were exhibited. Accessibility of higher-level facilities for affordable housing neighborhoods was relatively poorer. For instance, the average score for access to hospitals was 0.53 in the 185 affordable housing neighborhoods, much smaller than that of the control group (0.94). Not coincidentally, the gap in accessibility scores between the treatment group and the control group occurred in the sub-types junior school (0.24 to 0.31) and museum (0.43 to 0.65). This is partly due to the slack demand for higher-level facilities from low-income groups, as well as the inferior locations of public rental housing supplied by the government. In addition, it is worth noting that affordable housing neighborhoods have lower accessibility of subway stations (0.32) than the average level for all housing neighborhoods in the control group (0.45). This reveals the potential for service improvement in affordable housing neighborhoods in Harbin.
4. Discussion
It was identified that serious spatial mismatches exist between public services/facilities and residents, especially for low-income households who live in affordable housing neighborhoods in Harbin. Low-income groups (vulnerable groups) have fewer choices regarding residential location and size diversity [63]. In other words, they are in a passive position when making dwelling choices [19]. Because of the passive choice of housing location and less access to nearby jobs, the commuting characteristics of low-income groups differ considerably from those of non-low-income urban residents. They have less flexibility of travel, stronger reliance on public transportation among various travel modes, as well as longer commuting times. Based on the above sample survey in Harbin, more than 97% (221) of low-income respondents chose to solve the daily trip demand by taking a bus or the subway. Otherwise, 38 respondents traveled by bicycle or on foot, and only four chose automobiles. Affordable housing neighborhoods have lower accessibility of subway stations (as mentioned in Section 3.4), even though low-income groups use a higher proportion of public transportation than other groups. This was not an isolated case. An investigation in Hefei [64] found that low-income households have a greater demand for low-cost urban public transportation, and are keenly concerned about job accessibility and commuting time. Nevertheless, the World Bank’s report [18] showed that the job accessibility of low-income neighborhoods in the outer suburbs of Bejing was worse than that in the inner city. Furthermore, although children and elderly retirees are predominantly members of low-income households and have a greater demand for life-support public service facilities, their needs for education and healthcare facilities are poorly met [64].
Following Smith and Zenou [65], spatial mismatch is the outcome of optimal behavior by labor market participants who voluntarily choose to live in distant locations because the short-term benefits (low land rents) are sufficient compared to the long-term benefits of residential proximity to jobs. Therefore, whether low accessibility is problematic depends on whether people find themselves in this position voluntarily or not [66]. In the case of voluntary choice of residential location, the cost of low accessibility would be balanced out by other amenities; thus, it is not problematic [67]. Inequality of opportunity for vulnerable groups in Western cities is mainly caused by racial discrimination [68,69]. For instance, the United States was confronted with urban crises of spatial deprivation and social segregation after the late 1960s, where poor and black people were forced to congregate in decaying urban centers [70]. The phenomenon had multiple contributing factors [69], including the development of highway construction, the prevalence of cars, the “American dream” for a single-family house, etc. Middle- and upper-income white families were sensitive to the inferiority factors of unfavorable schools, high taxes, aging housing, and crimes downtown; hence, they moved spontaneously to the suburbs. In contrast, low-income and black families were slow to respond to these inferiority factors, because they were not able to move from the urban core to the suburbs [71]. In addition, a series of racist housing policies implemented by the Federal Housing Administration (FHA) forced poor and black people to congregate in decaying urban centers [69]. In contrast, the opportunities to choose residential and employment spaces for urban residents in Chinese cities are likely to be more related to household income [18]. Different from the spatial mismatch of ordinary commercial housing neighborhoods that results from the proactive choices made by non-low-income households, the spatial mismatch of low-income families results from their passive choice of affordable housing neighborhoods [19]. The development of affordable housing in Chinese cities is still at an early stage, and is inclined to chase quantitative supplementation but neglect qualitative supplementation [19,72]. The local government has stressed quantitative supply of affordable housing while ignoring providing public services and facilities. Low-income households have little impact on determining the location of affordable housing in China, and consequently, affordable housing is mainly located on the urban fringe [17]. Most of the affordable housing projects are located in the outer suburbs, which have lower costs of demolition and resettlement, resulting in the mismatch of low-income housing spaces.
For local planning practice, the findings of this research suggest implications for equity-oriented planning for future affordable housing developments in cities. Scholars argue that public policy should ensure not only the provision of affordable housing but also provide accessibility of services and facilities [16]. It has been suggested that local government should attach importance to spatial accessibility when planning affordable housing projects for low-income households [27]. The lack of surrounding public facilities for separately distributed affordable housing neighborhoods can be compensated by sharing with several neighborhoods, which can reduce the mismatch of affordable housing neighborhoods and improve the utilization efficiency of public facilities. In the planning thinking of conventional communities, housing was always disconnected from infrastructure and public services. In contrast, future communities should gather public service resources actively around the residents by creating physical spaces. The relationship between housing and services should be systematically considered in the whole process of planning, design and construction, thus solving the phenomenon of spatial mismatch between infrastructure and residents. To meet the needs of residents of all ages, childcare facilities, intelligent health stations, 24-h unmanned pharmacies, canteens for the elderly, neighborhood living rooms, and open spaces for exchange should be equipped in their “5–15 min living circle” so that residents do not need to travel far for their daily demand of basic infrastructure. In addition, it is essential to explore a new path of government-led and diversified participation in the supply of public services for affordable housing.
5. Conclusions
Compared to non-low-income households, low-income households have poorer spatial accessibility because of their passive housing choices and the inferior locations assigned to affordable housing. Inequalities in the opportunity to access infrastructure and services can produce further spatial injustice, while current practices in planning affordable houses focus on the provision of adequate dwelling spaces and neglect the provision of services. The literature has witnessed a steady growth of studies evaluating accessibility of services/facilities, but most focus on a single type of service, and even fewer investigate the perceptions of low-income residents in affordable housing neighborhoods. This study explored the issues of assessing the accessibility of multiple types of services/facilities and implementing a comparative analysis between the measures of affordable housing neighborhoods and those of all the housing neighborhoods in Harbin City. Employing the Gaussian-based 2SFCA method, the spatial accessibility of transit, education, healthcare, shopping, and recreation facilities was quantified, reclassified, and further computed to an integrated accessibility level. The approach evaluated the spatial distribution interactions between various public service/facility supply and population demands, considering the different service radii of facilities defined by straight-line distance as flexible catchment sizes. The pattern of accessibility of each type of facility in Harbin showed obvious spatial differentiation. In general, the accessibility scores for lower-level facilities were much larger than those for higher-level facilities for all neighborhoods, and accessibility of higher-level facilities for affordable housing households was much poorer than for normal groups. In addition, the mean accessibility scores for subway stations, junior schools, hospitals, community health centers, museums and exhibition halls in neighborhoods in the urban core were significantly higher than those in the suburbs. Overall, it confirmed the hypothesis on the spatial accessibility disparity between the urban core and the city periphery as well as the great variability of access to different types of facilities.
The study also included the characteristics, housing preferences, and satisfaction of low-income residents, by conducting a sample household survey in affordable housing neighborhoods. The survey indicated that a large portion of low-income residents felt dissatisfied with healthcare accessibility and recreation accessibility and had a lower sense of belonging in the affordable housing neighborhood where they dwelt. The mismatch between public services and low-income housing spaces could be attributed to the fact that local governments merely pursue the quantity of affordable housing spaces and that low-income households have few impacts on determining the location of affordable housing. Because the low-income group was generally characterized as elderly, less educated, under-employed or unemployed, their residence choices were extremely restricted and passive. Therefore, more importance should be attached to the spatial accessibility of public services and facilities when planning affordable housing projects for low-income households.
There exist three deficiencies in the present study, however, which need to be discussed and improved. Firstly, the quality of each sub-type facility was neglected, which has a great impact on its utilization rate and determines the attractiveness of the facility to users. It is difficult to obtain the supply quantity of various types of facilities in one research study, such as the area of parks, the number of school teachers, the number of hospital beds, and the volume of commercial facilities. Secondly, due to the increasing complexity of urban roads, the simple way to measure the straight-line distance differs greatly from the actual capacity of the existing road network and road access. Thirdly, the different needs of different ages or genders for various facilities were not taken into account. In principle, it is not completely reasonable and absolutely fair unless allocation of public services is based on real population needs. Combining the demographic structure with population distribution would contribute to a refined assessment result.
Author Contributions
Conceptualization, L.Z. (Linlin Zhang); methodology, L.Z. (Linlin Zhang) and X.Z.; software, L.Z. (Linlin Zhang); validation, X.Z., L.Z. (Liang Zhang) and H.L.; formal analysis, L.Z. (Linlin Zhang); investigation, H.H., X.Z. and H.L.; resources, H.H. and L.Z. (Linlin Zhang); data curation, L.Z. (Linlin Zhang); writing—original draft preparation, L.Z. (Linlin Zhang); writing—review and editing, L.Z. (Linlin Zhang), X.Z. and H.H.; visualization, L.Z. (Linlin Zhang); supervision, H.H.; project administration, L.Z. (Linlin Zhang) and H.H.; funding acquisition, L.Z. (Linlin Zhang), H.H., L.Z. (Liang Zhang) and H.L. All authors have read and agreed to the published version of the manuscript.
Funding
This research was funded by Philosophy and Social Sciences of Zhejiang Province (No. 20NDQN294YB), Philosophy and Social Sciences of Zhejiang Province (No. 21NDQN270YB), National Natural Sience Foundation of China (No. 71874050), Natural Science Foundation of Zhejiang Province (No. LQ20D010004), and Zhejiang Science Fund for Distinguished Young Scholars (No. LR21G030001).
Data Availability Statement
Not applicable.
Conflicts of Interest
The authors declare no conflict of interest.
| 1 | It was not until 1998 that a market-oriented housing security system was established, supplying low-rent housing for the lowest-income families and affordable housing for low- and middle-income families while supplying commodity housing for high-income families. The country began to promote the construction of public rental housing for low-income families in 2011, and further proposed to carry forward shared ownership housing for the youth population and new citizens in 2021. |
| 2 | According to the document (http://xxgk.harbin.gov.cn/art/2020/12/2/art_13332_18706.html (accessed on 27 October 2022)), urban low-income families suffering from housing difficulties can apply for affordable housing, with the following admission criteria: household registration in the six main urban areas (Daoli, Daowai, Xiangfang, Nangang, Pingfang, Songbei), identified as low-income families, and the per capita floor area of the family is less than 20 square meters. |
| 3 | WorldPop (www.worldpop.org (accessed on 27 October 2022)—School of Geography and Environmental Science, University of Southampton). 2015. China 100 m Population. Alpha version 2020 estimates of numbers of people per pixel (ppp), with national totals adjusted to match UN population division estimates (http://esa.un.org/wpp/ (accessed on 27 October 2022)) and remaining unadjusted. DOI: 10.5258/SOTON/WP00055. |
References
- Cass, N.; Shove, E.; Urry, J. Social Exclusion, Mobility and Access. Sociol. Rev. 2005, 53, 539–555. [Google Scholar] [CrossRef]
- Florencia, Q. On the Fringes of Urban Justice: Violence and Environmental Risks in Guatemala City. Soc. Incl. 2022, 10, 58–71. [Google Scholar]
- Uwayezu, E.; Vries, W.T.D. Indicators for Measuring Spatial Justice and Land Tenure Security for Poor and Low Income Urban Dwellers. Land 2018, 7, 84. [Google Scholar] [CrossRef] [Green Version]
- Harvey, D. Social Justice and the City; Edward Arnold: London, UK, 1973. [Google Scholar]
- Lefebvre, H. Le Droit a la Ville (The Right to the City); Anthropos: Paris, France, 1967. [Google Scholar]
- Pirie, G.H. On Spatial Justice. Environ. Plan. A 1983, 15, 465–473. [Google Scholar] [CrossRef]
- Soja, E.W. Seeking Spatial Justice; University of Minnesota: Minneapolis, MN, USA, 2010. [Google Scholar]
- Jian, I.Y.; Luo, J.; Chan, E.H.W. Spatial Justice in Public Open Space Planning: Accessibility and Inclusivity. Habitat Int. 2020, 97, 102122. [Google Scholar] [CrossRef]
- Carter, W.H.; Schill, M.H.; Wachter, S.M. Polarisation, Public Housing and Racial Minorities in US Cities. Urban Stud. 1998, 35, 1889–1911. [Google Scholar] [CrossRef]
- Reeves, P. Affordable and Social Housing: Policy and Practice; Routledge: New York, NY, USA, 2013. [Google Scholar]
- Fougère, D.; Kramarz, F.; Rathelot, R.; Safi, M. Social Housing and Location Choices of Immigrants in France. Int. J. Manpow. 2013, 34, 56–69. [Google Scholar] [CrossRef] [Green Version]
- Hirayama, Y. Public Housing and Neoliberal Policy in Japan. In The Future of Public Housing: Ongoing Trends in the East and the West; Chen, J., Stephens, M., Man, Y., Eds.; Springer: Berlin/Heidelberg, Germany, 2013; pp. 143–161. [Google Scholar]
- Chua, B.H. Navigating Between Limits: The Future of Public Housing in Singapore. Hous. Stud. 2014, 29, 520–533. [Google Scholar] [CrossRef]
- Niu, Y. The Performance and Problems of Affordable Housing Policy in China: The Estimations of Benefits, Costs and Affordability. Int. J. Hous. Mark. Anal. 2008, 1, 125–146. [Google Scholar] [CrossRef]
- Zou, Y. Contradictions in China’s Affordable Housing Policy: Goals vs. Structure. Habitat Int. 2014, 41, 8–16. [Google Scholar] [CrossRef]
- Apparicio, P.; Séguin, A.-M.; Naud, D. The Quality of the Urban Environment Around Public Housing Buildings in Montréal: An Objective Approach Based on GIS and Multivariate Statistical Analysis. Soc. Indic. Res. 2008, 86, 355–380. [Google Scholar] [CrossRef]
- Cheng, M.; Zhang, W.; Lu, D. Examining Spatial Pattern and Location Choice of Affordable Housing in Beijing, China: Developing a Workable Assessment Framework. Urban Stud. 2015, 52, 1846–1863. [Google Scholar] [CrossRef]
- The World Bank. Accessibility of the Urban Poor in Metropolitan Areas: Case Study of Beijing; World Bank Group: Washington, DC, USA, 2018. [Google Scholar]
- Zhou, S.; Wu, Z.; Cheng, L. The Impact of Spatial Mismatch on Residents in Low-income Housing Neighbourhoods: A Study of the Guangzhou Metropolis, China. Urban Stud. 2013, 50, 1817–1835. [Google Scholar] [CrossRef]
- Luo, L.; Zeng, D. Jobs-Housing Spatial Mismatch Condition in Public Rental Housing in Chongqing, China. In Proceedings of the 19th International Symposium on Advancement of Construction Management and Real Estate, Berlin/Heidelberg, Germany, 1 January 2015; pp. 521–530. [Google Scholar]
- Harry, H. The Spatial Mismatch Hypothesis: What Has the Evidence Shown? Urban Stud. 1991, 28, 105–122. [Google Scholar]
- Zhou, S.; Deng, L.; Kwan, M.-P.; Yan, R. Social and Spatial Differentiation of High and Low Income Groups’ Out-Of-Home Activities in Guangzhou, China. Cities 2015, 45, 81–90. [Google Scholar] [CrossRef]
- Wang, H.; Kwan, M.-P.; Hu, M. Social Exclusion and Accessibility among Low- and Non-Low-Income Groups: A Case Study of Nanjing, China. Cities 2020, 101, 102684. [Google Scholar] [CrossRef]
- Tsou, K.; Hung, Y.; Chang, Y. An Accessibility-Based Integrated Measure of Relative Spatial Equity in Urban Public Facilities. Cities 2005, 22, 424–435. [Google Scholar] [CrossRef]
- Talen, E.; Anselin, L. Assessing Spatial Equity: An Evaluation of Measures of Accessibility to Public Playgrounds. Environ. Plan. A Econ. Space 1998, 30, 595–613. [Google Scholar] [CrossRef] [Green Version]
- Witten, K.; Exeter, D.; Field, A. The Quality of Urban Environments: Mapping Variation in Access to Community Resources. Urban Stud. 2003, 40, 161–177. [Google Scholar] [CrossRef]
- Zeng, W.; Rees, P.; Xiang, L. Do residents of Affordable Housing Communities in China suffer from relative accessibility deprivation? A case study of Nanjing. Cities 2019, 90, 141–156. [Google Scholar] [CrossRef]
- Parsons, A.A.; Besenyi, G.M.; Kaczynski, A.T.; Stanis, S.A.W.; Blake, C.E.; Barr-Anderson, D.J. Investigating Issues of Environmental Injustice in Neighborhoods Surrounding Parks. J. Leis. Res. 2015, 47, 285–303. [Google Scholar] [CrossRef]
- Barandier, J.R., Jr.; Bodmer, M.; Lentino, I. Evidence of the Impacts of the National Housing Programme on the Accessibility of the Low-Income Population in Rio de Janeiro. In Natural Resources Forum; Blackwell Publishing Ltd.: Oxford, UK, 2017; Volume 41, pp. 105–118. [Google Scholar] [CrossRef]
- Wu, J.; He, Q.; Chen, Y.; Lin, J.; Wang, S. Dismantling the Fence for Social Justice? Evidence Based on The Inequity of Urban Green Space Accessibility in the Central Urban Area of Beijing. Environ. Plan. B Urban Anal. City Sci. 2018, 47, 626–644. [Google Scholar] [CrossRef]
- Dai, D. Racial/ethnic and Socioeconomic Disparities in Urban Green Space Accessibility: Where to Intervene? Landsc. Urban Plan. 2011, 102, 234–244. [Google Scholar] [CrossRef]
- Sharma, G.; Patil, G.R. Spatial and Social Inequities for Educational Services Accessibility—A Case Study for Schools in Greater Mumbai. Cities 2022, 122, 103543. [Google Scholar] [CrossRef]
- Pizzol, B.; Giannotti, M.; Tomasiello, D.B. Qualifying Accessibility to Education to Investigate Spatial Equity. J. Transp. Geogr. 2021, 96, 103199. [Google Scholar] [CrossRef]
- Sabokbar, H.F.; Mohammadi, H.; Tahmasbi, S.; Rafii, Y.; Hosseini, A. Measuring Spatial Accessibility and Equity to Healthcare Services Using Fuzzy Inference System. Appl. Geogr. 2021, 136, 102584. [Google Scholar] [CrossRef]
- Li, C.; Wang, J. A Hierarchical Two-Step Floating Catchment Area Analysis for High-Tier Hospital Accessibility in an Urban Agglomeration Region. J. Transp. Geogr. 2022, 102, 103369. [Google Scholar] [CrossRef]
- Bhat, C.; Handy, S.; Kockelman, K.; Mahmassani, H.; Chen, Q.; Weston, L. Development of an Urban Accessibility Index: Literature Review; Center for Transportation Research, University of Texas at Austin: Austin, TX, USA, 2000. [Google Scholar]
- Guagliardo, M.F. Spatial Accessibility of Primary Care: Concepts, Methods and Challenges. Int. J. Health Geogr. 2004, 3, 1–13. [Google Scholar] [CrossRef] [Green Version]
- Comber, A.; Brunsdon, C.; Green, E. Using a GIS-based Network Analysis to Determine Urban Greenspace Accessibility for Different Ethnic and Religious Groups. Landsc. Urban Plan. 2008, 86, 103–114. [Google Scholar] [CrossRef] [Green Version]
- Kong, F.; Yin, H.; Nakagoshi, N. Using GIS and Landscape Metrics in the Hedonic Price Modeling of the Amenity Value of Urban Green Space: A Case Study in Jinan City, China. Landsc. Urban Plan. 2007, 79, 240–252. [Google Scholar] [CrossRef]
- Wu, C.; Ye, X.; Du, Q.; Luo, P. Spatial Effects of Accessibility to Parks on Housing Prices in Shenzhen, China. Habitat Int. 2017, 63, 45–54. [Google Scholar] [CrossRef]
- Luo, W.; Wang, F. Measures of Spatial Accessibility to Health Care in a GIS Environment: Synthesis and a Case Study in the Chicago Region. Environ. Plan. B Plan. Des. 2003, 30, 865–884. [Google Scholar] [CrossRef] [Green Version]
- McGrail, M.R.; Humphreys, J.S. Measuring Spatial Accessibility to Primary Care in Rural Areas: Improving the Effectiveness of the Two-Step Floating Catchment Area Method. Appl. Geogr. 2009, 29, 533–541. [Google Scholar] [CrossRef]
- Luo, W.; Qi, Y. An Enhanced Two-Step Floating Catchment Area (E2SFCA) Method for Measuring Spatial Accessibility to Primary Care Physicians. Health Place 2009, 15, 1100–1107. [Google Scholar] [CrossRef] [PubMed]
- Gharani, P.; Stewart, K.; Ryan, G.L. An Enhanced Approach for Modeling Spatial Accessibility for In Vitro Fertilization Services in the Rural Midwestern United States. Appl. Geogr. 2015, 64, 12–23. [Google Scholar] [CrossRef]
- Dai, D. Black Residential Segregation, Disparities in Spatial Access to Health Care Facilities, and Late-Stage Breast Cancer Diagnosis in Metropolitan Detroit. Health Place 2010, 16, 1038–1052. [Google Scholar] [CrossRef]
- Hu, S.; Song, W.; Li, C.; Lu, J. A Multi-Mode Gaussian-Based Two-Step Floating Catchment Area Method for Measuring Accessibility of Urban Parks. Cities 2020, 105, 102815. [Google Scholar] [CrossRef]
- Tong, D.; Sun, Y.; Xie, M. Evaluation of Green Space Accessibility Based on Improved. Gaussian Two-Step Floating Catchment Area Method: A Case Study of Shenzhen City, China. Prog. Geogr. 2021, 40, 1113–1126. (In Chinese) [Google Scholar] [CrossRef]
- Guo, Y.; Fu, B.; Wang, Y.; Xu, P.; Liu, Q. Identifying Spatial Mismatches between the Supply and Demand of Recreation Services for Sustainable Urban River Management: A Case Study of Jinjiang River in Chengdu, China. Sustain. Cities Soc. 2022, 77, 103547. [Google Scholar] [CrossRef]
- Qian, T.; Chen, J.; Li, A.; Wang, J.; Shen, D. Evaluating Spatial Accessibility to General Hospitals with Navigation and Social Media Location Data: A Case Study in Nanjing. Int. J. Environ. Res. Public Health 2020, 17, 2752. [Google Scholar] [CrossRef]
- Chen, W.; Cheng, L.; Chen, X.; Chen, J.; Cao, M. Measuring Accessibility to Health Care Services for Older Bus Passengers: A Finer Spatial Resolution. J. Transp. Geogr. 2021, 93, 103068. [Google Scholar] [CrossRef]
- Lloyd, C.T.; Sorichetta, A.; Tatem, A.J. High Resolution Global Gridded Data for Use in Population Studies. Sci. Data 2017, 4, 1–17. [Google Scholar] [CrossRef] [Green Version]
- Delmelle, E.M.; Thill, J.-C.; Peeters, D.; Thomas, I. A Multi-Period Capacitated School Location Problem with Modular Equipment and Closest Assignment Considerations. J. Geogr. Syst. 2014, 16, 263–286. [Google Scholar] [CrossRef]
- Kilinc, M.S.; Milburn, A.B.; Stamm, J.L.H. Measuring Potential Spatial Accessibility of Home Healthcare Services. Soc. Econ. Plan. Sci. 2017, 59, 13–25. [Google Scholar] [CrossRef]
- Ursulica, T.E. The Relationship Between Health Care Needs and Accessibility to Health Care Services in Botosani County-Romania. Procedia Environ. Sci. 2016, 32, 300–310. [Google Scholar] [CrossRef] [Green Version]
- Hess, D.B. Access to Employment for Adults in Poverty in the Buffalo-Niagara Region. Urban Stud. 2005, 42, 1177–1200. [Google Scholar] [CrossRef]
- Chen, Y.; He, N. Analysis of Walkable Environment and Influential Factors in Rail Transit Station Areas: Case Study of 12 Neighborhoods in Shanghai. Urban Plan. Forum 2012, 6, 96–104. [Google Scholar]
- Wendel, H.E.W.; Zarger, R.K.; Mihelcic, J.R. Accessibility and Usability: Green Space Preferences, Perceptions, and Barriers in a Rapidly Urbanizing City in Latin America. Landsc. Urban Plan. 2012, 107, 272–282. [Google Scholar] [CrossRef]
- Phibbs, C.S.; Luft, H.S. Correlation of Travel Time on Roads Versus Straight Line Distance. Med. Care Res. Rev. 1995, 52, 532–542. [Google Scholar] [CrossRef]
- Wang, H.; Huang, J.; Li, Y.; Yan, X.; Xu, W. Evaluating and Mapping the Walking Accessibility, Bus Availability and Car Dependence in Urban Space: A Case Study of Xiamen, China. Acta Geogr. Sin. 2013, 68, 477–490. (In Chinese) [Google Scholar]
- Fan, P.; Xu, L.; Yue, W.; Chen, J. Accessibility of Public Urban Green Space in an Urban Periphery: The Case of Shanghai. Landsc. Urban Plan. 2016, 165, 177–192. [Google Scholar] [CrossRef]
- Walker, M.; Unterhalter, E. Amartya Sen’s Capability Approach and Social Justice in Education; Springer: New York, NY, USA, 2007. [Google Scholar]
- Lotfi, S.; Koohsari, M.J. Measuring Objective Accessibility to Neighborhood Facilities in the City (a Case Study: Zone 6 in Tehran, Iran). Cities 2009, 26, 133–140. [Google Scholar] [CrossRef]
- Horner, M.W.; Mefford, J.N. Investigating Urban Spatial Mismatch Using Job-Housing Indicators to Model Home-Work Separation. Environ. Plan. A 2007, 39, 1420–1440. [Google Scholar] [CrossRef]
- Ye, H.; Chu, J.; Gu, K. The Research of the Rationality of the Affordable Housing Spatial Distribution in Hefei Based on the Analysis of the Living Demand. J. Anhui Inst. Arch. Ind. (Nat. Sci.) 2014, 22, 48–52. (In Chinese) [Google Scholar]
- Smith, T.E.; Zenou, Y. Spatial Mismatch, Search Effort, and Urban Spatial Structure. J. Urban Econ. 2003, 54, 129–156. [Google Scholar] [CrossRef] [Green Version]
- Wee, B.V.; Geurs, K. Discussing Equity and Social Exclusion in Accessibility Evaluations. Eur. J. Transp. Infrastruct. Res. 2011, 11, 350–367. [Google Scholar]
- van Wee, B. Accessibility and Equity: A Conceptual Framework and Research Agenda. J. Transp. Geogr. 2022, 104, 103421. [Google Scholar] [CrossRef]
- Kain, J.F. Housing Segregation, Negro Employment, and Metropolitan Decentralization. Q. J. Econ. 1968, 82, 175–197. [Google Scholar] [CrossRef]
- Gillham, O. The Limitless City: A Primer on the Urban Sprawl Debate; Island Press: Washington, DC, USA, 2002. [Google Scholar]
- Jacobs, J. The Death and Life of Great American Cities: The Failure of Town Planning; Random House: New York, NY, USA, 1961. [Google Scholar]
- Staley, S.R. The Sprawling of America: In Defense of the Dynamic City; Reason Public Policy Institute: Los Angeles, CA, USA, 1999. [Google Scholar]
- Ru, Y.; Li, L.; Li, G. Optimization Strategies of Residential Space of Public Rental Housing Projection in Hangzhou under the Concept of Spatial Justice. Urban Dev. Stud. 2016, 23, 107–117. (In Chinese) [Google Scholar]
Figure 1.
Map of the Study Area.
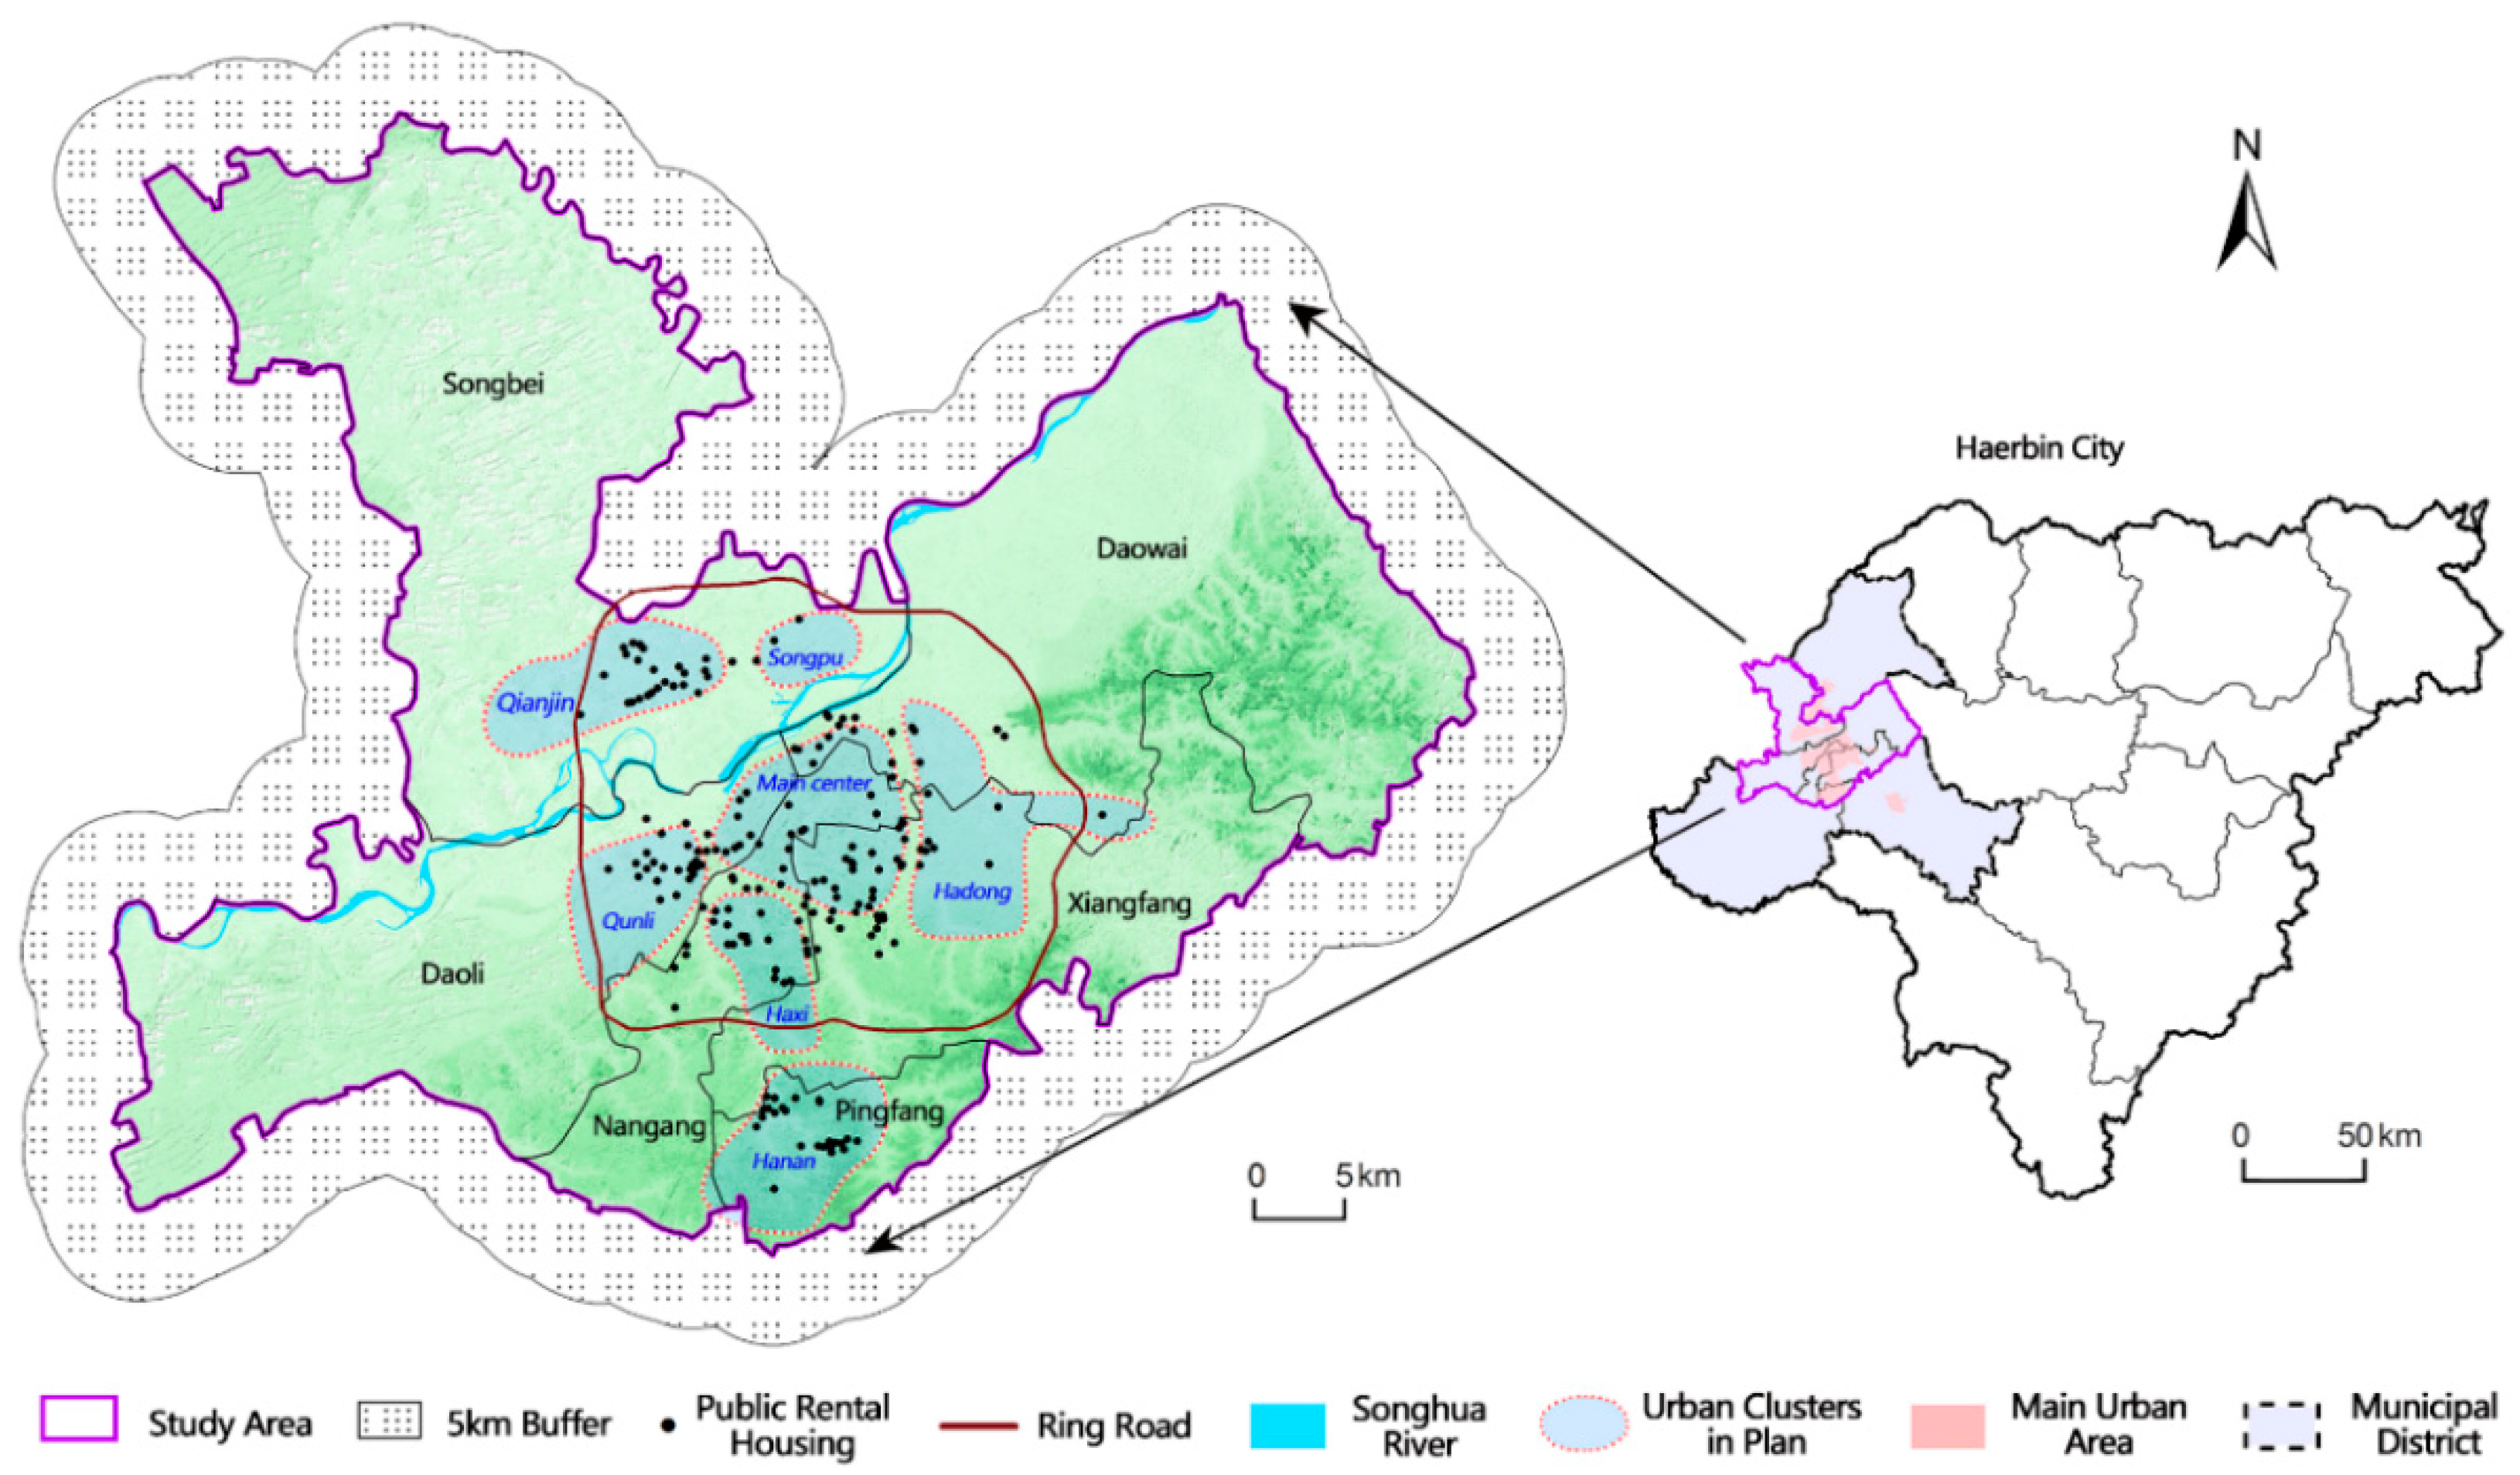
Figure 2.
The Layout of Housing Neighborhoods and Population.

Figure 3.
Accessibility scores for each sub-type of facility.

Figure 4.
Accessibility levels of multiple facilities and IA.
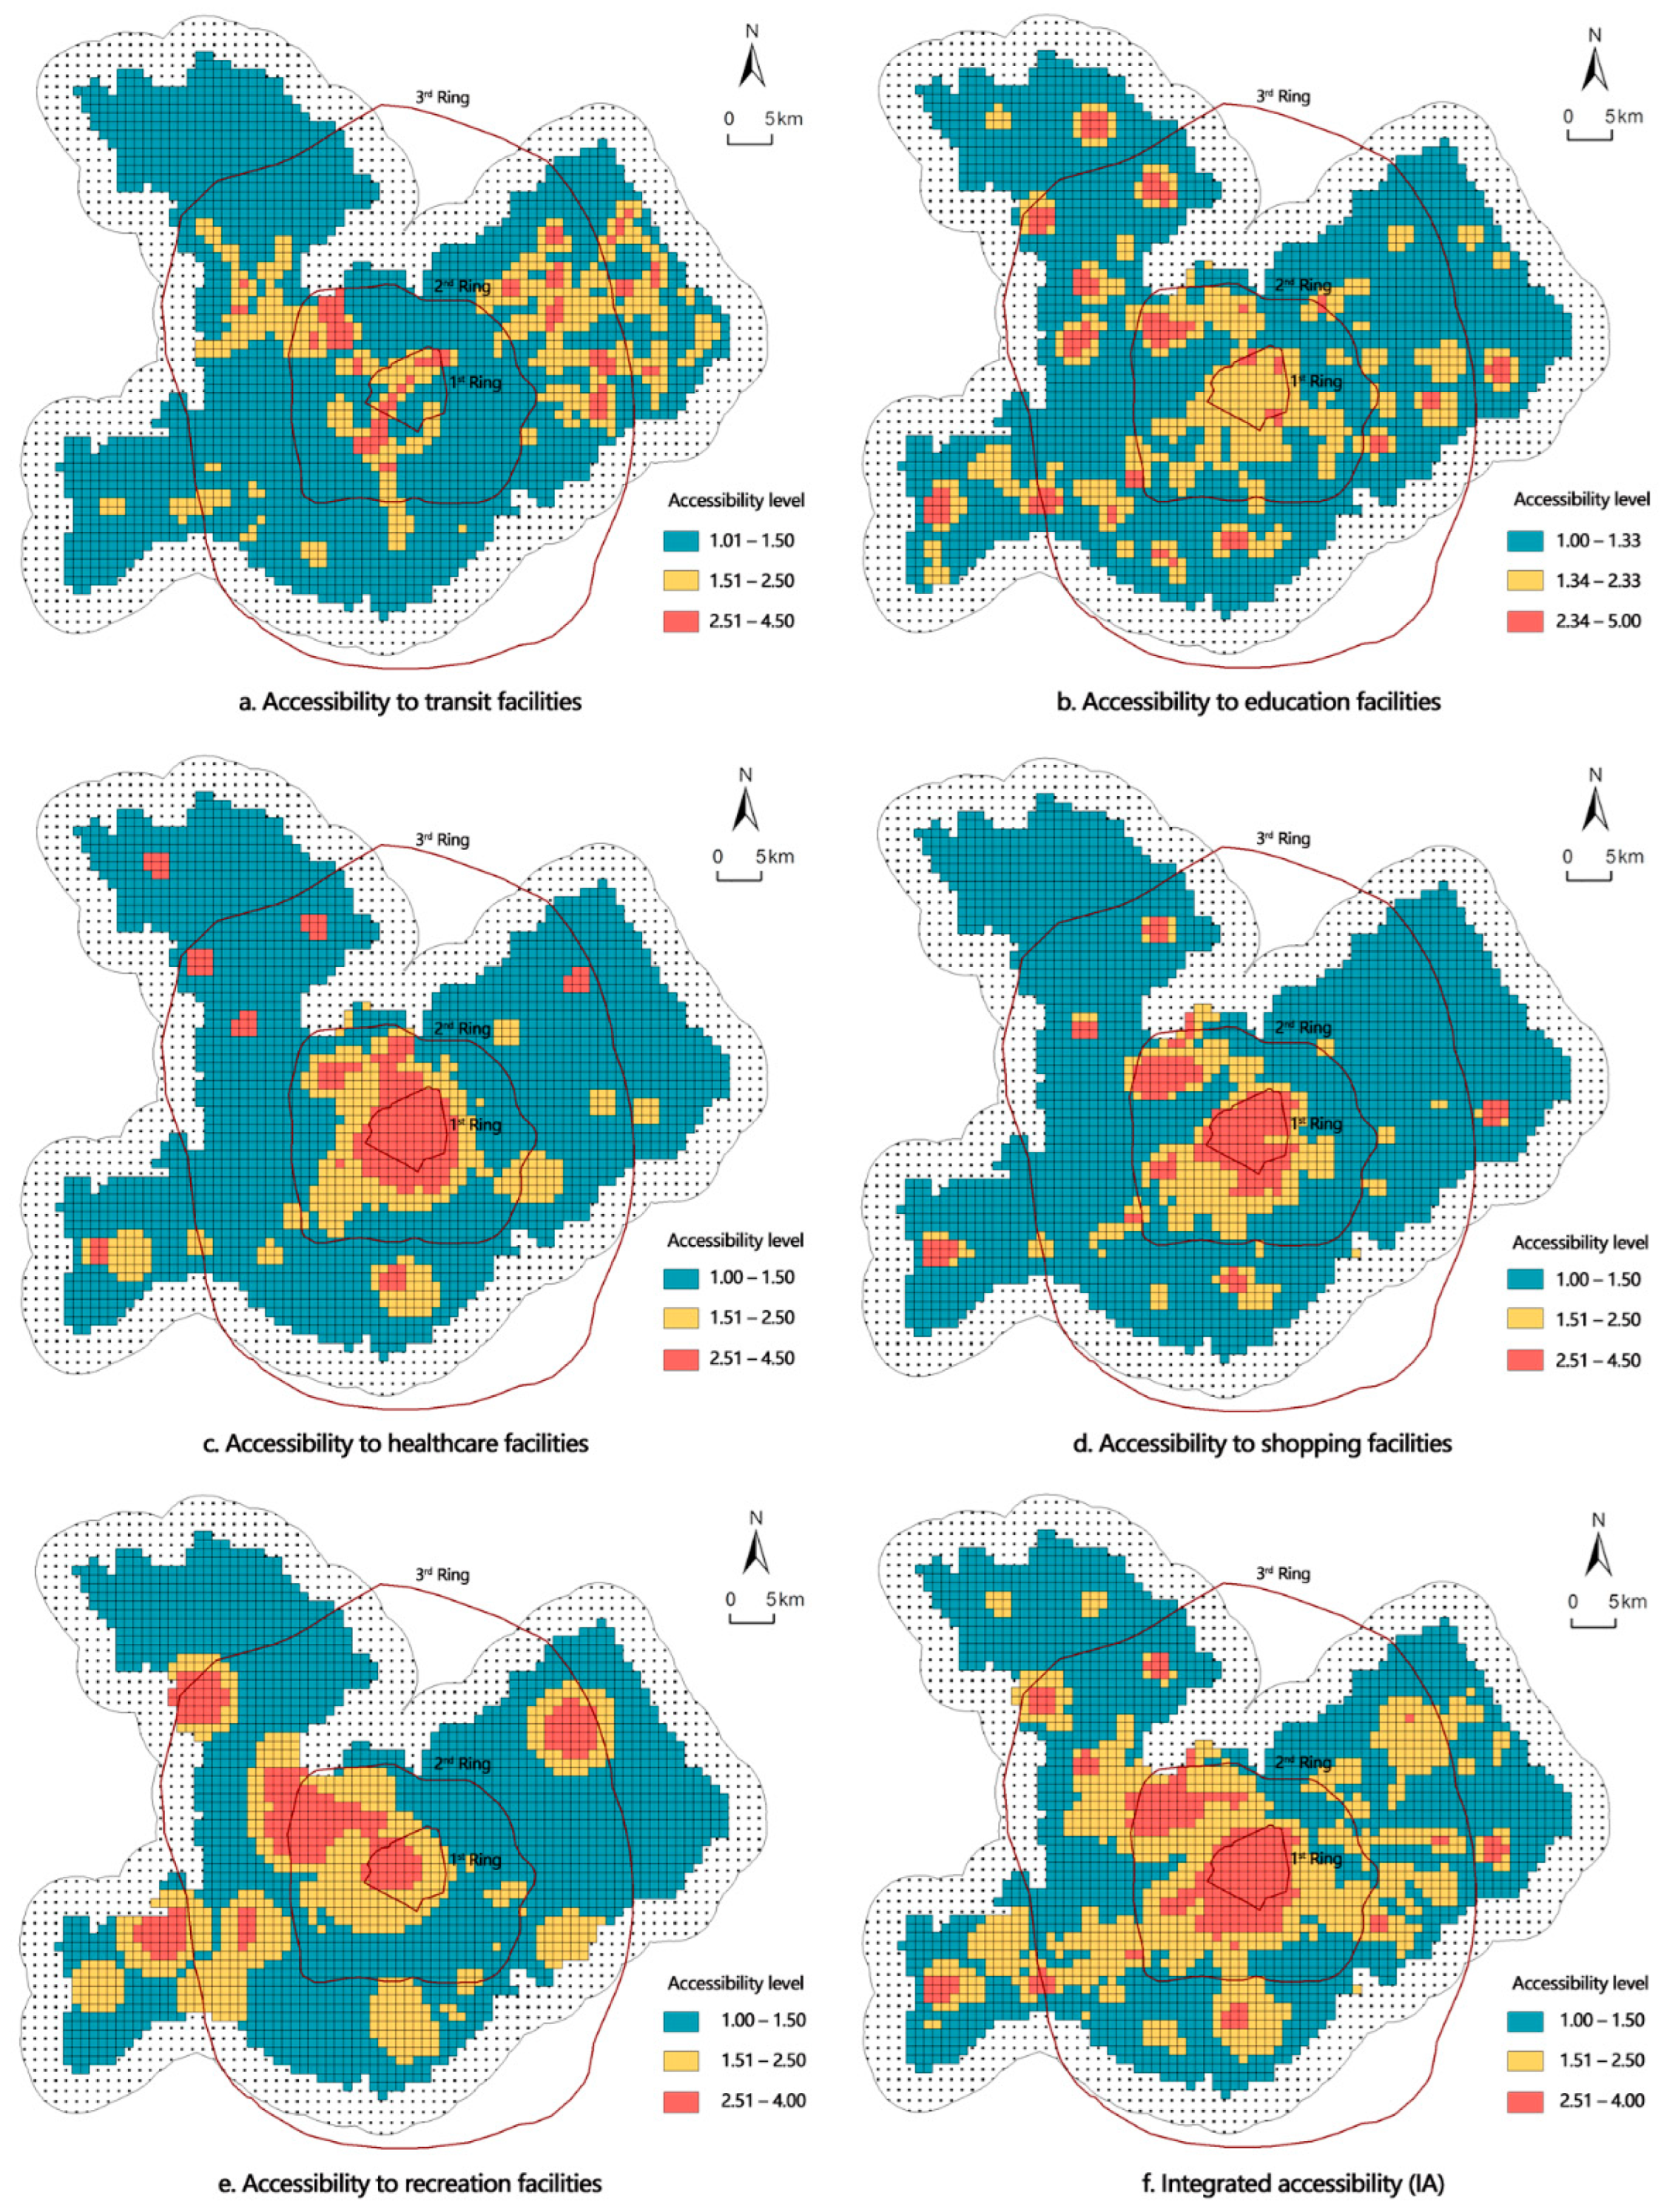
Figure 5.
Importance of accessibility and other factors for low-income households’ housing preference.
Figure 5.
Importance of accessibility and other factors for low-income households’ housing preference.
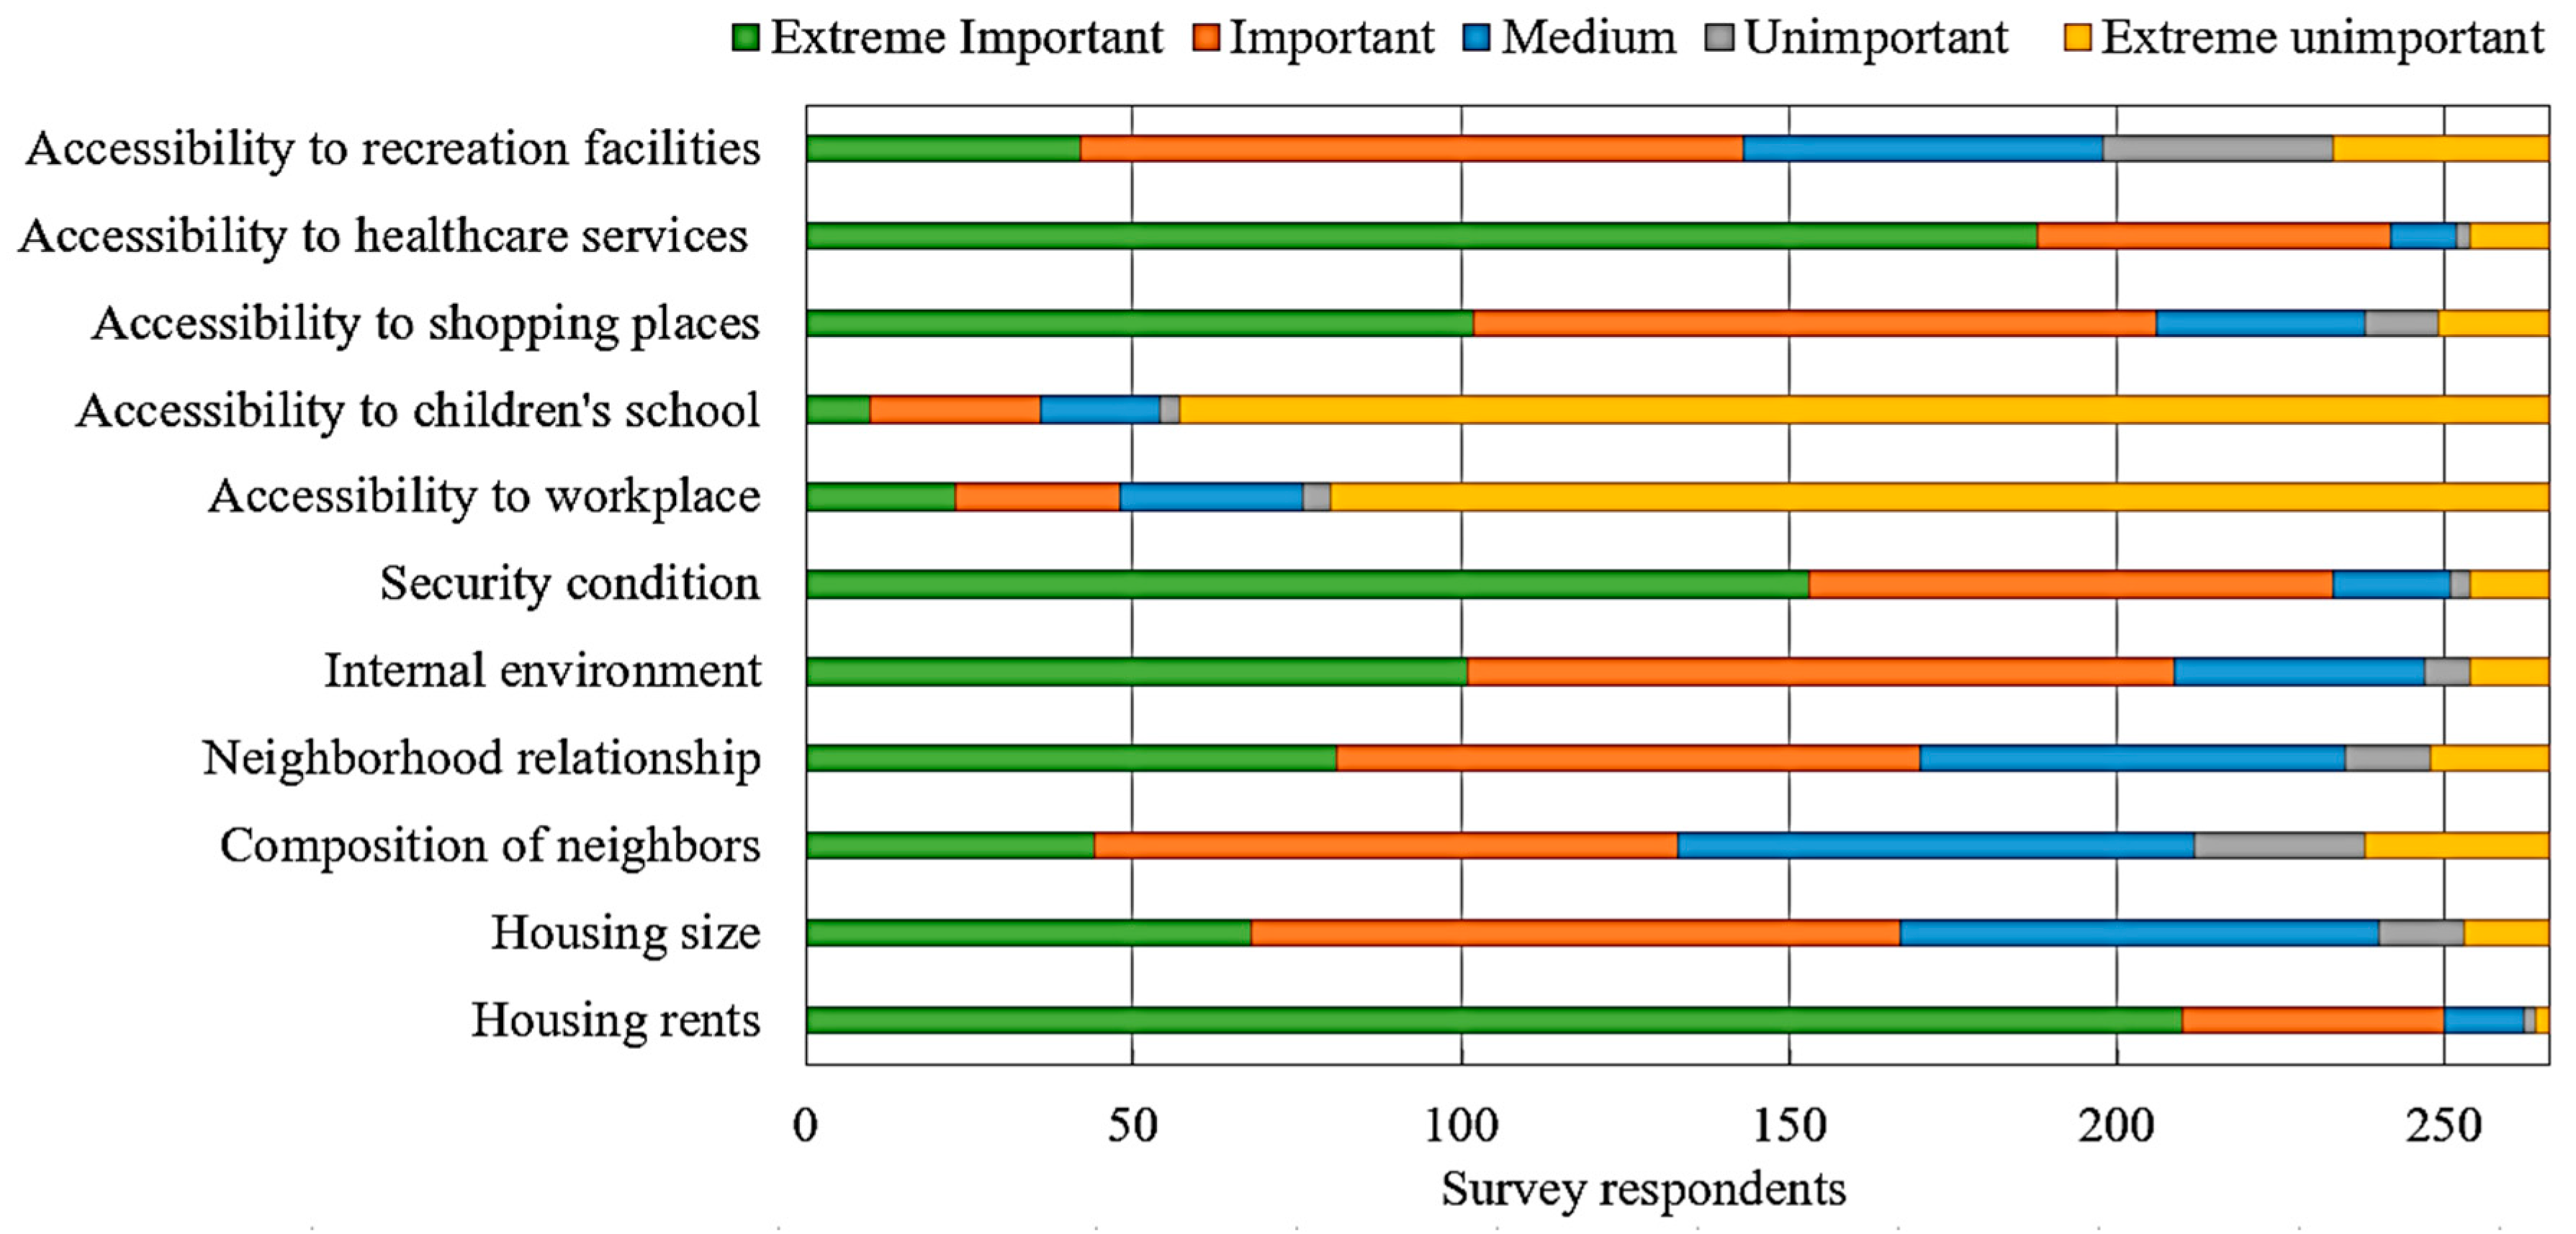
Figure 6.
Satisfaction with accessibility and other factors in low-income households’ perceptions.


Table 1.
Allocation of Public Rental Housing Units in Harbin by District, 2018–2021.
| Year | Total | Daoli | Daowai | Nangang | Xiangfang | Pingfang | Songbei |
|---|---|---|---|---|---|---|---|
| 2018 | 6733 | 1204 | 1703 | 1531 | 1848 | 370 | 77 |
| 2019 | 11,547 | 2198 | 2969 | 2425 | 3163 | 664 | 128 |
| 2020 | 2757 | 543 | 744 | 668 | 595 | 151 | 56 |
| 2021 | 4785 | 815 | 1310 | 1028 | 1317 | 260 | 55 |
Table 2.
Catchment size of various types of facilities.
| Type of Facility | Sub-Type of Facility | Catchment Size |
|---|---|---|
| t1: transit | s1: subway station | 1000 m |
| s2: bus stop | 1000 m | |
| t2: education | s3: junior school | 2000 m |
| s4: primary school and kindergarten | 1000 m | |
| t3: healthcare | s5: hospital | 5000 m |
| s6: community health center | 1000 m | |
| t4: shopping | s7: mall and supermarket | 2000 m |
| s8: convenience store | 1000 m | |
| t5: recreation | s9: museum and exhibition hall | 5000 m |
| s10: municipal park | 5000 m |
Table 3.
Households’ attributes in affordable housing neighborhoods.
| Attribute | Category | Respondents | Attribute | Category | Respondents |
|---|---|---|---|---|---|
| Age | <30 | 10 | Education | ≤junior schools | 157 |
| ≥30 and <60 | 139 | high school | 88 | ||
| ≥60 | 117 | college | 21 | ||
| Annual household income | <30,000 | 254 | ≥postgraduate | 0 | |
| ≥30,000 and <50,000 | 11 | Occupation | government/institution staff | 9 | |
| ≥50,000 | 1 | individual business | 3 | ||
| Household members | 1 | 140 | private company employees | 8 | |
| 2 | 84 | no fixed jobs | 30 | ||
| 3 | 38 | retired | 116 | ||
| 4 | 4 | unemployed | 80 | ||
| Affordable housing size | >20 and ≤30 | 21 | unknown | 20 | |
| >30 and ≤40 | 39 | Duration of residence | <2 | 63 | |
| >40 and ≤50 | 129 | ≥2 and <5 | 113 | ||
| >50 and ≤60 | 42 | ≥5 and <10 | 75 | ||
| >60 and ≤70 | 35 | ≥10 | 15 |
Table 4.
Descriptive statistics of accessibility scores for multiple facilities for neighborhoods.
| Sub-Type of Facility | s1 | s2 | s3 | s4 | s5 | s6 | s7 | s8 | s9 | s10 | ||
|---|---|---|---|---|---|---|---|---|---|---|---|---|
| 185 Affordable Housing Neighborhoods | All | Mean | 0.32 | 10.90 | 0.24 | 4.95 | 0.53 | 1.84 | 2.05 | 22.34 | 0.43 | 0.04 |
| S.D. | 0.39 | 13.21 | 0.21 | 3.76 | 0.32 | 1.28 | 1.34 | 16.01 | 0.27 | 0.04 | ||
| 20 in 1st Ring | Mean | 0.47 | 4.91 | 0.33 | 4.27 | 1.10 | 3.25 | 2.14 | 29.29 | 0.73 | 0.01 | |
| S.D. | 0.27 | 1.36 | 0.09 | 1.73 | 0.21 | 1.11 | 0.18 | 8.95 | 0.27 | 0 | ||
| 140 in 2nd Ring | Mean | 0.34 | 11.91 | 0.24 | 4.94 | 0.47 | 1.67 | 2.20 | 22.77 | 0.40 | 0.04 | |
| S.D. | 0.41 | 14.82 | 0.22 | 3.90 | 0.27 | 1.20 | 1.47 | 17.23 | 0.26 | 0.04 | ||
| 25 in 3rd Ring | Mean | 0.05 | 10.03 | 0.22 | 5.45 | 0.37 | 1.66 | 1.14 | 14.34 | 0.37 | 0.05 | |
| S.D. | 0.08 | 4.96 | 0.23 | 3.99 | 0.09 | 1.14 | 0.40 | 8.19 | 0.10 | 0.01 | ||
| 3102 Housing Neighborhoods | All | Mean | 0.45 | 6.4 | 0.31 | 4.08 | 0.94 | 2.52 | 2.04 | 25.25 | 0.65 | 0.02 |
| S.D. | 0.43 | 7.84 | 0.15 | 2.51 | 0.43 | 1.22 | 0.82 | 10.61 | 0.33 | 0.03 | ||
| 1626 in 1st Ring | Mean | 0.51 | 4.34 | 0.36 | 3.68 | 1.26 | 3.07 | 2.06 | 28.82 | 0.84 | 0.01 | |
| S.D. | 0.40 | 1.34 | 0.07 | 1.37 | 0.24 | 0.95 | 0.32 | 6.89 | 0.26 | 0 | ||
| 1360 in 2nd Ring | Mean | 0.41 | 8.35 | 0.24 | 4.35 | 0.61 | 1.93 | 2.08 | 21.73 | 0.45 | 0.03 | |
| S.D. | 0.45 | 10.93 | 0.17 | 2.86 | 0.30 | 1.17 | 1.14 | 12.38 | 0.27 | 0.04 | ||
| 116 in 3rd Ring | Mean | 0.10 | 11.82 | 0.27 | 6.35 | 0.30 | 1.77 | 1.23 | 16.03 | 0.30 | 0.04 | |
| S.D. | 0.14 | 8.35 | 0.22 | 4.88 | 0.15 | 1.37 | 0.56 | 10.65 | 0.19 | 0.02 | ||
Publisher’s Note: MDPI stays neutral with regard to jurisdictional claims in published maps and institutional affiliations. |
© 2022 by the authors. Licensee MDPI, Basel, Switzerland. This article is an open access article distributed under the terms and conditions of the Creative Commons Attribution (CC BY) license (https://creativecommons.org/licenses/by/4.0/).
Share and Cite
MDPI and ACS Style
Zhang, L.; Zhang, X.; Huang, H.; Zhang, L.; Li, H. Spatial Accessibility of Multiple Facilities for Affordable Housing Neighborhoods in Harbin, China. Land 2022, 11, 1940. https://doi.org/10.3390/land11111940
AMA Style
Zhang L, Zhang X, Huang H, Zhang L, Li H. Spatial Accessibility of Multiple Facilities for Affordable Housing Neighborhoods in Harbin, China. Land. 2022; 11(11):1940. https://doi.org/10.3390/land11111940
Chicago/Turabian StyleZhang, Linlin, Xiaobin Zhang, Huiling Huang, Liang Zhang, and Huan Li. 2022. "Spatial Accessibility of Multiple Facilities for Affordable Housing Neighborhoods in Harbin, China" Land 11, no. 11: 1940. https://doi.org/10.3390/land11111940
Note that from the first issue of 2016, this journal uses article numbers instead of page numbers. See further details here.