
Changes in Richness and Species Composition after Five Years of Grazing Exclusion in an Endemic Pasture of Northern Mexico

 , , and
Abstract
:1. Introduction
2. Materials and Methods
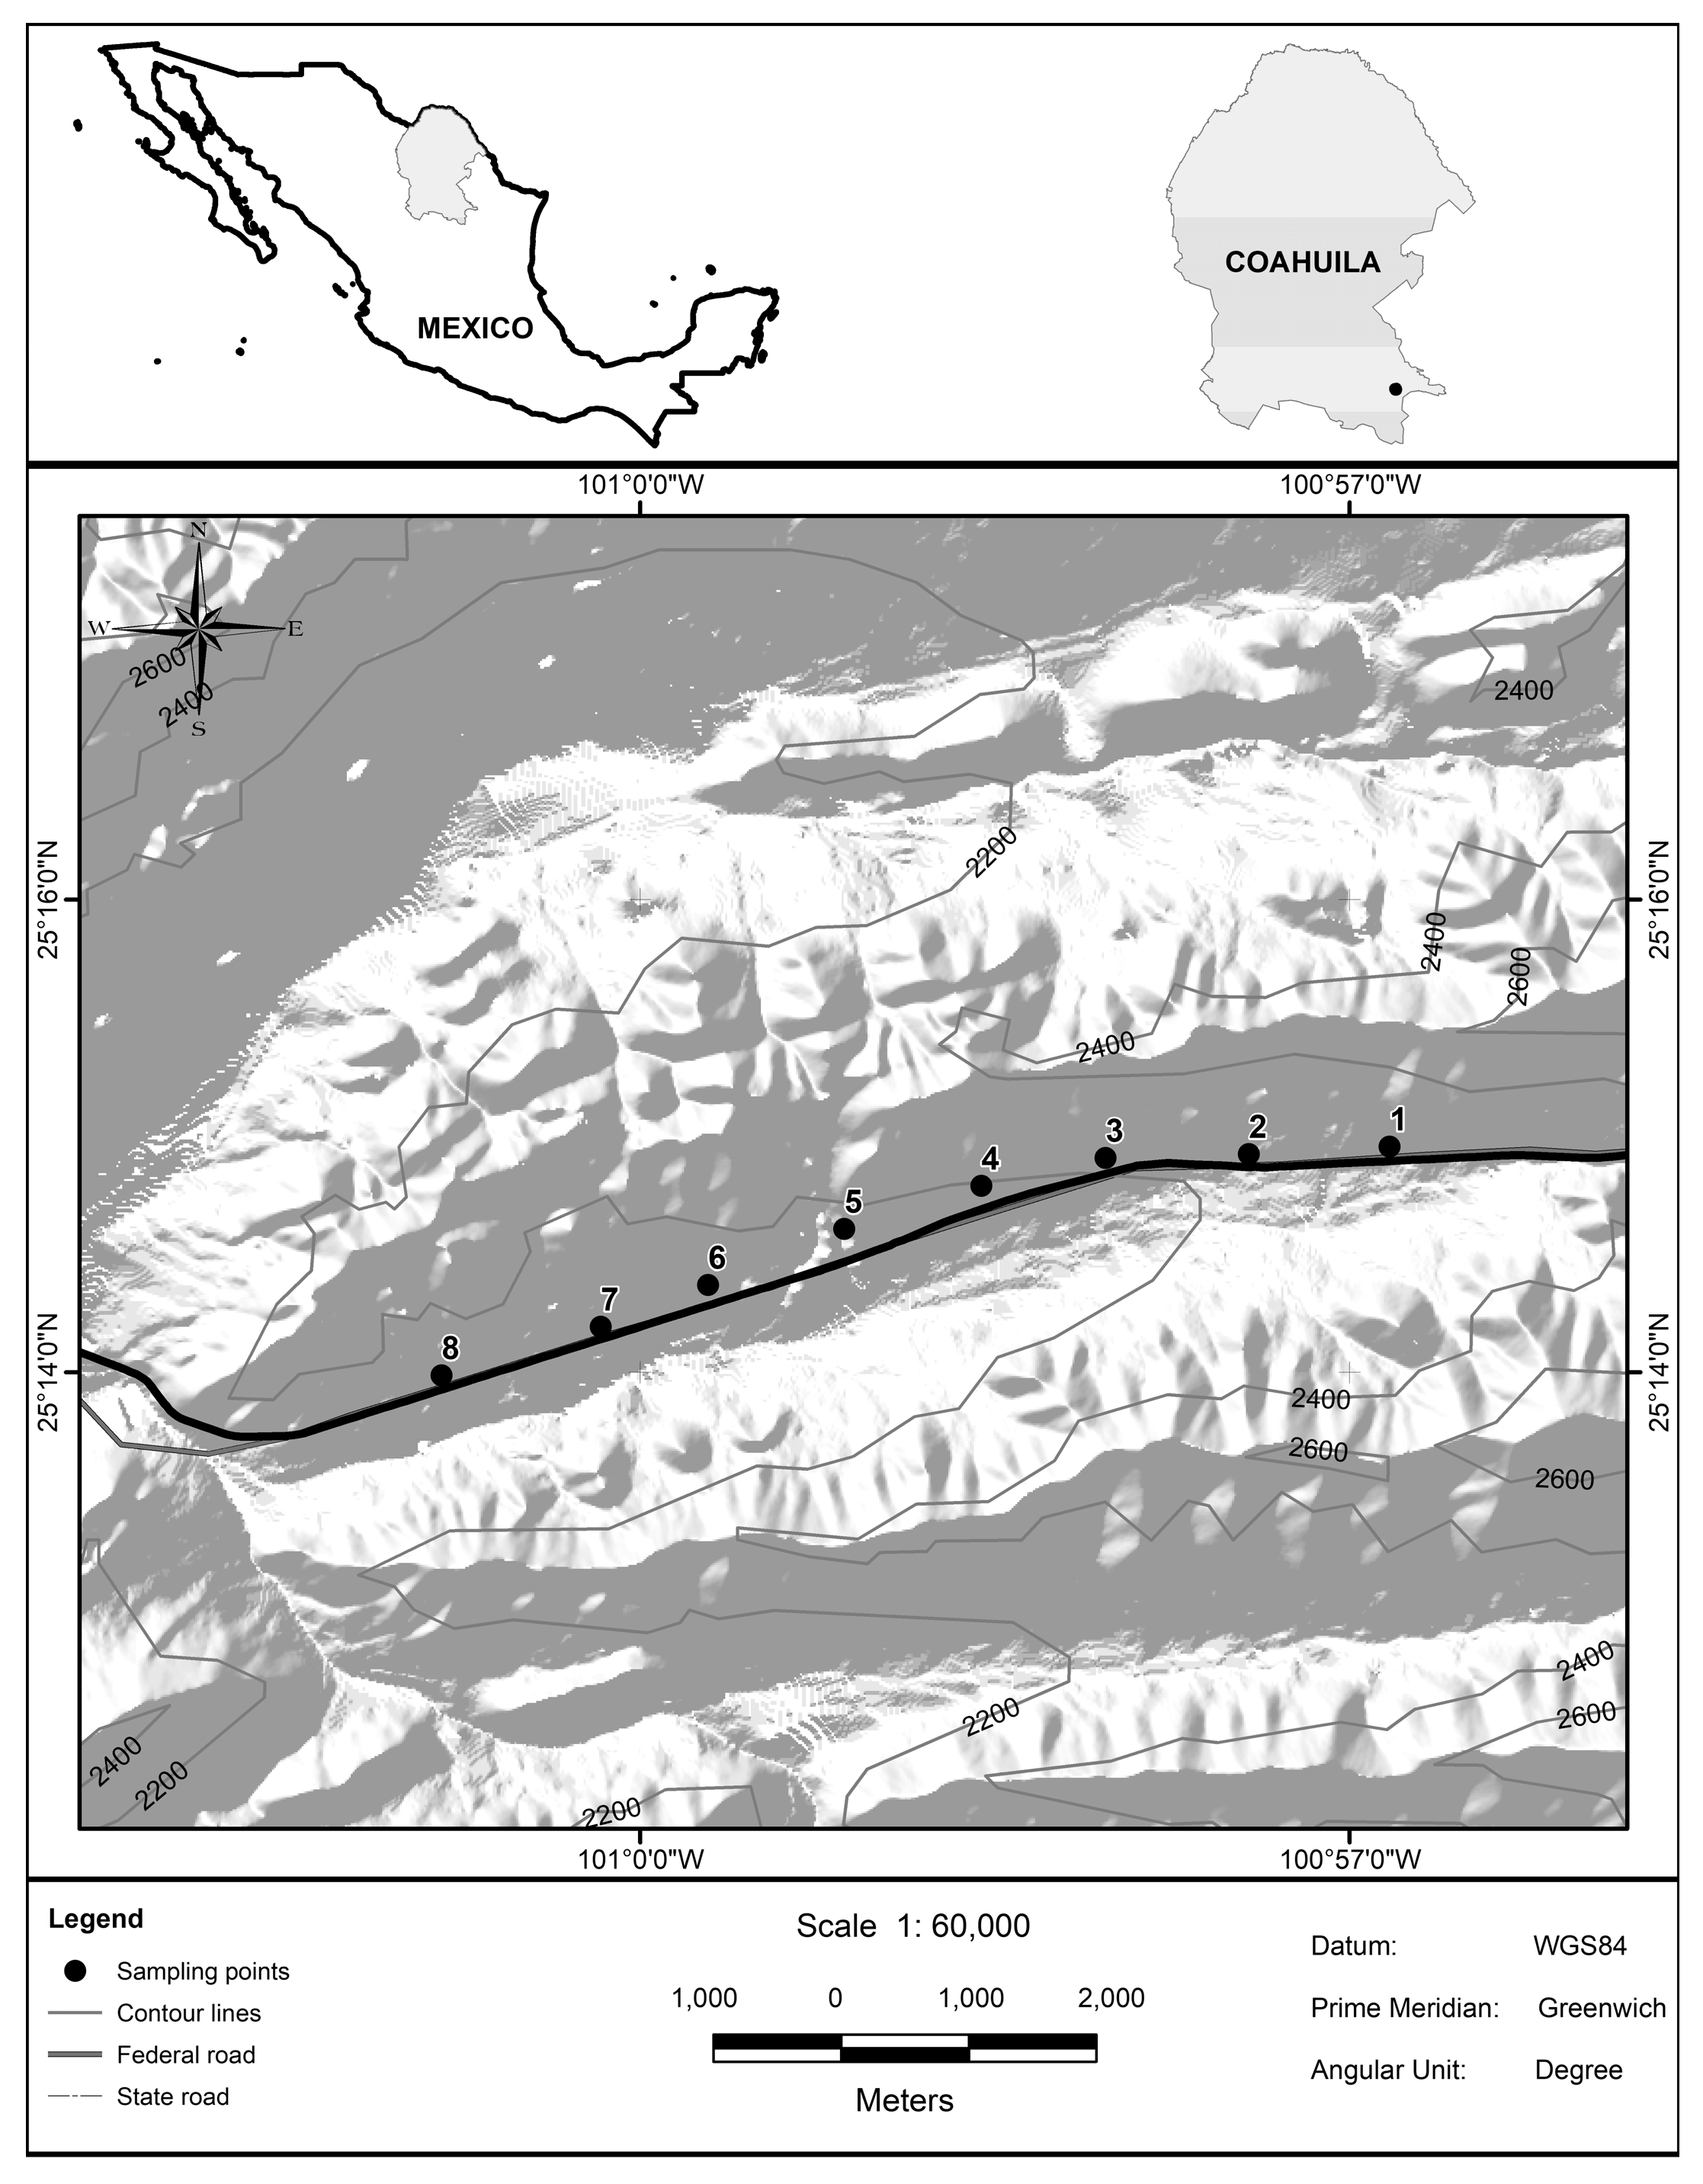
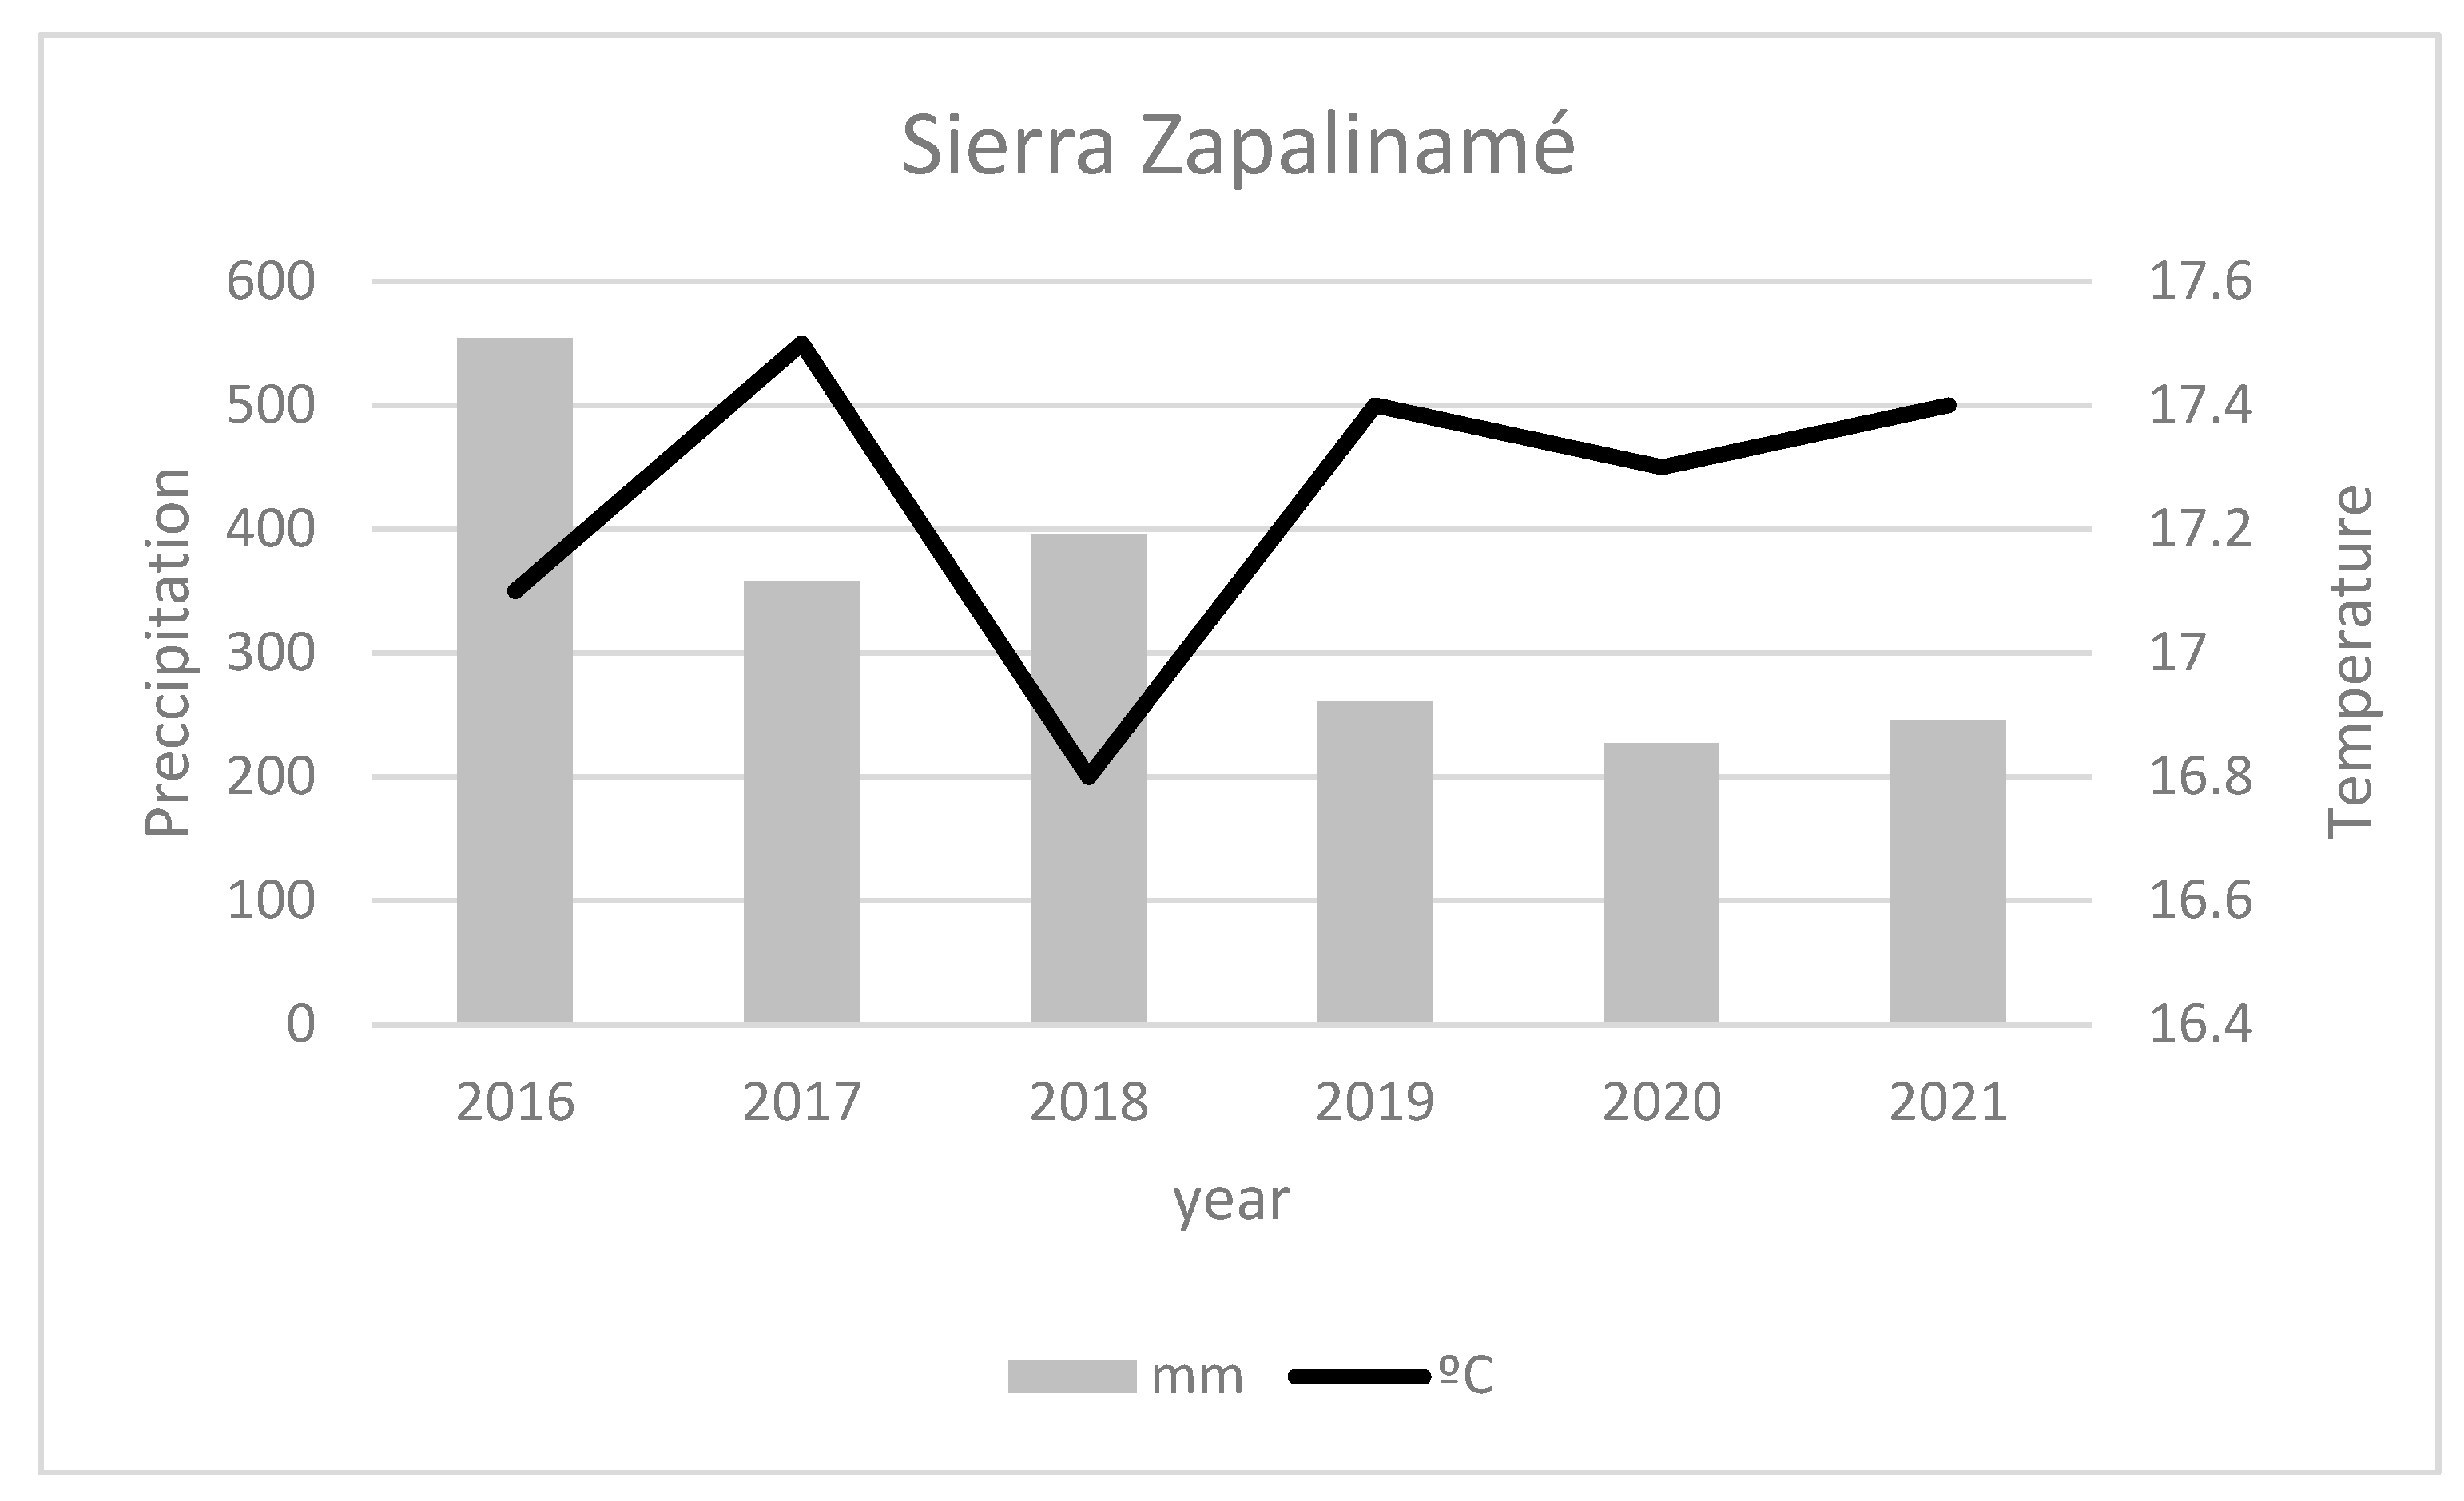
2.1. Study Site
2.2. Design of the Experiment
2.3. Statistical Analyses
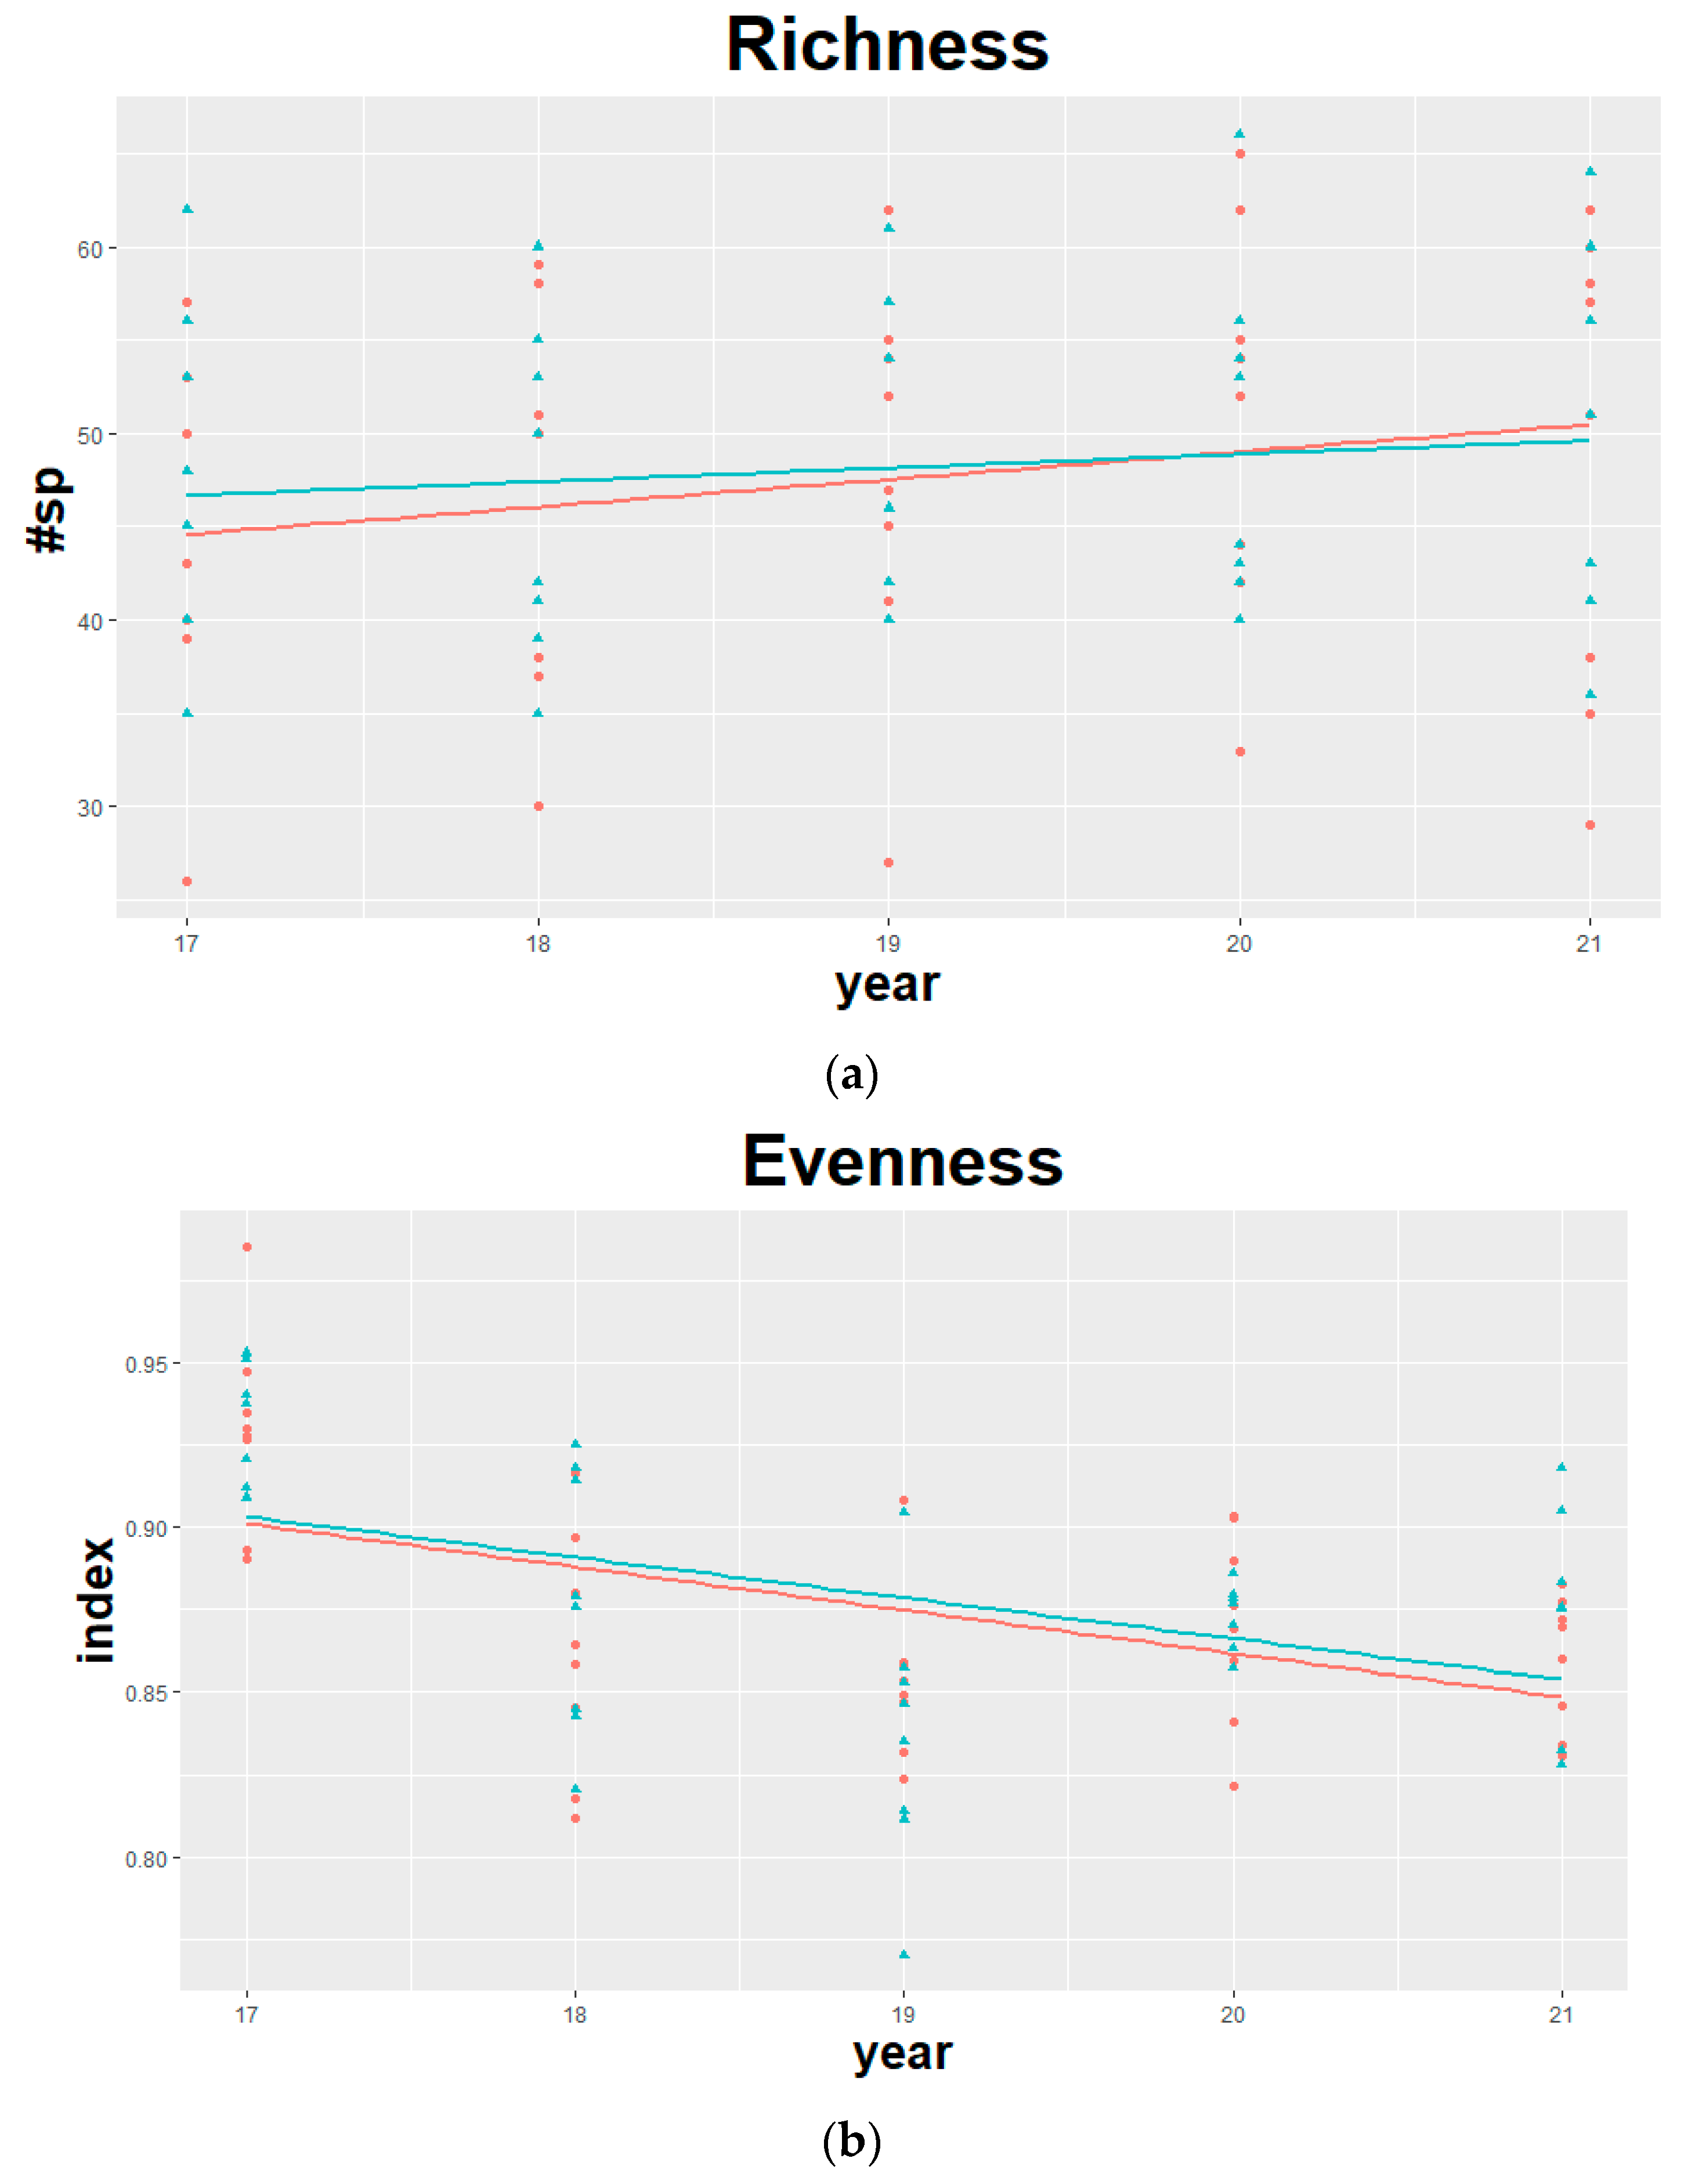
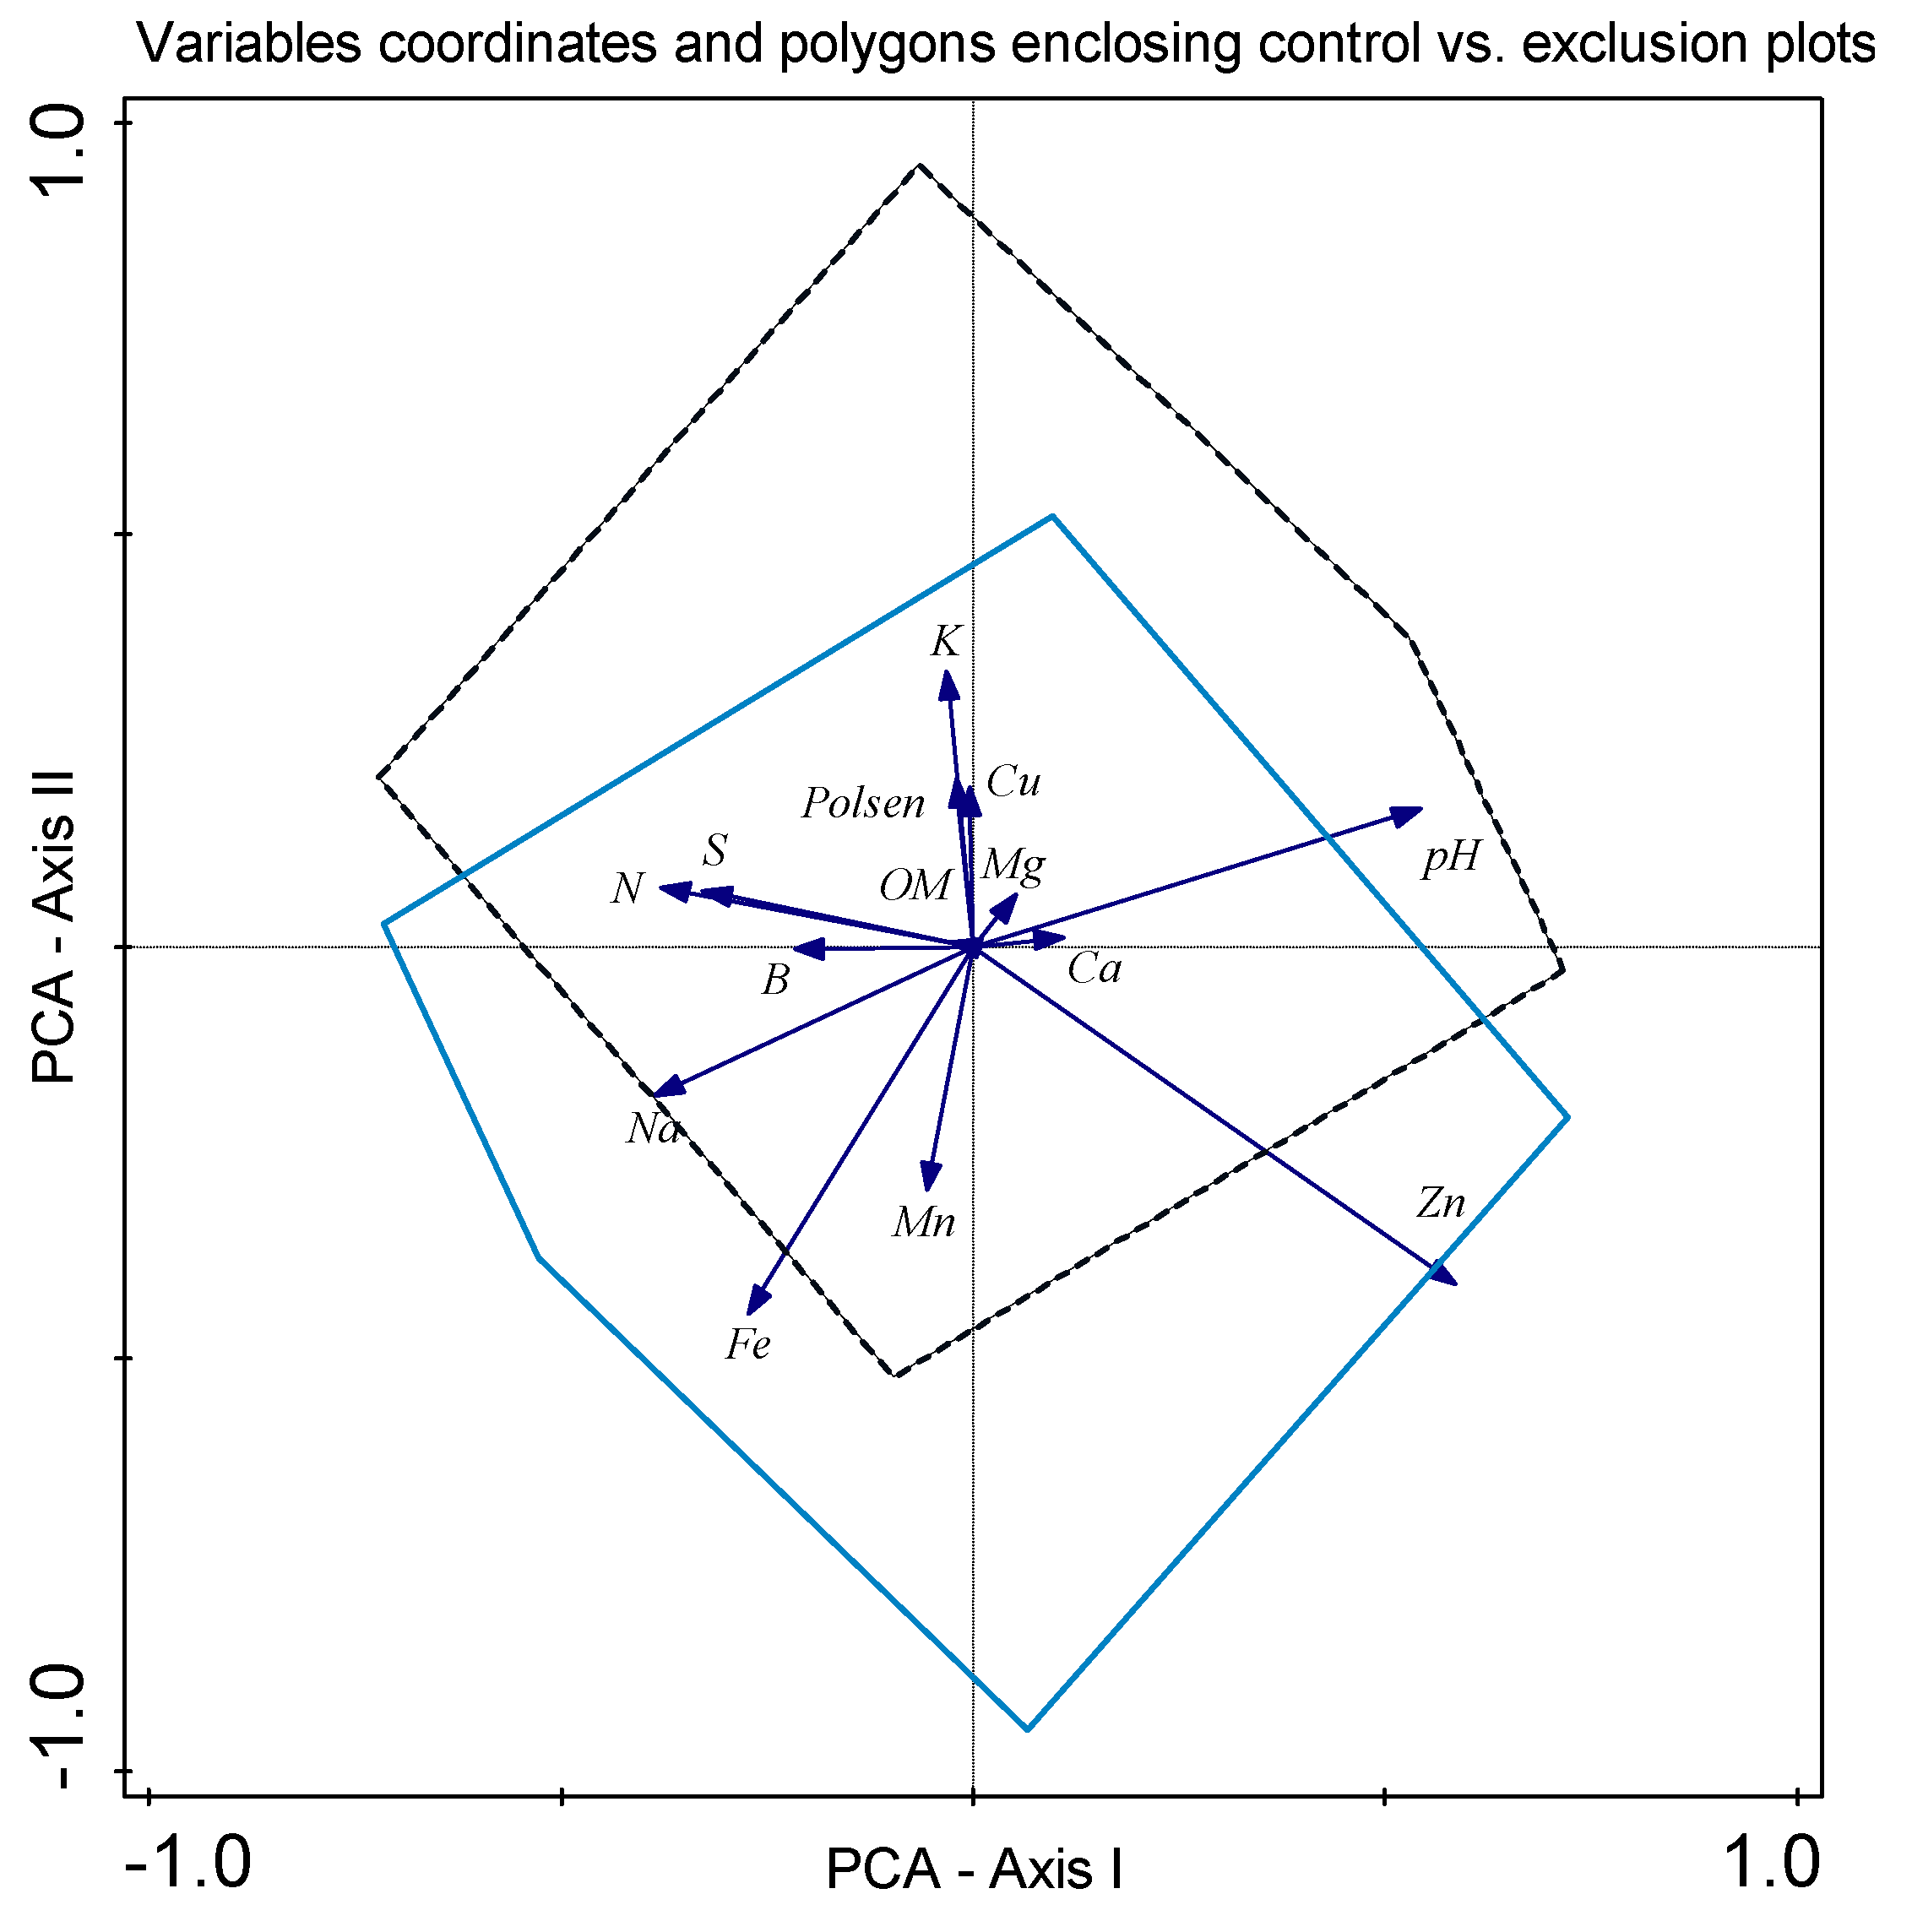
3. Results
4. Discussion
5. Conclusions
Author Contributions
Funding
Data Availability Statement
Acknowledgments
Conflicts of Interest
Appendix A

| Family | Scientific Name | Status | Functional Form | Palatability |
|---|---|---|---|---|
| Euphorbiaceae | Acalypha monostachya Cav. | Native | Forb | Non-palatable |
| Euphorbiaceae | Acalypha phleoides Cav. | Native | Forb | Non-palatable |
| Poaceae | Achnatherum eminens (Cav.) Barkworth | Native | Grasses | Palatable |
| Agavaceae | Agave asperrima Jacobi | Native | Shrub | Palatable |
| Nyctaginaceae | Allionia incarnata L. | Native | Forb | Non-palatable |
| Amaranthaceae | Alternanthera repens (L.) J.F. Gmel. | Native | Forb | Non-palatable |
| Amaranthaceae | Amaranthus blitoides S. Watson | Native | Forb | Palatable |
| Amaranthaceae | Amaranthus hybridus L. | Native | Forb | Palatable |
| Asteraceae | Ambrosia confertiflora DC. | Native | Forb | Non-palatable |
| Malvaceae | Anoda cristata (L.) Schltdl. | Native | Forb | Palatable |
| Euphorbiaceae | Argythamnia neomexicana Müll. Arg. | Native | Forb | Non-palatable |
| Poaceae | Aristida adscensionis L. | Native | Grasses | Non-palatable |
| Poaceae | Aristida curvifolia E. Fourn. | Native | Grasses | Non-palatable |
| Poaceae | Aristida divaricata Humb. & Bonpl. ex Willd. | Native | Grasses | Palatable |
| Poaceae | Aristida havardii Vasey | Native | Grasses | Palatable |
| Poaceae | Aristida pansa Wooton & Standl. | Native | Grasses | Palatable |
| Poaceae | Aristida purpurea Nutt. | Native | Grasses | Palatable |
| Asphodelaceae | Asphodelus fistulosus L. | Introduced | Forb | Non-palatable |
| Fabaceae | Astragalus hypoleucus S. Schauer | Native | Forb | Non-palatable |
| Asteraceae | Baccharis pteronioides DC. | Native | Forb | Non-palatable |
| Asteraceae | Baccharis salicifolia (Ruiz & Pav.) Pers. | Native | Forb | Non-palatable |
| Asteraceae | Bahia absinthifolia Benth. | Native | Forb | Non-palatable |
| Poaceae | Bothriochloa barbinodis (Lag.) Herter | Native | Grasses | Palatable |
| Poaceae | Bouteloua curtipendula (Michx.) Torr. | Native | Grasses | Palatable |
| Poaceae | Bouteloua dactyloides (Nutt.) J.T. Columbus | Native | Grasses | Palatable |
| Poaceae | Bouteloua gracilis (Kunth) Lag. ex Griffiths | Native | Grasses | Palatable |
| Poaceae | Bouteloua hirsuta Lag. | Native | Grasses | Palatable |
| Rubiaceae | Bouvardia ternifolia (Cav.) Schltdl. | Native | Forb | Non-palatable |
| Poaceae | Bouteloua uniflora Vasey | Native | Grasses | Palatable |
| Asteraceae | Brickellia veronicifolia (Kunth) A. Gray | Native | Shrub | Non-palatable |
| Buddlejaceae | Buddleja scordioides Kunth | Native | Shrub | Palatable |
| Onagraceae | Calylophus berlandieri Spach | Native | Forb | Non-palatable |
| Onagraceae | Calylophus hartwegii (Benth.) P.H. Raven | Native | Forb | Non-palatable |
| Cyperaceae | Carex schiedeana Kuntze | Native | Forb | Palatable |
| Orobanchaceae | Castilleja sessiliflora Pursh | Native | Forb | Non-palatable |
| Solanaceae | Chamaesaracha coniodes (Moric. ex Dunal) Britton | Native | Forb | Non-palatable |
| Asteraceae | Chaetopappa ericoides (Torr.) G.L. Nesom | Native | Forb | Non-palatable |
| Amaranthaceae | Chenopodium foetidum Lam. | Native | Forb | Non-palatable |
| Rubiaceae | Clematis drummondii Torr. & A. Gray | Native | Forb | Non-palatable |
| Cactaceae | Corynopuntia schottii (Engelm.) F.M. Knuth | Native | Cacti | Non-palatable |
| Rubiaceae | Crusea diversifolia (Kunth) W.R. Anderson | Native | Forb | Non-palatable |
| Boraginaceae | Cryptantha mexicana (Brandegee) I.M. Johnst. | Native | Forb | Non-palatable |
| Cucurbitaceae | Cucurbita foetidissima Kunth | Native | Forb | Non-palatable |
| Cucurbitaceae | Cucurbita pepo L. | Native | Forb | Palatable |
| Cactaceae | Cylindropuntia imbricata (Haw.) F.M. Knuth | Native | Cacti | Non-palatable |
| Nyctaginaceae | Cyphomeris gypsophiloides (M. Martens & Galeotti) Standl. | Native | Forb | Non-palatable |
| Cyperaceae | Cyperus niger Ruiz & Pav. | Native | Forb | Palatable |
| Fabaceae | Dalea aurea Nutt. ex Pursh | Native | Forb | Palatable |
| Fabaceae | Dalea bicolor Humb. & Bonpl. ex Willd. | Native | Shrub | Palatable |
| Fabaceae | Dalea greggii A. Gray | Native | Shrub | Palatable |
| Fabaceae | Dalea laniceps Barneby | Native | Forb | Palatable |
| Fabaceae | Dalea pogonathera A. Gray | Native | Forb | Palatable |
| Fabaceae | Desmanthus painteri (Britton & Rose) Standl. | Native | Forb | Palatable |
| Convolvulaceae | Dichondra argentea Humb. & Bonpl. ex Willd. | Native | Forb | Non-palatable |
| Poaceae | Disakisperma dubium (Kunth) P.M. Peterson & N. Snow | Native | Grasses | Palatable |
| Caryophyllaceae | Drymaria anomala S. Watson | Native | Forb | Non-palatable |
| Asteraceae | Dyssodia acerosa DC. | Native | Forb | Non-palatable |
| Acanthaceae | Dyschoriste linearis (Torr. & A. Gray) Kuntze | Native | Forb | Non-palatable |
| Asteraceae | Dyssodia papposa (Vent.) Hitchc. | Native | Forb | Non-palatable |
| Asteraceae | Dyssodia pinnata (Cav.) B.L. Rob. | Native | Forb | Non-palatable |
| Asparagaceae | Echeandia flavescens (Schult. & Schult. f.) Cruden | Native | Forb | Non-palatable |
| Cactaceae | Echinocactus horizonthalonius Lem. | Native | Cacti | Non-palatable |
| Cactaceae | Echinocereus pectinatus (Scheidw.) Engelm. | Native | Cacti | Non-palatable |
| Cactaceae | Echinocereus reichenbachii (Terscheck ex Walp.) Haage | Native | Cacti | Non-palatable |
| Poaceae | Elymus elymoides (Raf.) Swezey | Native | Grasses | Palatable |
| Acanthaceae | Elytraria imbricata (Vahl) Pers. | Native | Forb | Non-palatable |
| Poaceae | Enneapogon desvauxii P. Beauv. | Native | Grasses | Non-palatable |
| Poaceae | Erioneuron avenaceum (Kunth) Tateoka | Native | Grasses | Palatable |
| Asteraceae | Erigeron pubescens Kunth | Native | Forb | Non-palatable |
| Euphorbiaceae | Euphorbia cinerascens Engelm. | Native | Forb | Non-palatable |
| Euphorbiaceae | Euphorbia dentata Michx. | Native | Forb | Non-palatable |
| Euphorbiaceae | Euphorbia exstipulata Engelm. | Native | Forb | Non-palatable |
| Euphorbiaceae | Euphorbia serrula Engelm. | Native | Forb | Non-palatable |
| Convolvulaceae | Evolvulus alsinoides (L.) L. | Native | Forb | Non-palatable |
| Convolvulaceae | Evolvulus sericeus Sw. | Native | Forb | Non-palatable |
| Asteraceae | Gaillardia pinnatifida Torr. | Native | Forb | Non-palatable |
| Onagraceae | Gaura coccinea Pursh | Native | Forb | Non-palatable |
| Polemoniaceae | Gilia incisa Benth. | Native | Forb | Non-palatable |
| Verbenaceae | Glandularia bipinnatifida (Nutt.) Nutt. | Native | Forb | Non-palatable |
| Asteraceae | Gymnosperma glutinosum (Spreng.) Less. | Native | Shrub | Non-palatable |
| Polygalaceae | Hebecarpa barbeyana (Chodat) J.R. Abbot | Native | Forb | Non-palatable |
| Rubiaceae | Hedyotis nigricans (Lam.) Fosberg | Native | Forb | Non-palatable |
| Rubiaceae | Hedyotis rubra (Cav.) A. Gray | Native | Forb | Non-palatable |
| Fabaceae | Hoffmannseggia watsonii (Fisher) Rose | Native | Forb | Palatable |
| Poaceae | Hopia obtusa (Kunth) Zuloaga & Morrone | Native | Grasses | Palatable |
| Violaceae | Hybanthus verbenaceus (Kunth) Loes. | Native | Forb | Non-palatable |
| Convolvulaceae | Ipomoea costellata Torr. | Native | Forb | Non-palatable |
| Convolvulaceae | Ipomoea purpurea (L.) Roth | Native | Forb | Palatable |
| Asteraceae | Laennecia coulteri (A. Gray) G.L. Nesom | Native | Forb | Non-palatable |
| Polemoniaceae | Loeselia greggii S. Watson | Native | Forb | Non-palatable |
| Malvaceae | Malva parviflora L. | Introduced | Forb | Palatable |
| Cactaceae | Mammillaria heyderi Muehlenpf. | Native | Cacti | Non-palatable |
| Scrophulariaceae | Mecardonia vandellioides (Kunth) Pennell | Native | Forb | Non-palatable |
| Oleaceae | Menodora coulteri A. Gray | Native | Forb | Palatable |
| Fabaceae | Mimosa aculeaticarpa Ortega | Native | Shrub | Palatable |
| Fabaceae | Mimosa subinermis (S. Watson) B.L. Turner | Native | Forb | Palatable |
| Nyctaginaceae | Mirabilis oblongifolia (A. Gray) Heimerl | Native | Forb | Non-palatable |
| Poaceae | Muhlenbergia arenicola Buckley | Native | Grasses | Palatable |
| Poaceae | Muhlenbergia depauperata Scribn. | Native | Grasses | Non-palatable |
| Poaceae | Muhlenbergia phleoides (Kunth) J.T. Columbus | Native | Grasses | Palatable |
| Poaceae | Muhlenbergia repens (J. Presl) Hitchc. | Native | Grasses | Palatable |
| Poaceae | Muhlenbergia rigida (Kunth) Kunth | Native | Grasses | Palatable |
| Poaceae | Muhlenbergia torreyi (Kunth) Hitchc. ex Bush | Native | Grasses | Palatable |
| Poaceae | Muhlenbergia villiflora Hitchc. | Native | Grasses | Palatable |
| Poaceae | Munroa pulchella (Kunth) L. D. Amarilla | Native | Grasses | Palatable |
| Poaceae | Nassella leucotricha (Trin. & Rupr.) R.W. Pohl | Native | Grasses | Palatable |
| Poaceae | Nassella tenuissima (Trin.) Barkworth | Native | Grasses | Palatable |
| Brassicaceae | Nerisyrenia linearifolia (S. Watson) Greene | Native | Forb | Non-palatable |
| Nostocaceae | Nostoc commune Vaucher ex Bornet & Flahault | Native | Bacteria | Non-palatable |
| Onagraceae | Oenothera berlandieri (Spach) Spach ex D. Dietr. | Native | Forb | Non-palatable |
| Ophioglossaceae | Ophioglossum engelmannii Prantl | Native | Fern | Non-palatable |
| Cactaceae | Opuntia engelmannii Salm-Dyck | Native | Cacti | Palatable |
| Cactaceae | Opuntia lindheimeri Engelm. | Native | Cacti | Palatable |
| Cactaceae | Opuntia stenopetala Engelm. | Native | Cacti | Palatable |
| Poaceae | Panicum hallii Vasey | Native | Grasses | Palatable |
| Asteraceae | Parthenium confertum A. Gray | Native | Forb | Non-palatable |
| Asteraceae | Parthenium incanum Kunth | Native | Shrub | Palatable |
| Plantaginaceae | Penstemon barbatus (Cav.) Roth | Native | Forb | Non-palatable |
| Montiaceae | Phemeranthus aurantiacus (Engelm.) Kiger | Native | Forb | Non-palatable |
| Brassicaceae | Physaria argyraea (A. Gray) O’Kane & Al-Shehbaz | Native | Forb | Non-palatable |
| Brassicaceae | Physaria fendleri (A. Gray) O’Kane & Al-Shehbaz | Native | Forb | Non-palatable |
| Solanaceae | Physalis hederifolia A. Gray | Native | Forb | Non-palatable |
| Phyllanthaceae | Phyllanthus polygonoides Nutt. ex Spreng. | Native | Forb | Non-palatable |
| Polygalaceae | Polygala dolichocarpa S.F. Blake | Native | Forb | Non-palatable |
| Fabaceae | Pomaria canescens (Fisher) B.B. Simpson | Native | Forb | Palatable |
| Portulacaceae | Portulaca pilosa L. | Native | Forb | Non-palatable |
| Fabaceae | Prosopis glandulosa Torr. | Native | Shrub | Palatable |
| Asteraceae | Pseudognaphalium luteoalbum (L.) Hilliard & B.L. Burtt | Native | Forb | Non-palatable |
| Asteraceae | Pseudognaphalium roseum (Kunth) Anderb. | Native | Forb | Non-palatable |
| Polygalaceae | Rhinotropis lindheimeri (A. Gray) J.R. Abbott | Native | Forb | Non-palatable |
| Anacardiaceae | Rhus microphylla Engelm. | Native | Shrub | Non-palatable |
| Anacardiaceae | Rhus virens Lindh. ex A. Gray | Native | Shrub | Non-palatable |
| Fabaceae | Rhynchosia senna Gillies ex Hook. & Arn. | Native | Forb | Palatable |
| Lamiaceae | Salvia ballotiflora Benth. | Native | Shrub | Non-palatable |
| Lamiaceae | Salvia reflexa Hornem. | Native | Forb | Palatable |
| Asteraceae | Sanvitalia ocymoides DC. | Native | Forb | Non-palatable |
| Apocynaceae | Sarcostemma crispum Benth. | Native | Forb | Non-palatable |
| Fabaceae | Senna demissa (Rose) H.S. Irwin & Barneby | Native | Forb | Palatable |
| Malvaceae | Sida abutifolia Mill. | Native | Forb | Palatable |
| Malvaceae | Sida spinosa L. | Native | Forb | Palatable |
| Acanthaceae | Siphonoglossa pilosella (Nees) Torr. | Native | Forb | Non-palatable |
| Solanaceae | Solanum elaeagnifolium Cav. | Native | Forb | Palatable |
| Malvaceae | Sphaeralcea angustifolia (Cav.) G. Don | Native | Forb | Palatable |
| Malvaceae | Sphaeralcea hastulata A. Gray | Native | Forb | Palatable |
| Asteraceae | Stevia tomentosa Kunth | Native | Forb | Non-palatable |
| Brassicaceae | Synthlipsis greggii A. Gray | Native | Forb | Non-palatable |
| Rutaceae | Thamnosma texana (A. Gray) Torr. | Native | Forb | Non-palatable |
| Asteraceae | Thelesperma simplicifolium (A. Gray) A. Gray | Native | Forb | Non-palatable |
| Asteraceae | Thymophylla pentachaeta (DC.) Small | Native | Forb | Non-palatable |
| Asteraceae | Thymophylla setifolia Lag. | Native | Forb | Non-palatable |
| Boraginaceae | Tiquilia canescens (A. DC.) A.T. Richardson | Native | Forb | Non-palatable |
| Asteraceae | Townsendia mexicana A. Gray | Native | Forb | Non-palatable |
| Zygophyllaceae | Tribulus terrestris L. | Introduced | Forb | Non-palatable |
| Cactaceae | Turbinicarpus beguinii (N.P. Taylor) Mosco & Zanov. | Native | Cacti | Non-palatable |
| Poaceae | Urochloa meziana (Hitchc.) Morrone & Zuloaga | Native | Grasses | Palatable |
| Fabaceae | Vachellia glandulifera (S. Watson) Seigler & Ebinger | Native | Shrub | Non-palatable |
| Asteraceae | Verbesina hypomalaca B.L. Rob. & Greenm. | Native | Forb | Non-palatable |
| Verbenaceae | Verbena neomexicana (A. Gray) Small | Native | Forb | Non-palatable |
| Asteraceae | Viguiera dentata (Cav.) Spreng. | Native | Forb | Non-palatable |
| Asteraceae | Xanthisma spinulosum (Pursh) D.R. Morgan & R.L. Hartm. | Native | Forb | Non-palatable |
| Asteraceae | Zinnia acerosa (DC.) A. Gray | Native | Forb | Non-palatable |
References
- Arévalo, J.R.; Fernández-Lugo, S.; De Nascimento, L.; Bermejo, L.A.; Naranjo, A.; Arévalo, J.R. Grazing Management and Impact in the Canary Islands: Rethinking Sustainable Use. In Grazing Ecology: Vegetation and Soil Impact; Arévalo, J.R., Ed.; Nova Science Publishers, Inc.: New York, NY, USA, 2012; 17p. [Google Scholar]
- Milchunas, D.G.; Sala, O.E.; Lauenroth, W.K. A generalized model of the effects of grazing by large herbivores on grasslands community structure. Am. Nat. 1988, 132, 87–106. [Google Scholar] [CrossRef]
- Crawley, M.J. (Ed.) Plant-Herbivore Dynamics. In Plant Ecology; Blackwell Science: Oxford, UK, 1997; pp. 401–474. [Google Scholar]
- Olff, H.; Ritchie, M.E. Effects of herbivores on grassland plant diversity. Trends Ecol. Evol. 1998, 13, 261–265. [Google Scholar] [CrossRef] [Green Version]
- Teague, R.; Barnes, M. Grazing management that regenerates ecosystem function and grazingland livelihoods. Afr. J. Range Forage Sci. 2017, 34, 77–86. [Google Scholar] [CrossRef]
- Casado, M.A.; Castro, I.; Ramírez-Sanz, L.; Costatenorio, M.; De Miguel, J.M.; Pineda, F.D. Herbaceous plant richness and vegetation cover in Mediterranean grasslands and shrublands. Plant Ecol. 2004, 170, 83–91. [Google Scholar] [CrossRef]
- Arévalo, J.R.; Chinea, E.; Barquín, E. Pasture management under goat grazing in Canary Islands. Agric. Ecosyst. Environ. 2007, 118, 291–296. [Google Scholar] [CrossRef]
- Steffens, M.; Kölbl, A.; Totsche, K.U.; Kögel-Knabner, I. Grazing effects on soil chemical and physical properties in a semiarid steppe of Inner Mongolia (PR China). Geoderma 2008, 143, 63–72. [Google Scholar] [CrossRef]
- Gusha, J.; Mugabe, P.H. Unpalatable and wiry grasses are the dominant grass species in semi-arid communal rangelands in Zimbabwe. Int. J. Dev. Sustain. 2013, 2, 1075–1083. [Google Scholar]
- Encina-Domínguez, J.A.; Valdés-Reyna, J.; Villarreal-Quintanilla, J.A. Estructura de un zacatal de toboso (Hilaria mutica: Poaceae) asociado a sustrato ígneo en el noreste de Coahuila, México. J. Bot. Res. Inst. Tex. 2014, 8, 583–594. [Google Scholar] [CrossRef] [Green Version]
- Arévalo, J.R.; Fernández-Lugo, S.; Reyes-Betancort, J.A.; Tejedor, M.; Jiménez, C.; Díaz, F.J. Relationships between soil parameters and vegetation in abandoned terrace fields vs. non-terraced fields in arid lands (Lanzarote, Spain): An opportunity for restoration. Acta Oecologica 2017, 85, 77–84. [Google Scholar] [CrossRef]
- Arévalo, J.R.; Encina-Domínguez, J.A.; Mellado, M.; García-Martínez, J.E.; Cruz-Anaya, A. Impact of 25 years of grazing on the forest structure of Pinus cembroides in northeast México. Acta Oecologica 2021, 111, 103743. [Google Scholar] [CrossRef]
- Coupland, R.T. Natural temperate grasslands. In Grassland Ecosystems of the World; Coupland, R.T., Ed.; Cambridge University Press: Cambridge, UK, 1979; pp. 41–111. [Google Scholar]
- Shreve, F. Grassland and related vegetation in northern Mexico. Madroño 1942, 6, 190–198. [Google Scholar]
- Rzedowski, J. An ecological and phytogeographical analysis of the grasslands of Mexico. Taxon 1975, 24, 67–80. [Google Scholar] [CrossRef]
- Herrera-Arrieta, Y.; Peterson, P.; Cerda-Lemus, M. Revisión de Bouteloua Lag. (Poaceae); Comisión para el Conocimiento y Uso de la Biodiversidad e Instituto Politécnico Nacional: Durango, México, 2004; 187p. [Google Scholar]
- Estrada-Castillón, E.; Scott-Morales, L.; Villarreal-Quintanilla, J.A.; Jurado-Ybarra, E.; Cotera-Correa, M.; Cantú-Ayala, C.; García-Pérez, J. Clasificación de los pastizales halófilos del noreste de México asociados con perrito de las praderas (Cynomys mexicanus): Diversidad y endemismo de especies. Rev. Mex. Biodivers. 2010, 81, 401–416. [Google Scholar] [CrossRef] [Green Version]
- Gutiérrez, R.; Medina, G.; Amador, M.D. Carga Animal del Pastizal Mediano Abierto en Zacatecas; Instituto Nacional de Investigaciones Forestales, Agrícolas y Pecuarias N° 46: Zacatecas, México, 2007; pp. 1–37. [Google Scholar]
- Van Coller, H.; Siebert, F.; Scogings, P.F.; Ellis, S. Herbaceous responses to herbivory, fire and rainfall variability differ between grasses and forbs. S. Afr. J. Bot. 2018, 119, 94–103. [Google Scholar] [CrossRef]
- Toulmin, C.; Scoones, I. Ways Forward? Technical Choices, Intervention Strategies and Policy Option. In Dynamics and Diversity: Soil Fertility and Livelihoods in Africa; Scoones, I., Ed.; Earthscan: London, UK, 2001; pp. 176–208. [Google Scholar] [CrossRef]
- Manzano, M.G.; Navar, J.; Pando, M.M.; Martínez, A. Overgrazing and desertification in northern Mexico: Highlights on north eastern region. Ann. Arid. Zone 2000, 39, 285–304. [Google Scholar]
- Anon. Programa de Manejo de la Zona Sujeta a Conservación Ecológica “Sierra de Zapalinamé”; Secretaría de Desarrollo Social, Gobierno del Estado de Coahuila: Saltillo, Mexico, 1998; p. 179. [Google Scholar]
- Encina-Domínguez, J.A. Riqueza Florística y Comunidades Vegetales de la Sierra de Zapalinamé, Saltillo, Coahuila, México. PhD Thesis, Facultad de Ciencias Forestales, Universidad Autónoma de Nuevo León, San Nicolás de los Garza, México, 2017; p. 145. [Google Scholar]
- Favret-Tondato, R.C. Apropiación de los Recursos Naturales y Producción en el Territorio de la Sierra de Zapalinamé. In Guía para Conocer y Valorar el Área Protegida de la Sierra de Zapalinamé; Arizpe-Narro, A., Ed.; Elementocero Ediciones: Saltillo, Mexico, 2013; pp. 89–101. [Google Scholar]
- Nelson, D.W.; Sommer, L.E. Total carbon, organic carbon and organic matter. In Methods of Soil Analysis, Part 2. Chemical and Microbiological Properties, 2nd ed.; ASA-SSSA: Madison, WI, USA, 1982. [Google Scholar]
- SEMARNAT. Norma Oficial Mexicana NOM-021-SEMARNAT-2000. In Establece las Especificaciones de Fertilidad, Salinidad y Clasificación de Suelos. Estudios, Muestreo y Análisis. Diario Oficial de la Federación; Secretaria de Medio Ambiente y Recursos Naturales: Mexico City, Mexico, 2000. [Google Scholar]
- Fernández-Linares, L.C.; Rojas-Avelizapa, N.G.; Roldán-Carrillo, T.G.; Ramírez-Islas, M.E.; Zegarra-Martínez, H.G.; Uribe-Hernández, R.; Ávila, R.J.R.; Hernández, D.F.; Ortega, J.M.A. Manual de Técnicas de Análisis de Suelo Aplicadas a la Remediación de Sitios Contaminados; Instituto Mexicano del Petróleo, Secretaría de Medio Ambiente y Recursos Naturales e Instituto Nacional de Ecología: Mexico City, Mexico, 2006; 179p. [Google Scholar]
- Smith, B.; Wilson, J.B. A consumer’s guide to evenness indices. Oikos 1996, 76, 70–82. [Google Scholar] [CrossRef]
- Ter Braak, C.J.F. The analysis of vegetation-environment relationships by canonical correspondence analysis. Vegetatio 1987, 69, 69–77. [Google Scholar] [CrossRef]
- Gauch, H.G., Jr. Multivariate Analysis in Community Ecology; Cambridge University Press: Cambridge, UK, 1982; p. 298. [Google Scholar] [CrossRef]
- Ter Braak, C.J.F.; Šmilauer, P. CANOCO Reference Manual and CanoDraw for Windows Users Guide: Software for Canonical Community Ordination (Version 5.1); Microcomputer Power: Ithaca, NY, USA, 2018. [Google Scholar]
- Hill, M.O.; Gauch, H.J., Jr. Detrended Correspondence Analysis: An improved ordination technique. Vegetatio 1980, 42, 47–58. [Google Scholar] [CrossRef]
- McCune, B.; Grace, J.B.; Urban, D.L. Analysis of Ecological Communities; MjM Software Design: Gleneden Beach, OR, USA, 2002; Volume 28. [Google Scholar]
- De Cáceres, M.; Legendre, P.; Moretti, M. Improving indicator species analysis by combining groups of sites. Oikos 2010, 119, 1674–1684. [Google Scholar] [CrossRef]
- Oksanen, J.; Blanchet, F.G.; Friendly, M.; Kindt, R.; Legendre, P.; McGlinn, D.; Wagner, H. Vegan: Community Ecology Package; R Package Version 2.5-7. 2020. Available online: https://CRAN.R-project.org/package=vegan (accessed on 2 January 2022).
- Sánchez-Arroyo, J.F.; Wehenkel, C.; Carrete-Carreón, F.; Murillo-Ortiz, M.; Herrera-Torres, E.; Quero-Carrillo, A.R. Establishment attributes of Bouteloua curtipendula (Michx.) Torr. populations native to Mexico. Rev. Fitotec. Mex. 2018, 41, 237–243. [Google Scholar] [CrossRef] [Green Version]
- Mellado, M.; Encina-Domínguez, J.A.; García, J.E.; Estrada-Castillón, E.A.; Arévalo, J.R. Vegetation response to removal of plant functional groups and grass seeding in a microphyllous desert shrubland: A 4-year field experimente. Agriculture 2021, 11, 322. [Google Scholar] [CrossRef]
- Encina-Domínguez, J.A.; Estrada-Castillón, E.; Mellado, M.; González-Montelongo, C.; Arévalo, J.R. Livestock grazing impact on species composition and richness understory of the Pinus cembroides Zucc. forest in northeastern Mexico. Forest 2022, 13, 113. [Google Scholar] [CrossRef]
- Zhao, L.P.; Wang, D.; Liang, F.H.; Liu, Y.; Wu, G.L. Grazing exclusion promotes grasses functional group dominance via increasing of bud banks in steppe community. J. Environ. Manag. 2019, 251, 109589. [Google Scholar]
- De Alba Becerra, R.; Winder, J.; Holechek, J.L.; Cárdenas, M. Diets of 3 cattle breeds on Chihuahuan Desert rangeland. J. Range Manag. 1998, 270–275. [Google Scholar] [CrossRef]
- Mellado, M.; Olvera, A.; Quero, A.; Mendoza, G. Dietary overlap between prairie dog (Cynomys mexicanus) and beef cattle in a desert rangeland of northern Mexico. J. Arid Environ. 2005, 62, 449–458. [Google Scholar]
- Soltero-Gardea, S.; Ortega, I.M.; Bryant, F.C. Nutrient content of important deer forage plants in the Texas coastal Bend. Tex. J. Sci. 1994, 46, 133–142. [Google Scholar]
- Brady, W.W.; Stromberg, M.R.; Aldon, E.F.; Bonham, C.D.; Henry, S.H. Response of a semidesert grassland to 16 years of rest from grazing. J. Range Manag. 1989, 42, 284–288. [Google Scholar]
- Loeser, M.R.; Mezulis, S.D.; Sisk, T.D.; Theimer, T.C. Vegetation cover and forb responses to cattle exclusion: Implications for pronghorn. Rangel. Ecol. Manag. 2005, 42, 284–288. [Google Scholar]
- Su, L.; Yang, Y.; Li, X.; Wang, D.; Liu, Y.; Liu, Y.; Yang, Z.; Li, M. Increasing plant diversity and forb ratio during the revegetation processes of trampled areas and trails enhances soil infiltration. Land Degrad. Dev. 2018, 29, 4025–4034. [Google Scholar]
- Trigo, C.B.; Villagra, P.E.; Coles, P.C.; Marás, G.A.; Andrade-Díaz, M.S.; Núñez-Regueiro, M.M.; Derlindati, E.J.; Tálamo, A. Can livestock exclusion affect understory plant community structure? An experimental study in the dry Chaco forest, Argentina. For. Ecol. Manag. 2020, 463, 118014. [Google Scholar]
- Macchi, L.; Grau, H.R. Piospheres in the dry Chaco. Contrasting effects of livestock puestos on forest vegetation and bird communities. J. Arid Environ. 2012, 87, 176–187. [Google Scholar] [CrossRef]
- Trigo, C.B.; Tálamo, A.; Núñez-Regueiro, M.M.; Derlindati, E.J.; Marás, G.A.; Barchuk, A.H.; Palavecino, A.A. woody plant community & tree-cacti associations change with distance to a water source in a dry Chaco forest of Argentina. Rangel. J. 2017, 39, 15–23. [Google Scholar]
- Tálamo, A.; Barchuk, A.; Cardozo, S.; Trucco, C.; Maras, G.; Trigo, C. Direct vs. indirect facilitation (herbivore-mediated) among woody plants in a semiarid Chaco forest: A spatial association approach. Austral. Ecol. 2015, 40, 573–580. [Google Scholar] [CrossRef]
- Tálamo, A.; Barchuk, A.; Garibaldi, L.A.; Trucco, C.; Cardozo, S.; Mohr, F. Disentangling the effects of shrubs and herbivores on tree regeneration in a dry Chaco forest (Argentina). Oecologia 2015, 178, 847–854. [Google Scholar] [CrossRef] [PubMed]
- Peco, B.; Sánchez, A.M.; Azcárate, F.M. Abandonment in grazing systems: Consequences for vegetation and soil. Agric. Ecosyst. Environ. 2006, 113, 284–294. [Google Scholar] [CrossRef]
- Milchunas, D.G.; Lauenroth, W.K. Quantitative effects of grazing on vegetation and soil over a global range of environments. Ecol. Monogr. 1993, 63, 327–366. [Google Scholar] [CrossRef]
- Cingolani, A.M.; Cabido, M.R.; Renison, D.; Solís-Neffa, V. Combined effects of environment and grazing on vegetation structure in Argentine granite grasslands. J. Veg. Sci. 2003, 14, 223–232. [Google Scholar] [CrossRef]
- Hillebrand, H. Opposing effects of grazing and nutrients on diversity. Oikos 2003, 100, 592–600. [Google Scholar] [CrossRef]
- Altesor, A.; Oesterheld, M.; Leoni, E.; Lezama, F.; Rodríguez, C. Effect of grazing on community structure and productivity of a Uruguayan grassland. Plant Ecology 2005, 179, 83–91. [Google Scholar] [CrossRef]
- Gao, J.; Carmel, Y. A global meta-analysis of grazing effects on plant richness. Agric. Ecosyst. Environ. 2020, 302, 107072. [Google Scholar] [CrossRef]
- McIntyre, S.; Lavorel, S. Livestock grazing in subtropical pastures: Steps in the analysis of attribute response and plant functional types. J. Ecol. 2001, 89, 209–226. [Google Scholar] [CrossRef]
- Box, E.O. Plant functional types and climate at the global scale. J. Veg. Sci. 1996, 7, 309–320. [Google Scholar] [CrossRef]
- Arévalo, J.R.; Chinea, E. Pastures seedbank composition in relation with soil nutrient content in areas under goat grazing management (Tenerife). J. Food Agric. Environ. 2009, 7, 710–716. [Google Scholar]
- Greenwood, K.L.; McKenzie, B.M. Grazing effects on soil physical properties and the consequences for pastures: A review. Aust. J. Exp. Agric. 2001, 41, 1231–1250. [Google Scholar] [CrossRef]
- Medina-Roldán, E.; Paz-Ferreiro, J.; Bardgett, R.D. Grazing exclusion affects soil and plant communities, but has no impact on soil carbon storage in an upland grassland. Agric. Ecosyst. Environ. 2012, 149, 118–123. [Google Scholar] [CrossRef]
- McSherry, M.E.; Ritchie, M.E. Effects of grazing on grassland soil carbon: A global review. Glob. Change Biol. 2013, 19, 1347–1357. [Google Scholar] [CrossRef]
- Xu, M.Y.; Xie, F.; Wang, K. Response of vegetation and soil carbon and nitrogen storage to grazing intensity in semi-arid grasslands in the agro-pastoral zone of northern China. PLoS ONE 2014, 9, e96604. [Google Scholar] [CrossRef]
- Thompson, K.; Uttley, M.G. Do grasses benefit from grazing? Oikos 1982, 39, 113–115. [Google Scholar] [CrossRef]
- DÍAz, S.; Lavorel, S.; McIntyre, S.U.; Falczuk, V.; Casanoves, F.; Milchunas, D.G.; Skarpe, C.; Rusch, G.; Sternberg, M.; Noy-Meir, I.M.; et al. Plant traits responses to grazing: A global synthesis. Glob. Chang. Biol. 2007, 13, 313–341. [Google Scholar] [CrossRef]
- CONABIO (Comisión Nacional para el Conocimiento y Uso de la Biodiversidad). Malezas de México. 2021. Available online: http://www.conabio.gob.mx/malezasdemexico/2inicio/paginas/lista-plantas-generos.htm (accessed on 15 April 2021).
- Encina-Domínguez, J.A.; Estrada-Castillón, E.; Villarreal-Quintanilla, J.A.; Villaseñor, J.L.; Cantú-Ayala, C.M.; Arévalo, J.R. Floristic richness of the Sierra de Zapalinamé, Coahuila, México. Phytotaxa 2016, 283, 1–42. [Google Scholar] [CrossRef]
- SEMARNAT (Secretaría del Medio Ambiente y Recursos Naturales). Norma Oficial Mexicana NOM-059-SEMARNAT-2010 que Determina las Especies Nativas de México de Flora y Fauna Silvestres—Categorías de Riesgo y Especificaciones para su Inclusión, Exclusión o Cambio—Lista de Especies en Riesgo; 2nd Section; Diario Oficial de la Federación: Mexico City, Mexico, 2010. [Google Scholar]
- Arévalo, J.R.; Delgado, J.D.; Otto, R.; Naranjo, A.; Salas, M.; Fernández-Palacios, J.M. Distribution of alien vs. native plant species in roadside communities along an altitudinal gradient in Tenerife and Gran Canaria (Canary Islands). Perspect. Plant Ecol. Evol. Syst. 2005, 7, 185–202. [Google Scholar] [CrossRef]


| % | mg/kg | ||||||||||||||||
|---|---|---|---|---|---|---|---|---|---|---|---|---|---|---|---|---|---|
| Plot | Alt (m a.s.l.) | Aspect | Slope | pH | OM | P Ols | K | Ca | Mg | Na | TN | Fe | Zn | Mn | Cu | B | S |
| E1 | 2243 | 140 | 15 | 7.99 | 7.04 | 15.9 | 519 | 4147 | 136 | 15.5 | 21.0 | 4.3 | 0.21 | 8.27 | 0.6 | 1.95 | 4.22 |
| C1 | 2246 | 140 | 15 | 8.10 | 7.02 | 16.5 | 489 | 4440 | 144 | 14.5 | 12.1 | 3.59 | 0.29 | 7.96 | 0.58 | 1.8 | 2.81 |
| E2 | 2231 | 140 | 23 | 8.00 | 6.22 | 18.7 | 315 | 4418 | 134 | 10.0 | 12.8 | 4.42 | 0.25 | 7.6 | 0.58 | 1.71 | 1.41 |
| C2 | 2235 | 140 | 23 | 8.16 | 4.54 | 18.3 | 330 | 4287 | 142 | 11.5 | 10.7 | 4.02 | 0.28 | 8.37 | 0.59 | 1.71 | 7.03 |
| E3 | 2213 | 140 | 20 | 8.09 | 7.30 | 20.9 | 274 | 4230 | 142 | 16.6 | 12.5 | 4.04 | 0.35 | 9.32 | 0.5 | 1.95 | 1.41 |
| C3 | 2220 | 140 | 20 | 8.09 | 7.19 | 20.1 | 498 | 4294 | 163 | 12.6 | 12.8 | 3.25 | 0.25 | 7.68 | 0.57 | 1.93 | 1.41 |
| E4 | 2194 | 135 | 25 | 8.09 | 6.57 | 28.4 | 296 | 3927 | 149 | 17.0 | 13.6 | 3.72 | 0.25 | 6.89 | 0.58 | 1.92 | 1.41 |
| C4 | 2198 | 135 | 25 | 8.01 | 6.66 | 17.0 | 245 | 3934 | 136 | 14.2 | 12.4 | 4.63 | 0.24 | 7.6 | 0.55 | 1.85 | 1.41 |
| E5 | 2171 | 140 | 18 | 7.95 | 5.32 | 20.4 | 186 | 3689 | 178 | 17.5 | 12.8 | 4.44 | 0.27 | 7.2 | 0.4 | 1.93 | 1.41 |
| C5 | 2180 | 140 | 18 | 8.17 | 5.43 | 18.7 | 183 | 3675 | 200 | 12.4 | 12.2 | 3.7 | 0.28 | 7.27 | 0.43 | 1.79 | 1.41 |
| E6 | 2131 | 140 | 12 | 8.09 | 6.18 | 16.9 | 284 | 3938 | 159 | 11.8 | 15.0 | 3.16 | 0.23 | 7.51 | 0.45 | 2.02 | 1.41 |
| C6 | 2138 | 140 | 12 | 8.11 | 6.89 | 16.9 | 288 | 4081 | 160 | 16.1 | 15.7 | 3.16 | 0.2 | 8.06 | 0.45 | 1.98 | 5.63 |
| E7 | 2129 | 140 | 10 | 8.28 | 3.13 | 13.8 | 233 | 3328 | 367 | 7.05 | 8.21 | 3.3 | 0.36 | 5.84 | 0.43 | 1.42 | 5.63 |
| C7 | 2125 | 140 | 10 | 8.16 | 3.15 | 15.1 | 210 | 3195 | 357 | 12.8 | 8.62 | 3.24 | 0.24 | 5.94 | 0.43 | 1.51 | 1.39 |
| E8 | 2112 | 140 | 10 | 8.16 | 5.89 | 23.5 | 147 | 3847 | 249 | 19.1 | 10.4 | 3.27 | 0.29 | 8.87 | 0.4 | 1.81 | 1.41 |
| C8 | 2115 | 140 | 10 | 8.11 | 6.79 | 27.1 | 222 | 3906 | 238 | 15.3 | 12.5 | 3.42 | 0.28 | 8.93 | 0.42 | 1.87 | 1.41 |
Publisher’s Note: MDPI stays neutral with regard to jurisdictional claims in published maps and institutional affiliations. |
© 2022 by the authors. Licensee MDPI, Basel, Switzerland. This article is an open access article distributed under the terms and conditions of the Creative Commons Attribution (CC BY) license (https://creativecommons.org/licenses/by/4.0/).
Share and Cite
Arévalo, J.R.; González-Montelongo, C.; Encina-Domínguez, J.A.; García, E.; Mellado, M. Changes in Richness and Species Composition after Five Years of Grazing Exclusion in an Endemic Pasture of Northern Mexico. Land 2022, 11, 1962. https://doi.org/10.3390/land11111962
Arévalo JR, González-Montelongo C, Encina-Domínguez JA, García E, Mellado M. Changes in Richness and Species Composition after Five Years of Grazing Exclusion in an Endemic Pasture of Northern Mexico. Land. 2022; 11(11):1962. https://doi.org/10.3390/land11111962
Chicago/Turabian StyleArévalo, José Ramón, Cristina González-Montelongo, Juan A. Encina-Domínguez, Eduardo García, and Miguel Mellado. 2022. "Changes in Richness and Species Composition after Five Years of Grazing Exclusion in an Endemic Pasture of Northern Mexico" Land 11, no. 11: 1962. https://doi.org/10.3390/land11111962