
Impacts of Extension Contact on the Adoption of Formulated Fertilizers and Farm Performance among Large-Scale Farms in Rural China


1
Business School, Yangzhou University, Yangzhou 225127, China
2
College of Public Administration, Nanjing Agricultural University, Nanjing 210095, China
3
Institute of Agricultural Economics and Development, Chinese Academy of Agricultural Sciences, Beijing 100081, China
*
Authors to whom correspondence should be addressed.
Land 2022, 11(11), 1974; https://doi.org/10.3390/land11111974
Submission received: 14 September 2022
/
Revised: 23 October 2022
/
Accepted: 1 November 2022
/
Published: 4 November 2022
(This article belongs to the Topic Advances in Sustainable Agri-Food Systems: Insights into Production, Processing, and Consumption Perspectives)
Abstract
:Growing concerns about the environmental costs of agricultural production have given new impetus to the promotion of sustainable agricultural production technologies that can reduce soil erosion and the excessive use of agricultural chemicals. Although numerous policies have been implemented to popularize soil testing and formulated fertilization technologies in China, the diffusion of the technology among large-scale farmers (LSFs) has been addressed only rarely. We used a two-stage controlled function model to control for endogeneity and selection bias in contacting extension staff to assess the effect of an extension contact on technology adoption behavior by LSFs, Propensity Score Matching techniques are also utilized to analyze the effects of extension contact on the rice yields and nutrient use amount. Empirical results from Jiangsu and Jiangxi provinces show that extension contact plays a crucial role in promoting soil testing and the adoption of formulated fertilization technologies; LSFs’ adoption raises rice yields, however, the impact of extension contact on reducing nutrient use amount does not pass the significance test. The findings add to the theoretical literature on technology extension, and we used them to suggest policies to encourage tailored agricultural extension systems by constructing rural technological extension networks.
1. Introduction
Part of the impetus for green revolutions comes from the use of chemical fertilizers, which are crucial for intensifying sustainable agriculture, crop production, and hunger alleviation worldwide [1]. The China National Bureau of Statistics (CNBS) reports that more than 80% of China’s grain production uses chemical fertilizers and 40% of increases in grain yield come from the intensified use of chemical fertilizers [2]. However, the intensity of chemical fertilizer use in China has been at the upper limit of the international safety fertilization threshold (225 kg/ha) since 1995. In 2019, it reached 325.65 kg/ha, which was 44.73% higher than the upper limit of the international safety fertilization threshold. The excessive use of chemical fertilizer and nutrients loss (mainly N and P) are of urgent ecological concerns because of their effects on eutrophication and greenhouse gas emissions [3]. Soil testing and formulated fertilization technologies have been promoted by central authorities since 2005 to address this issue. The central government invested a total of CNY 8.5 billion in extending soil testing and formulated fertilization technologies until 2015, with an extension area of more than 9.33 × 10⁷ hectares and provided 190 million farm households with free services [4]. A field trial demonstrated that soil testing and formulated fertilization technologies can increase grain crop yield by 6–10% and increase profit from crops by more than 450 CNY/ha [5]. However, the real area covered is only about one-third of the extension areas [6], and utilization rates are extraordinarily low [7].
Extension services have pivotal roles in disseminating agricultural technologies to farmers [8]. The extension service of agricultural technology not only promotes scientific and technological development but also accelerates agricultural modernization [9]. Although great efforts have been made by governments, owing to low efficiency, top-down institutional arrangements, and poor demand for agricultural extension services [10], the rate at which agricultural extension services have been adopted in developing countries still remains low [11,12,13]. China’s agriculture is experiencing rapid consolidation due to structural adjustments and labor migration. Large-scale farmers urgently need efficient, accurate, and personalized interaction with agricultural technology promoters to improve their ability of agricultural technology application [14].
Extension contacts have, therefore, been introduced to address these issues and to promote highly localized and knowledge-intensive soil testing and formulated fertilization technologies. Hands-on and in-field extension contact is different from traditional one-time, lecture-based training in extension services as it is more farmer-oriented; it allows agents to listen to what farmers need, thereby creating opportunities to reorient extension priorities [15]. The Department of Agricultural Extension mandated an increase in national coverage for large-scale farmers (LSFs). These work on family farms, large-scale grain production, and cultivate areas that are, on average, 177.30 mu and 102.13 mu, respectively. Currently, LSFs work about 20% of the land [16] but account for only 2% of total farmers [17]. These large-scale farmers are ideal subjects for increasing extension efficiency and agricultural productivity.
Previous studies have focused mainly on the effect of extension service on farmers’ technology adoption [18,19,20,21,22,23,24,25]. For example, Sheikh et al. [26], highlighted how the number of extensions’ visits potentially influenced the adoption of “no-tillage” technologies by farmers in Pakistan. Walisinghe et al. [27] contended that extension services positively influenced technology adoption in Sri Lanka for farmers cultivating all varieties of rice. Malima et al. explored the factors that affect the purchasing and upscaling of the privatized mobile soil testing services in Africa and addressed the importance of system institutions influenced adoption of the service [28]. However, only a few studies have addressed the relationship between extension contacts and the adoption of environmentally conscious practices from the supply side. For example, case-by-case extension contacts for specific guidance given more than three times is reported to increase the fertilizer application rate [29]. The gap in the literature is that limited research has been conducted to answer the question of how the extension contacts influence LSFs’ decisions to adopt agricultural technology from the demand side, and more importantly, how the effects of the extension contact on farm performance is rarely addressed [30,31].
In the context of extension contact in agricultural technology adoption and farm performance, we address the following limitations. First, the adoption of soil testing and formulated fertilization technologies among Chinese LSFs is rarely discussed, owing to the adjustment of the agricultural structure. The main body of agricultural production is now broadly split between smallholders and new agricultural management entities. These new entities include LSFs, farmer cooperatives, and leading agricultural enterprises. By 2016, there were already 2.8 million in China [32]. Different from smallholders, LSFs’ decision-making mechanism is different from small-scale farmers regarding new technology adoption. Second, extant research mainly focuses on the training and visit system, participatory demonstration, challenges encountered by extension services, extension contact on farmers’ income, and information transmission in extension services [33,34,35]; the rigorous analysis of extension contact interventions are less common [36]. Third, methodologically, both the Logit and Probit models have been used as common tools to examine farmers’ adoption decisions [18,37,38,39]. However, these methods may lead to endogeneity problems as extension services may be correlated with some unobserved error terms in the estimated model [40]. To avoid non-exposure and selection biases, we used a two-stage controlled function model in empirical estimations of LSF behavior toward technology adoption [41].
The goal of this paper is to provide quantitative evidence of how extension contacts influence LSFs’ adoption behavior of soil testing and formulated fertilization technologies and its effects on grain productivity and the nutrient use amount for rice production in the major grain production areas in China. To account for potential endogeneity and selection bias problems, we employed a two-stage controlled function model to estimate their marginal effects. The Propensity Score Matching approach is utilized to analyze the effects of extension contact on rice yields and nutrient use amount. The remainder of this paper is structured as follows: in Section 2, we present an overview of agricultural extension systems in China. In Section 3, we construct our research hypotheses and methods. In Section 4, we detail our results and discussions. Section 5 is the conclusion.
2. Overview of Agricultural Extension Systems in China
The system of extending soil testing and formulated fertilization technologies in China comprises a complex network of governmental and non-governmental organizations, such as private sectors. The Ministry of Finance provides funds for extension services, and development projects are initiated to implement extension activities at the county level. Extension contacts, which are core components of the extension system, are jointly operated by the Ministry of Agriculture and Rural Affairs as well as the Ministry of Finance. It is designed after carefully planned visits to rural regions to ensure that the farmers contacted receive the scheduled guidance on using formulated fertilizer techniques. At the county level, subsidies easily reach CNY 1 million for the first year and about CNY 0.5 million per year thereafter.
Soil testing and formulated fertilization technologies are extended via modes including government-led joint force extension; cooperative-driven; direct supply of soil testing and formulated fertilization technologies; fixed-point supply; unified soil testing distribution and supply; and field mixed supply. Among these, the government-led joint forces extension mode is the most widespread practice. The other five extension modes alleviate the contradiction between large-scale production and small-batch demand for soil testing and formulated fertilization technologies, but only to a certain extent. These extension modes modestly reduce the possibility of farmers purchasing counterfeit fertilizers. However, the operation of these modes relies mainly on the capabilities of local farmers to organize and operate professionally and the degree to which the services are socialized; it is thus not as universal as the government-led joint force extension mode.
The government-led joint force extension mode is directly linked to the Ministry of Agriculture and Rural Affairs, with representatives at soil and fertilizer stations at the province and county levels and agricultural technology extension stations from national to township levels. Manufacturers and distributors of formulated fertilizers, as well as grassroots agricultural technology extension staff, are important participants in technology demonstration and extension activities. They are, respectively, responsible for the production, sale, and provision of technical guidance on the use of formulated fertilizers. Distributors of formulated fertilizer and grassroots agricultural technology extension staff contact farmers directly to analyze their technical problems, difficulties, and demands related to fertilizer and ensure that extension messages correspond to farmers’ needs. The general structure of the government-led joint force extension mode is shown in Figure 1.
3. Research Hypothesis and Method
Realizing the importance of agricultural extension services is crucial for enhancing technology adoption as well as agricultural productivity [42]. The mechanisms of extension contact in influencing farm productivity are mainly through three channels: First, different from traditional extension services which attach importance to contact farmers for spreading technology information, extension contact targeting large-scale farmers could directly enhance extension efficiency. Second, the interactive nature of the extension contact could help LSFs convert the knowledge and technical guidance into productive behavior, and thus improve grain productivity. Third, extension contact on soil testing and formulated fertilization technologies are location-specific, it is made for a certain area mainly considered the socio-economic and agro-ecological conditions for increasing adoption rate and productivity.
3.1. Research Hypothesis
The adoption of a new technology refers to the “process by which an innovation is communicated through certain channels over time among the members of the social system” [43]. It starts with acquiring information (awareness) about the new technology, whether through media advertisements, extension agents, or social networks. Owing to the merits of direct extension service and personalized interaction and the need for accurate, real-time, convenient information [14,44], extension contacts can greatly improve the task–technology fit; that is, agricultural technology will accurately fit farmers requirements and demands [45]. Previous studies have shown significant effects of access to extension contact on adopting climate change adaptations [46,47], irrigation use, and crop diversification [48]. The basic idea is that extension contact could enhance innovation dissemination through advisory services, and access to information may motivate farmers to adopt new technologies.
As “an information-seeking and information-processing activity in which an individual is motivated to reduce uncertainty about the advantages and disadvantages of an innovation” [43], large-scale farmers are more likely to adopt new technology in two perspectives. On one hand, compared with small-scale farmers, large-scale farmers are mainly driven by economies of scale, as the time-searching costs of new technologies and labor costs are largely reduced by massive technology adoption, accordingly, the benefits of technology are higher compared with small-scale fields [49]. On the other hand, large-scale farmers have a high specialization level, they mainly specialize in one or two varieties of grains, as grain growth responses to chemical fertilizers often vary remarkably based on soil properties and nutrient levels [50]; large-scale farmers’ high specialization level will increase their technology adoption efficiency and reduce the costs of technology extension. Therefore, it is hypothesized as follows:
Hypothesis 1. (H1).
Extension contact has a positive impact on the adoption of formulated fertilization technologies among large-scale farmers.
Extension contact exerts its effects through both the supply and demand sides. From the supply side, compared with traditional public extension system and improved quality and quantity of extension contact, e.g., increasing farmer contact and restructuring the organizational structure of the extension systems, could increase productivity by rapid and efficient diffusion of knowledge and skills. From the demand side, extension contact could increase farm productivity by directly (e.g., adopting high-yielding grain seed and a new variety of chemical fertilizers) or indirectly (contact farmers spread knowledge to non-contact farmers) enhancing farmers’ application ability. For example, Xu et al. [51]. found that large-scale farmers are inclined to adopt fertilizer if the leader farmers have higher average adoption behavior, demonstrating the peer effects of technology adoption among large-scale farmers.
Previous studies have demonstrated that extension contact by training and visiting systems increased at least 7% of wheat productivity [24]. Arouna et al. evaluated the effectiveness of a personalized extension service on rice nutrient management and found that farmers select the type and amount of fertilizer input according to actual needs [52]. Due et al. also concluded that maize yields were significantly and positively correlated with extension contacts [53]. However, some early studies indicated that training and visiting extension failed in increasing adoption rates or grain yields in the Pakistan Punjab [54]. As previous studies mainly focus on the supply side of the extension contact, the farmers’ characteristics, particularly, large-scale farmers and their personal characteristics, e.g., farm size, education level, etc., are largely ignored.
Regarding the issue of nutrient use amount, extant research mainly focuses on chemical fertilizer use, finding paradoxical results. Research conducted in Africa found that farmer’ participation in Nigeria’s Growth Enhancement Support Scheme (GESS) increases fertilizer use [55]. Akpan and Aya also confirmed that the frequency of contact with extension agent is positively related to fertilizer use [56], whereas farmers’ participation in agricultural extension services in China reduced total fertilizer use and total inorganic fertilizer use from 1.7% to 3.7% [2]. These differences can be attributed to farmers’ resource endowments and preferences regarding site-specific extension services [57]. More importantly, farmers’ production behavior would be altered by extension contact in combining and optimizing the different inputs [58]. Few research examines the factors influencing farmers’ intentions to adopt nutriment management practices [59], rarely is attention paid to the effects of extension contact on nutrient use amount. Jia et al. [60] found that knowledge training reduced excessive nitrogen use by 7% with no impact on wheat yield in Shandong Province, China, whereas Rajkhowa and Qaim found that personalized digital extension services enhanced input intensity [61]. Due to the massive overuse of chemical fertilizers in China, large farms tend to use less for cost–benefit analyses [62]. Therefore, we argue that extension contact is negatively associated with nutrient use amount.
Hypothesis 2. (H2).
Extension contact has a positive effect on rice yields, whereas it has a negative effect on nutrient use amount.
3.2. Method
3.2.1. Two-Stage Controlled Function Model
Given that farmer’s adoption behavior is a binary outcome variable, we use the two-stage controlled function model to estimate the effect of extension contact on farmer’s soil testing and formulated fertilizer adoption behaviors. To estimate the effect of extension contact on LSFs’ adoption of soil testing and the formulated fertilization, we use the following specification (as shown in Equation (1)):
where indicates if the surveyed LSF has adopted the formulated fertilizer; extension contact denotes the binary situation if LSFs have received some extension contacts; is a vector of predetermined control variables that affect LSFs’ adoption of soil testing and formulated fertilization technologies; denotes the regional dummy variables; is a coefficient to be estimated; and is an error term.
The endogeneity of extension contact is an issue that emerges as contact with extension staff is voluntary, and technology adopters (versus. non-adopters) may be more (less) likely to contact them. In this case, a self-selection bias can be expected by making estimations using Equation (1) in the form without any restrictions on the covariance matrix [63]. Thus, the effect of extension on LSFs’ knowledge and technology adoption might be underestimated. We employed a two-step control function approach to address this estimation bias by following Wooldridge [64] and Lloyd-Smith et al. [65] and running a Probit model for an extension contact . The Probit model is defined as follows:
where is a vector of explanatory variables and the instrumental variable , which affects but has no effect on LSFs’ formulated fertilizer . The strength of the instrumental variables in Equation (2) is shown via a Wald test of their statistical significance. Following this, the generalized residual predicted using Equation (2) can be obtained as follows:
where is the inverse Mills ratio; in the Probit model, the generalized residual equals to the inverse Mills ratio [65].
In the second step of the control function approach, the generalized residual introduced in Equation (3) is added in Equation (4):
Thus, in this way, a Probit regression of Equation (4) will provide consistent estimates of . The statistical significance of , based on t-statistics reveals the presence of endogeneity. To test if the instruments can be excluded, we followed the approach suggested by Abdulai et al. [66] and re-estimate Equation (4) with the instruments as below:
If is not statistically different from zero, then the instrumental variable can be excluded from Equation (5); this implies that the instrumental variable is valid. As observations within a prefecture may tend to be similar in terms of contacting extension staff or similar adoption behaviors, the errors are likely to be correlated among LSFs in the same city. Therefore, we clustered standard errors at the city level.
3.2.2. Propensity Score Matching
The propensity score matching (PSM) model proposed by Rosenbaum and Rubin [67] has been widely employed to address self-selection issues. As a program evaluation technique, PSM is based on the idea of comparing the outcomes of extension contact with the outcomes of “equivalent” no-extension contact. Since the two groups are comparable on all observed characteristics, with the exception of extension contact, the differences in the outcomes are attributed to extension contact. Therefore, we employ the PSM model to account for selection bias in the estimation of the impact of extension contact on farm performance (rice yield and fertilizer use amount) and also the determinants of rice yield and fertilizer use amount. Following Rosenbaum and Rubin [67], the propensity score can be estimated as:
D is a dummy variable that equals 1 for large-scale grain producers who contacted agricultural extension staffs and zero otherwise. Additionally, X is a conditioning variable on which the subjects were matched, including as household-level, farm-level and village characteristics.
The utility (rice yield and nutrient use efficient) of large-scale grain producers derived from extension contact is YFEC, and the utility from no-extension contact is represented as YFNEC.
The core objective of estimating the propensity score is to balance the observed distribution of covariates across groups of participants in ICT-based MIS projects and non-participants.
In this study, PSM was used to balance the observed distribution of covariates across groups of extension contacts and no-extension contact. The Average Treatment Effect for the treated (ATT) is expressed as follows:
3.3. Study Area and Data Collection
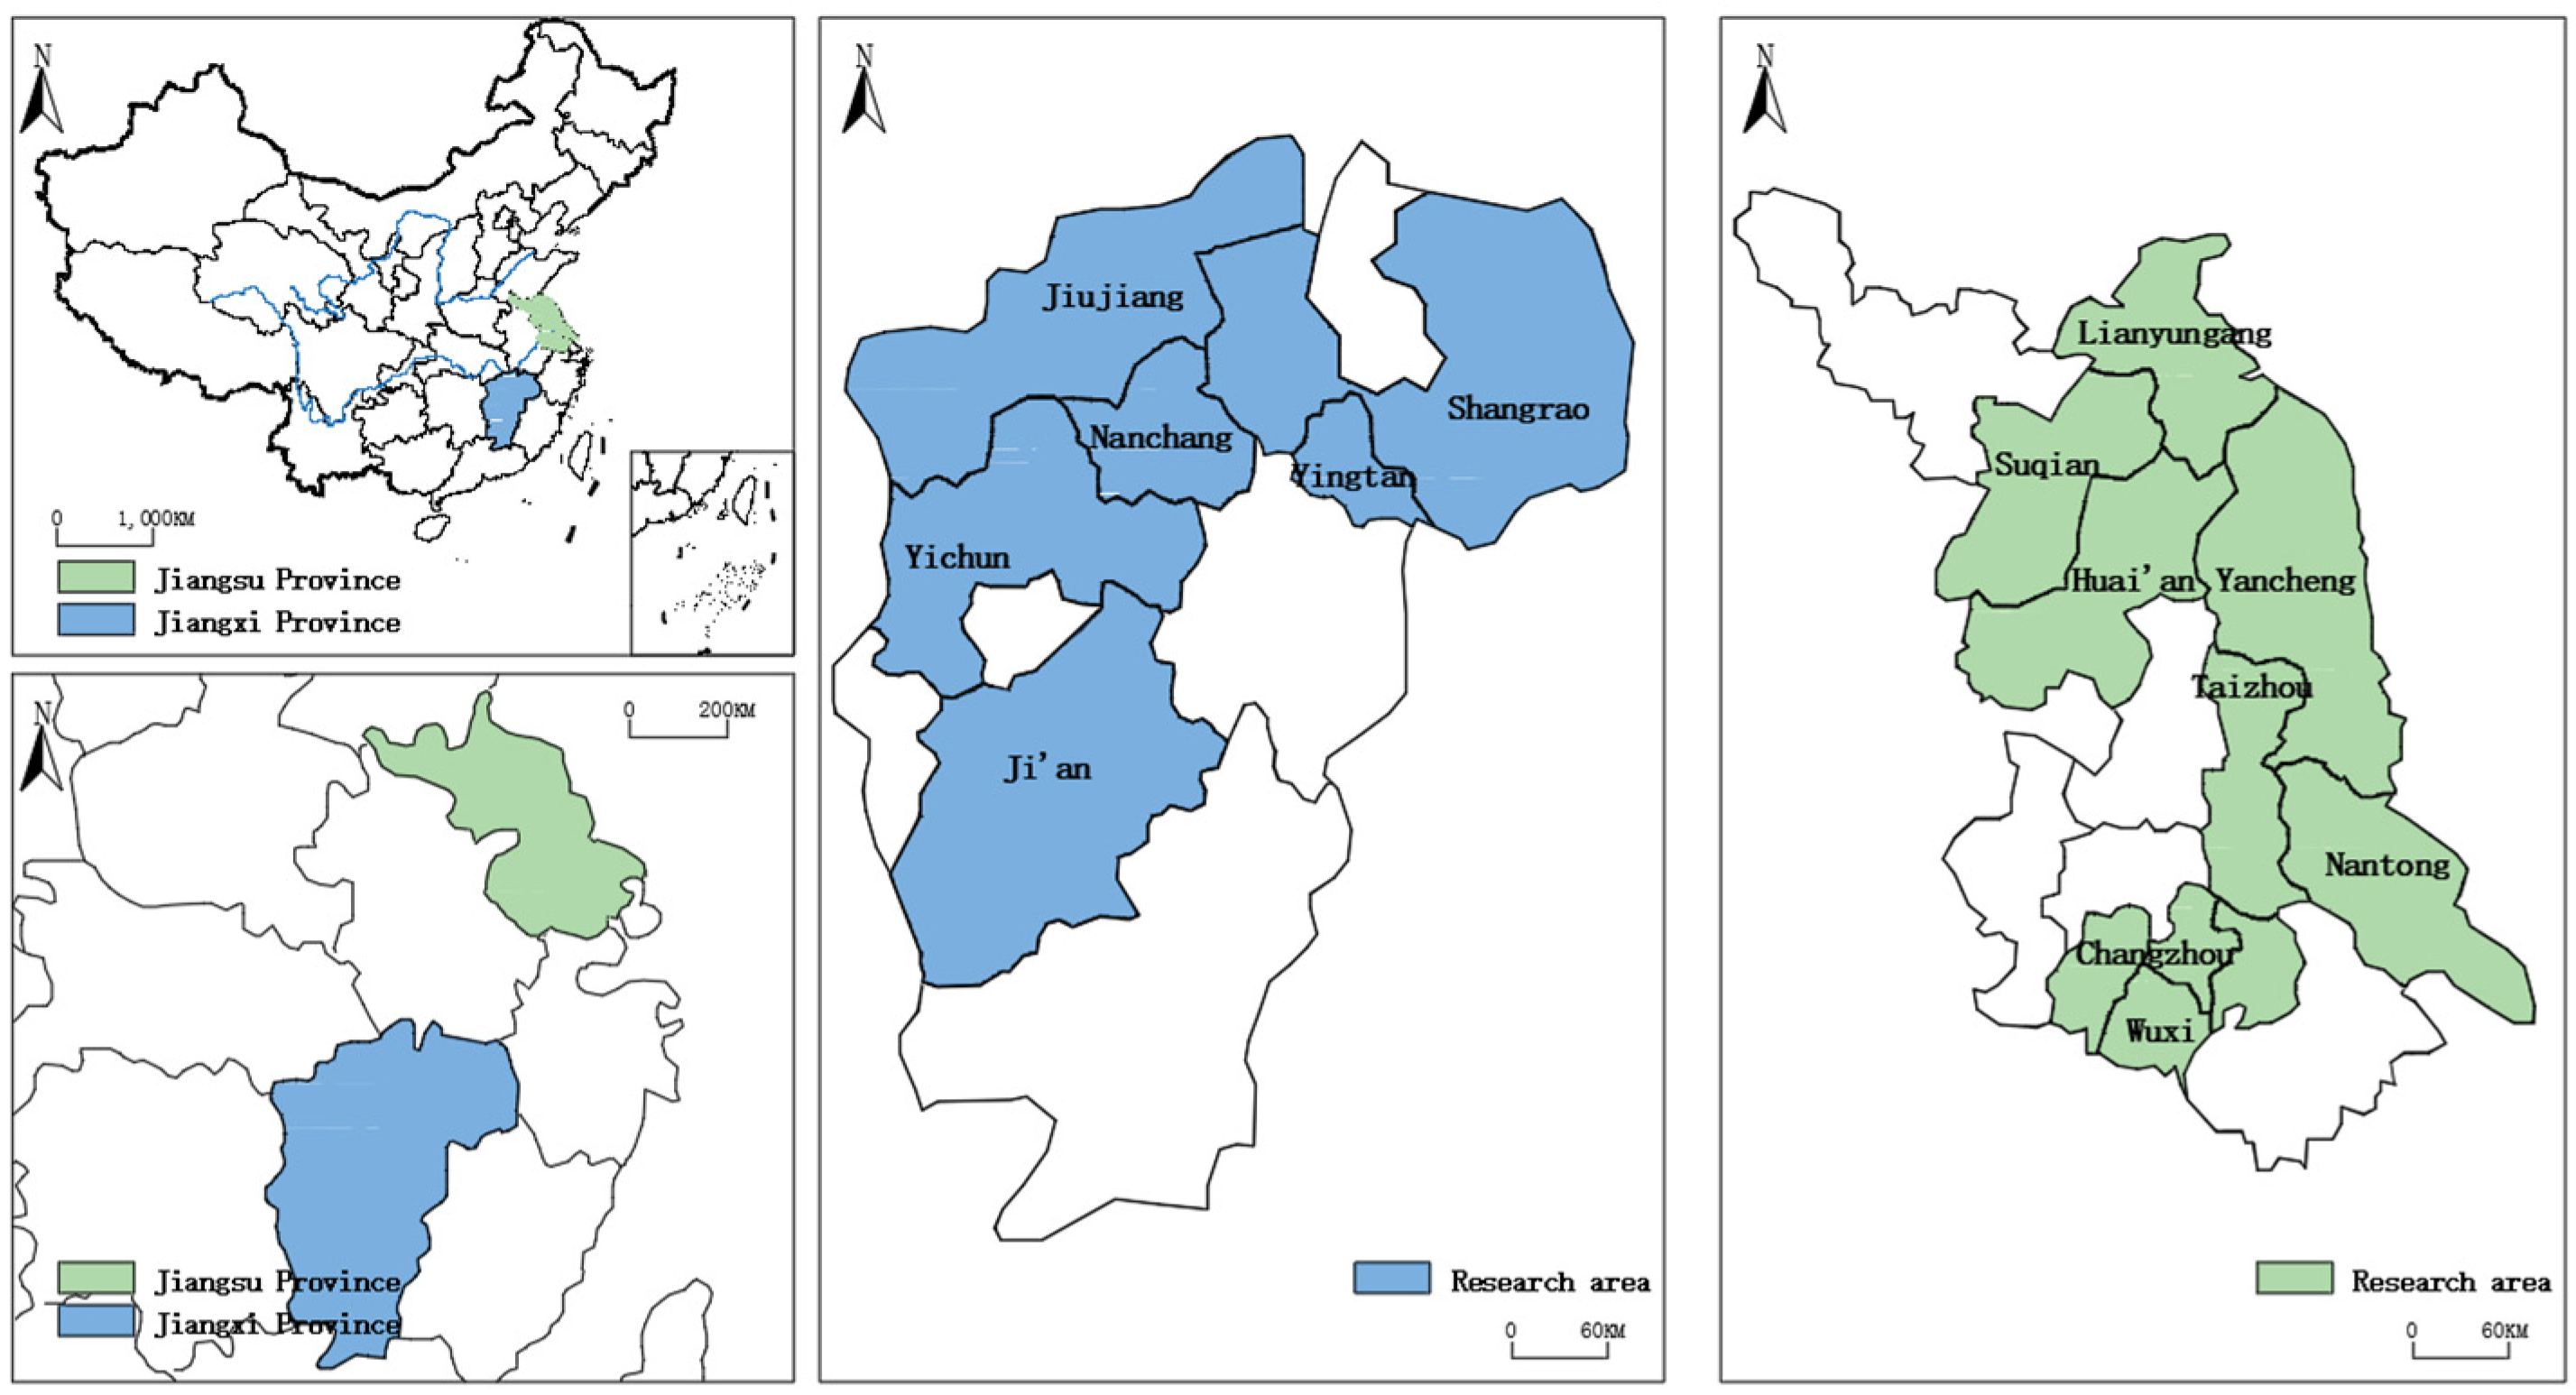
To empirically examine the effect of extension contact on large-scale farmer’s adoption of formulated fertilizer, we conducted research between August and September 2016 in Jiangsu and Jiangxi provinces (Figure 2), given their important role in grain production and their socioeconomic conditions. Jiangsu Province is an economically developed region, while Jiangxi Province is an economically underdeveloped region. The survey areas cover the major cropping systems of rice and wheat. The geographical areas surveyed included 40 townships within 14 districts. Rice is the main crop in these two provinces, which have the largest planting area (approximately 28% of its total planting area) and the largest total output (approximately 43% of all grain outputs) of rice in China. Paddy rice has a greater chemical fertilizer consumption rate compared with maize and wheat; and the current chemical fertilizer consumption has already reached 1054.05 kg/ha between 2003 and 2016 [71].
Multistage sampling was employed to select a household dataset. First, we randomly sampled 14 counties/districts based on their farm size and economic conditions in Jiangsu and Jiangxi provinces. Within each county/district, 2–3 towns were then randomly selected. Following this, we randomly sampled 20 LSFs from the set of towns created in the first step. The choice criteria for the respondents were based on lists provided by the local agricultural bureaucracy and rice production cooperatives using a table of random numbers selected by investigators. Finally, in total, 705 LSFs were surveyed, and 669 valid questionnaires were obtained after discarding invalid and missing data. This indicated an effective rate of 94.89%. A semi-structured questionnaire was used to obtain information on LSFs. The scope of the questionnaire covered household demographics, production inputs and outputs, land circulation, and village characteristics.
4. Results and Discussion
4.1. Effect of Extension Contact on Large-Scale Farmers’ Adoption Behaviour
4.1.1. Descriptive Statistics
Several predetermined factors may influence LSFs’ adoption of soil testing and formulated fertilizer technologies [72]. The descriptive statistics and expected effects of the dependent variable, key explanatory variable, and other control variables and instrumental variable in our econometric model are given in Table 1.
Dependent variable: The decision to adopt the soil testing and formulated fertilization technologies. This variable takes a value of 1 if the LSFs adopted soil testing and formulated fertilization technologies and 0 otherwise. The mean value of LSFs’ technology adoption behavior was 0.19.
Key explanatory variable: Extension contact. This variable was measured using a dummy variable that asked whether LSFs contacted extension staff or not. The mean value of this variable was 0.62.
Control variables: Personal characteristics (LSFs’ gender, age, education level, village cadre, off-farm employment, and farming experience). Generally, male LSFs are more likely to adopt new agricultural technologies because they tend to have greater access to a wide range of resources [73]. Younger LSFs are typically expected to be more knowledgeable about new technologies and adapt to innovative issues more; thus, they are also more likely to adopt new technologies [74,75].
Similarly, formal schooling may enhance or at least signify latent managerial ability and greater cognitive capacity, which are beneficial for obtaining improved information and adopting new technologies [24]. Furthermore, as village cadres are deemed to have wider social networks than ordinary villagers, it is expected that the village cadre identity would have a positive effect on their adoption of new technology. Off-farm employment experience also makes LSFs more likely to adopt new technologies. Finally, farmers with smallholder experience are more inclined toward traditional agricultural farming methods, and thus are less likely to adopt new technologies.
Control variables: Psychological characteristics. The relationship between risk preference and technology adoption has been studied widely [76,77,78], risk preference is expected to be positively associated with decisions to adopt technology [79,80].
However, farmers’ awareness of environmental issues also matters. For example, a policy targeting zero growth in chemical fertilizer use as a way to reduce non-point source pollution was published, and it was expected that farmers’ awareness of this target would be positively related to their adoption behavior.
Control variables: Household characteristics. The availability of household labor assumes great importance given that low incomes constrain the financial liquidity needed to increase income or production efficiency. Other studies have demonstrated that households with enough laborers are more likely to adopt fertilizer and use it intensively [81]. Therefore, the number of household laborers older than 16 and younger than 64 was defined as a control variable. Durable household assets reflect wealth, and wealthy farmers have a greater ability to bear losses caused by technological changes and are thus more willing to try new technologies [35]. Several durable household assets—such as cars, motorcycles, trucks, tractors, and farming machines—were included in this survey. Studies have demonstrated that larger farm sizes are generally positively associated with positive decisions to adopt new technologies [82,83] owing to the influence of economies of scale. However, large farm sizes may also have a negative effect on this because of the related risks and uncertainties, which could lead to a failure to adopt technology [84].
Control variables: Geographic variables. This study assumed that labor wages and the prices of agricultural products are similar in the same region. Therefore, regional dummy variables were used to represent price factors, and some regional differences that could not be observed were difficult to incorporate into the model [85]. Changzhou was used as the control group in this study. The distances from the LSFs’ homes to the county and to local banks indicate the difficulty that farmers face in obtaining information on agricultural technology and capital, respectively. Therefore, they were both included as control variables.
Instrumental variable: Whether household experienced agricultural disasters last year or not. Agricultural disasters were introduced as an instrumental variable related to contacting with extension staff because they have no direct effect on LSFs’ adoption behavior in terms of soil testing and formulated fertilization technologies. Moreover, this variable is highly correlated with extension contacts, because if the LSFs suffered from agricultural disasters, they would contact extension staff to make up for agricultural losses.
4.1.2. Empirical Results
The results of a multicollinearity test show that the variance inflation factors were all below 10, indicating that there was less multicollinearity concern among the independent variables. Therefore, we used the software Stata 12.0 to examine the effects of extension contact on LSFs’ adoption behavior of the soil testing and formulated fertilization technologies. Table 2 shows the results of the two-step control function approach; the coefficients demonstrate the marginal effect, which is the percentage change in the probability of adoption associated with a unit increase in the variable from the mean value. For the dummy variables, the marginal effect shows the effect of the variables changing from 0 to 1.
We report the determinants of LSFs’ adoption behavior of soil testing and formulated fertilization technologies, with an emphasis on the role of extension contacts, using the two-stage control function approach. The estimated coefficients and statistics related of the two-step control function approach are presented in Table 2. The F-statistic from the joint significance test on strength of the instrumental variable is 11.750 (p = 0.001), suggesting that the weak instrumental variable hypothesis can be rejected. The F-statistic for the instrumental variable in Equation (5) is 0.440 (p = 0.506), implying that the instrument variable is valid in our identification. The residual from the estimation is significant at the 10% level; therefore, contacting extension staff is endogenous, and the instrumental variable approach is necessary.
The variable of extension contacts has a positive effect on LSFs’ adoption behavior of the soil testing and formulated fertilization technologies (p < 0.05). Its average marginal effect is 0.620, which means that extension contact increases the probability of an LSF soil testing and adopting formulated fertilization technology by 62.0%. This is in line with our expectations and, in general, consistent with arguments in the literature that showed that agricultural extension services increased the probability of LSFs’ adoption behavior regarding soil testing and formulated fertilization technologies [85,86].
Extension contacts raises LSFs’ awareness of the benefits of soil testing and formulated fertilization technologies. This result suggests that extension contact plays a crucial role in demystifying technologies based on ecological conservation goals. Sustainable agricultural production technologies are known to have lagged effects or limited tangible short-term outcomes that may act as a disincentive for resource-constrained farmers, as these generally have short-sighted objectives. Under such circumstances, contacting extension staff may be instrumental in changing farmers’ perceptions and attitudes toward investments with long-term returns.
Moreover, LSFs’ education levels significantly and positively influence their adoption behavior of soil testing and formulated fertilization technologies. The average marginal effect of education is 0.013; better education increases LSFs’ adoption behavior of soil testing and formulated fertilization technologies by 1.3%. These technologies are knowledge-intensive and require considerable management input [87]; therefore, LSFs’ education levels determine their ability to communicate and read comprehensive information and to make decisions. Higher education also reduces LSFs’ perceptions of the complexity of soil testing and formulated fertilization technologies and improves their ability to understand, respond to, and analyze technological information with the aim to improve their decision-making regarding the adoption of the new technology. In addition, we found farm size is positively but not significantly associated with technology adoption by LSFs.
Finally, the coefficient of the distance from the home to the bank is negative and significant at 5% significance level. This means that the greater the distance from the home to the local bank, the fewer the chances that farmers will adopt soil testing and formulated fertilization technologies. We summarize that if the distance to the local bank is too far, then access to credit is also difficult; this, in turn, makes it difficult for LSFs to adopt soil testing and formulated fertilization technologies.
4.2. Effect of Extension Contacts on LSF’s Productivity and Nutrient Use Amount
4.2.1. Descriptive Statistics
The results in Table 3 indicate that there are significant differences between extension contacts (EC) and no-extension contacts (NEC) on fertilized technologies. Particularly, the mean education attainment difference between the EC and NEC groups is about 1.73 years and is significant at the 1% level; see Table 3. This implies the education level of large-scale grain producers has a positive correlation with EC. The mean value of the village cadres between the EC and NEC groups is about 0.10 and is significant at the 1% level. The average of interpersonal trust between the EC and NEC groups is about 0.38 and is significant at the 1% level. The ECs have less dependency ratio than the NECs, and the ECs may be richer than the NECs because the ECs have more farming equipment. The average loan between the EC and NEC groups is about 0.11 and is significant at the 1% level. Regarding farm characteristics, the ECs are more likely to be members of agricultural cooperatives, family farms, and contract farming. The mean difference of rice farm size of the ECs and NECs is about 7.99 ha and is significant at the 1% level. The ECs are more likely to join agricultural insurance than the NECs. The average of manure applied between the ECs and NECs is 0.14 and is significant at the 1% level. More NECs plant double-cropping rice than ECs. With respect to village characteristics, the ECs reported more fertilizer stores in their village than the NECs. The definition and descriptive statistics of the variables are listed in Table S1 (see Supplementary Materials).
4.2.2. Empirical Results
Table 4 presents the effects of extension contact on rice yields based on propensity score matching. The coefficient of extension contact is 520.51, and passed the 10% significance test, which demonstrates that compared with no-contacting households, extension contact could increase rice yields significantly. This research is also consistent with that of Alene and Manyong [86] that regular contact with extension could improve cowpea production by 18.5%. The matching results are listed in Table 5. As the absolute values of the bias of the matched variables are between 0.1% and 17.6%, which is less than 20%, the matching is effective. The balance of the matched sample is good.
Extension contact is negatively related to total fertilizer use amount, nitrogen fertilizer use amount, phosphorus fertilizer uses amount, and potassium fertilizer use amount. However, it does not pass the significance test. This can be explained by the fact that excessive use of chemical fertilizer is pervasive in China, which leads to soil acidification [88], whereas soil testing and formulated fertilization technologies are aimed to reduce fertilizer use and optimize nutrient ratios; our findings are consistent with Ju et al. [89] that 30–60% reduction in the use of nitrogen fertilizer does not influence crop yield in the Northern China Plain and Yangtz River Basin. The average nitrogen use (34.43 kg/ha), phosphorus use (99.91 kg/ha), and potassium use (90.15 kg/ha) in our research confirms a 60% decreased use of chemical fertilizers.
4.3. Robustness Check and Discussion
Given that farmer’s adoption behavior is a binary outcome variable, to serve as a robustness check of our multivariate and matching results, we used the OLS model to estimate the effect of extension contact on farmer’s formulated fertilizer adoption behaviors. Empirical results of the OLS estimate for the impact of extension contact on rice yield are consistent with those of PSM (Propensity Score Matching). The estimated OLS model results for the extension contact on rice yields and nutrient use amount are presented in Table 6.
The coefficient for the extension contacts passed the 10% significance test (253.34), suggesting that access to information is expected to positively affect grain yields. This finding is consistent with that of Hussain [90] that extension service is conducive for grain productivity. Different from some early studies indicated that training and visiting extension failed in increasing adoption rates or grain yields in Pakistan, Punjab [54], this research may actually demonstrate that large-scale farmers are more likely to be targeted for receiving extension contacts compared with small-scale households and have better access to soil testing and formulated fertilization technology due to their characteristics, e.g., farm size and education attainment.
However, as neither the coefficients of nutrient use amount in the OLS model nor in PSM model passed the significance test, the direction the size of the coefficients do not have statistical significance. Because the PSM model considers the selection bias between treatment group and control group, the coefficients may have some reference value in the PSM model.
In general, our results indicate that extension contact increases large-scale grain farmers’ rice yields without increasing nutrient use amount. This is consistent with research in other developing countries, e.g., sub-Saharan Africa, that found personalized extension service with decision support tools increases rice yield by 7% and profit by 10% [91]. Research conducted in Pakistan also confirmed that agricultural extension services are essential in the adoption of improved agricultural technologies, and large-scale farmers benefited more from these services [35]. However, the limitations of this research are that we used a cross-sectional dataset carried out in the Jiangsu and Jiangxi Provinces of China, which is of a local character; future research is recommended for national coverage or comparative research with other developing countries for a higher level of generalization.
5. Conclusions
Despite decades of policies to promote soil testing and formulated fertilization technologies in rural China, there has been little evaluation of how extension contacts affect the adoption behavior of formulated fertilization technologies among LSFs. To address this gap, we examined the effect of extension contact on LSFs’ adoption behavior of soil testing and formulated fertilization technologies and its effects on rice yields and nutrient use amount through a large-scale quantitative study in the Jiangsu and Jiangxi provinces. Results show that extension contact could increase soil testing and formulated fertilization technology adoption, and education level is positively related to adoption behavior. Moreover, extension contact could enhance rice yields considerably. Although extension contact is negatively related to nutrient use amount, it does not pass the significance test.
Our work addresses the implications of these findings to central policy as follows. First, policies could be designed to encourage development practitioners to prioritize the up-scaling of soil testing and formulated fertilization technologies. Chinese farmers attach importance to fertilizer use in enhancing grain yield, however, the optimal quantity of fertilizer use is rarely addressed due to the lack of appropriate extension services. Second, extension contact should be included into the extension services for targeting LSFs. Although extension services have been widely criticized as being unable to reach poorer farmers, and focusing instead on wealthier farmers who represent at most only 20% of the population [92], extension contact could improve grain yields and improve nutrient use efficiency when targeting LSFs. Third, developing education and training on nutrient use amount is necessary to reduce fertilizer use while keeping grain yield stable. Strengthening the technical capacity of LSFs may be a cost-effective way to promote nutrient use innovations in the future.
Supplementary Materials
The following supporting information can be downloaded at: https://www.mdpi.com/article/10.3390/land11111974/s1, Table S1: Definition and descriptive statistics of the variables.
Author Contributions
Conceptualization and methodology, J.L.; validation and formal analysis, X.Z, J.M. and J.L.; writing—original draft preparation, J.L.; writing—review and editing, Z.X., J.L. and J.M.; project administration, J.M. and Z.X.; All authors have read and agreed to the published version of the manuscript.
Funding
This research was funded by the National Natural Science Foundation, grant number 71703032; 71904190.
Institutional Review Board Statement
Not applicable.
Informed Consent Statement
Not applicable.
Data Availability Statement
Data are contained within the article or Supplementary Materials.
Acknowledgments
We acknowledge with gratitude support from the National Natural Science Foundation, Grant No. 71703032; 71904190. We thank the two anonymous reviewers for their helpful comments on earlier drafts of this paper.
Conflicts of Interest
The authors declare no conflict of interest. The funders had no role in the design of the study; in the collection, analyses, or interpretation of data; in the writing of the manuscript, or in the decision to publish the results.
References
- Ittersum, M.V.; Bussel, L.V.; Wolf, J.; Grassini, P.; Wart, J.V.; Guilpart, N. Can sub-Saharan Africa feed itself? Proc. Natl. Acad. Sci. USA 2016, 52, 14964–14969. [Google Scholar] [CrossRef] [PubMed] [Green Version]
- Pan, D. The spatial-temporal difference of driving effects for fertilizer use intensity change and its determinants in China. Econ. Geogr. 2014, 34, 121–126. [Google Scholar]
- Zhao, L.; Wang, C.W.; Gu, H.Y.; Yue, C.Y. Market incentive, government regulation and the behavior of pesticide application of vegetable farmers in China. Food Control. 2018, 85, 308–317. [Google Scholar] [CrossRef]
- China Economic Network. Sinochem Group Launched a New Mode of Agricultural Enterprise Cooperation to Help Zero Growth of Fertilizer. Available online: http://www.sinochem.com/m/s/9509-26567-19775.html (accessed on 14 September 2022).
- Sun, Z. Development and status of formula fertilizer by soil testing project. Mod. Agric. Sci. Technol. 2009, 15, 290–291. [Google Scholar]
- Zhang, F.S. Why the amount of chemical fertilizer has increased during the implementation of formula fertilizer by soil testing. Farmers’ Consult. 2012, 5, 4–6. [Google Scholar]
- Guo, W.X.; Fu, Y.C.; Ruan, B.Q.; Ge, H.F.; Zhao, N.N. Agricultural non-point source pollution in the Yongding River Basin. Ecol Indic. 2014, 36, 254–261. [Google Scholar]
- Agumagu, A.; Nwaogwugwu, O.N. Extension agents’ commitment to extension work in Abia and Rivers States, Nigeria. Glob. Approaches Ext. Pract. J. Agric. Ext. 2006, 1, 50–59. [Google Scholar]
- Gao, Y.; Zhao, D.; Yu, L.; Yang, H. Influence of a new agricultural technology extension mode on farmers’ technology adoption behavior in China. J. Rural. Stud. 2020, 76, 173–183. [Google Scholar] [CrossRef]
- Islam, M.M.; Grey, D.I.; Reid, J.I.; Kelly, T.; Kemp, P.D. Beyond recurrent costs: An institutional analysis of the unsustain-ability of donor-supported reforms in agricultural extension. J. Int. Agric. Ext. Educ. 2011, 1, 5–18. [Google Scholar] [CrossRef]
- Reynar, R.; Bruening, T. Agricultural extension issues perceptions of Bangladesh T&V extension personnel. Int. J. Agric. Ext. Educ. 1996, 3, 53–62. [Google Scholar]
- Porimol, P.; Sarker, R.; Islam, A. New rice varieties smile at Monga hit people. Daily Star 2008. [Google Scholar]
- Patuakhali. Pest attack affects Aman paddy yield in Netrokona. Daily Star 2008. [Google Scholar]
- Nakano, Y.; Tsusaka, T.W.; Aida, T.; Pede, V.O. Is farmer-to-farmer extension effective? The impact of training on technology adoption and rice farming productivity in Tanzania. World Dev. 2018, 105, 336–351. [Google Scholar] [CrossRef] [Green Version]
- Swanson, B.E. Assessment of Bangladesh’s Pluralistic Extension System: A MEAS Rapid Scoping Mission in Bangladesh. Modernizing Extension and Advisory Services Project. Report prepared for USAID. 2011. Available online: https://pdf.usaid.gov/pdf_docs/PBAAK795.pdf (accessed on 12 September 2022).
- Zhongyuan Media. Report on New Agricultural Operating Entities’ Land Transfer. Available online: http://www.sohu.com/a/284996570_120043327 (accessed on 12 September 2022).
- Xinhua News Agency. In China, about 98% Farmers are Smallholders Working on Farm Less than 1 Hectors. Available online: http:www.gov.cn/xinwen/2019-03/01/content_5369755.htm (accessed on 14 September 2022).
- Fadare, O.A.; Akerele, D.; Toritseju, B. Factors influencing adoption decisions of maize farmers in Nigeria. Int. J. Food Agric. Econ. 2014, 3, 45–54. [Google Scholar]
- Boniphace, N.S.; Fengying, N.; Chen, F. An analysis of smallholder farmers’ socio-economic determinants for inputs use: A case of major rice producing regions in Tanzania. Russ. J. Agric. Socio-Econ. Sci. 2015, 2, 41–45. [Google Scholar] [CrossRef]
- Langat, B.K.; Ngéno, V.K.; Nyangweso, P.M.; Mutwol, M.J.; Gohole, L.; Yaninek, S. Drivers of technology adoption in a subsistence economy: The case of tissue culture bananas in Western Kenya. In Proceedings of the 4th International Conference of the African Association of Agricultural Economists, Hammamet, Tunisia, 22–25 September 2013. [Google Scholar]
- Dejene, A. The training and visit agricultural extension in rainfed agriculture: Lessons from Ethiopia. World Dev. 1989, 17, 1647–1659. [Google Scholar] [CrossRef]
- Feder, G. Growth in Semi-Industrial Countries: A Statistical Analysis. Industrialization and Growth: A Comparative Analysis; Cheney, B., Syrquin, M., Robinson, S., Eds.; Oxford University Press: Oxford, UK, 1986. [Google Scholar]
- Feder, G. Land ownership security and farm productivity: Evidence from Thailand. J. Dev. Stud. 1987, 24, 16–30. [Google Scholar] [CrossRef]
- Feder, G.; Slade, R. The impact of agricultural extension: The training and visit system in India. World Bank Res. Obs. 1986, 1, 139–161. [Google Scholar] [CrossRef] [Green Version]
- Hussain, A.; Lanjouw, P.; Stern, N. Income inequalities in China: Evidence from household survey data. World Dev. 1994, 22, 1947–1957. [Google Scholar] [CrossRef]
- Sheikh, A.; Rehman, T.; Yates, C. Logit models for identifying the factors that influence the uptake of new ‘no-tillage’ technologies by farmers in the rice–wheat and the cotton–wheat farming systems of Pakistan’s Punjab. Agric. Syst. 2003, 75, 79–95. [Google Scholar]
- Walisinghe, B.R.; Ratnasiri, S.; Rohde, N.; Guest, R.S. Does agricultural extension promote technology adoption in Sri Lanka. Int. J. Soc. Econ. 2017, 12, 2173–2186. [Google Scholar] [CrossRef]
- Malima, G.; Eshetie, S.; Rahaman, A.; Mrosso, P.; Witteveen, L. Purchasing and up-scaling of the privatized advisory services: An innovation perspective on privatized soil testing in Africa. Community Dev. 2020, 51, 230–242. [Google Scholar] [CrossRef]
- Ajayi, M.T.; Solomon, O. Influence of extension contact and farmers’ socio-economic characteristics on adoption of oil palm technologies in Aniocha north local government, Delta State, Nigeria. J. Agric. Technol. 2010, 2, 35–46. [Google Scholar]
- Axinn, G.H. T&V (Tragic and Vain) extension? Interpaks Interchange 1988, 5, 6. [Google Scholar]
- Roling, N.G. Extension Science: Information Systems in Agricultural Development; Wye Studies in Agricultural and Rural Development; Cambridge University Press: London, UK, 1988. [Google Scholar]
- The Website of the Ministry of Agriculture, China. Available online: http://www.moa.gov.cn/sjzz/jgs/chinafamilyfarm/xwjj/201709/t20170921_5822045.htm (accessed on 13 November 2017).
- Haq, A.Z.M. Agricultural extension contact and farmer’s income in Bangladesh. Turk. J. Agric. Food Sci. Technol. 2016, 4, 787–792. [Google Scholar]
- Genius, M.; Koundouri, P.; Nauges, C.; Tzouvelekas, V. Information transmission in irrigation technology adoption and diffusion: Social learning, extension services, and spatial effects. Am. J. Agric. Econ. 2014, 96, 328–344. [Google Scholar] [CrossRef] [Green Version]
- Ali, A.; Rahut, D.B. Impact of agricultural extension services on technology adoption and crops yield: Empirical evidence from Pakistan. Asian J. Agric. Rural. Dev. 2013, 3, 801–812. [Google Scholar]
- Waddington, S.R.; Li, X.; Dixon, J.; Hyman, G.; De Vicente, M.C. Getting the focus right: Production constraints for six major food crops in Asian and African farming systems. Food Secur. 2010, 2, 27–48. [Google Scholar] [CrossRef]
- Rivera, W.M.; Alex, G. Extension system reform and the challenges ahead. J. Agric. Educ. Ext. 2004, 1, 23–36. [Google Scholar] [CrossRef]
- Ayoola, J.B. Socio-economic determinants of the adoption of yam minisett technology in the Middle Belt region of Nigeria. J. Agric. Sci. 2012, 6, 215–222. [Google Scholar] [CrossRef] [Green Version]
- James, Z.; Julius, M. Determinants of choice of crop variety as climate change adaptation option in arid regions of Zimbabwe. Russ. J. Agric. Socio-Econ. Sci. 2013, 15, 54–62. [Google Scholar]
- Freedman, D.A.; Sekhon, J.S. Endogeneity in probit response models. Political Anal. 2010, 18, 138–150. [Google Scholar] [CrossRef]
- Diagne, A.; Demont, M. Taking a new look at empirical models of adoption: Average treatment effect estimation of adoption rates and their determinants. Agric. Econ. 2007, 37, 201–210. [Google Scholar] [CrossRef] [Green Version]
- Owens, T.; Hoddinott, J.; Kinsey, B. The impact of agricultural extension on farm production in resettlement areas of Zimbabwe. Econ. Dev. Cult. Change 2003, 51, 337–357. [Google Scholar] [CrossRef] [Green Version]
- Rogers, E.M. Diffusion of Innovations, 5th ed.; Free Press: New York, NY, USA, 2003. [Google Scholar]
- Gao, J.J.; Shi, Q.H. Research on the reduction and control strategy of agricultural chemical inputs from the perspective of supply. Xinjiang State Farms Econ. 2021, 9, 1–13. [Google Scholar]
- Goodhue, D.L.; Thompson, R.L. Task technology fit and individual performance. MIS Q. 1995, 19, 213–236. [Google Scholar] [CrossRef]
- Adams, O.R. Climate Variability and Adaptation Strategies in Cassava Production in Ogun State, Nigeria; Federal University of Agriculture: Abeokuta, Nigeria, 2015. [Google Scholar]
- Boansi, D.; Tambo, J.A.; Müller, M. Analysis of farmers’ adaptation to weather extremes in West African Sudan Savanna. Weather Clim. Extrem. 2017, 16, 1–13. [Google Scholar] [CrossRef]
- Rafiat Ogunpaimo, O.; Oyetunde-Usman, Z.; Surajudeen, J. Impact of climate change adaptation on household food security in Nigeria a difference-in-difference approach. Sustainability 2021, 13, 1444. [Google Scholar] [CrossRef]
- Lin, Y.F. Chinese Agriculture in the Exchange of Elements Market is Prohibited Under the Technology Choice; Shanghai People’s Press: Shanghai, China, 1994. [Google Scholar]
- Ayalew, H.; Chamberlin, J.; Newman, C. Site-specifific agronomic information and technology adoption: A field experiment from Ethiopia. J. Dev. Econ. 2022, 156, 102788. [Google Scholar]
- Xu, Z.G.; Zhang, J.Y.; Lv, K.Y. The scale of operation, term of land ownership and the adoption of inter-temporal agricultural technology: An example of returning straw to farmland directly. Chin. Rural Econ. 2018, 3, 61–74. [Google Scholar]
- Arouna, A.; Michler, J.D.; Yergo, W.G.; Saito, K. One size fits all? Experimental evidence on the digital delivery of personalized extension advice in Nigeria. Am. J. Agric. Econ. 2021, 103, 596–619. [Google Scholar] [CrossRef]
- Due, J.M.; Naftali, M.; Malone, V. Does the T&V system reach female-headed families? Some evidence from Tanzania. Agric. Adm. Ext. 1987, 26, 209–217. [Google Scholar]
- Khan, M.J.; Sharif, M.; Sarwar, M. Monitoring and evaluation of training and visit system of agricultural extension in Punjab, Pakistan. Adm. Role 1984, 44, 80. [Google Scholar]
- Uduji, J.I.; Okolo-Obasi, E.N.; Asongu, S.A. Growth enhancement support scheme (GESS) and farmers’ fertilizer use in rural Nigeria. Afr. Dev. Rev. 2019, 31, 348–363. [Google Scholar] [CrossRef] [Green Version]
- Akpan, S.B.; Aya, A.E. Determinants of fertilizer use among small-holder farmers in wetland region of Cross River State. Glob. J. Agric. Sci. 2009, 8, 195–201. [Google Scholar] [CrossRef]
- Rurinda, J.; Zingore, S.; Jibrin, J.M.; Balemi, T.; Masuki, K.; Andersson, J.A.; Craufurd, P.Q. Science-based decision support for formulating crop fertilizer recommendations in sub-Saharan Africa. Agric. Syst. 2020, 180, 102790. [Google Scholar] [CrossRef] [PubMed]
- Lawin, K.G.; Tamini, L.D. Tenure security and farm effificiency analysis correcting for biases from observed and unobserved variables: Evidence from Benin. J. Agric. Econ. 2019, 70, 116–134. [Google Scholar] [CrossRef] [Green Version]
- Daxini, A.; O’Donoghue, C.; Ryan, M.; Buckley, C.; Barnes, A.; Daly, K. Which factors influence farmers’ intentions to adopt nutrient management planning? J. Environ. Manag. 2018, 224, 350–360. [Google Scholar] [CrossRef]
- Jia, X.; Huang, J.; Xiang, C.; Powlson, D. Reducing excessive nitrogen use in Chinese wheat production through knowledge training: What are the implications for the public extension system? Agroecol. Sustain. Food Syst. 2015, 39, 189–208. [Google Scholar] [CrossRef]
- Rajkhowa, P.; Qaim, M. Personalized digital extension services and agricultural performance: Evidence from smallholder farmers in India. PLoS ONE 2021, 16, e0259319. [Google Scholar] [CrossRef]
- Jia, X.; Huang, J.; Xiang, C.; Hou, L.; Zhang, F.; Chen, X. Farmer’s adoption of improved nitrogen management strategies in maize production in China: An experimental knowledge training. J. Integr. Agric. 2013, 12, 364–373. [Google Scholar] [CrossRef]
- Judge, G.; Hill, R.; Griffiths, W.; Lutkepohl, H.; Lee, T.C. Introduction to the Theory and Practice of Econometrics; John Wiley: Hoboken, NJ, USA, 1982. [Google Scholar]
- Wooldridge, J.M. Quasi-maximum likelihood estimation and testing for nonlinear models with endogenous explanatory variables. J. Econom. 2014, 182, 226–234. [Google Scholar] [CrossRef]
- Lloyd-Smith, P.; Schram, C.; Adamowicz, W.; Dupont, D. Endogeneity of risk perceptions in averting behavior models. Environ. Resour. Econ. 2018, 69, 217–246. [Google Scholar] [CrossRef]
- Abdulai, A.; Owusu, V.; Goetz, R. Land tenure differences and investment in land improvement measures: Theoretical and empirical analyses. J. Dev. Econ. 2011, 96, 66–78. [Google Scholar] [CrossRef]
- Rosenbaum, P.; Rubin, D. The central role of propensity score matching in observational studies for causal effects. Biometrika 1983, 70, 41–55. [Google Scholar] [CrossRef]
- Smith, J.; Todd, P. Does matching overcome Lalonde’s critique of nonexperimental estimators? J. Econom. 2005, 125, 305–353. [Google Scholar] [CrossRef] [Green Version]
- Becker, S.O.; Ichino, A. Estimation of average treatment effects based on propensity scores. Stata J. 2002, 2, 358–377. [Google Scholar] [CrossRef] [Green Version]
- Dehejia, R.H.; Wahba, S. Causal effects in nonexperimental studies. J. Am. Stat. Assoc. 1999, 94, 1053–1062. [Google Scholar] [CrossRef]
- Gao, J.J.; Peng, C.; Shi, Q.H. Study on the high chemical fertilizers consumption and fertilization behavior of small rural household in China: Discovery from 1995–2016 National Fixed Point Survey Data. Manag. World 2019, 10, 120–132. [Google Scholar]
- Haq, A.Z.M. The impact of agricultural extension contact on crop income in Bangladesh. Bangladesh J. Agric. Res. 2013, 38, 321–334. [Google Scholar] [CrossRef]
- Matshe, I.; Young, T. Off-farm labour allocation decisions in small-scale rural households in Zimbabwe. Agric. Econ. 2004, 30, 175–186. [Google Scholar] [CrossRef]
- Feder, G. The relation between farm size and farm productivity: The role of family labor, supervision and credit con-straints. J. Dev. Econ. 1985, 18, 297–313. [Google Scholar] [CrossRef]
- Thangata, P.; Alavalapati, J. Agroforestry adoption in southern Malawi: The case of mixed intercropping of Gliricidia sepium and maize. Agric. Syst. 2003, 78, 57–71. [Google Scholar] [CrossRef]
- Baerenklau, K.A. Toward an understanding of technology adoption: Risk, learning, and neighborhood effects. Land Econ. 2005, 81, 1–19. [Google Scholar] [CrossRef]
- Wossen, T.; Berger, T.; Falco, S.D. Social capital, risk preference and adoption of improved farm land management practices in Ethiopia. Agric. Econ. 2015, 46, 81–97. [Google Scholar] [CrossRef]
- Akhtar, S.; LI, G.C.; Ullah, R.; Nazir, A.; Iqbal, M.A.; Raza, M.H.; Iqbal, N.; Faisal, M. Factors influencing hybrid maize farmers’ risk attitudes and their perceptions in Punjab Province, Pakistan. J. Integr. Agric. 2018, 17, 1454–1462. [Google Scholar] [CrossRef]
- Liu, E.M. Time to change what to sow: Risk preferences and technology adoption decisions of cotton farmers in China. Rev. Econ. Stat. 2013, 95, 1386–1403. [Google Scholar] [CrossRef] [Green Version]
- Wang, Z.X.; Ali, S.; Akbar, A.; Rasool, F. Determining the influencing factors of biogas technology adoption intention in Pakistan: The moderating role of social media. Int. J. Environ. Res. Public Health 2020, 17, 2311. [Google Scholar] [CrossRef] [Green Version]
- Croppenstedt, A.; Demeke, M.; Meschi, M.M. Technology adoption in the presence of constraints: The case of fertilizer demand in Ethiopia. Rev. Dev. Econ. 2003, 7, 58–70. [Google Scholar] [CrossRef]
- De Graaff, J.; Amsalu, A.; Bodnar, F.; Kessler, A.; Posthumus, H.; Tenge, A. Factors influencing adoption and continued use of long-term soil and water conservation measures in five developing countries. Appl. Geogr. 2008, 28, 271–280. [Google Scholar] [CrossRef]
- Knowler, D.; Bradshaw, B. Farmers’ adoption of conservation agriculture: A review and synthesis of recent research. Food Policy 2007, 32, 25–48. [Google Scholar] [CrossRef]
- Jensen, L.P.; Picozzi, K.; De Almeida, O.D.C.M.; Da Costa, M.D.J.; Spyckerelle, L.; Erskine, W. Social relationships impact adoption of agricultural technologies: The case of food crop varieties in Timor-Leste. Food Secur. 2014, 6, 397–409. [Google Scholar] [CrossRef]
- Luo, J.; Feng, Y.; Shi, P. Farm households’ adoption behavior of environment friendly technology and the evaluation of their environmental and economic effects in Taihu Basin-taking formula fertilization by soil testing technology as an example. J. Nat. Resour. 2013, 28, 1891–1902. [Google Scholar]
- Alene, A.D.; Manyong, V. The effects of education on agricultural productivity under traditional and improved technology in northern Nigeria: An endogenous switching regression analysis. Empir. Econ. 2007, 1, 141–159. [Google Scholar] [CrossRef]
- Barrett, C.B.; Place, F.; Aboud, A.A. Natural resources management in African agriculture: Understanding and improving current practices. J. Afr. Econ. 2002, 11, 591–595. [Google Scholar]
- Guo, J.H.; Liu, X.J.; Zhang, Y.; Shen, J.L.; Han, W.X.; Zhang, W.F.; Christie, P.; Goulding, K.W.T.; Vitousek, P.M. Significant acidification in major Chinese croplands. Science 2010, 327, 1008–1010. [Google Scholar] [CrossRef] [Green Version]
- Ju, X.T.; Xing, G.X.; Chen, X.P.; Zhang, S.L.; Zhang, L.J.; Liu, X.J.; Cui, Z.L.; Yin, B.; Christie, P.; Zhu, Z.L. Reducing environmental risk by improving N management in intensive Chinese agricultural systems. Proc. Natl. Acad. Sci. USA 2009, 106, 3041–3046. [Google Scholar] [CrossRef] [Green Version]
- Hussain, M.S. An Analysis of the Efficiency of Cotton Farmers in the Punjab Province in Pakistan. Ph.D. Thesis, University of New England, Armidale, Australia, 1999. [Google Scholar]
- Spielman, D.; Lecoutere, E.; Makhija, S.; Van Campenhout, B. Information and communications technology (ICT) and agricultural extension in developing countries. Annu. Rev. Resour. Econ. 2021, 13, 177–201. [Google Scholar] [CrossRef]
- Roeling, N.G. Appropriate opportunities as well as appropriate technology. Ceres 1984, 97, 15–19. [Google Scholar]
| 1 | Whether the difference between contacting and no contacting is significant |
Figure 1.
Agricultural Extension Systems of China.

Figure 2.
The Geographical Distribution of the Sampled Large-Scale Grain Farmers.

Table 1.
Definition and summary statistics of the variables.
| Variable | Description | Mean | S.D. a | Expected Impact |
|---|---|---|---|---|
| Dependent variable | ||||
| Adoption behavior | 1 if an LSF adopted soil testing and formulated fertilization technologies; 0 otherwise | 0.19 | − | − |
| Key explanatory variable | ||||
| Contact with extension staff | 1 if an LSF contacted promoters; 0 otherwise | 0.62 | − | + |
| Other control variables | ||||
| LSFs’ gender | 1 if an LSF is male; 0 otherwise | 0.98 | − | + |
| LSFs’ age | Age of the LSF (in years) | 49.77 | 8.23 | − |
| LSFs’ education level | Years of schooling that the LSF had (years) | 8.64 | 3.26 | + |
| LSFs’ village cadres identity | 1 if LSFs have been village cadres; 0 otherwise | 0.31 | − | + |
| LSFs’ off-farm experience | 1 if the LSFs has had off-farm experience; 0 otherwise | 0.63 | − | + |
| Farming experience | Experience of smallholder farming in number of years | 22.27 | 13.83 | − |
| Risk preference b | 1 if completely risk averse; 2 if risk averse; 3 if this is not known; 4 if risk-loving; 5 if very risk-loving | 2.89 | 0.56 | + |
| Awareness of fertilizer zero growth target | 1 if very ignorant; 2 if ignorant; 3 for those with general knowledge; 4 if knowledgeable; 5 if very knowledgeable | 2.30 | 1.19 | + |
| Laborers in a household | Number of laborers in the household | 3.54 | 1.20 | + |
| Cars | Number of cars in the household | 0.35 | 0.58 | + |
| Motorcycles | Number of motorcycles in the household | 0.61 | 0.67 | + |
| Trucks | Number of trucks in the household | 0.06 | 0.29 | + |
| Tractors | Number of tractors in the household | 1.07 | 1.61 | + |
| Fertilizer distributors | Number of fertilizer distributors in the household | 0.19 | 0.82 | + |
| Plough machines | Number of plough machines in the household | 0.22 | 1.31 | + |
| Rotary cultivators | Number of rotary cultivators in the household | 0.69 | 1.91 | + |
| Seeders | Number of seeders in the household | 0.16 | 0.63 | + |
| Farm size | Total size of cultivated land (ha) by household | 18.64 | 32.61 | +/− |
| County distance | The distance from home to the nearest county (km) | 21.35 | 12.77 | − |
| Distance to bank | The distance from home to local bank (km) | 5.26 | 21.69 | − |
| Prefectural IDs c | Controlled | − | − | − |
| IV variable | ||||
| Agricultural disaster | 1 if crop production has suffered from disasters; 0 otherwise | 0.47 | 0.50 | − |
a S.D. = standard deviation. b The risk preference variable was calculated mainly by grading the rankings described by LSFs according to the following seven criteria: (1) I do not think there is any income without risk; (2) in order to gain more income, I am willing to take a risk; (3) I am willing to invest only if there is no risk; (4) if investing in new crop varieties is risky, I generally do not do it; (5) I prefer to make a safer investment; (6) if I am sure that the investment will make a profit, I will borrow money to invest; (7) if I have spare cash, I would like to buy lottery tickets. If I am lucky, I may earn a lot of money. In this survey, farmers rated these criteria from 1 to 5, where 1 = absolutely disagree and 5 = totally agree. Among these criteria, the higher the rating scores of the third, fourth, and fifth viewpoints, the more likely farmers are to be risk averse; the converse is true for the other four viewpoints. Therefore, the higher the score, the more the LSFs prefer risk. c Prefectural IDs include 1 = Changzhou; 2 = Huaian; 3 = Ji’an; 4 = Jiujiang; 5 = Lianyungang; 6 = Nanchang; 7 = Nantong; 8 = Shangrao; 9 = Suqian; 10 = Taizhou; 11 = Wuxi; 12 = Yancheng; 13 = Yichun; 14 = Yingtan.
Table 2.
Regression results using a two-step control function approach.
| Variables | Marginal Effect | Standard Error (Delta Method) |
|---|---|---|
| Extension contacts, 1 = yes | 0.62 ** | 0.28 |
| LSFs’ gender, 1 = male | −0.09 | 0.12 |
| LSFs’ age, in years | 0.01 | 0.00 |
| LSFs’ education level, in years | 0.01 ** | 0.01 |
| LSFs’ village cadre identity, 1 = yes | −0.07 | 0.04 |
| LSFs’ off-farm experience, 1 = yes | 0.04 | 0.03 |
| Farming experience, in years | 0.00 | 0.00 |
| Risk preference, 1 if completely risk averse … 5 if very risk-loving | 0.01 | 0.03 |
| Awareness of fertilizer zero growth target, 1 if very ignorant … 5 if very knowledgeable | 0.01 | 0.01 |
| Laborers in a household, in numbers | 0.00 | 0.01 |
| Farm size, in ha | 0.00 | 0.00 |
| Cars, in numbers | 0.00 | 0.03 |
| Motorcycles, in numbers | −0.01 | 0.02 |
| Trucks, in numbers | 0.00 | 0.05 |
| Tractors, in numbers | −0.00 | 0.01 |
| Fertilizer distributors, in numbers | 0.01 | 0.02 |
| Plough machines, in numbers | −0.00 | 0.01 |
| Rotary cultivators, in numbers | −0.01 | 0.01 |
| Seeders, in numbers | −0.00 | 0.03 |
| County distance, in km | −0.00 | 0.00 |
| Distance to bank, in km | −0.00 ** | 0.00 |
| Residual (extension contact) | −0.19 * | 0.11 |
| Constant | −3.46 *** | 1.05 |
| City IDs | Yes | |
| Prob > chi2 | 0.00 | |
| Pseudo R2 | 0.12 | |
Note: *, **, and *** represent significance at 10%, 5%, and 1%, respectively. If the marginal effects are zero, they were zero to the nearest three decimal places.
Table 3.
Summary statistics for LSFs contact with extension service (treatment) and LSFs with nocontact (control).
Table 3.
Summary statistics for LSFs contact with extension service (treatment) and LSFs with nocontact (control).
| Variables | All Sample | Contacting | No Contacting | Mean Value Differences 1 |
|---|---|---|---|---|
| Household characteristics | ||||
| 0.98 | 0.98 | 0.99 | −0.01 |
| (0.13) | (0.01) | (0.01) | (0.01) | |
| 49.40 | 49.23 | 49.67 | −0.44 |
| (8.13) | (0.41) | (0.55) | (0.68) | |
| 8.72 | 9.38 | 7.65 | 1.73 *** |
| (3.23) | (0.16) | (0.21) | (0.26) | |
| 0.31 | 0.35 | 0.25 | 0.10 *** |
| (0.46) | (0.02) | (0.03) | (0.04) | |
| 21.62 | 20.96 | 22.71 | −1.75 |
| (13.55) | (0.68) | (0.94) | (1.13) | |
| 0.63 | 0.66 | 0.68 | 0.09 |
| (0.48) | (0.02) | (0.03) | (0.04) | |
| 0.26 | 0.25 | 0.28 | −0.03 ** |
| (0.21) | (0.01) | (0.01) | (0.02) | |
| 3.54 | 3.51 | 3.59 | −0.08 |
| (1.19) | (0.06) | (0.08) | (0.10) | |
| 0.07 | 0.23 | −0.19 | 0.42 ** |
| (2.00) | (0.10) | (0.13) | (0.17) | |
| 28.26 | 28.37 | 28.08 | 0.29 |
| (26.16) | (1.35) | (1.73) | (2.19) | |
| 0.23 | 0.28 | 0.17 | 0.11 *** |
| (0.42) | (0.02) | (0.02) | (0.04) | |
| Households’ farm characteristics | ||||
| 0.36 | 0.41 | 0.27 | 0.14 *** |
| (0.48) | (0.03) | (0.03) | (0.04) | |
| 0.48 | 0.57 | 0.34 | 0.23 *** |
| (0.50) | (0.03) | (0.03) | (0.04) | |
| 0.17 | 0.20 | 0.11 | 0.09 *** |
| (0.37) | (0.02) | (0.02) | (0.03) | |
| 19.26 | 22.30 | 14.31 | 7.99 *** |
| (27.10) | (1.67) | (0.92) | (2.25) | |
| 72.51 | 74.18 | 69.79 | 4.39 |
| (96.92) | (5.20) | (5.97) | (8.12) | |
| 0.47 | 0.57 | 0.30 | 0.27 *** |
| (0.50) | (0.03) | (0.03) | (0.04) | |
| 3.90 | 3.98 | 3.77 | 0.21 |
| (0.82) | (0.04) | (0.06) | (0.02) | |
| 0.22 | 0.27 | 0.13 | 0.14 *** |
| (0.41) | (0.02) | (0.02) | (0.03) | |
| 0.27 | 0.24 | 0.33 | −0.09 *** |
| (0.45) | (0.02) | (0.03) | (0.04) | |
| Village characteristics | ||||
| 28.12 | 27.88 | 28.52 | −0.64 |
| (11.55) | (0.54) | (0.86) | (0.97) | |
| 1.28 | 1.43 | 1.03 | 0.40 *** |
| (1.58) | (0.09) | (0.08) | (0.13) | |
| of observations | 605 | 375 | 230 | --- |
Note: **, *** represent significance at 5%, and 1% respectively.
Table 4.
Impact of EC on rice yields and nutrient use amount using PSM.
| Outcome | Coefficient | Std. Err | z | p > |z| | Normal-Based (95% Conf. Interval) | |
|---|---|---|---|---|---|---|
| Rice yields | 520.51 * | 313.56 | 1.66 | 0.09 | −108.55 | 1149.56 |
| The total Fertilizer use amount | −0.58 | 1.20 | −0.49 | 0.63 | −2.94 | 1.77 |
| Nitrogen fertilizer use amount | −1.15 | 2.05 | 0.56 | 0.57 | −5.16 | 2.86 |
| Phosphorus fertilizer use amount | −3.25 | 6.80 | −0.48 | 0.63 | −16.58 | 10.09 |
| Potassium fertilizer use amount | −1.96 | 6.80 | −0.29 | 0.77 | −15.28 | 11.36 |
Note: * represent significance at 10%.
Table 5.
Matching results of extension contact on large-scale farmers’ rice yields.
| Explanatory Variables | Mean | %Bias | %Reduct |Bias| | t-Test | V_e (T)/V_e (C) | |||
|---|---|---|---|---|---|---|---|---|
| Treated | Control | t | p > |t| | |||||
| Large-scale grain producers’ characteristics | ||||||||
| U | 0.98 | 0.99 | −4.50 | −30.7 | −0.53 | 0.60 | 1.41 * |
| M | 0.98 | 0.99 | −5.90 | −0.78 | 0.44 | 1.59 * | ||
| U | 49.23 | 49.67 | −5.3 | −50.0 | −0.64 | 0.52 | 0.91 |
| M | 49.26 | 49.91 | −8.0 | −1.07 | 0.28 | 1.00 | ||
| U | 9.38 | 7.65 | 55.0 | 99.7 | 6.62 | 0.00 | 0.75 * |
| M | 9.17 | 9.18 | −0.1 | −0.02 | 0.98 | 1.07 | ||
| U | 0.35 | 0.25 | 21.8 | 85.5 | 2.58 | 0.01 | 1.22 |
| M | 0.33 | 0.34 | −3.2 | −0.41 | 0.68 | 1.00 | ||
| U | 20.96 | 22.71 | −12.8 | 39.1 | −1.54 | 0.12 | 0.83 |
| M | 21.05 | 22.11 | −7.8 | −1.05 | 0.29 | 0.86 | ||
| U | 0.66 | 0.58 | 17.7 | 98.1 | 2.13 | 0.03 | 0.93 |
| M | 0.66 | 0.66 | 0.3 | 0.05 | 0.96 | 1.01 | ||
| Household characteristics | ||||||||
| U | 0.25 | 0.28 | −16.4 | 77.3 | −1.98 | 0.05 | 1.01 |
| M | 0.25 | 0.25 | 3.7 | 0.50 | 0.62 | 0.89 | ||
| U | 3.51 | 3.59 | −6.5 | 76.0 | −0.78 | 0.44 | 0.88 |
| M | 3.52 | 3.54 | −1.6 | −0.22 | 0.83 | 1.11 | ||
| U | 0.23 | −0.19 | 21.2 | 69.9 | 2.54 | 0.01 | 0.89 |
| M | 0.19 | 0.06 | 6.4 | 0.92 | 0.36 | 1.25 | ||
| U | 28.37 | 28.08 | 1.1 | −156.7 | 0.13 | 0.90 | 1.00 |
| M | 28.76 | 28.02 | 2.8 | 0.38 | 0.70 | 1.08 | ||
| U | 0.28 | 0.17 | 27.2 | 82.7 | 3.18 | 0.00 | 1.45 * |
| M | 0.26 | 0.28 | −4.7 | −0.58 | 0.56 | 0.97 | ||
| Farm characteristics | ||||||||
| U | 0.41 | 0.27 | 28.5 | 85.8 | 3.37 | 0.00 | 1.22 |
| M | 0.39 | 0.41 | −4.1 | −0.52 | 0.61 | 1.00 | ||
| U | 0.57 | 0.34 | 47.7 | 92.1 | 5.67 | 0.00 | 1.27 |
| M | 0.56 | 0.54 | 3.8 | 0.49 | 0.62 | 1.00 | ||
| U | 0.20 | 0.11 | 25.4 | 85.5 | 2.95 | 0.00 | 1.52 * |
| M | 0.19 | 0.20 | −3.7 | −0.45 | 0.66 | 0.99 | ||
| U | 22.30 | 14.31 | 32.1 | 73.4 | 3.55 | 0.00 | 5.46 ** |
| M | 20.31 | 18.19 | 8.5 | 1.42 | 0.16 | 2.16 ** | ||
| U | 74.18 | 69.79 | 4.6 | 91.1 | 0.54 | 0.59 | 1.23 |
| M | 74.79 | 74.40 | −0.4 | −0.05 | 0.96 | 0.97 | ||
| U | 0.57 | 0.30 | 56.2 | 90.1 | 6.66 | 0.00 | 1.11 |
| M | 0.55 | 0.58 | −5.6 | −0.72 | 0.47 | 1.07 | ||
| U | 3.98 | 3.77 | 25.9 | 32.1 | 3.12 | 0.00 | 0.89 |
| M | 3.98 | 3.83 | 17.6 | 2.24 | 0.03 | 1.07 | ||
| U | 0.27 | 0.13 | 34.5 | 93.2 | 4.00 | 0.00 | 1.49 * |
| M | 0.25 | 0.24 | 2.3 | 0.29 | 0.77 | 1.03 | ||
| U | 0.24 | 0.33 | −21.7 | 31.4 | −2.62 | 0.01 | 0.79 * |
| M | 0.25 | 0.18 | 14.8 | 2.18 | 0.03 | 1.32 * | ||
| Village characteristics | ||||||||
| U | 27.88 | 28.52 | −5.4 | 85.0 | −0.67 | 0.51 | 0.63 * |
| M | 27.87 | 27.97 | −0.8 | 0.12 | 0.91 | 0.82 | ||
| U | 1.43 | 1.02 | 27.5 | 85.4 | 3.14 | 0.00 | 2.34 ** |
| M | 1.37 | 1.43 | −4.0 | −0.52 | 0.60 | 1.41 * | ||
Note: * if ‘of concern’, i.e., variance ratio in [0.5, 0.8] or [1.25, 2]; ** if ‘bad’, i.e., variance ratio < 0.5 or >2.
Table 6.
Effect of extension contact on rice yields and nutrient use amount by OLS estimate.
| Rice Yields | Nutrient Use Amount | ||||
|---|---|---|---|---|---|
| Treatment var. | N | P | K | NPK | |
| 253.34 * | 1.79 | 2.17 | −1.42 | 1.31 |
| (147.55) | (1.31) | (5.24) | (4.24) | (1.04) | |
| Large-scale grain producers’ characteristics | |||||
| −10.42 | −0.44 | 7.45 | 5.58 | 0.57 |
| (356.23) | (2.61) | (13.65) | (13.64) | (1.94) | |
| 5.11 | 0.28 *** | −0.14 | 0.30 | 0.09 ** |
| (12.05) | (0.10) | (0.36) | (0.30) | (0.04) | |
| 7.87 | 0.30 | 1.07 | 0.75 | 0.18 |
| (25.67) | (0.24) | (0.82) | (0.70) | (0.18) | |
| 113.37 | −2.42 * | 0.28 | −5.36 | −1.35 |
| (152.56) | (1.42) | (6.06) | (4.50) | (1.22) | |
| −2.30 | −0.08 | −0.15 | −0.27 | −0.03 |
| (6.83) | (0.06) | (0.20) | (0.18) | (0.04) | |
| 77.34 | −0.50 | 0.75 | 3.11 | −0.20 |
| (140.52) | (1.35) | (4.96) | (4.00) | (0.90) | |
| Household characteristics | |||||
| 137.21 | −2.08 | −13.00 | −7.56 | −0.90 |
| (332.57) | (3.20) | (10.05) | (8.71) | (1.92) | |
| 21.53 | 0.04 | 0.74 | −0.27 | 0.08 |
| (61.15) | (0.55) | (2.22) | (1.72) | (0.41) | |
| 104.23 *** | 0.95 * | 0.06 | 1.18 | 0.28 |
| (30.30) | (0.57) | (1.28) | (0.89) | (0.17) | |
| −4.17 * | −0.05 ** | −0.08 | −0.06 | −0.01 |
| (2.50) | (0.02) | (0.09) | (0.07) | (0.01) | |
| −66.66 | 0.25 | −8.29 * | −5.95 | 0.50 |
| 147.89 | (1.87) | (4.62) | (4.20) | (1.34) | |
| Households’ farm characteristics | |||||
| 244.55 | 2.16 | 0.83 | 4.83 | 2.09 |
| (153.50) | (1.71) | (5.08) | (4.20) | (1.29) | |
| 113.83 | 0.95 | 6.75 | 2.27 | −0.07 |
| (152.04) | (1.37) | (8.06) | (5.40) | (0.81) | |
| −194.19 | −3.98 ** | −6.18 | −4.82 | −2.47 *** |
| (190.99) | (1.69) | (6.42) | (5.66) | (0.95) | |
| −2.25 | −0.06 * | −0.13 | −0.10* | −0.02 ** |
| (2.50) | (0.03) | (0.08) | (0.06) | (0.01) | |
| −0.38 | −0.00 | −0.01 | −0.02 | −0.01 * |
| (0.85) | (0.01) | (0.02) | (0.02) | (0.00) | |
| 278.99 * | −0.80 | 0.13 | −4.69 | −0.32 |
| (156.49) | (1.28) | (6.52) | (4.63) | (0.79) | |
| 150.79 * | 0.13 | −0.38 | 1.14 | 0.41 |
| (84.68) | (0.80) | (3.32) | (2.83) | (0.55) | |
| −229.92 | 2.59 | −1.37 | 0.97 | −0.05 |
| (185.33) | (1.79) | (5.53) | (5.46) | (0.92) | |
| 6274.29 *** | −8.78 *** | −4.48 | −8.69 | −4.26 ** |
| (273.76) | (2.49) | (6.04) | (5.71) | (2.08) | |
| Village characteristics | |||||
| −17.57 *** | 0.06 | −0.11 | −0.29 | 0.05 |
| (7.15) | (0.07) | (0.23) | (0.21) | (0.07) | |
| 9.21 | 0.57 * | 1.54 | 0.62 | 0.46 * |
| (39.24) | (0.29) | (1.10) | (1.01) | (0.24) | |
| Yes | Yes | Yes | Yes | Yes |
| Contants | 10,269.76 *** | 31.03 *** | 94.61 *** | 74.64 *** | 15.74 *** |
| (910.48) | (7.34) | (29.78) | (25.55) | (5.24) | |
| R-squared | 0.76 | 0.27 | 0.12 | 0.18 | 0.09 |
Note: *, **, and *** represent significance at 10%, 5%, and 1%, respectively.
Publisher’s Note: MDPI stays neutral with regard to jurisdictional claims in published maps and institutional affiliations. |
© 2022 by the authors. Licensee MDPI, Basel, Switzerland. This article is an open access article distributed under the terms and conditions of the Creative Commons Attribution (CC BY) license (https://creativecommons.org/licenses/by/4.0/).
Share and Cite
MDPI and ACS Style
Xu, Z.; Li, J.; Ma, J. Impacts of Extension Contact on the Adoption of Formulated Fertilizers and Farm Performance among Large-Scale Farms in Rural China. Land 2022, 11, 1974. https://doi.org/10.3390/land11111974
AMA Style
Xu Z, Li J, Ma J. Impacts of Extension Contact on the Adoption of Formulated Fertilizers and Farm Performance among Large-Scale Farms in Rural China. Land. 2022; 11(11):1974. https://doi.org/10.3390/land11111974
Chicago/Turabian StyleXu, Zengwei, Jing Li, and Jiliang Ma. 2022. "Impacts of Extension Contact on the Adoption of Formulated Fertilizers and Farm Performance among Large-Scale Farms in Rural China" Land 11, no. 11: 1974. https://doi.org/10.3390/land11111974
Note that from the first issue of 2016, this journal uses article numbers instead of page numbers. See further details here.