Article

Distribution and Influencing Factors of Metals in Surface Soil from the Yellow River Delta, China

Key Laboratory of Ecological Restoration and Conservation of Coastal Wetlands in Universities of Shandong, The Institute for Advanced Study of Coastal Ecology, Ludong University, Yantai 264025, China
*
Author to whom correspondence should be addressed.
Land 2022, 11(4), 523; https://doi.org/10.3390/land11040523
Submission received: 24 February 2022 / Revised: 23 March 2022 / Accepted: 29 March 2022 / Published: 4 April 2022
(This article belongs to the Special Issue Monitoring and Simulation of Wetland Ecological Processes)

Abstract

:
To study metal enrichment and identify the influencing factors, 106 surface soils were collected in the Yellow River delta, including ten vegetation types. Concentrations of 10 different metals, including As, Cd, Cr, Ni, Cu, Pb, Zn, Mn, Al, Fe, and physicochemical properties pH, salinity, particle size were detected. The pH value was 7.35~9.17, and the salinity was in the range of 0.01~2.00%. The average value of silt was 76.18%, which was the main particle size for 99% of the samples. The mean concentrations of As, Cd, Cr, and Ni were higher than the background value of Shandong Province or the background value of yellow soil in China. A higher concentration of Fe occurred in Phragmites australis (mean concentration 2.50%) and paddy field. The concentrations of Cd, Cr, Ni, Cu, Pb and Zn were lower in the Suaeda salsa soil. The Nemerow pollution index indicated that 79% of all samples showed low-level metal pollution, and 7% of all samples showed moderate-level metal pollution. In the areas with higher salinity, the concentrations of As were higher, while the concentrations of Cd and Ni were lower. The correlation analysis showed that with increasing pH, the concentrations of As and Zn decreased significantly. The metal concentrations had a significant positive correlation with clay, except for As.

1. Introduction

The delta region is a fluvial plain formed by the deposition of sediment coming from the river. It is a dynamic intersection zone between ocean and land that plays an irreplaceable role in protecting the ecological environment. However, with the rapid development of industry, agricultural reclamation, hydraulic engineering construction, fishery resources, and so on, high metal concentrations have been frequently detected in the soil of delta regions worldwide [1,2,3]. Metals, especially heavy metals, can be bioaccumulated and amplified easily through the food chain, which has caused increasing concern worldwide [4,5].
Metals in delta region could be affected by many factors, such as vegetation types, pH, particle size and so on. Variation of vegetation types would alter the distribution of heavy metals [6]. Due to the widespread use of fertilizers and pesticides in croplands, the metal concentration of farmland exceeds that of natural soil. Zhang et al. [7] indicated that concentrations of Cr and As were higher in cropland than in grassland. Düring et al. [8] reported that bioavailability of metals was reduced in the long-term no tillage, resulting in lower uptake of Cd and Zn by plants and accumulation in the soil. Metal concentrations could also be affected by these soil properties [9,10,11]. The pH is expected to have a greater influence on metal behaviour at lower salinities [12]. Li et al. [13] indicated that high contents of clay minerals could be an important factor for the retention of high concentrations of metals. However, certain research also observed the opposite phenomenon, that metals were more enriched in coarse particles [11].
The Yellow River delta, an important habitat for various animals and plants, functions as the transit station, wintering habitat, and breeding ground for birds from inland northeast Asia and the western Pacific rim. However, the Yellow River delta, one of the largest deltas in China, has also been polluted by metals [14]. It has been reported that approximately 4.40 × 10⁵ t of pollutants (including 1110 t of heavy metals) from cities, industries, and mining enterprises in the Yellow River basin have been carried to the estuary [15,16]. The objectives of this study are as follows: (1) to analyse the distribution of physicochemical properties and metal concentrations in the surface soil of the Yellow River delta; (2) to assess the risk caused by metals in surface soil; and (3) to clarify the factors and determine how the factors affect metal distribution.

2. Materials and Methods

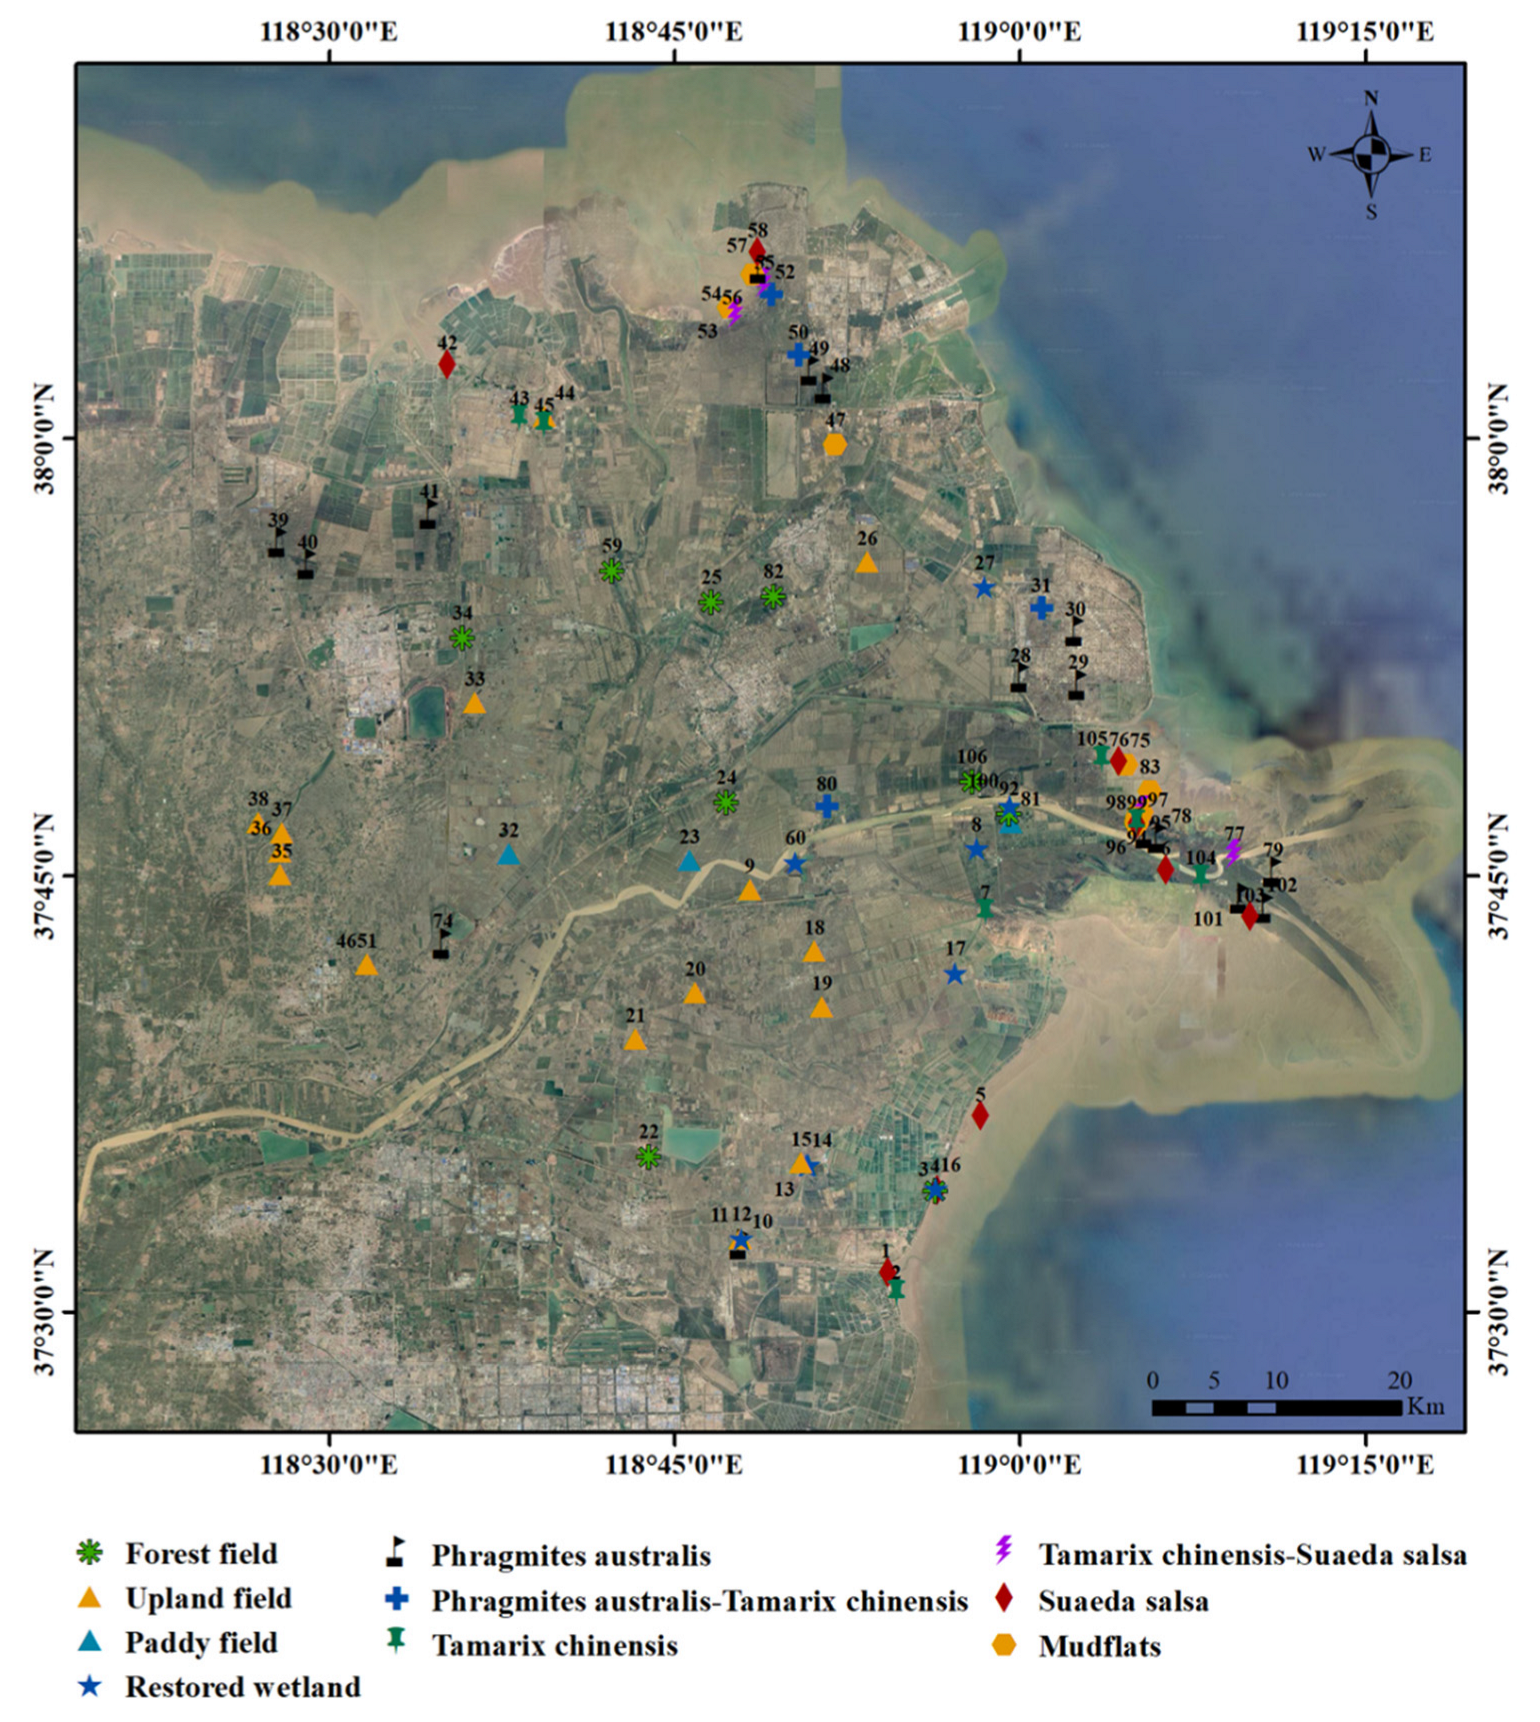
2.1. Site Description

The Yellow River delta (117°31′~119°18′ E, 36°55′~38°16′ N), which is surrounded by Bohai Bay and Laizhou Bay, is located in Binzhou City, Shangdong Province. This area has a warm-temperate continental monsoon climate with an average annual temperature ranging from 11.7 °C to 12.1 °C [17]. The annual average rainfall and the annual average evaporation are 552 mm and 1962 mm, respectively. The groundwater depth is shallow, and the average water level ranges from 0.2 m to 3.0 m [18]. Fluvisols are a typical soil type in this region, originating from sediment and the parent materials of loess soil [4].

2.2. Sampling and Analysis

According to the survey results of vegetation in the Yellow River Delta, ten types of vegetation types, forest field (Robinia pseudoacacia, n = 9), upland field (corn, cotton, n = 16), paddy field (n = 3), restored wetland (weed, n = 9), Phragmites australis (n = 16), Phragmites australis-Tamarix chinensis (n = 6), Tamarix chinensis (n = 12), Tamarix chinensis-Suaeda salsa (n = 8), Suaeda salsa (n = 9), and mudflat (n = 18) were chosen (Figure 1). In June and July 2018, totally 106 surface soil samples were collected at a depth of 0–10 cm in the selected sites. Then, the samples were sealed in clean polyethylene plastic bags and transported to the laboratory. All soil samples were air-dried for at least 3 weeks, and extraneous matter, such as leaves and large stones, was removed. Then, the soil samples were ground into particles with diameters of less than 200 μm and stored at 4 °C before analysis.
Soil pH was measured in the supernatant of 1:5 (w/v) soil–water mixtures using a pH meter (PHBJ-260, INESA, Shanghai, China) [19]. The total water-soluble salt content detected according to agricultural industry standard [20], were used as soil salinity in this paper. The particle size distribution of the surface soil was analysed with a laser particle size analyser (Mastersizer 3000, Malvern Panalytical, China). Three types of particle sizes were divided as follows: clay (<4 μm), silt (4~63 μm), and sand (63~2000 μm).
Approximately 0.5 g of the ground sample powder was digested using hydrofluoric acid, nitric acid and perchloric acid according to the national standard method for China [21]. Then the concentration of arsenic (As) was detected by hydride generation-atomic fluorescence spectrometry (HG-AFS). Inductively coupled plasma–mass spectrometry (ICP–MS) was used to detect the concentrations of cadmium (Cd), chromium (Cr), nickel (Ni), copper (Cu), lead (Pb), zinc (Zn), manganese (Mn), aluminium (Al), and iron (Fe). Duplicate samples (one duplicate every 10 samples) were measured for data quality assurance. The recovery rate was obtained from adding geochemical reference materials (e.g., GSS23) (one every 10 samples) and calculated to be the ratio of the determined value and reference value of the reference material.

2.3. Sediment Quality Guidelines (SQGs)

Sediment quality guidelines (SQGs) were used to evaluate the potential adverse biological effects of metals, which were proposed by Long et al. [22] and Macdonald et al. [23]. These were used to assess the risk of As, Cd, Cr, Ni, Cu, Pb, and Zn in the soil of the Yellow River delta. The threshold effect level (TEL) was intended to estimate the concentration of a chemical below which adverse effects only rarely occurred. Similarly, the probable effect level (PEL) was intended to provide an estimate of the concentration above which adverse effects frequently occurred. Three guidelines could be divided into three groups according to the concentrations of metals: (1) rarely (<TEL), (2) occasionally (>TEL and <PEL), and (3) frequently (>PEL) associated with adverse effects [24].

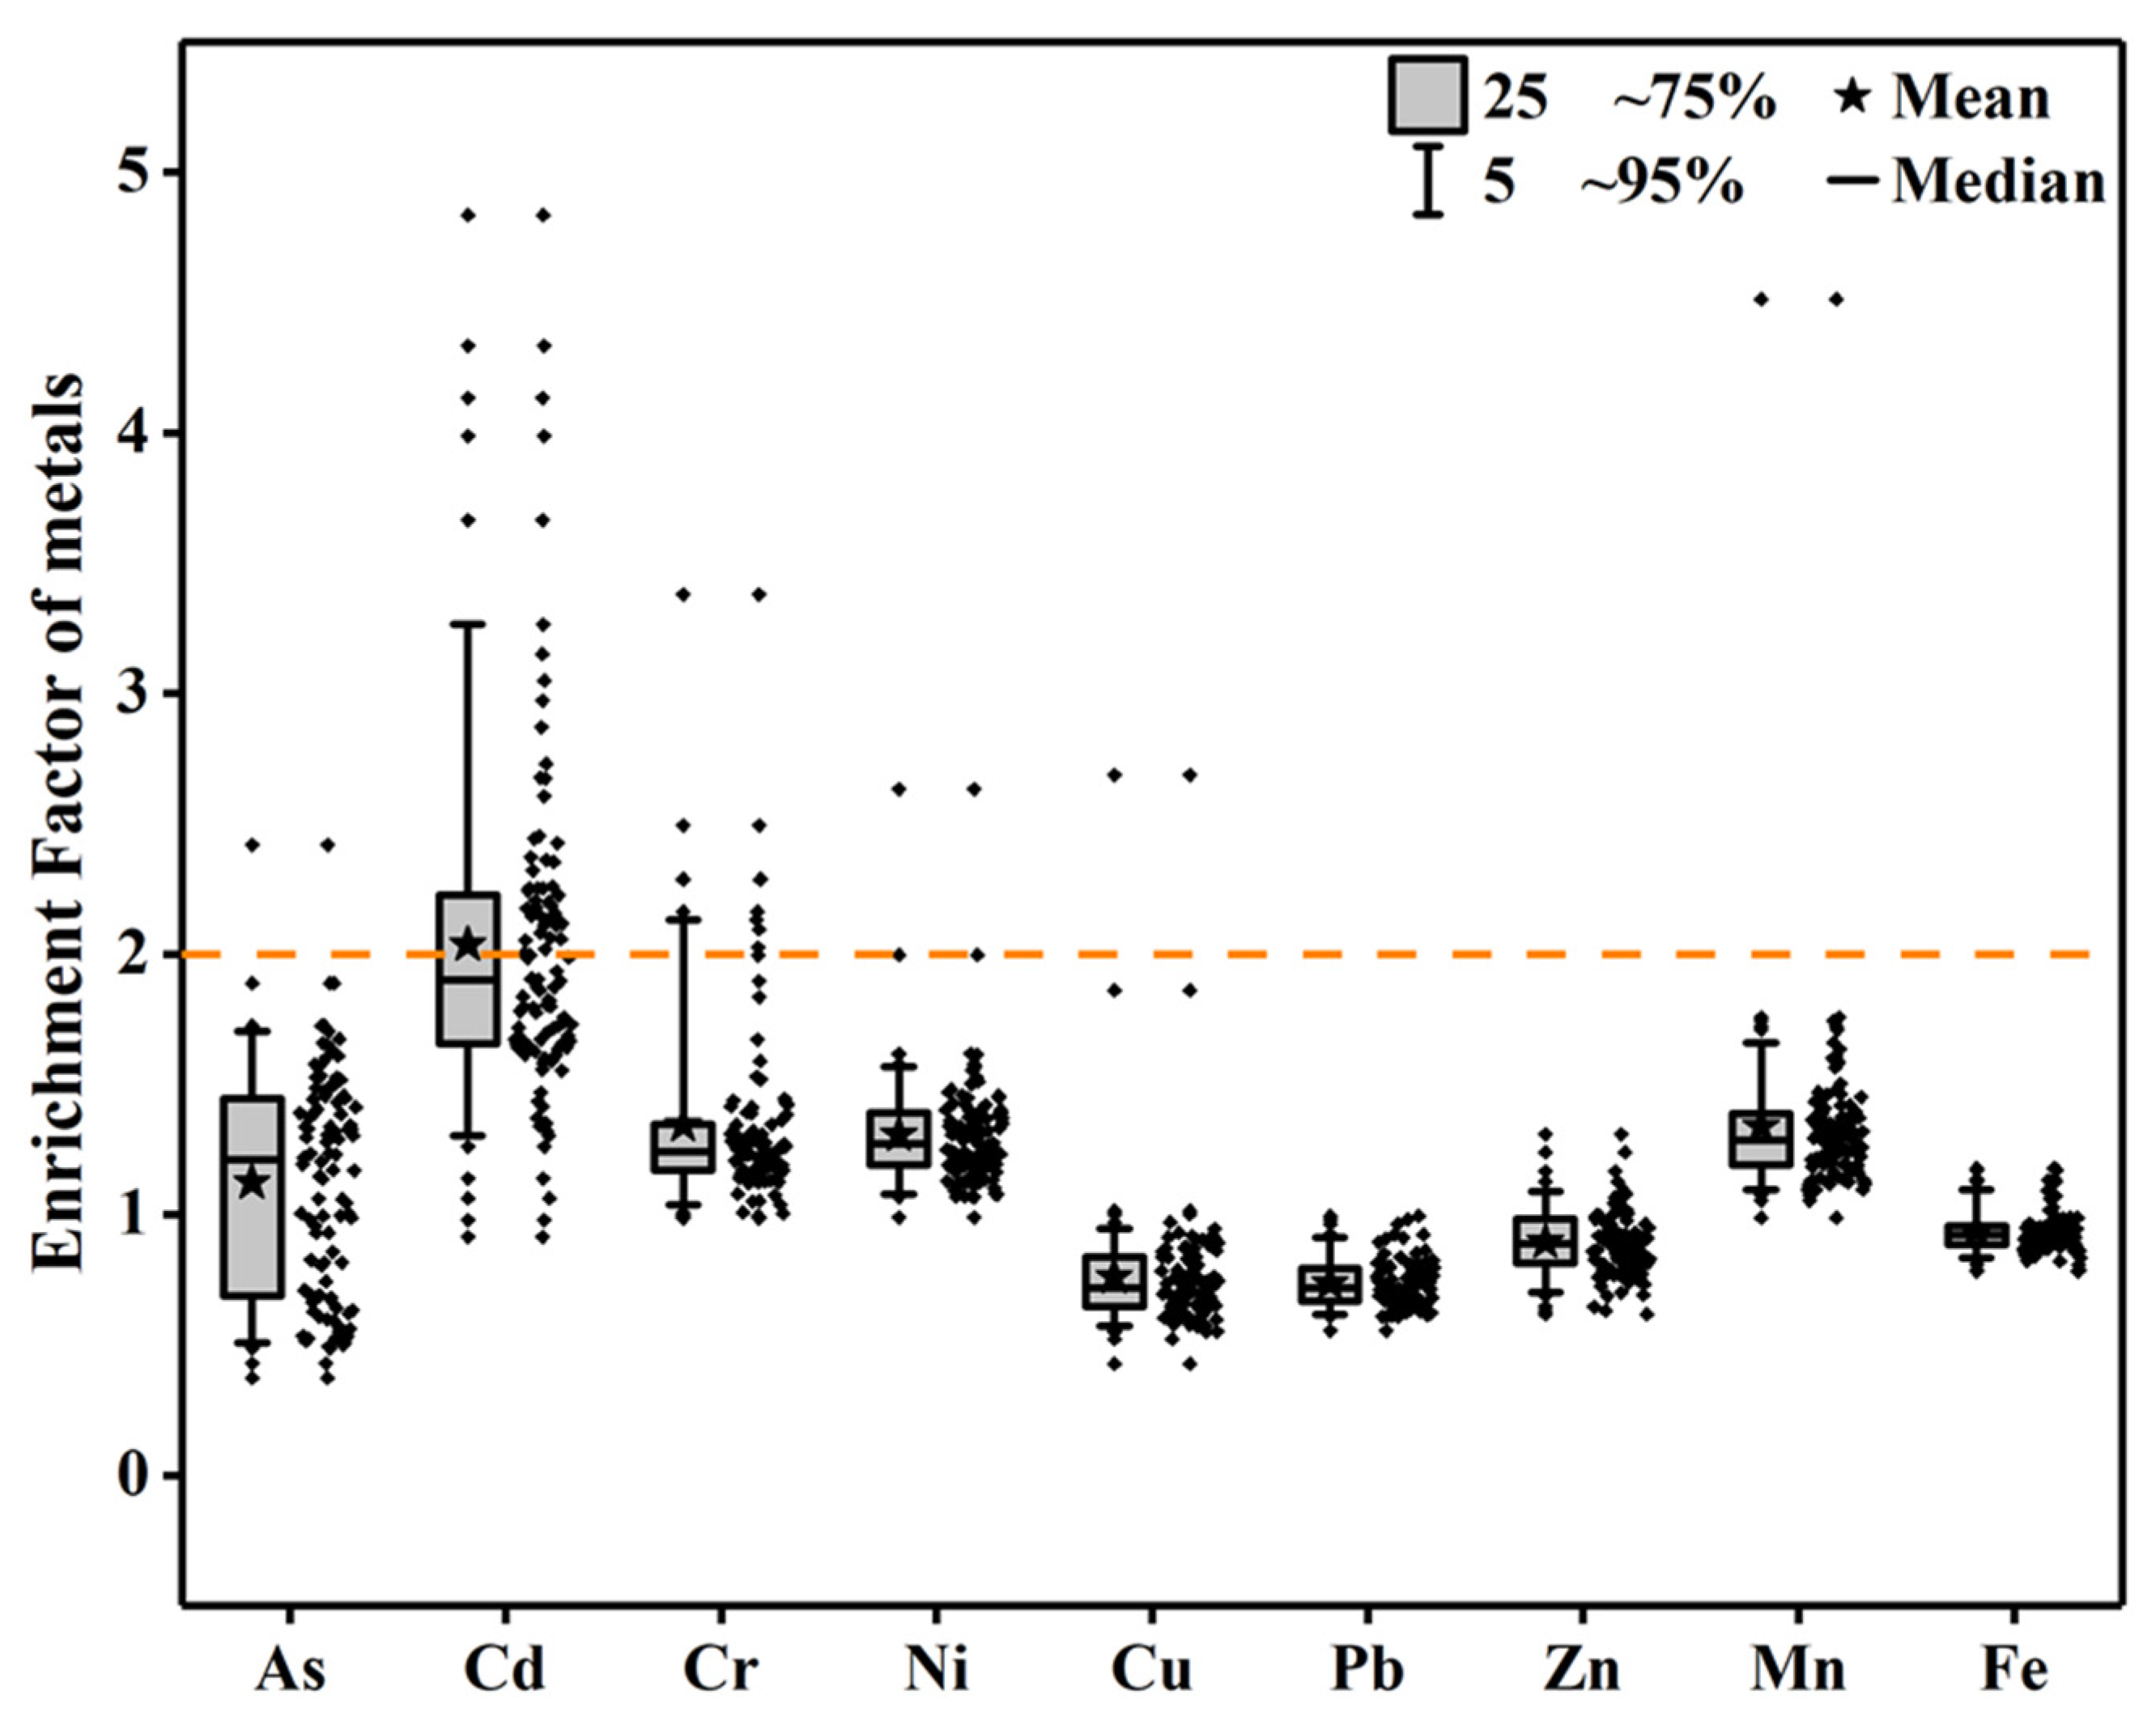
2.4. Enrichment Factor Analysis

Enrichment factors (EFs) have been widely applied to describe metal pollution levels in soil and have been used to analyse the possible impact of anthropogenic activities on heavy metal concentrations [25,26]. EFs were calculated with Equation (1) using the individual metal concentrations and the reference metal concentrations for each sample together with the metal background values of Shandong Province [27].
E F s = ( C x / C r e f ) s a m p l e ( C x / C r e f ) b a c k g r o u n d
where Cx represents the concentration of the metal x and Cref is the concentration of the reference metal. The reference metal usually exhibits weak geochemical activities and is less affected by human activities, such as Al, Fe, and Mn [28,29]. In this study, Al was selected as the reference metal because the Al concentrations in the soil samples were all close to the background value of Shandong Province [27]. Generally, five contamination categories were recognized on the basis of the enrichment factors: deficient to minimal enrichment (<2), moderate enrichment (2–5), substantial enrichment (5–20), very high enrichment (20–40), and extremely high enrichment (>40) [30].

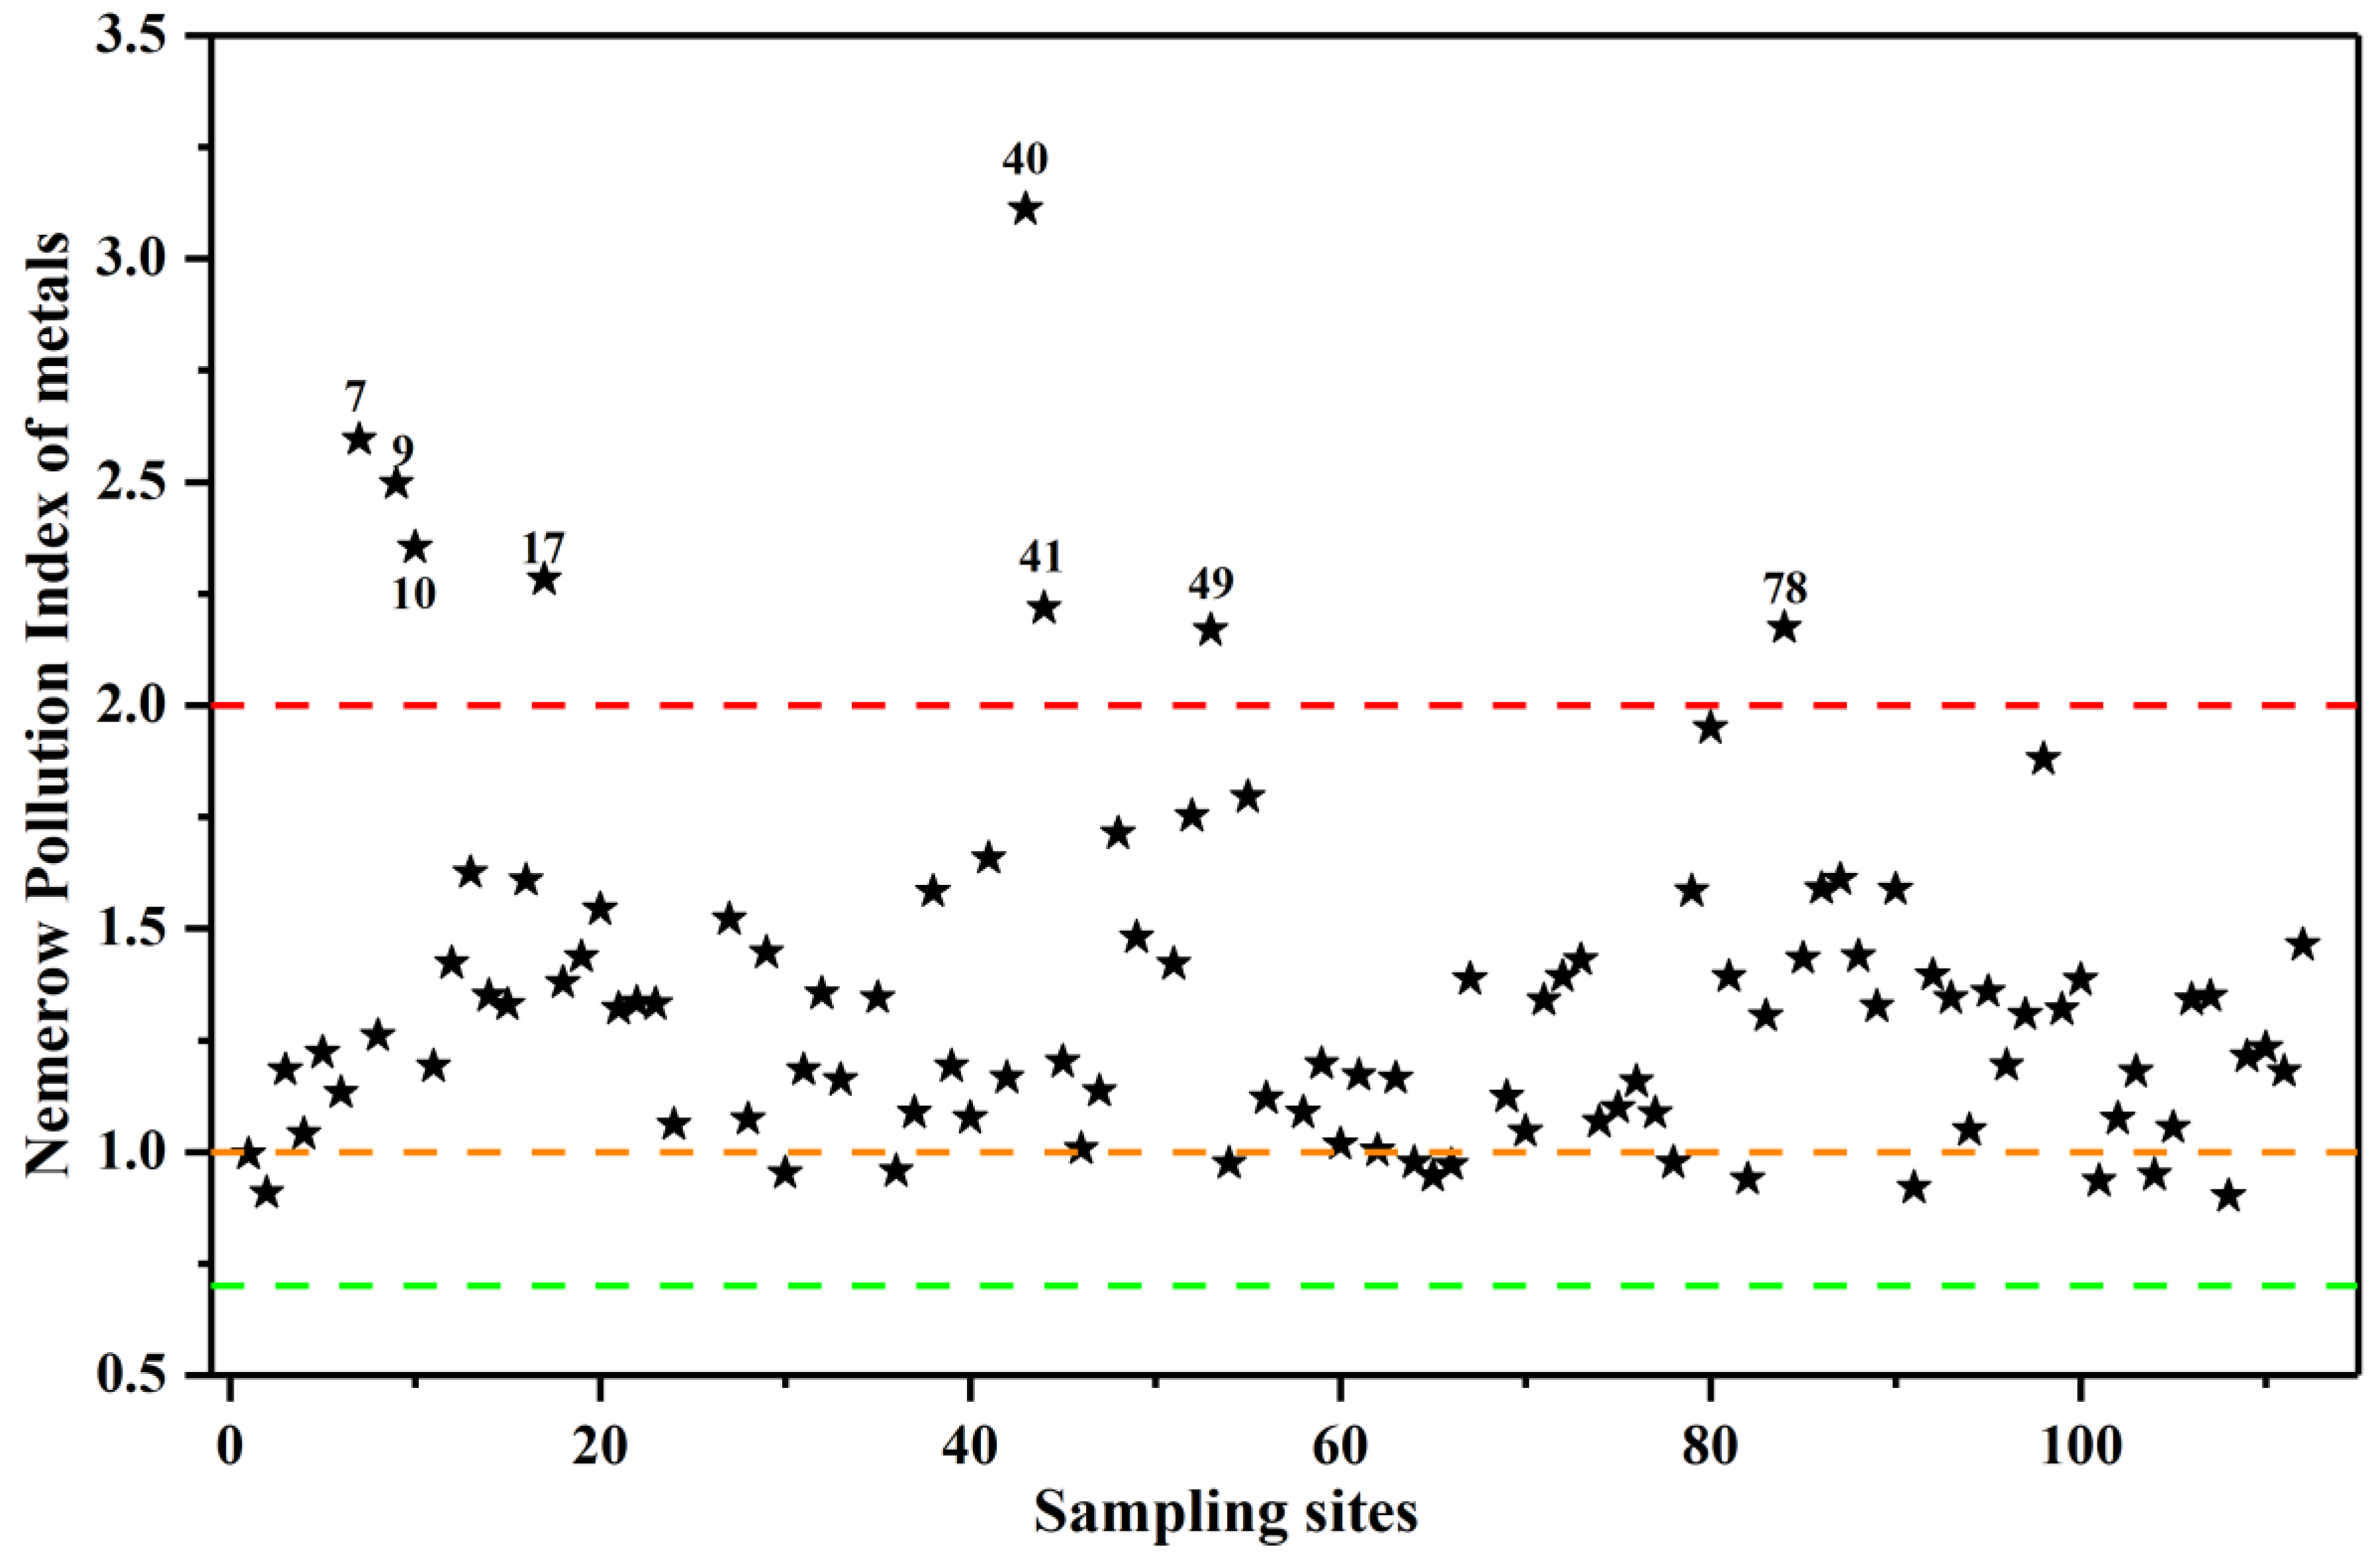
2.5. Nemerow Pollution Index Analysis

The Nemerow pollution index (NPI) was used to assess the degree of contamination in soil, which was calculated through Equations (2) and (3) for each sampling site [31,32].
P x = C x S x  
NPI = P x , m a x 2 + P x , m e a n 2 2
where Px is the single pollution index of metal x; Cx represents the concentration of metal x; Sx represents the background values of the study area, which refer to the metal background values of Shandong Province [27]; Px,max is the maximum value of the single pollution index of metal x; and Px,mean represents the average value of the single pollution index of metal x. According to the value of the NPI, five contamination categories were recognized: non-pollution (NIPI ≤ 0.7), warning line of pollution (0.7 < NIPI ≤ 1), low-level pollution (1 < NIPI ≤ 2), moderate-level pollution (2 < NIPI ≤ 3) and high-level pollution (NIPI > 3) [33].

2.6. Data Analysis

Descriptive statistical analyses were performed using Microsoft Excel 2010, IBM SPSS Statistics 22, and Origin 2017. Correlation analysis was performed to evaluate the degree of correlation between metals and physicochemical properties. Considering that the vegetation type was a non-numerical variable, Spearman correlation analysis was chosen for this study. ArcGIS 10.0 (Esri, Redlands, CA, USA) was used for spatial calculations and to create Figure 1. Interpolated figures (Figures 2 and 5) were graphed based on the Kriging method through ArcGIS 10.0. Origin 2017 was used to create Figures 3, 4 and 6. In addition, Figures 7 and 8 were graphed by IBM SPSS Statistics 22.

3. Results

3.1. Physicochemical Property of Soil

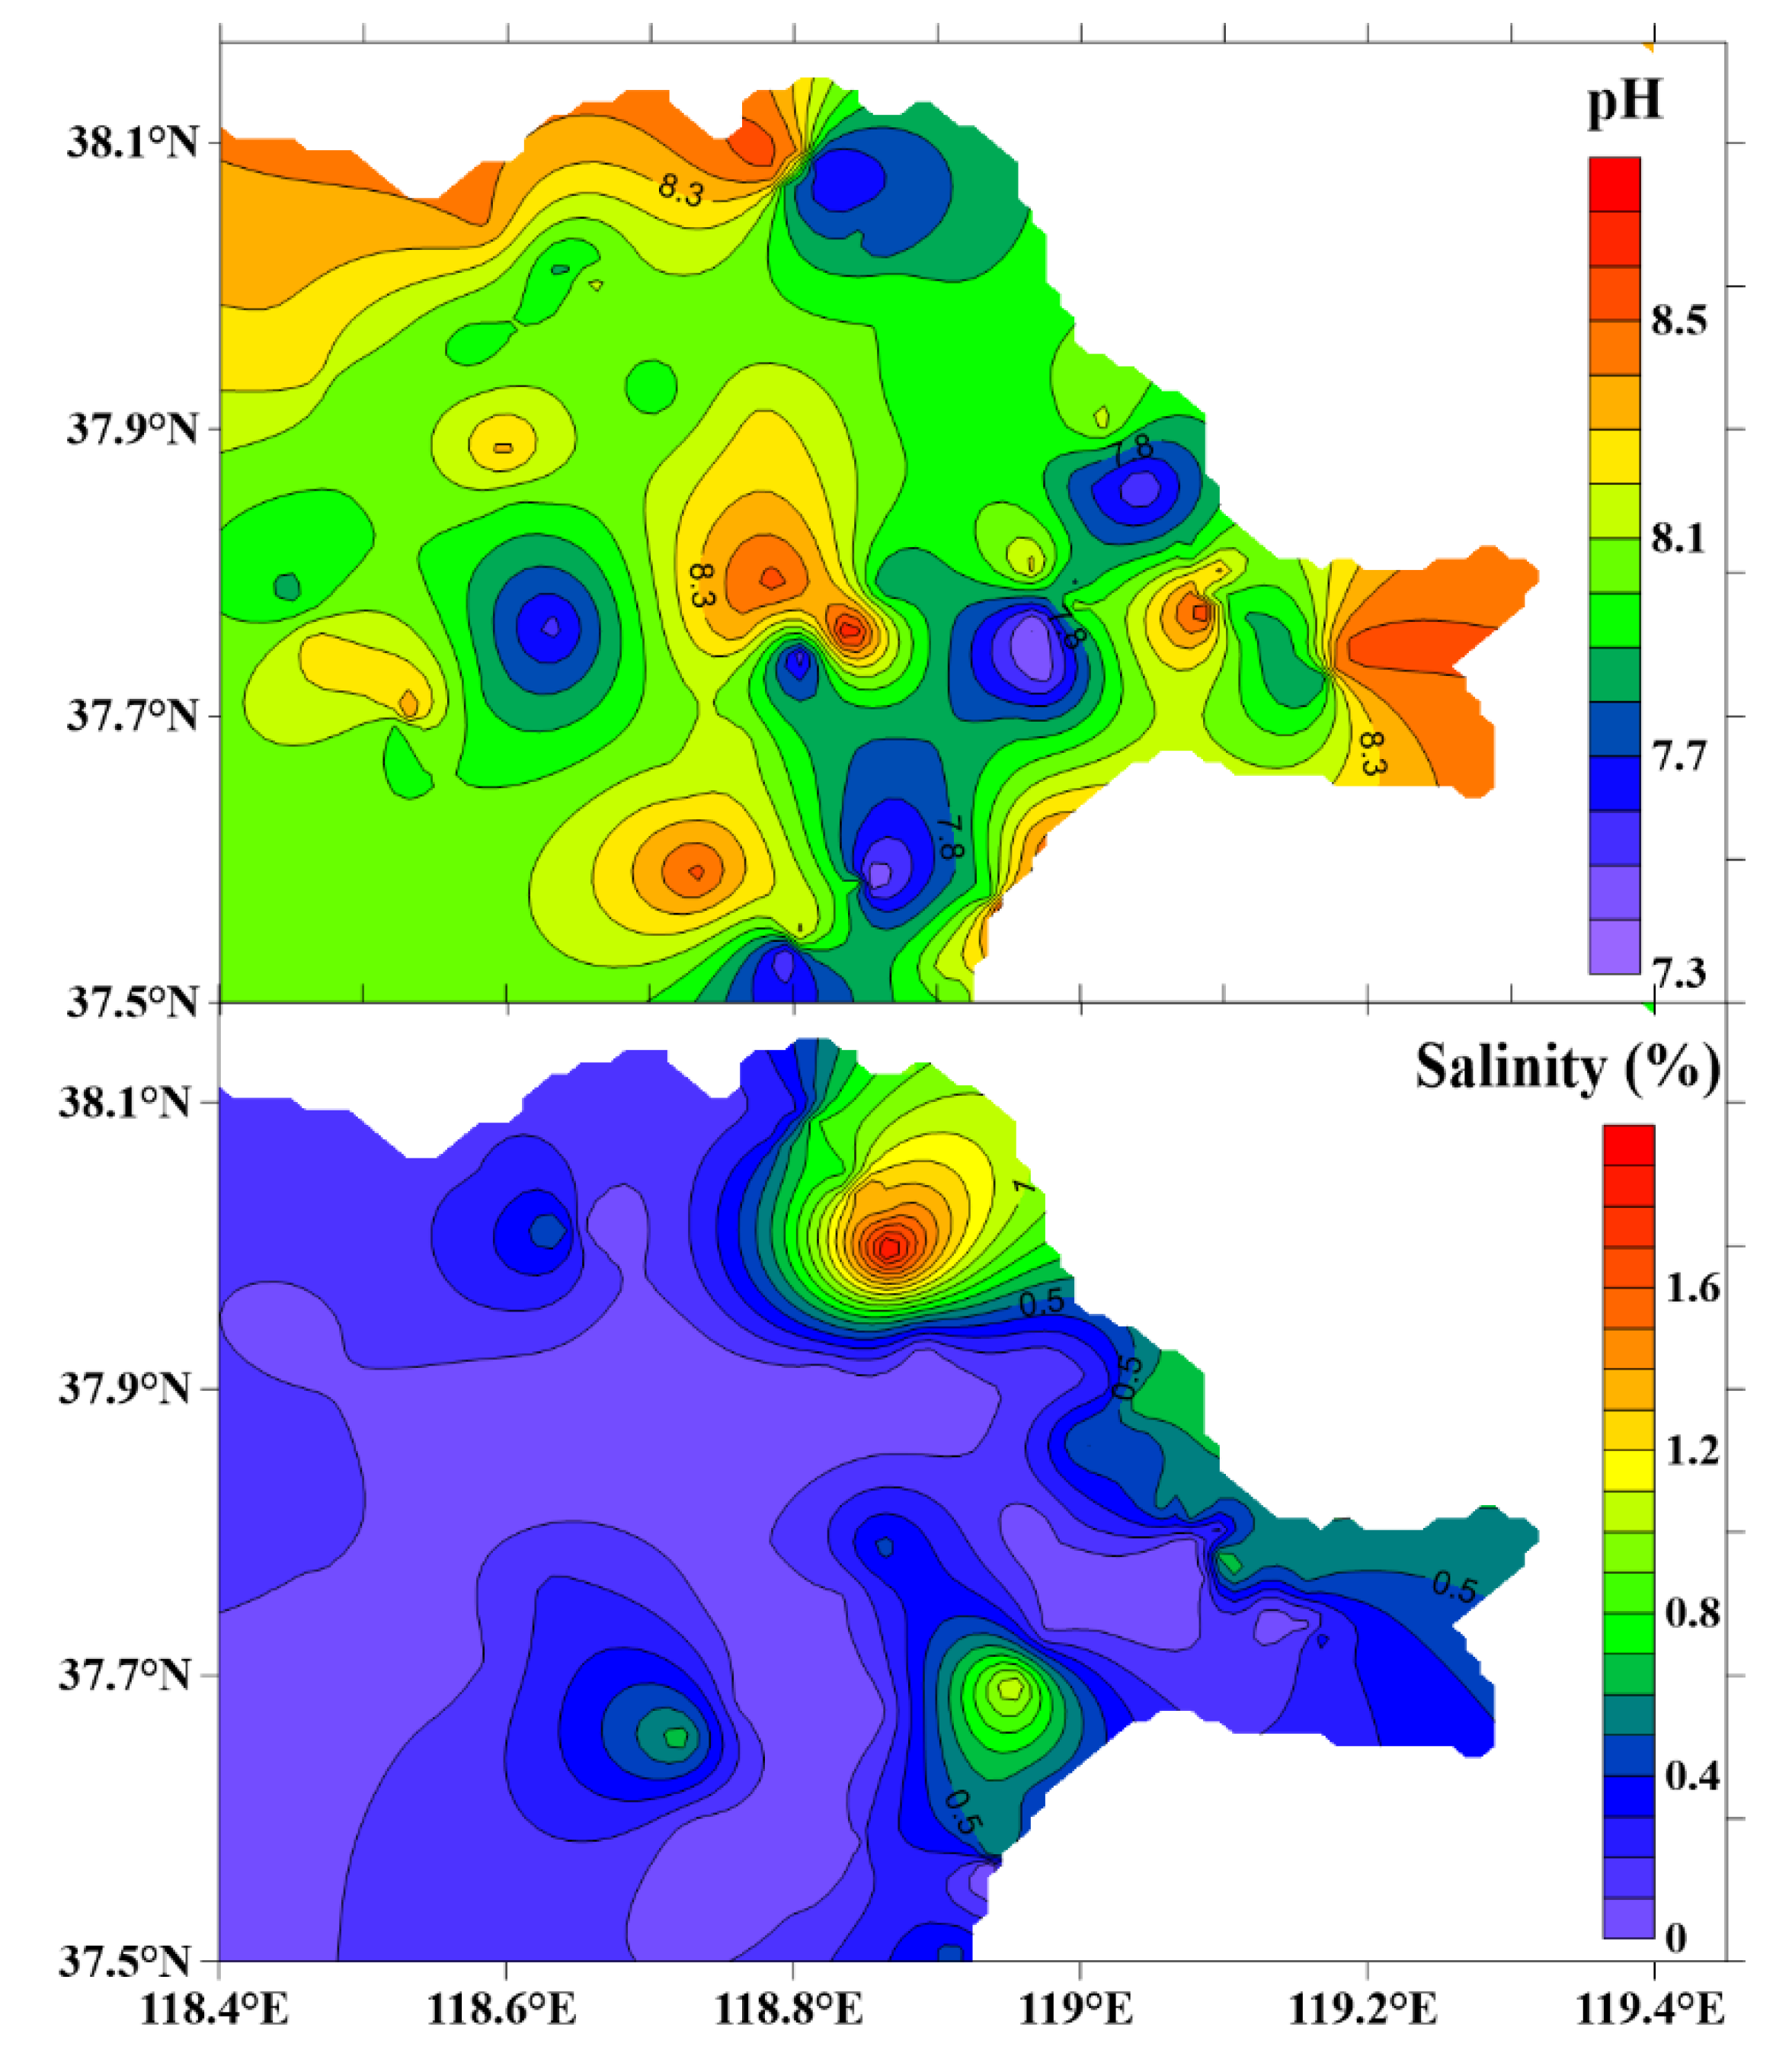
3.1.1. Yellow River Delta

The physicochemical properties of surface soil in the Yellow River delta are presented in Table 1 and Figure 2. The pH in the study area ranged from 7.35 to 9.17, with a mean value of 8.06, which indicated that the surface soil was alkaline. In general, the pH in this study area was higher than the background pH value of Shandong Province (pH = 7.7) and notably higher than the background pH value of yellow soil in China (pH = 5.2) [27]. The pH values at sites 3, 22, 24, 60, 63, 66, and 79 were higher than 8.5, which is harmful to plants.
The salinity in the study area was in the range of 0.01~2.00%, with a mean value of 0.32%. The highest salinity (S = 2%) occurred at site 47, which was a mudflat site. According to the classification of Shandong Province, site 47 was a salty wasteland. Among all sampling sites, the salinity of 18 sampling sites was over 0.6%, and the soil there was solonchak.
To analyse the spatial distribution of pH and salinity in the Yellow River delta, interpolated figures were graphed based on the Kriging method. As shown in Figure 2, the pH was higher in the northwest and south coastal areas, which were mainly mariculture areas. In addition, the soil in the Yellow River delta had a higher pH, which indicated that seawater intrusion might occur in this area. The salinity in the northeastern area was higher than that in the southern area, which was caused by the different levels of seawater intrusion. The depth of seawater in the northeastern area (Bohai Bay) was deeper than that in the southern area (Laizhou Bay). This phenomenon indicated that the northeastern area experienced more erosion from seawater, which affected the soil salinity in the coastal area.
The higher pH and salinity in the study area indicated that the soil in the Yellow River delta exhibited salt-alkalization. Low rainfall (annual average rainfall = 552 mm), high evaporation (annual evaporation = 1962 mm), and seawater erosion may be the main reasons for this result.
The particle size distribution showed that silt was the main particle size for most sites in the study area, with a mean value of 76.18%. The mean values of clay and sand were 14.45% and 9.31%, respectively.

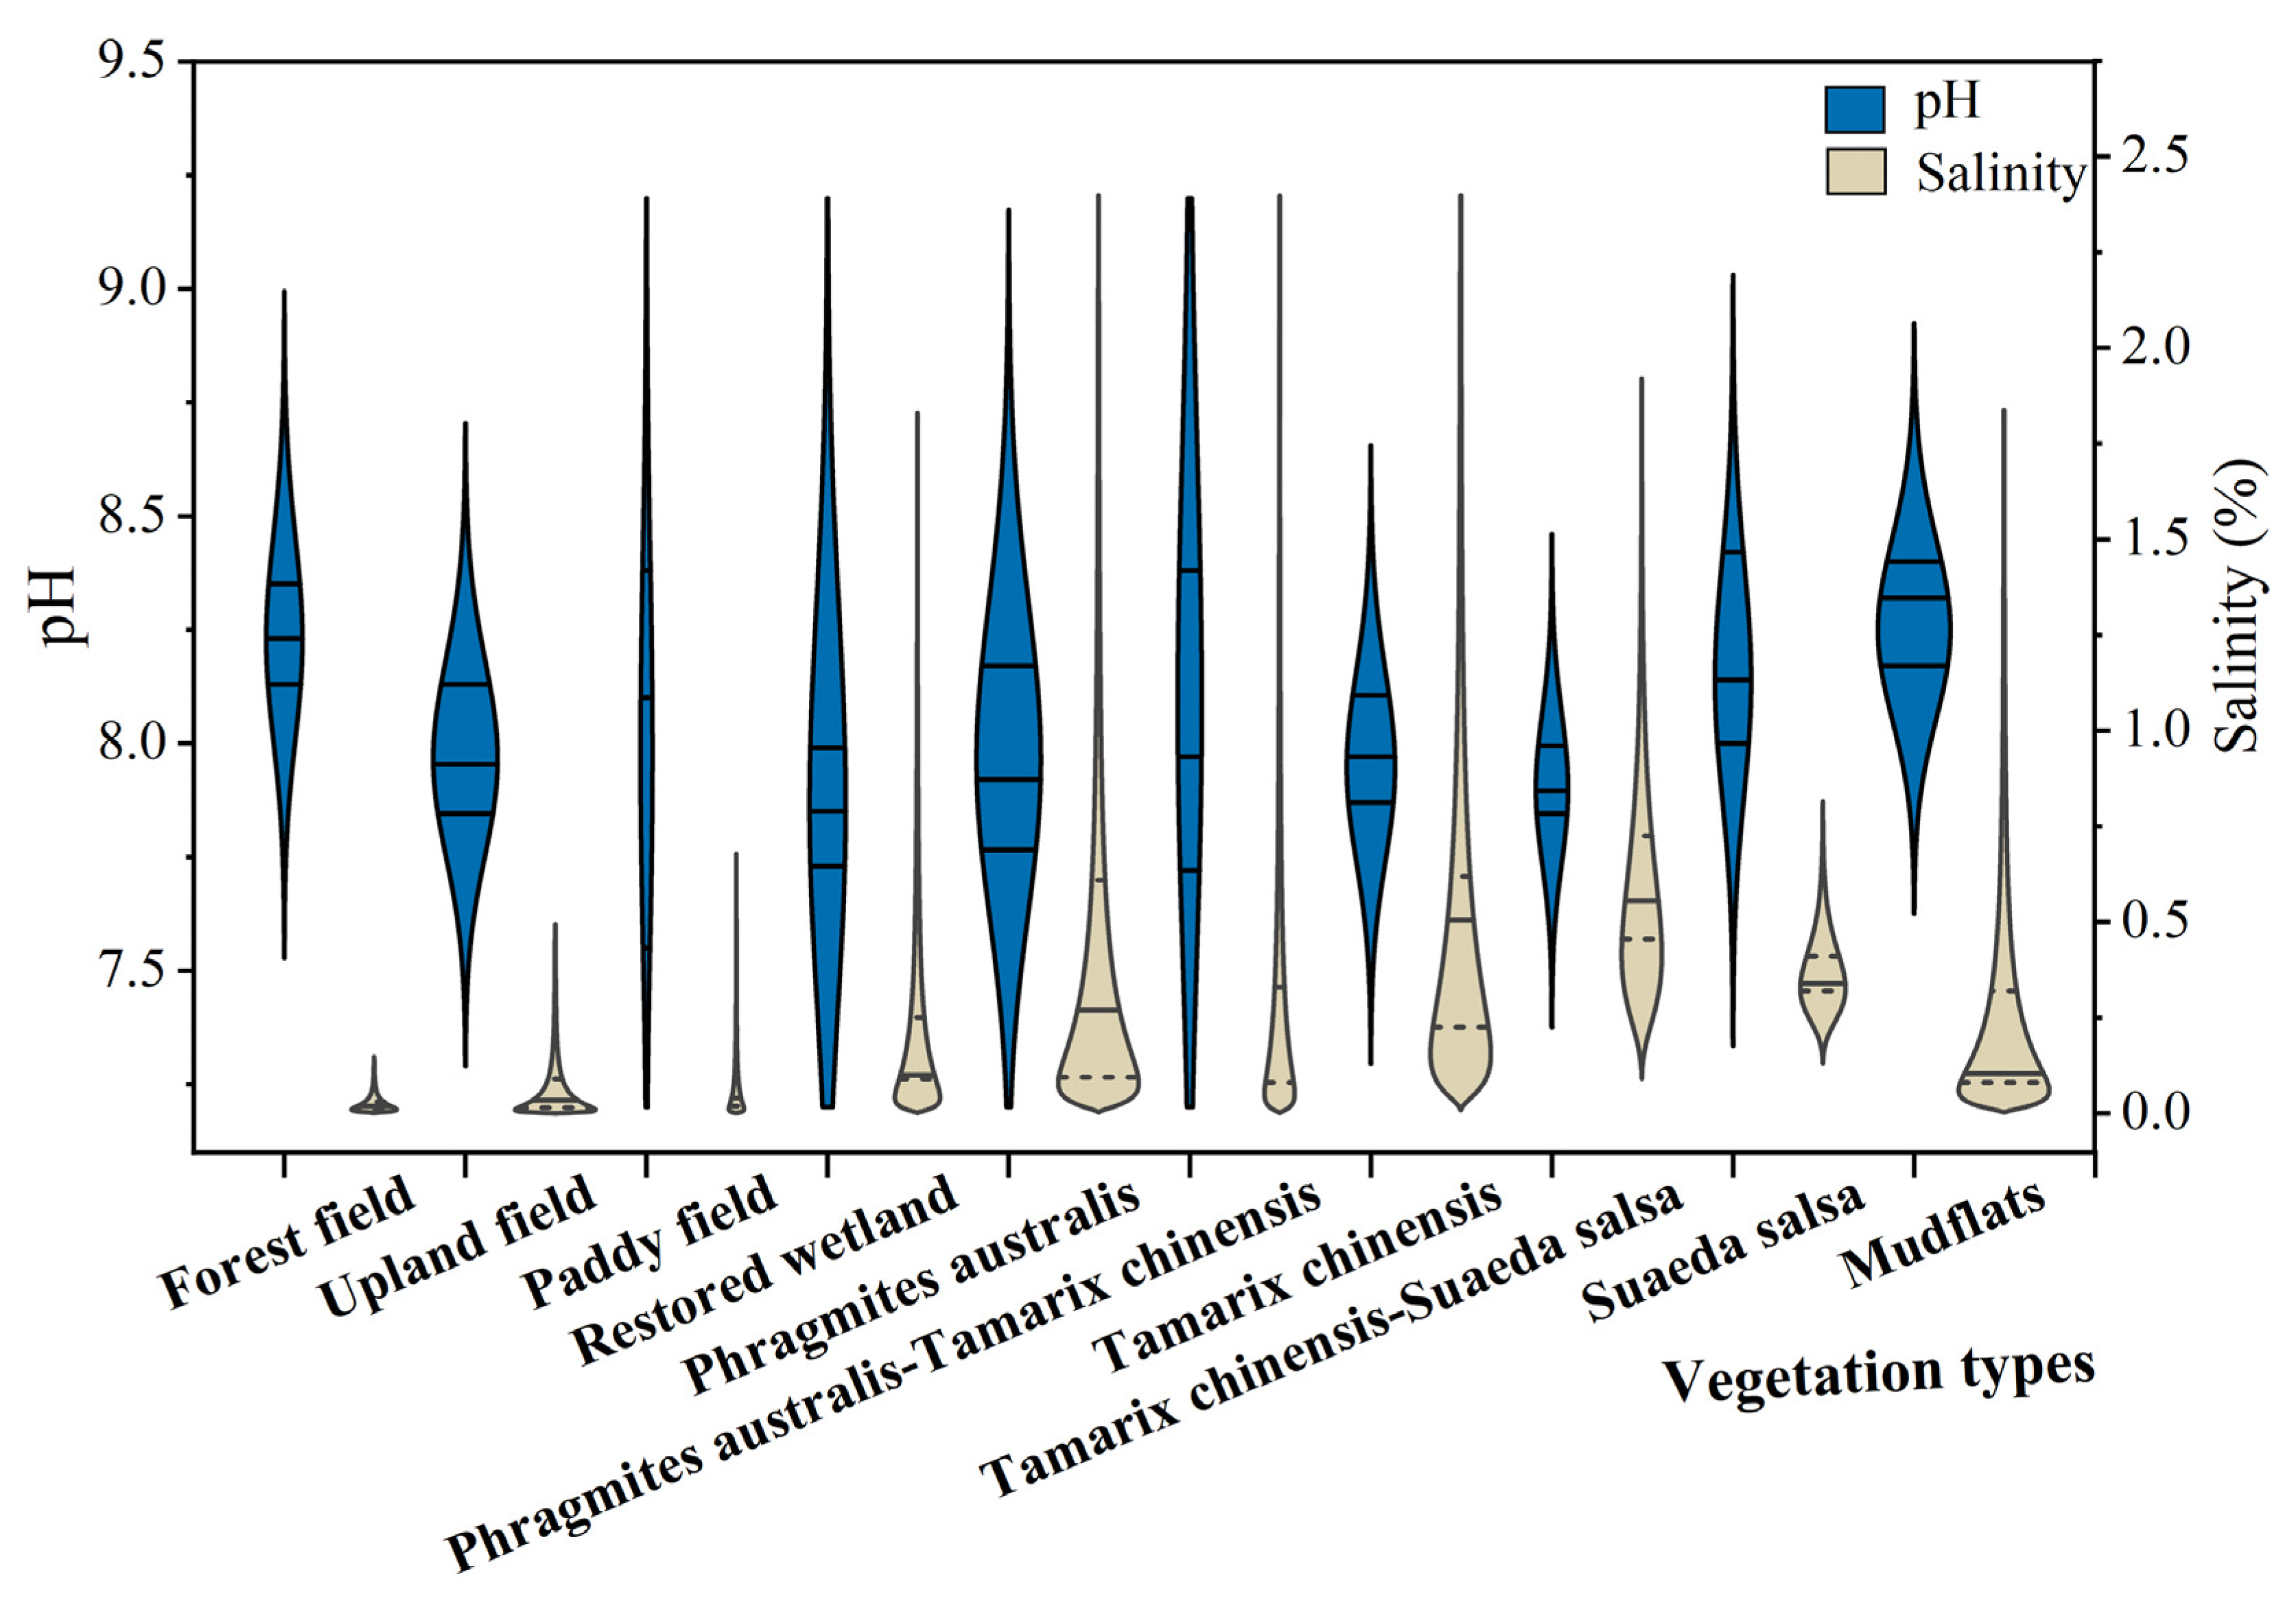
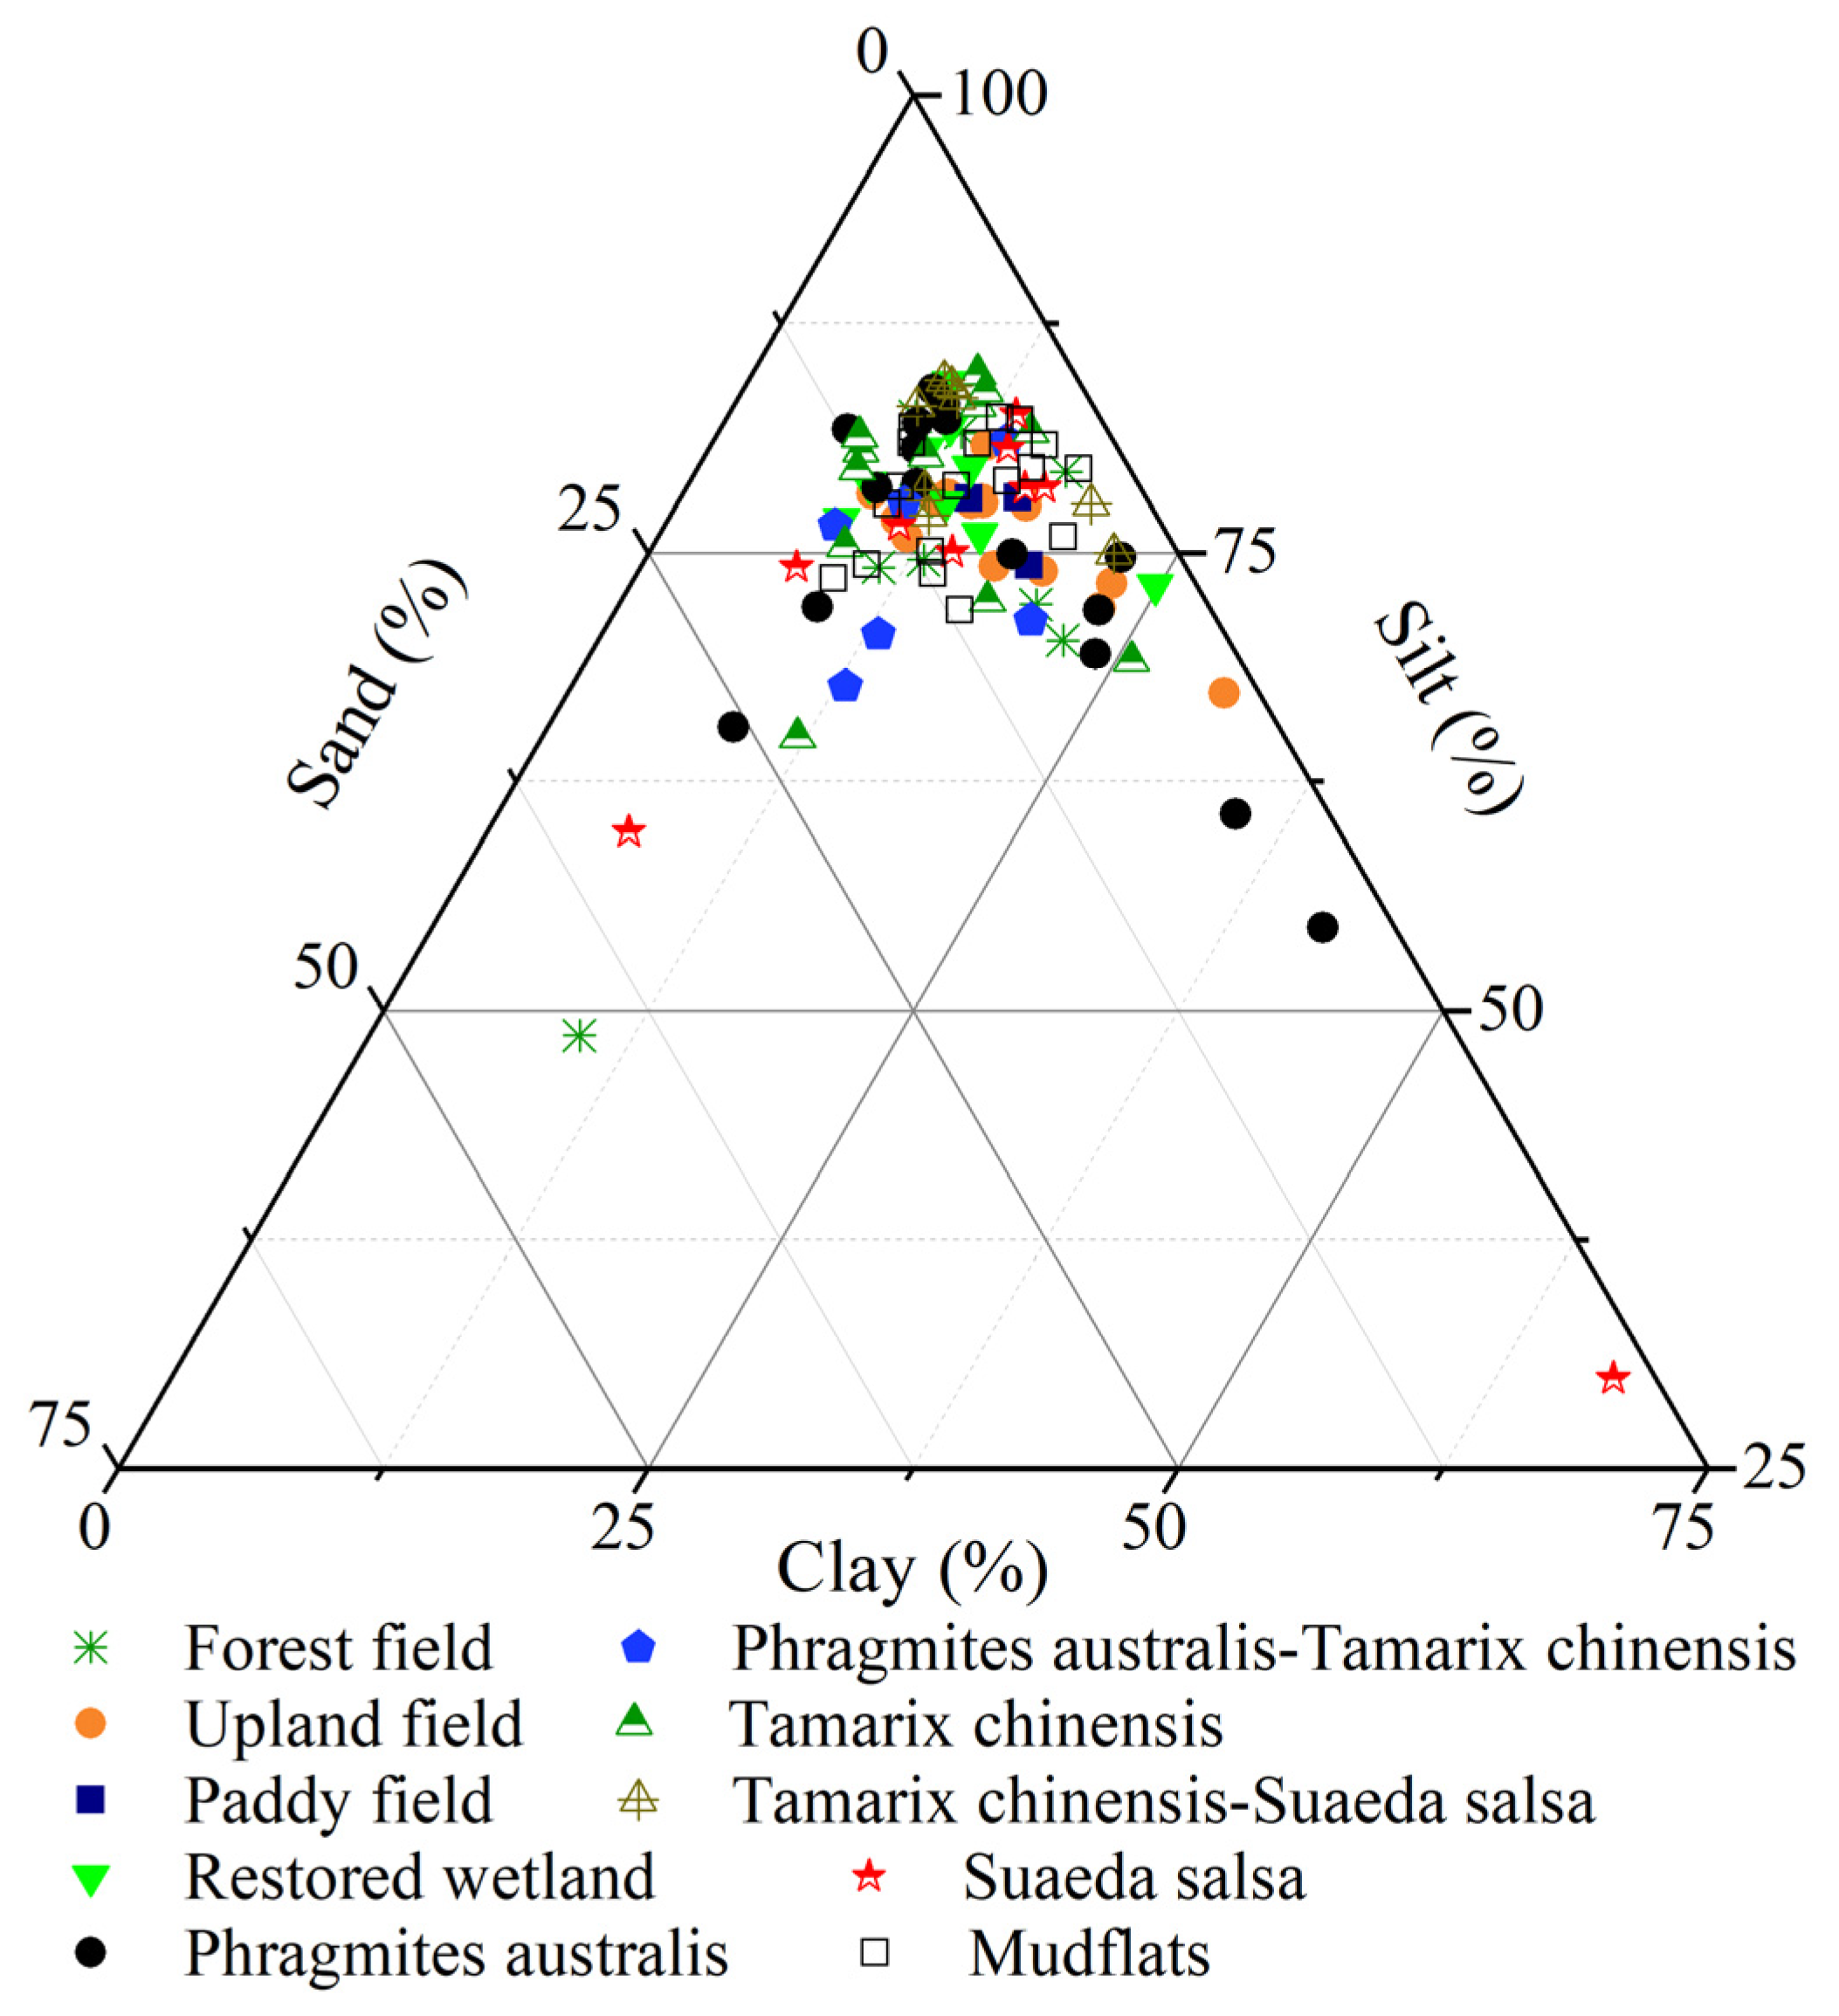
3.1.2. Under Different Vegetation Types

The lognormal distributions of pH and salinity in the study area are shown in Figure 3. The pH values in forest fields and Suaeda salsa were higher than those of other vegetation types. The pH value fluctuated sharply in areas frequently influenced by water, such as the paddy field, restored wetland, Phragmites australis, and Phragmites australis-Tamarix chinensis vegetation types.
The salinity values of the forest field, upland field, and paddy field vegetation types were lower than 0.1%, which were lower than those of the wetland vegetation type. The salinity in the soil increased gradually with the replacement of Phragmites australis-Tamarix chinensis, Tamarix chinensis, Tamarix chinensis-Suaeda salsa, and Suaeda salsa. These results confirmed that vegetation types would change with the salinity of soil and that salinity could affect the growth of vegetation. However, the salinity values in soil with Phragmites australis ranged from 0.04% to 1.53% in this study area, which indicated that Phragmites australis could grow over a wide salinity range.
Silt was the main part for the soil in study area. The distributions of particle sizes in the upland field and paddy field were similar (Figure 4). The mean proportions of clay, silt, and sand were 16%, 76%, and 8% for the upland field and 16%, 77%, and 7% for the paddy field.
The particle size distribution in Phragmites australis and Suaeda salsa was obviously dispersed, which implied that there were different influencing factors for different sites.

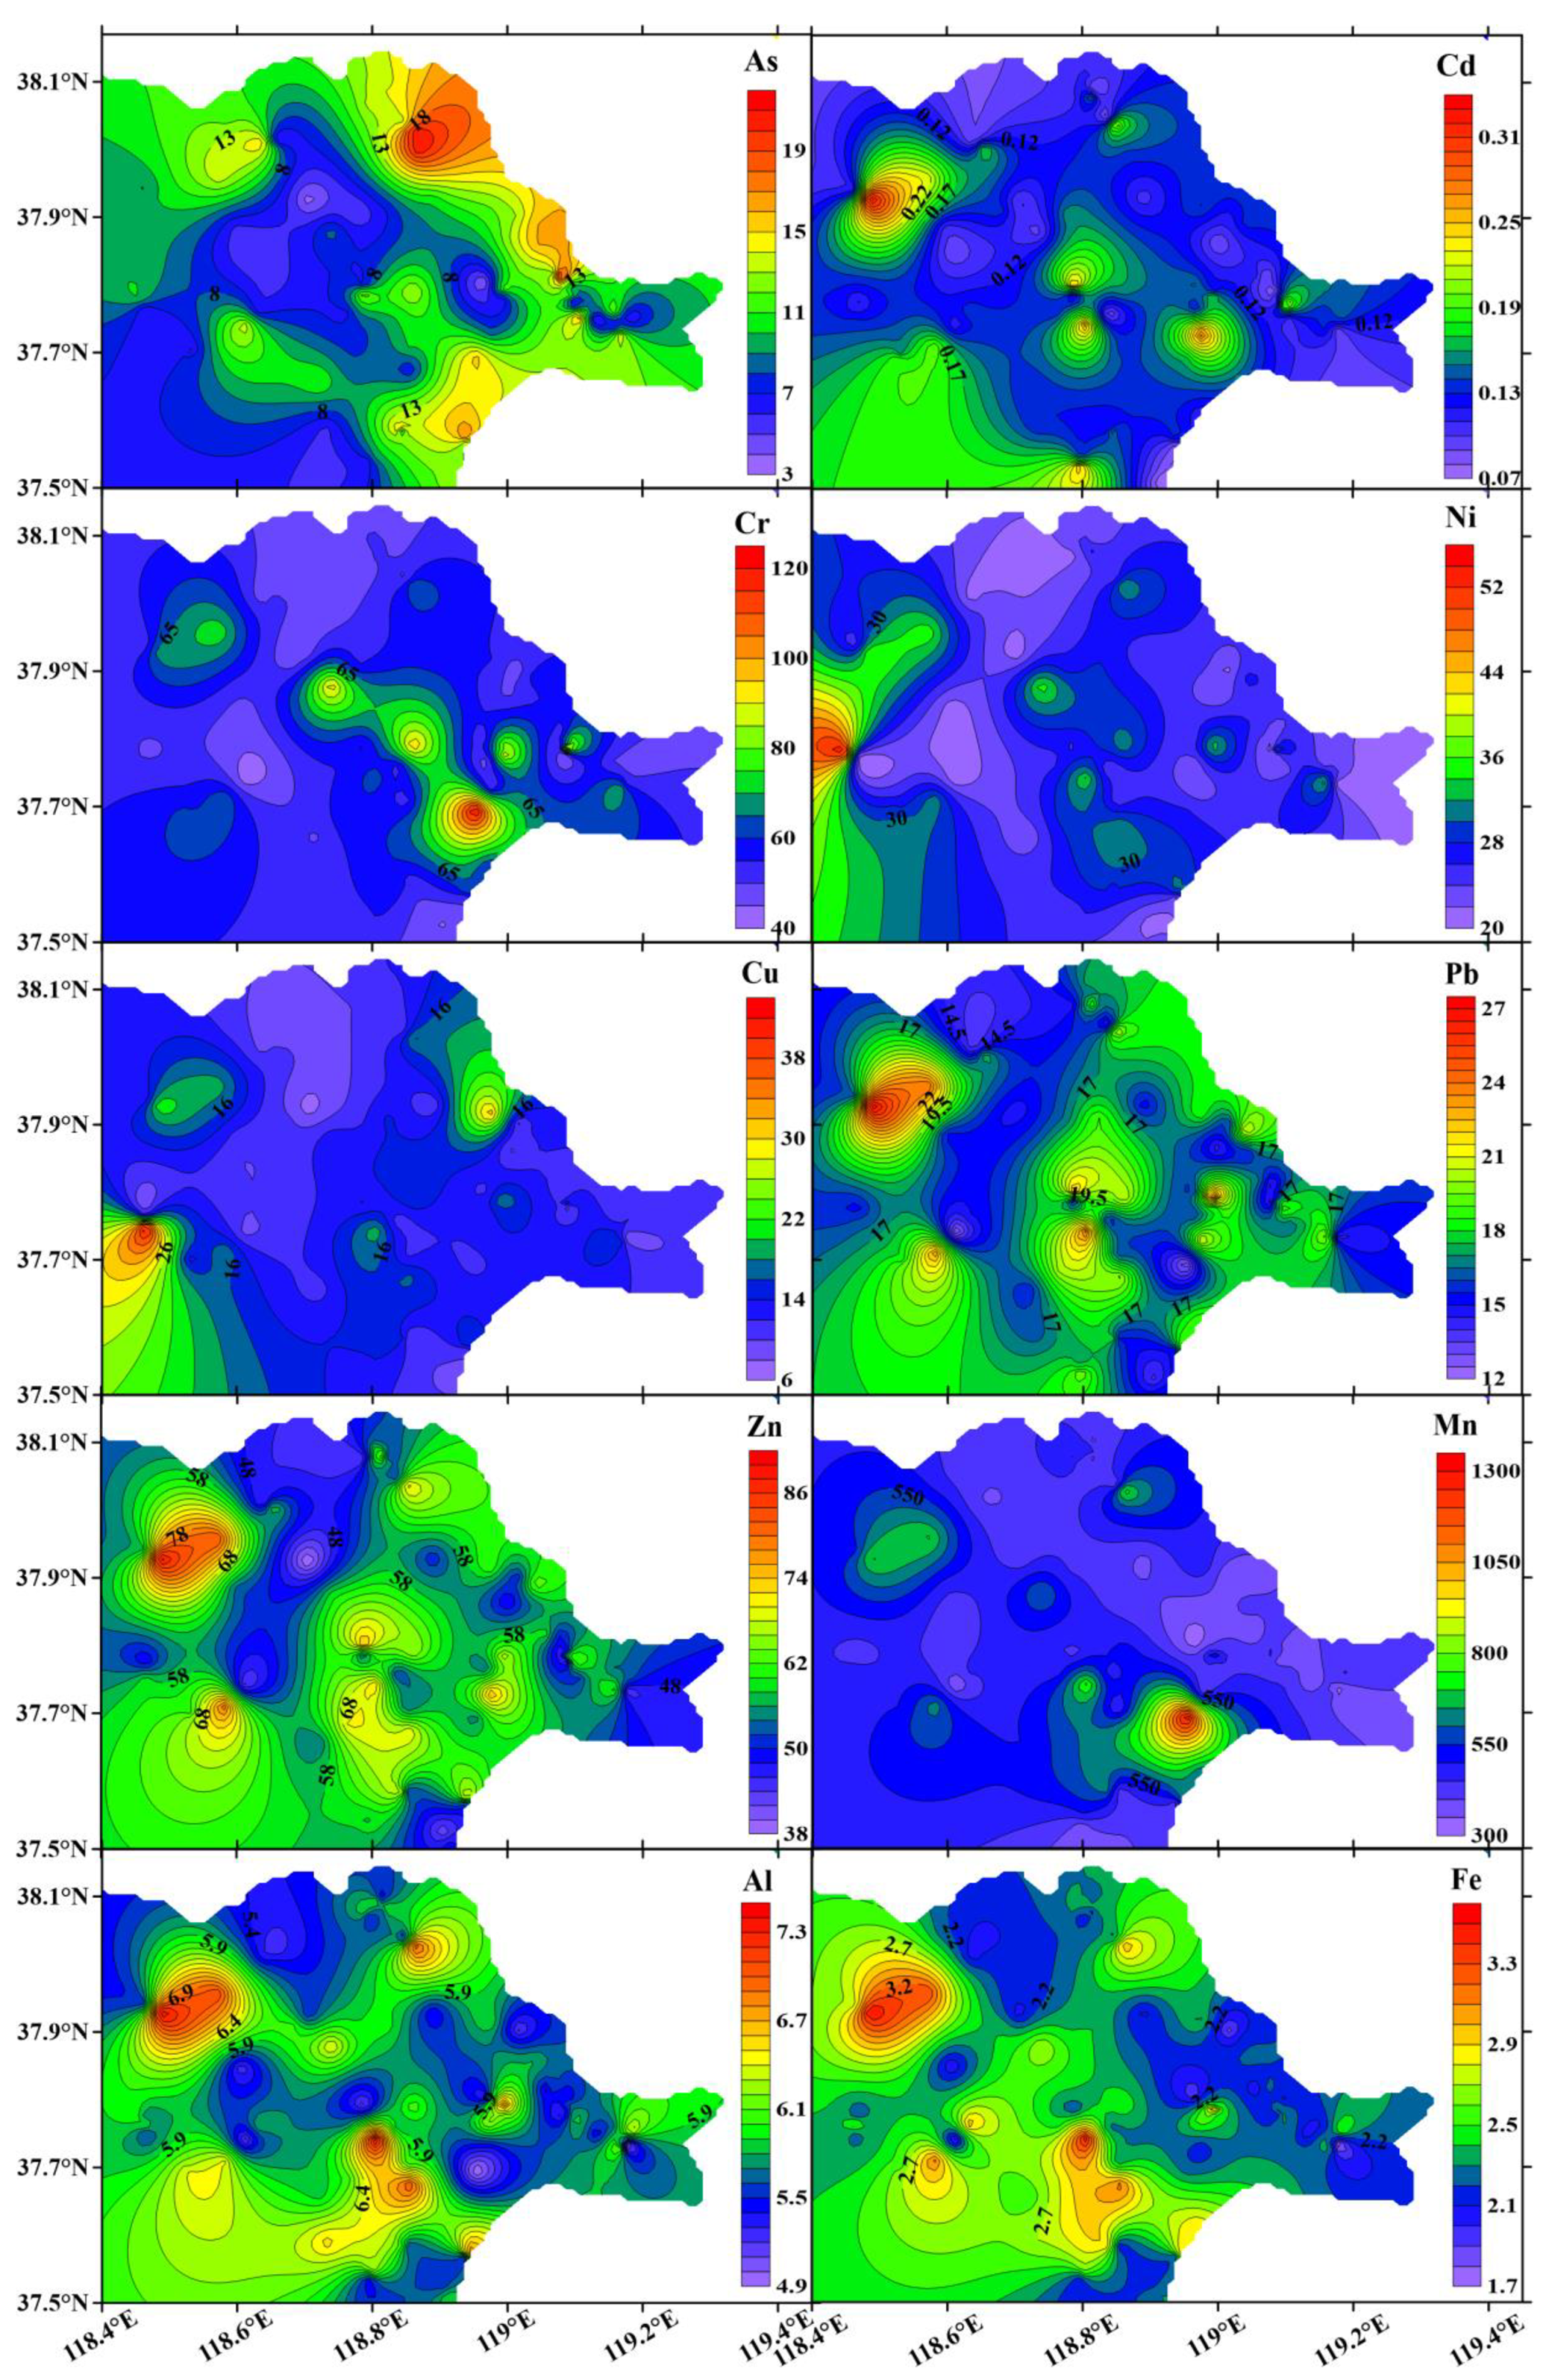
3.2. Metal Distribution in Soil

3.2.1. Metal Concentration in the Yellow River Delta

Descriptive statistics of metal concentration in soils from the Yellow River delta were conducted and are shown in Table 2. The background value of Shandong Province (BD) and the background value of yellow soil in China (BY) [27] were used to analyse the pollution level of metals in the study area.
The concentration of As was 3.44~21.89 mg/kg, and the mean value (10.91 mg/kg) was above those of BD and BY. The value of As in half of the sampling soil was higher than that of BD and BY, which meant that As pollution existed in the Yellow River delta. Among the study area, the concentration of As in 74% of the sampling soil was above the TEL, indicating that there were certain risks. The concentration of Cd was higher than that of BD and BY in over 92% of the sampled soil but was much lower than that of TEL. The mean concentration of Cr (58.55 mg/kg) was higher than that of BY (55.5 mg/kg) and TEL (52.3 mg/kg), which implied a higher risk. The concentration range of Ni was 17.83~54.12 mg/kg. The concentration of Ni was notably higher than that of TEL at all sites and was higher than that of PEL only at site 38. The mean concentration of Cu (12.89 mg/kg) was lower than BD (24 mg/kg), BY (21.4 mg/kg) and TEL (18.7 mg/kg), whereas the concentration of Cu in S27, S35, S40 was higher than BY. The concentration of Pb ranged from 12.29 mg/kg to 27.32 mg/kg, which was totally lower than that of BY. There was almost no Pb pollution except for at site 40. The concentrations of Zn were 37.2~89.69 mg/kg, with a mean value of 55.97 mg/kg, and the Zn concentration in 22 sampling sites was higher than that in BD (63.5 mg/kg). The mean concentrations of Mn, Al, and Fe were 471.01 mg/kg, 5.83% and 2.38%, respectively, which were lower than BD. However, the maximum concentrations of Mn, Al and Fe were higher than those of BD and BY.
The coefficient of variability (CV) was used to analyse the dispersion degree of the data, which could display the differences in the spatial distribution of metals. Normally, if the CV is higher than 0.3, then the spatial distribution of metals is very different. In this study, the CV of As, Cd, and Cu showed that there were large differences at the different sites for these metals. The CV of Al was 0.10, which showed that the spatial difference of Al was not as obvious. Considering that the mean concentration of Al was lower in BD and BY, the parent material was regarded as the main source for Al. The skewness of all the metals was over zero, which means that the metal concentration was similar to a skewed normal distribution. This phenomenon indicated that there were some samples with higher metal concentrations.
The interpolated figures of the metals (Figure 5) showed that the spatial distribution of As was similar to that of salinity. Higher values of As were distributed in the northeastern part of the Yellow River delta. The intrusion of seawater may be the main source of As in the study area. The spatial distributions of Cd, Pb and Zn were similar, and higher values occurred in agricultural areas. The spatial distribution of Cr was similar to that of Mn. Higher Cu and Ni existed around the town area. The spatial distributions of Al and Fe were similar in the whole study area, and the influence of the background value of soil may be the main source for them.

3.2.2. Metal Concentrations under Different Vegetation Types

Higher As concentrations normally occurred in areas with higher salinity, such as Tamarix chinensis, Tamarix chinensis-Suaeda salsa, Suaeda salsa, and mudflat vegetation types, while the concentrations of As in the forest field, upland field, and paddy field vegetation types were low (Figure 6). The distribution of Cd and Ni under different vegetation types was similar, with low concentrations in areas with higher salinity. The mean concentration of Cd in Phragmites australis was highest (0.17 mg/kg) in the study area, followed by the paddy field (0.14 mg/kg). Cd may be introduced by the overlying fresh water in these areas. The concentrations of Cu and Mn (upland field, paddy field, Phragmites australis) were higher under fresh water and lower in areas with high salinity (Tamarix chinensis, Tamarix chinensis-Suaeda salsa, Suaeda salsa, mudflat).
The mean concentrations of Pb and Zn in Phragmites australis were 18.98 mg/kg and 62.46 mg/kg, respectively, which were higher than those of other vegetation types. There was little difference between different vegetation types in the concentration of Al. A higher concentration of Fe occurred in Phragmites australis (mean concentration 2.50%) and paddy field (mean concentration 2.67%), whose roots could promote Fe adsorption in the soil [34,35]. The highest concentration of Cr occurred in Tamarix chinensis-Suaeda salsa, with a mean value of 70.19 mg/kg. The standard deviation in the restored wetland was high for most metals, and the main reason for this was the different times of restoration and the different situations before restoration.

3.3. Risk of the Metals

As shown in Figure 7, the enrichment factors for Pb, Zn and Fe were all lower than 2 and were categorized as deficient to minimal enrichment. Based on the five contamination categories above, As was categorized as deficient to minimal enrichment, except at site 75, which recorded an EF value of 2.42. Enrichment levels of Ni and Cu were deficient to minimal enrichment, except at site 38 for Ni and site 35 for Cu (moderate enrichment). The enrichment for Mn was deficient to minimal enrichment, except at site 17, which was a restored wetland. The Cr enrichment level was generally around deficient to minimal enrichment, except at sites 14, 38, 84, 89, and 93. The enrichment factors for Cd ranged from 0.91 to 4.83, showing large spatial differences. In addition, 43% of sites were found to be moderately enriched with Cd.
The NPI of all samples ranged from 0.90 to 3.11, with an average of 1.35 (Figure 8). The results showed that there were only 14 samples (approximately 13% of all samples) with an NPI ≤ 1, while approximately 79% of all samples had an NPI value between 1 and 2, showing low-level pollution. Approximately 7% of all samples showed moderate-level pollution. The highest pollution level occurred at site 40, with an NPI of 3.11. Overall, these phenomena showed that the surface soil of the Yellow River delta was polluted by various activities.

3.4. Correlation Analysis

The results of the Spearman’s correlation coefficients of metals in surface soil in the study area are summarized in Table 3. Salinity and As were positively correlated with the vegetation types (p < 0.01), while Cd, Zn, Al, and Fe were negatively correlated with the vegetation types. Moreover, salinity was positively correlated with silt and As (p < 0.01) and was negatively correlated with Cd (p < 0.05). The pH had a significant negative correlation with salinity and As at the 0.01 level and a negative correlation with Zn at the 0.05 level. Significant positive correlations were observed among clay, silt and sand (p < 0.05). Clay had a significant positive correlation with all metals except As, and sand had a notable negative correlation with all metals. This phenomenon implied that particle size could deeply affect the metal concentration of surface soil. At the 0.01 level, As was negatively correlated with Cd. Furthermore, it should be noted that Cd, Cr, Ni, Cu, Pb, Zn, Mn, Al, and Fe were significantly positively correlated with each other (p < 0.01).

4. Discussion

4.1. Effect of pH and Salinity

Previous studies showed that pH could determine the distribution of metals [36]. For example, pH had a negative effect on all metals in the wetland soil of the Pearl River delta [3]. In our study, pH had a negative correlation with As and Zn. Soil pH could affect the dynamics of metal dissolution in soil and play a key role in the formation of chemical species to metals [37,38]. With increasing soil pH, the bioavailable Cd concentration linearly decreased, and the bioavailable As concentration exponentially increased [39].
The concentrations of As were higher in the soil with higher salinity and significantly positively correlated with the salinity of the soil in this study (p < 0.01), which was similar to the result of Bai et al. [40]. Feng et al. [41] clarified that with increasing salinity, As would be more easily adsorbed onto sediment. Cd was negatively correlated with salinity in this study, while Cd was significantly positively correlated with soil salinity in the study of Bai et al. [40]. In addition, the concentrations of Cu and Mn were lower in the area affected by salt water and were higher in the area affected by fresh water in this study. Many studies found that increased salinity was an important factor that could accelerate the mobility of Cd, Cu and Mn in soil [42,43] and then decrease the concentrations of metals in soil [44]. In addition, Lutts et al. [45] found that the presence of NaCl reduced the sorption efficiency of Cd in laboratory experiments.
In addition, the elevated amount of carbonate compounds brought by the increasing salinity resulted in a seaward pH increase [12,29]. Thus, the pH and salinity together affected the concentration and availability of metals.

4.2. Effect of Particle Size

Our study confirmed that the concentration of metals in soils increases with decreasing particle size [46]. In our study, metal concentrations had a significant positive correlation with fine particle clay, except As. Normally, fine particles have a high specific area that retains large amounts of metals [14,47]. Relevant studies found that metals tended to be enriched in grain sizes < 63 μm [48]. Acosta et al. [49] reported that the contents of Co, Cr, Cu, Ni and Zn in the 0–75 μm fraction were at least 1.5 times higher than those in bulk samples in the surface soil of Murcia city. Zhao et al. [50] studied 14 typical intertidal zone areas in China and clarified that the concentrations of metal ranked the lowest in sand and the highest in clay. Clay, which has small particle sizes, contributed the most to the quantity of electric charge [51]. In addition to electrical attraction, clay could adsorb metals through inner-sphere complexation reactions [11]. In addition, organic matter, which was correlated with metal concentrations, increased with decreasing soil particle size [52].
There were many factors that affected the particle size in the study area. In our study, the mean proportions of clay were over 16% in the upland field, paddy field, Phragmites australis, and Suaeda salsa, which were totally higher than those in other vegetation types. This confirmed that factors such as agricultural activity, the presence of plant roots, and seawater erosion could make the particle size of soil finer, which would then affect the metal concentrations [53,54].

4.3. Effect of Vegetation Types

The rhizosphere effect is an important way for vegetation to affect metals in soil [35]. For paddy field and Phragmites australis, due to the influence of water, their roots transfer oxygen via the aerenchyma for root respiration in anaerobic soils. The loss of oxygen in roots can stimulate Fe(II) oxidization and the deposition of a reddish Fe plaque that coats the root surface [55,56]. These results could explain why the concentrations of Fe in the paddy field and Phragmites australis soil were much higher than those of other vegetation types in our study. In addition, vegetation could be used to remediate metal pollution in soil through absorption by roots. Previous studies have also found that Suaeda salsa could enrich metals [57,58] and was suitable for the phytoremediation of Cr, Ni, Cu, and Pb [59]. Normally, Suaeda salsa roots contain higher concentrations of metals than its stems and leaves [57]. This is why the concentrations of Cd, Cr, Ni, Cu, Pb and Zn were lower in the Suaeda salsa soil in our study.
Due to the influence of anthropogenic activities, the effects between farmlands and wetlands on metals were totally different. The use of fertilizers and pesticides at the upland field and paddy field sites significantly improved the concentrations of Cu and Zn, acting as essential elements for vegetation. Furthermore, due to the influence of water, there were significant differences between the upland field and paddy field for some metals, such as Mn. The concentrations of Mn were lower in the paddy field, which was consistent with previous studies showing that Mn was easily lost in periodic flooding processes [34]. Moreover, a lower concentration of Mn has been a method to recognize paddy soil [60].
In addition, vegetation types could affect metals by changing the physicochemical properties of soil. For instance, soil organic matter is strongly related to vegetation properties and vegetation coverage [61]. The rhizosphere effect decreased soil pH but increased the concentrations of dissolved organic carbon (DOC) [35]. Metal concentrations were correlated with these physicochemical properties.

5. Conclusions

Saline-alkali soil was the main part in the Yellow River delta. The soil mainly existed as grains having a diameter of 4~63 μm. Metals are more easily absorbed in the fine particles. The enrichment factors indicated that the risk of Cd was highest among the studied metals, with 43% of sites being moderately enriched. The pollution of metals for each site were low-level pollution and moderate-level pollution. The rhizosphere effect caused more Fe to be adsorbed in the paddy field and Phragmites australis soils. The concentrations of Cu and Zn were increased significantly in the upland field and paddy field soils due to the use of fertilizers and pesticides for pursuing high yields. The physicochemical properties and vegetation types interacted with each other, and together, they affected the metal distribution. In future studies, the speciation of metals should be studied deeply to help reveal the mechanism of metal distribution under different vegetation types.

Author Contributions

Y.Y.: Conceptualization, Writing—original draft and editing. Y.L. (Yue Ling): Validation, Resources. Y.L. (Yunzhao Li): Resources, Formal analysis. Z.L., Z.D., B.G.: Investigation, Data curation. Z.W.: Investigation, Data curation. X.W.: Investigation, Data curation. J.Y. (Jisong Yang): Visualization. J.Y. (Junbao Yu): Supervision, Review. All authors have read and agreed to the published version of the manuscript.

Funding

The Key Programme of the National Natural Science Foundation of China (U1806218), the National Science Foundation of China (41871087), and the Project of the Cultivation Plan of Superior Discipline Talent Teams of Universities in Shandong Province: “the Coastal Resources and Environment team for the Blue–Yellow Area”.

Institutional Review Board Statement

Not applicable.

Informed Consent Statement

Not applicable.

Data Availability Statement

The datasets used during the current study are available from the corresponding author on reasonable request.

Acknowledgments

This research was supported by the Key Programme of the National Natural Science Foundation of China (U1806218), the National Science Foundation of China (41871087), and the Project of the Cultivation Plan of Superior Discipline Talent Teams of Universities in Shandong Province: “the Coastal Resources and Environment team for the Blue–Yellow Area”. The authors are grateful for the support. Furthermore, the authors are grateful to the editors and anonymous reviewers for providing suggestions and advice.

Conflicts of Interest

The authors declare no conflict of interest.

References

  1. Fatoba, P.O.; Ogunkunle, C.O.; Folarin, O.O.; Oladele, F.A. Heavy metal pollution and ecological geochemistry of soil impacted by activities of oil industry in the Niger Delta, Nigeria. Environ. Earth Sci. 2016, 75, 1–9. [Google Scholar] [CrossRef]
  2. Yan, X.; Liu, M.; Zhong, J.; Guo, J.; Wu, W. How human activities affect heavy metal contamination of soil and sediment in a long-term reclaimed area of the Liaohe River Delta, North China. Sustainability 2018, 10, 338. [Google Scholar] [CrossRef] [Green Version]
  3. Lu, Q.; Bai, J.; Zhang, G.; Wu, J. Effects of coastal reclamation history on heavy metals in different types of wetland soils in the Pearl River Delta: Levels, sources and ecological risks. J. Clean. Prod. 2020, 272, 122668. [Google Scholar] [CrossRef]
  4. Zhang, G.; Bai, J.; Zhao, Q.; Lu, Q.; Jia, J.; Wen, X. Heavy metals in wetland soils along a wetland-forming chronosequence in the Yellow River Delta of China: Levels, sources and toxic risks. Ecol. Indic. 2016, 69, 331–339. [Google Scholar] [CrossRef] [Green Version]
  5. Miranda, L.S.; Wijesiri, B.; Ayoko, G.A.; Egodawatta, P.; Goonetilleke, A. Water-sediment interactions and mobility of heavy metals in aquatic environments. Water Res. 2021, 202, 117386. [Google Scholar] [CrossRef] [PubMed]
  6. Jiao, W.; Ouyang, W.; Hao, F.; Liu, B.; Wang, F. Geochemical variability of heavy metals in soil after land use conversions in Northeast China and its environmental applications. Environ. Sci. Processes Impacts 2014, 16, 924–931. [Google Scholar] [CrossRef]
  7. Zhang, Y.; Zhang, X.; Bi, Z.; Yu, Y.; Shi, P.; Ren, L.; Shan, Z. The impact of land use changes and erosion process on heavy metal distribution in the hilly area of the Loess Plateau, China. Sci. Total Environ. 2020, 718, 137305. [Google Scholar] [CrossRef] [PubMed]
  8. Düring, R.; Hoss, T.; Gäth, S. Sorption and bioavailability of heavy metals in long-term differently tilled soils amended with organic wastes. Sci. Total Environ. 2003, 313, 227–234. [Google Scholar] [CrossRef]
  9. Romero-Freire, A.; Sierra-Aragón, M.; Ortiz-Bernad, I.; Martín-Peinado, F.J. Toxicity of arsenic in relation to soil properties: Implications to regulatory purposes. J. Soil. Sediments 2014, 14, 968–979. [Google Scholar] [CrossRef]
  10. Yao, X.; Xiao, R.; Ma, Z.; Xie, Y.; Zhang, M.; Yu, F. Distribution and contamination assessment of heavy metals in soils from tidal flat, oil exploitation zone and restored wetland in the Yellow River Estuary. Wetlands 2016, 36, 153–165. [Google Scholar] [CrossRef]
  11. Huang, B.; Yuan, Z.; Li, D.; Zheng, M.; Nie, X.; Liao, Y. Effects of soil particle size on the adsorption, distribution, and migration behaviors of heavy metal (loid) s in soil: A review. Environ. Sci. Processes Impacts 2020, 22, 1596–1615. [Google Scholar] [CrossRef]
  12. De Souza Machado, A.A.; Spencer, K.; Kloas, W.; Toffolon, M.; Zarfl, C. Metal fate and effects in estuaries: A review and conceptual model for better understanding of toxicity. Sci. Total Environ. 2016, 541, 268–281. [Google Scholar] [CrossRef] [PubMed]
  13. Li, Y.; Zhang, H.; Chen, X.; Tu, C.; Luo, Y.; Christie, P. Distribution of heavy metals in soils of the Yellow River Delta: Concentrations in different soil horizons and source identification. J. Soil Sediments 2014, 14, 1158–1168. [Google Scholar] [CrossRef]
  14. Xiao, R.; Zhang, M.; Yao, X.; Ma, Z.; Yu, F.; Bai, J. Heavy metal distribution in different soil aggregate size classes from restored brackish marsh, oil exploitation zone, and tidal mud flat of the yellow river delta. J. Soil. Sediments 2016, 16, 821–830. [Google Scholar] [CrossRef]
  15. State Oceanic Administration of China. Ocean Environmental Quality Communique of China in 2012. 2013. Available online: http://www.coi.gov.cn/gongbao/huanjing/201304/t20130401_26428.html (accessed on 1 January 2022). (In Chinese)
  16. Sun, Z.; Mou, X.; Tong, C.; Wang, C.; Xie, Z.; Song, H.; Sun, W.; Lv, Y. Spatial variations and bioaccumulation of heavy metals in intertidal zone of the Yellow River estuary, China. Catena 2015, 126, 43–52. [Google Scholar] [CrossRef]
  17. Liu, Q.; Liu, G.; Huang, C.; Li, H. Soil physicochemical properties associated with quasi-circular vegetation patches in the Yellow River Delta, China. Geoderma 2019, 337, 202–214. [Google Scholar] [CrossRef]
  18. Cui, B.; Yang, Q.; Zhang, K.; Zhao, X.; You, Z. Responses of saltcedar (Tamarix chinensis) to water table depth and soil salinity in the Yellow River Delta, China. Plant Ecol. 2010, 209, 279–290. [Google Scholar] [CrossRef]
  19. Zhao, Q.; Bai, J.; Wang, X.; Zhang, W.; Huang, Y.; Wang, L.; Gao, Y. Soil organic carbon content and stock in wetlands with different hydrologic conditions in the Yellow River Delta, China. Ecohydrol. Hydrobiol. 2020, 20, 537–547. [Google Scholar] [CrossRef]
  20. Ministry of Agriculture. Soil Testing. (NY/T 1121.16-2006) 2006. Available online: http://www.moa.gov.cn/nybgb/2006/dbq/201806/t20180616_6152330.htm (accessed on 1 January 2022). (In Chinese)
  21. Ministry of Ecological Environment. Soil Environmental Quality. (GB15618-2018) 2018. Available online: http://www.mee.gov.cn/ywgz/fgbz/bz/bzwb/trhj/201807/t20180703_446029.shtml (accessed on 1 January 2022). (In Chinese)
  22. Long, E.R.; Macdonald, D.D.; Smith, S.L.; Calder, F.D. Incidence of adverse biological effects within ranges of chemical concentrations in marine and estuarine sediments. Environ. Manag. 1995, 19, 81–97. [Google Scholar] [CrossRef]
  23. Macdonald, D.D.; Carr, R.S.; Calder, F.D.; Long, E.R.; Ingersoll, C.G. Development and evaluation of sediment quality guidelines for Florida coastal waters. Ecotoxicology 1996, 5, 253–278. [Google Scholar] [CrossRef] [PubMed]
  24. MacDonald, D.D.; Ingersoll, C.G.; Berger, T.A. Development and Evaluation of Consensus-Based Sediment Quality Guidelines for Freshwater Ecosystems. Arch. Environ. Contam. Toxicol. 2000, 39, 20–31. [Google Scholar] [CrossRef]
  25. Chester, R.; Stoner, J.H. Pb in particulates from the lower atmosphere of the eastern Atlantic. Nature 1973, 245, 27–28. [Google Scholar] [CrossRef]
  26. Zoller, W.H.; Gladney, E.S.; Duce, R.A. Atmospheric concentrations and sources of trace metals at the South Pole. Science 1974, 183, 198–200. [Google Scholar] [CrossRef] [PubMed]
  27. China National Environmental Monitoring Center. The Background Concentrations of Soil Elements of China; China Environmental Science Press: Beijing, China, 1990. (In Chinese) [Google Scholar]
  28. Li, Y.; Yu, Y.; Yang, Z.; Shen, Z.; Wang, X.; Cai, Y. A comparison of metal distribution in surface dust and soil among super city, town, and rural area. Environ. Sci. Pollut. R. 2016, 23, 7849–7860. [Google Scholar] [CrossRef] [PubMed]
  29. Githaiga, K.B.; Njuguna, S.M.; Makokha, V.A.; Wang, J.; Gituru, R.W.; Yan, X. Assessment of Cu, Zn, Mn, and Fe enrichment in Mt. Kenya soils: Evidence for atmospheric deposition and contamination. Environ. Monit. Assess. 2020, 192, 1–10. [Google Scholar] [CrossRef]
  30. Sutherland, R.A. Bed sediment-associated trace metals in an urban stream, Oahu, Hawaii. Environ. Geol. 2000, 39, 611–627. [Google Scholar] [CrossRef]
  31. Yang, Z.; Lu, W.; Long, Y.; Bao, X.; Yang, Q. Assessment of heavy metals contamination in urban topsoil from Changchun City, China. J. Geochem. Explor. 2011, 108, 27–38. [Google Scholar] [CrossRef]
  32. Kowalska, J.; Mazurek, R.; Gąsiorek, M.; Setlak, M.; Zaleski, T.; Waroszewski, J. Soil pollution indices conditioned by medieval metallurgical activity—A case study from Krakow (Poland). Environ. Pollut. 2016, 218, 1023–1036. [Google Scholar] [CrossRef]
  33. Memoli, V.; Esposito, F.; Panico, S.C.; De Marco, A.; Barile, R.; Maisto, G. Evaluation of tourism impact on soil metal accumulation through single and integrated indices. Sci. Total Environ. 2019, 682, 685–691. [Google Scholar] [CrossRef]
  34. Huang, Q.; Tang, S.; Huang, X.; Zhang, F.; Yi, Q.; Li, P.; Fu, H. Influence of rice cultivation on the abundance and fractionation of Fe, Mn, Zn, Cu, and Al in acid sulfate paddy soils in the Pearl River Delta. Chem. Geol. 2017, 448, 93–99. [Google Scholar] [CrossRef]
  35. Xiao, S.; Luo, M.; Liu, Y.; Bai, J.; Yang, Y.; Zhai, Z.; Huang, J. Rhizosphere effect and its associated soil-microbe interactions drive iron fraction dynamics in tidal wetland soils. Sci. Total Environ. 2021, 756, 144056. [Google Scholar] [CrossRef]
  36. Zhang, Y.; Chen, J.; Wang, L.; Zhao, Y.; Ou, P.; Shi, W. Establishing a health risk assessment for metal speciation in soil—A case study in an industrial area in China. Ecotox. Environ. Saf. 2018, 166, 488–497. [Google Scholar] [CrossRef]
  37. Król, A.; Mizerna, K.; Bożym, M. An assessment of pH-dependent release and mobility of heavy metals from metallurgical slag. J. Hazard. Mater. 2020, 384, 121502. [Google Scholar] [CrossRef]
  38. Yan, J.; Fischel, M.; Chen, H.; Siebecker, M.G.; Wang, P.; Zhao, F.; Sparks, D.L. Cadmium speciation and release kinetics in a paddy soil as affected by soil amendments and flooding-draining cycle. Environ. Pollut. 2021, 268, 115944. [Google Scholar] [CrossRef]
  39. Shen, B.; Wang, X.; Zhang, Y.; Zhang, M.; Wang, K.; Xie, P.; Ji, H. The optimum pH and Eh for simultaneously minimizing bioavailable cadmium and arsenic contents in soils under the organic fertilizer application. Sci. Total Environ. 2020, 711, 135229. [Google Scholar] [CrossRef]
  40. Bai, J.; Jia, J.; Zhang, G.; Zhao, Q.; Lu, Q.; Cui, B.; Liu, X. Spatial and temporal dynamics of heavy metal pollution and source identification in sediment cores from the short-term flooding riparian wetlands in a Chinese delta. Environ. Pollut. 2016, 219, 379–388. [Google Scholar] [CrossRef] [PubMed] [Green Version]
  41. Feng, C.; Guo, X.; Yin, S.; Tian, C.; Li, Y.; Shen, Z. Heavy metal partitioning of suspended particulate matter–water and sediment–water in the Yangtze Estuary. Chemosphere 2017, 185, 717–725. [Google Scholar] [CrossRef]
  42. Du Laing, G.; De Vos, R.; Vandecasteele, B.; Lesage, E.; Tack, F.M.G.; Verloo, M.G. Effect of salinity on heavy metal mobility and availability in intertidal sediments of the Scheldt estuary. Estuar. Coast. Shelf Sci. 2008, 77, 589–602. [Google Scholar] [CrossRef]
  43. Zhao, S.; Feng, C.; Wang, D.; Liu, Y.; Shen, Z. Salinity increases the mobility of Cd, Cu, Mn, and Pb in the sediments of Yangtze Estuary: Relative role of sediments’ properties and metal speciation. Chemosphere 2013, 91, 977–984. [Google Scholar] [CrossRef]
  44. Liu, J.; Diao, Z.; Xu, X.; Xie, Q. Effects of dissolved oxygen, salinity, nitrogen and phosphorus on the release of heavy metals from coastal sediments. Sci. Total Environ. 2019, 666, 894–901. [Google Scholar] [CrossRef]
  45. Lutts, S.; Qin, P.; Han, R. Salinity influences biosorption of heavy metals by the roots of the halophyte plant species Kosteletzkya pentacarpos. Ecol. Eng. 2016, 95, 682–689. [Google Scholar] [CrossRef]
  46. Zhang, Q.; Zhang, F.; Huang, C. Heavy metal distribution in particle size fractions of floodplain soils from Dongchuan, Yunnan Province, Southwest China. Environ. Monit. Assess. 2021, 193, 1–17. [Google Scholar] [CrossRef] [PubMed]
  47. Park, H.J.; Park, H.J.; Yang, H.I.; Park, S.I.; Lim, S.S.; Kwak, J.H.; Lee, G.T.; Lee, S.M.; Park, M.; Choi, W.J. Sorption of Pb in chemical and particle-size fractions of soils with different physico-chemical properties. J. Soil Sediments 2019, 19, 310–321. [Google Scholar] [CrossRef]
  48. Kang, X.; Song, J.; Yuan, H.; Duan, L.; Li, X.; Li, N.; Liang, X.; Qu, B. Speciation of heavy metals in different grain sizes of Jiaozhou Bay sediments: Bioavailability, ecological risk assessment and source analysis on a centennial timescale. Ecotox. Environ. Saf. 2017, 143, 296–306. [Google Scholar] [CrossRef]
  49. Acosta, J.A.; Cano, A.F.; Arocena, J.M.; Debela, F.; Martínez-Martínez, S. Distribution of metals in soil particle size fractions and its implication to risk assessment of playgrounds in Murcia City (Spain). Geoderma 2009, 149, 101–109. [Google Scholar] [CrossRef]
  50. Zhao, M.; Wang, E.; Xia, P.; Feng, A.; Chi, Y.; Sun, Y. Distribution and pollution assessment of heavy metals in the intertidal zone environments of typical sea areas in China. Mar. Pollut. Bull. 2019, 138, 397–406. [Google Scholar] [CrossRef]
  51. Uddin, M.K. A review on the adsorption of heavy metals by clay minerals, with special focus on the past decade. Chem. Eng. J. 2017, 308, 438–462. [Google Scholar] [CrossRef]
  52. Schjønning, P.; McBride, R.A.; Keller, T.; Obour, P.B. Predicting soil particle density from clay and soil organic matter contents. Geoderma 2017, 286, 83–87. [Google Scholar] [CrossRef]
  53. Zhang, J.; Yang, B.; Chen, T.; Sun, X.; Chen, C. Metal speciation and pollution assessment of Cd and Pb in intertidal sediments of Donghai Island, China. Reg. Stud. Mar. Sci. 2016, 6, 37–48. [Google Scholar] [CrossRef]
  54. Yu, J.; Lv, X.; Bin, M.; Wu, H.; Du, S.; Zhou, M.; Yang, Y.; Han, G. Fractal features of soil particle size distribution in newly formed wetlands in the Yellow River Delta. Sci. Rep. 2015, 5, 10540. [Google Scholar] [CrossRef] [Green Version]
  55. Yang, J.; Tam, N.F.; Ye, Z. Root porosity, radial oxygen loss and iron plaque on roots of wetland plants in relation to zinc tolerance and accumulation. Plant Soil. 2014, 374, 815–828. [Google Scholar] [CrossRef]
  56. Khan, N.; Seshadri, B.; Bolan, N.; Saint, C.P.; Kirkham, M.B.; Chowdhury, S.; Yamaguchi, N.; Lee, D.Y.; Li, G.; Kunhikrishnan, A.; et al. Root Iron Plaque on Wetland Plants as a Dynamic Pool of Nutrients and Contaminants. Adv. Agron. 2016, 138, 1–96. [Google Scholar]
  57. Zhang, S.; Bai, J.; Wang, W.; Huang, L.; Zhang, G.; Wang, D. Heavy metal contents and transfer capacities of Phragmites australis and Suaeda salsa in the Yellow River Delta, China. Phys. Chem. Earth Parts A B C 2018, 104, 3–8. [Google Scholar]
  58. Song, H.; An, J.; Liu, Q.; Jin, X.; Wu, Y.; Wu, X.; Yan, Y. Cd absorption characteristics of Suaeda salsa under different sediment burial and exogenous Cd input conditions in the Yellow River estuary, China. Environ. Sci. Pollut. R. 2021, 28, 62368–62377. [Google Scholar] [CrossRef]
  59. Song, H.; Sun, Z. Temporal variations and bioaccumulation of heavy metals in different Suaeda salsa marshes of the Yellow River estuary, China. Environ. Sci. Pollut. R. 2014, 21, 14174–14187. [Google Scholar]
  60. Cheng, Y.; Yang, L.; Cao, Z.; Ci, E.; Yin, S. Chronosequential changes of selected pedogenic properties in paddy soils as compared with non-paddy soils. Geoderma 2009, 151, 31–41. [Google Scholar]
  61. Liu, S.; Hou, X.; Yang, M.; Cheng, F.; Coxixo, A.; Wu, X.; Zhang, Y. Factors driving the relationships between vegetation and soil properties in the Yellow River Delta, China. Catena 2018, 165, 279–285. [Google Scholar]
Figure 1. The sampling locations in the Yellow River Delta.
Land 11 00523 g001
Figure 2. Spatial distribution of pH and salinity based on the Kriging interpolation method.
Land 11 00523 g002
Figure 3. Distribution of pH and salinity in the surface soil with different vegetation types.
Land 11 00523 g003
Figure 4. Particle size distribution of the surface soil with different vegetation types.
Land 11 00523 g004
Figure 5. Spatial distribution of metals based on the Kriging interpolation method.
Land 11 00523 g005
Figure 6. Concentration of metals in surface soil with different vegetation types. Note: the dots represent the mean values and vertical lines represent the standard deviations (only positive standard deviations).
Land 11 00523 g006
Figure 7. Enrichment Factor of metals in the surface soil of the Yellow River delta.
Land 11 00523 g007
Figure 8. Nemerow Pollution Index of the different sites in the Yellow River delta. Note: horizontal lines are the grades of Nemerow Pollution Index of heavy metal pollution.
Land 11 00523 g008
Table 1. Physicochemical property of surface soil in the Yellow River delta (n = 106).
MinMaxMeanSDCVSkewness
pH7.359.178.060.310.040.34
Salinity (%)0.012.000.320.361.131.90
Clay (%)6.0668.0714.457.860.543.77
Silt (%)29.9384.7576.187.550.10−3.06
Sand (%)1.6641.409.315.980.642.43
Table 2. Descriptive statistics of metal contents in soils from the Yellow River Delta (n = 106).
MinMaxMeanSDCVSkewnessBDBYTELPEL
As (mg/kg)3.4421.8910.914.030.370.199.312.47.2441.6
Cd (mg/kg)0.050.330.130.050.351.880.0840.080.684.21
Cr (mg/kg)42.47123.6158.5514.840.252.156655.552.3160.4
Ni (mg/kg)17.8354.1226.114.850.192.0925.825.315.842.8
Cu (mg/kg)6.8243.0812.894.470.353.852421.418.7108.2
Pb (mg/kg)12.2927.3217.042.680.161.2625.829.430.2112.2
Zn (mg/kg)37.2089.6955.979.720.170.8263.579.2124271
Mn (mg/kg)312.871326.22471.01121.620.263.79644446--
Al (%)4.737.435.830.550.100.666.627.38--
Fe (%)1.633.552.380.350.151.152.723.22--
Note: BD is Background value of Shandong Province; BY is Background value of Yellow Soil in China [27]; TEL is threshold effect level; PEL is probable effect level.
Table 3. Spearman’s correlation matrix for the physicochemical properties and metals.
pHSalinityClaySiltSandAsCdCrNiCuPbZnMnAlFe
Vegetation types0.170.49 **−0.100.18−0.050.42 **−0.39 **0.02−0.13−0.11−0.14−0.31 **−0.12−0.19 *−0.21 *
pH −0.36 **0.09−0.130.10−0.31 **−0.15−0.02−0.09−0.15−0.11−0.23 *0.07−0.05−0.07
Salinity −0.140.27 **−0.180.74 **−0.22 *−0.05−0.06−0.13−0.13−0.10−0.09−0.09−0.05
Clay −0.44 **−0.65 **0.020.34 **0.35 **0.37 **0.47 **0.32 **0.38 **0.52 **0.47 **0.52 **
Silt −0.26 **0.20 *−0.18−0.04−0.050.01−0.11−0.01−0.13−0.15−0.12
Sand −0.27 **−0.21 *−0.38 **−0.40 **−0.54 **−0.27 **−0.44 **−0.52 **−0.48 **−0.53 **
As −0.22 *0.110.070.06−0.080.050.11−0.030.01
Cd 0.28 **0.44 **0.58 **0.68 **0.74 **0.28 **0.33 **0.40 **
Cr 0.84 **0.72 **0.48 **0.56 **0.30 **0.42 **0.38 **
Ni 0.73 **0.56 **0.62 **0.35 **0.58 **0.50 **
Cu 0.74 **0.84 **0.47 **0.60 **0.64 **
Pb 0.83 **0.26 **0.49 **0.49 **
Zn 0.41 **0.49 **0.57 **
Mn 0.67 **0.84 **
Al 0.83 **
Note: * Correlation is significant at the 0.05 level (two-tailed), ** Correlation is significant at the 0.01 level (two-tailed).
Publisher’s Note: MDPI stays neutral with regard to jurisdictional claims in published maps and institutional affiliations.

