Article

Soil Slope Exposure Affects Physico-Chemical and Microbiological Properties in Soil Aggregate Size Fractions

by
Tommaso Bardelli
1,2,3,
Shamina Imran Pathan
1,*,
Paola Arfaioli
1,
Nadia Vignozzi
4,
Sergio Pellegrini
4,
Flavio Fornasier
5,6,
Markus Egli
7,
María Gómez-Brandón
2,8,
Heribert Insam
2,
Giacomo Pietramellara
1 and
Judith Ascher-Jenull
2
1
Dipartimento di Scienze e Tecnologie Agrarie, Alimentari, Ambientali e Forestali (DAGRI), University of Florence, Piazzale delle Cascine 18, 50144 Firenze, Italy
2
Department of Microbiology, University of Innsbruck, Technikerstraße 25d, 6020 Innsbruck, Austria
3
Council for Agricultural Research and Economics (CREA-DC), Via G. Venezian 22, 20133 Milano, Italy
4
Council for Agricultural Research and Economics (CREA-AA), Via Lanciola 12/A, 50125 Firenze, Italy
5
Council for Agricultural Research and Economics (CREA-VE), Via Trieste 23, 34170 Gorizia, Italy
6
Soliomics S.r.l., Via del Cotonificio 129/B, 33100 Udine, Italy
7
Department of Geography, University of Zürich, Winterthurerstrasse 190, 8057 Zürich, Switzerland
8
Grupo de Ecoloxía Animal (GEA), Universidad de Vigo, 36310 Vigo, Spain
*
Author to whom correspondence should be addressed.
Land 2022, 11(5), 750; https://doi.org/10.3390/land11050750
Submission received: 22 April 2022 / Revised: 14 May 2022 / Accepted: 16 May 2022 / Published: 19 May 2022

Abstract

:
Slope exposure is known to affect soil biogeochemical processes in mountainous forest ecosystems, but little attention has yet been paid to its influence at a soil aggregate scale. Therefore, we evaluated the effects of slope exposure (north- vs south-facing slope) on the physico-chemical and microbiological properties of bulk soil and dry-sieved and water-stable aggregate size fractions in both organic (OF) and mineral (AE) horizons in an Italian alpine forest. The changes in organic carbon (OC) and nitrogen (ON) fractions were assessed together with a battery of thirteen enzyme activities involved in the main nutrient cycles. In addition, soil biological properties including microbial biomass (estimated as double-stranded DNA content), and microbial activity (assessed as the ratio between the extra-(exDNA) and intracellular (iDNA) fractions of the total soil DNA pool) were determined. The OF horizon at the north-facing slope was enriched in recalcitrant and insoluble OC and ON fractions and characterized by a lower microbial activity, as indicated by the higher exDNA/iDNA ratio with respect to the south-facing slope. On the contrary, exDNA and iDNA contents, microbial biomass, as well as most of the enzyme activities, reached higher levels at the southern exposure in the AE horizon. These exposure-effects were bulk soil- and aggregate size fraction-specific. Overall, lower values of the chemical and microbiological parameters were found in the water-stable fraction. Our findings indicate that slope exposure (and thus topography), soil horizon, and aggregate size distinctly influence soil OC dynamics in mountain ecosystems.

1. Introduction

In the complex, heterogeneous ecosystem soil, mineral, and organic components contribute to its functionality and fertility [1,2]. An understanding of soil organic matter (SOM) turnover is crucial for determining and quantifying the fluctuations in carbon (C) and nutrient budgets and their consequences on soil biological processes [3,4].
The soil structure is determined by the arrangement and organization of soil primary particles that tend to group themselves into structural units, defined as aggregates [5]. Clay minerals and soil texture are the main features that control the aggregation of particles, control soil aggregate stability, and regulate the nutrient dynamics [6,7]. The size of soil aggregates may also greatly affect the overall SOC stability [8]. These structural soil units comprised of mineral and organic substances are normally classified into micro- (<0.25 mm) and macro- (>0.25 mm) aggregates depending on their size and formation processes [9,10]. It is well-known that macro-aggregates harbor a higher amount of more easily degradable OM (labile C fraction) compared to the micro-aggregates, owing to their structure and higher porosity [11]. On the contrary, SOM within micro-aggregates can be physically and biochemically stabilized and protected from decomposition through its strong association with silt and clay particles [1]. Consequently, SOM turnover is expected to be slower in micro-aggregates as a higher risk of exposure to the biological and physical degradation processes is likely to occur in macro-aggregates [12].
The distribution and abundance of micro- and macro-aggregates in soil affects not only SOC accumulation and turnover, but also the microbiota and its activity. Indeed, soil microorganisms occupy specific niches within soil aggregates, and less diverse and faster-growing microorganisms are primarily found in macro-aggregates [13,14]. Microbial communities are the key drivers of the SOM decomposition process, by producing a wide variety of enzymes indicative of specific nutrient cycles such as carbon (C), nitrogen (N) and phosphorus (P) [15]. The main enzymes involved in the C-cycle, α- and β-glucosidase and cellulase are relevant in the degradation of biopolymers such as cellulose and hemicellulose, releasing low molecular weight sugars as crucial energy sources for microbes [16]. Leucine aminopeptidase is one of the most prominent N-cycle enzymes, hydrolyzing amino acids from polypeptides, facilitating the N-uptake for microbes [17]. Altogether, enzymes react sensitively to the environmental changes, particularly from the macro- to the micro-aggregates [18,19] where their activity is associated to the availability of substrates [18]. Along this line, previous studies [20,21] observed an increase in the activity of C-enzymes such as β-glucosidase, cellulase, and xylosidase in aggregates rich in organic C. Therefore, determining the dynamics of certain enzyme activities in soil aggregates may contribute to better understand the overall SOM turnover [22,23] and indicate how the soil particle size influences the microbial activity.
Slope exposure was shown to affect not only the soil weathering and biogeochemical processes [24,25,26], but also the composition and activity of soil microbial communities [27,28,29,30,31] and soil fauna [27,32] in mountain forest soils. To date, most of our understanding about the functioning of this type of ecosystems has focused on the bulk soil. Consequently, little attention has been paid to the slope exposure-effect at the aggregate scale level. Therefore, the aim of the present study was to evaluate the effects of slope exposure (north- vs south-facing slope) on: (i) different organic carbon (OC) and organic nitrogen (ON) fractions (total, labile, recalcitrant and insoluble fractions); (ii) the concentration of mineral elements, such as iron (Fe), aluminium (Al) and manganese (Mn) bound to OM helping to protect it from decay; and (iii) multiple hydrolytic enzymes activities involved in the main nutrient cycles in the bulk soil, and in the dry-sieved and water-stable aggregate size fractions in both organic (OF) and mineral (AE) horizons. Moreover, (iv) the microbial biomass assessed by double-stranded DNA (dsDNA) content; and (v) the ratio between the extracellular (exDNA) and intracellular (iDNA) fractions of the total soil DNA pool as a proxy of microbial activity were determined. We hypothesized that: (i) the soil microbial biomass and activity are more favored at the south- than at the north-facing slope, and such effects are more pronounced in the OF compared to the AE horizons; (ii) the physico-chemical and microbiological properties are affected along the aggregate size fractions, with lower values in the water-stable compared to the dry-sieved fractions, due to the leaching process of the water fluxes.

2. Materials and Methods

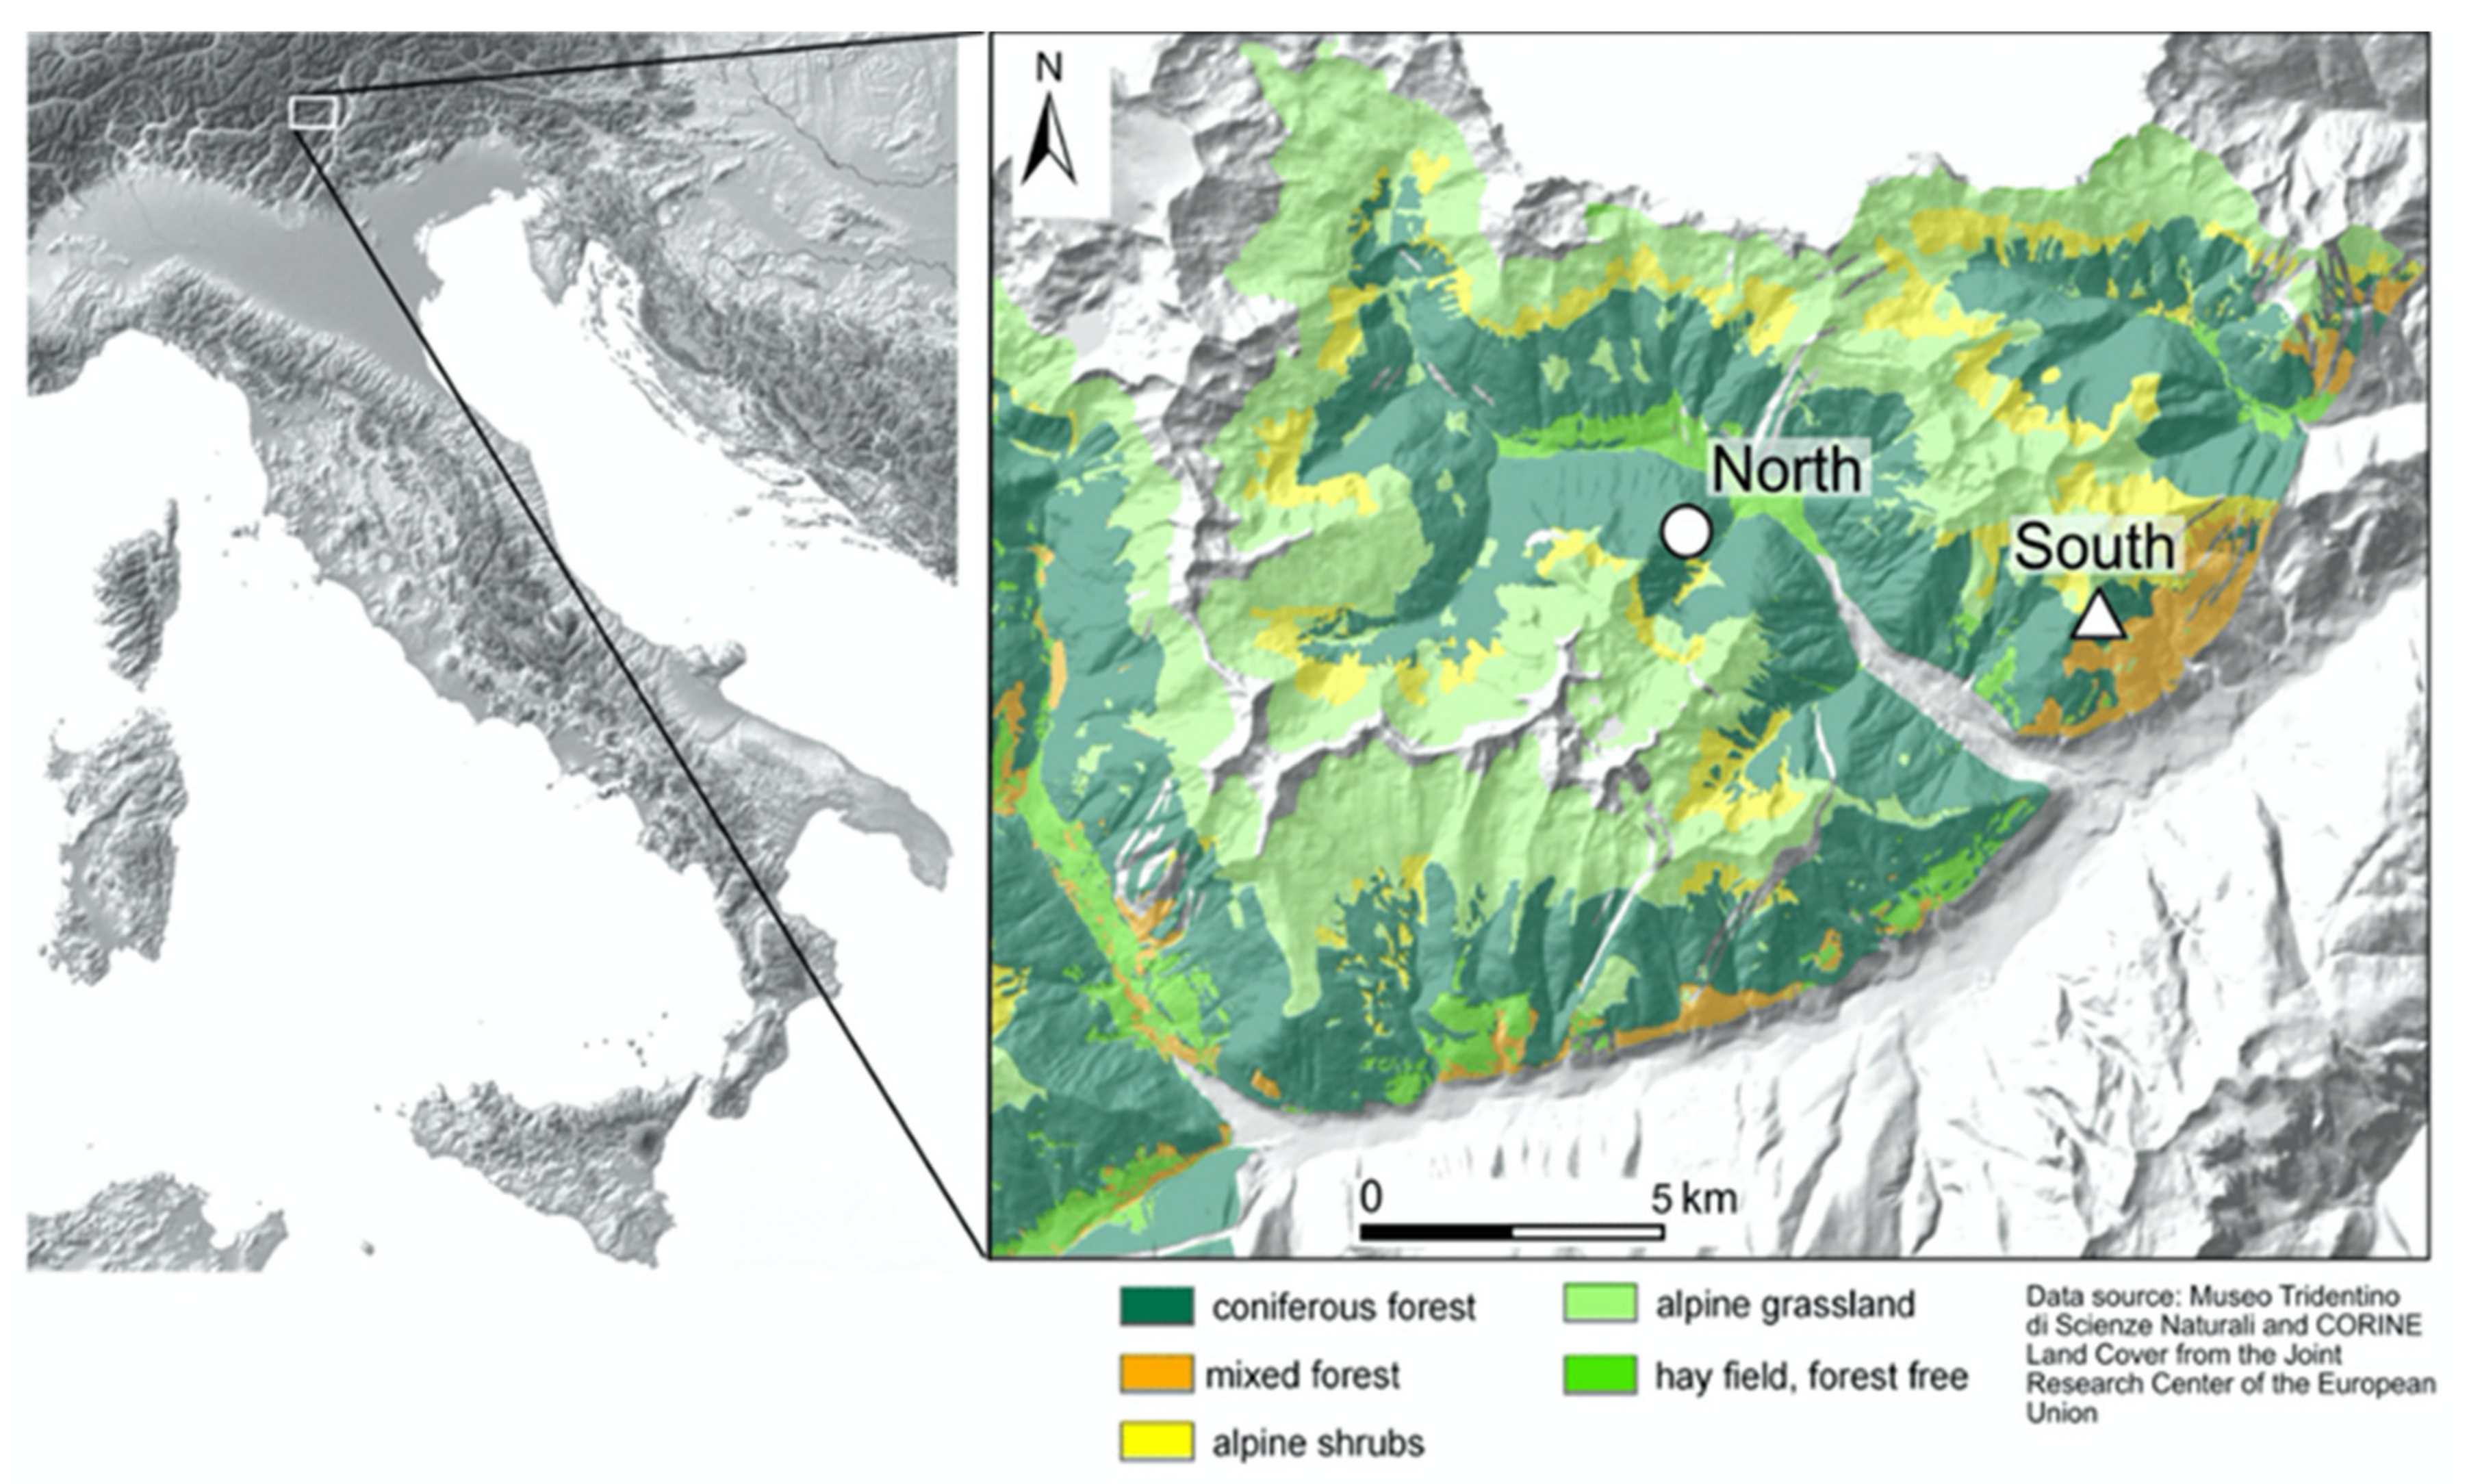
2.1. Study Sites and Experimental Design

Our investigation was carried out at two study sites located in the south Alpine belt in northern Italy (Val di Rabbi, Trentino Alto-Adige; Figure 1) at an altitude of 1620 and 1660 m above sea level (a.s.l.) at the north (N)- and south (S)-facing slope, respectively (N: 46°24′08′′ N; 10°48′46.2′′ E; and S: 46°22′41.4′′ N;10°55′19.3′′ E). Both study sites make part of a well-described climosequence [26,33,34] and were selected owing to their high content of soil inorganic colloids like Fe, Al, and Mn oxides [25].
Both subalpine sites are characterized by a mean annual precipitation of 1060 mm, and a mean annual soil temperature of about 6 °C. The average annual air temperature at the north-facing study site was 3.5 °C whereas at the south-facing study site it was 5.5 °C [35]. The two study sites are on acidic paragneiss or morainic parent material consisting of paragneiss, with Norway spruce (Picea abies (L.) Karst) as the predominant tree species. The soils are classified as Cambisols (north-facing site) and Umbrisols (south-facing site) [33].
At each study site, three plots (5 × 5 m) were set up at 20 m distance from each other along a horizontal transect in which the ground cover was dominated by the grass family Poaceae [32]. For the chemical and microbiological analyses, fifteen soil samples within the organic (OF) and mineral (AE) horizons were randomly taken in each plot, using a hand soil corer (ø 5 cm, length 15 cm) with a flexible lid, capable of specifically sampling the target horizons. The classification of the soil horizons was performed in-situ [32]. All the samples were carefully packed in polyethylene jars, kept in cool boxes, and carefully transported to the laboratory to prevent physical disturbances of the soil aggregates.
For each study site and soil horizon, the bulk soil samples were separated into different aggregate size classes (10.00–4.75 mm, 4.75–2.00 mm, 2.00–1.00 mm, 1.00–0.50 mm, 0.50–0.250 mm, 0.250–0.125 mm, 0.125–0.05 mm, <0.05 mm) by using a vibrating sieve shaker (AS 200, Retsch, Haan, Germany) following the dry-sieving method [36]. The wet-sieving method was subsequently performed on the dry-sieved aggregate size fraction (1.00–0.50 mm) to obtain the respective water-stable aggregate fraction and to determine the aggregates’ stability [37]. Briefly, twenty grams of dry-sieved 1.00–0.50 mm aggregates were directly soaked for 5 min on the top of a nest of sieves with different diameters (0.50, 0.250, 0.125 and 0.05 mm) and immersed in water (fast wetting). The nest of sieves was then vertically shaken in water by an electronic-controlled machine with a stroke of 40 mm per 10 min, at a rate of 30 complete oscillations per minute. The aggregate stability was expressed as the mean weight diameter (MWD) index [38].

2.2. Physico-Chemical Analyses

The bulk soil samples, and both the dry-sieved and water-stable aggregate size fractions (1.00–0.50 mm) were oven-dried at 105 °C for 24 h to determine their dry weight. Soil pH was measured in soil:water extracts (1:10, w/v) using a pH meter (Metrohm 744). Recalcitrant organic carbon (ROC) and nitrogen (RON) together with insoluble organic carbon (IOC) and nitrogen (ION) fractions were quantified by an oxidative method with NaOCl [39]. Briefly, one g of sample was oxidized three times with 6% NaOCl (w/w) and after centrifugation (20 min, 1000 rpm) the residues (ROC and RON) were washed and dried at 40 °C. Through chemical fractionation the IOC and ION fractions were determined on the ROC and RON residues, respectively. Total OC (TOC) and total ON (TON), ROC and RON were measured with a C analyzer (NA1500 CHNS, Carlo Erba, Milano, Italy) after dry combustion. The C/N ratio was calculated from the TOC and TON contents, whereas the labile OC (LOC) was obtained by subtracting the ROC from the TOC content. The contents of Fe, Al, and Mn bound to OM were extracted using 0.1 M sodium pyrophosphate at pH 10 as described by Barral et al. [40]. The extracts were then analyzed by ICP (Optima 2000 Dual Vision OES, Perkin Elmer, Norwalk, CT, USA).

2.3. Microbial Biomass Index (dsDNA Yield)

Total soil DNA was directly extracted from 0.5 g of sample and the amount of crude (not purified) double-stranded DNA (dsDNA) was quantified by using PicoGreen fluorescent dye (Life Technologies, Carlsbad, CA, USA) according to Fornasier et al. [41] and used as a proxy of microbial biomass.

2.4. Sequential DNA Extraction

The sequential extraction and purification of the extracellular (exDNA) and intracellular (iDNA) fractions of the total soil DNA pool was performed according to Ascher et al. [42]. DNA extracts were quantitatively and qualitatively characterized by PicoGreen based fluorometry (Qubit, LifeTechnologies), μL-spectrophotometry (PicoDrop), and agarose-gel electrophoresis [27]. The exDNA/iDNA ratio was calculated as a proxy of microbial activity [32].

2.5. Potential Enzyme Activities

Thirteen hydrolases involved in the main nutrient cycles: (i) C-cycle: α- and β-glucosidases (alfagluc and betagluc), cellulase (cell), xylosidase (xylo), glucuronidase (uroni), nonanoate-esterase (ester_nona); (ii) N-cycle: chitinase (chit) and leucine-aminopeptidase (leu); P-cycle: acid and alkaline phosphomonoesterases (acP and alkP), phosphodiesterase (bisP), pyrophosphate-phosphodiesterase (piroP); S-cycle: arylsulphatase (aryS) were determined in duplicate for the bulk soil samples, and the dry-sieved and water-stable aggregate size fractions (1.00–0.50 mm) by using a heteromolecular exchange procedure [43]. In detail, 0.2 g of soil (fresh weight) were placed into 2-mL microcentrifuge tubes with 1.4 mL of a solution containing 3% lysozyme and glass beads. The tubes were subjected to bead-beating to disrupt microbial cells, using a Retsch 400 beating mill at 30 strokes s−1 for 3 min, followed by centrifugation at 20,000× g for 5 min. The supernatant with the desorbed enzymes was dispensed into 384-well white microplates with a proper buffer to quantify the enzymatic activities using 4-methyl-umbelliferyl (MUF) as fluorescent. The enzyme activities were expressed as nanomoles of 4-methyl-umbelliferyl (MUF) min−1 g−1 dry soil.

2.6. Statistical Analyses

By using the software Statistica 9 (StatSoft, St Tulsa, OK, USA), a factorial analysis of variance (ANOVA) was carried out to evaluate the effects of exposure (north- vs. south-facing slope) and soil horizon (OF vs. AE) on the distribution of the dry-sieved aggregate size classes and MWD index. The same statistical procedure was performed to determine the impact of exposure and different soil fractions (bulk soil, dry-sieved, and water-stable 1.00–0.50 mm aggregates) on the physico-chemical and microbiological parameters in the OF and AE horizons. Prior to ANOVA, Shapiro-Wilks, and Levene’s tests were used to test the normality and the variance homogeneity of the data, respectively. When required, data were log- or square root-transformed to meet the assumptions for ANOVA. Post-hoc comparison of mean values was performed using the Duncan’s multiple range test; statistical differences were accepted at the p < 0.05 level of significance. Associations between the potential enzyme activities and the principal soil chemical and microbiological parameters were determined by Pearson’s correlation. A nonmetric multidimensional scaling (NMDS) based on Bray-Curtis distance was used to map the soil physico-chemical parameters to the shifts in microbial biomass (dsDNA), microbial activity (exDNA/iDNA ratio), and enzyme activities as a function of slope exposure and aggregate size fraction in the two soil horizons. The lengths of the arrows indicate the direction of maximum correlation of the physico-chemical parameters, and the significance level was assessed with a permutation test implemented in the envfit function of vegan library [44]. This multivariate analysis was performed using R 3.1.2 (open-source software).

3. Results

3.1. Overview of the Aggregate Size Fractions as a Function of Exposure and Soil Horizon

In total, eight dry-sieved aggregate size classes were obtained. All these aggregate size classes were significantly affected by slope exposure and varied between soil horizons (OF vs. AE), except for the 1.00–0.50 mm and <0.05 mm fractions (Supplementary Tables S1 and S2). The wet-sieving procedure was performed on the dry-sieved 1.00–0.50 mm fraction because it contained a higher average weight percentage of soil aggregates (Supplementary Table S1). We observed no significant effect of slope exposure on the aggregate stability, assessed by the MWD index, even though it was close to the significance level (F1,8 = 5.13, p = 0.053). However, the aggregate stability was significantly influenced by the soil horizon (F1,8 = 11.75, p = 0.009), with higher values recorded in AE than in OF horizon (Supplementary Table S1).

3.2. Overview of the Physico-Chemical and Microbiological Properties in the of Horizon

An overview of the soil physico-chemical and microbiological parameters of the organic horizon (OF) as a function of exposure (north- vs. south-facing site) and aggregate size fraction (dry-sieved vs water-stable 1.00–0.50 mm) is given in Table 1 and Table 2, and Figure 2. The statistical output is shown in Table 3.
Soil pH was not significantly affected by the slope aspect (Table 3). The highest pH was found in the water-stable fraction at both study sites (Table 1 and Table 3). However, the contents of Fe, Al, and Mn bound to OM varied in terms of exposure, being around three- to four-times higher at the south- than at the north-facing site for the bulk soil and for both the dry-sieved and water-stable aggregate fractions (Table 1 and Table 3). The highest Al-OM content was observed in the bulk soil at the south-facing site (Table 1), whereas no significant differences were observed for Fe- and Mn-OM contents between the bulk soil and the two aggregate fractions (Table 3). Both TOC and ROC contents were about two-times higher at the north- than at the south-facing site (Table 1 and Table 3). The IOC content also reached higher values at north exposure (Table 1), as did RON and ION contents (Table 1 and Table 3). Lower IOC and ION contents were found in the water-stable fractions at both slope exposures (Table 1 and Table 3). In contrast, neither the slope exposure nor the sample type (bulk soil vs aggregate size fractions) influenced the LOC and TON contents (Table 1 and Table 3). The C/N ratio varied in terms of exposure but only in the water-stable fraction, with higher values (about two times higher) at the north- than at the south-facing site (Table 1 and Table 3).
Higher exDNA yields were found at the north- than at the south-facing site for the bulk soil and the dry-sieved size fraction (Figure 2; panel A, Table 3). However, no differences with exposure were detected for the water-stable fraction (Table 3), which generally contained the lowest amounts of exDNA (Figure 2; panel A, Table 3). On the contrary, the amount of iDNA was generally higher at the south exposure (Figure 2; panel B, Table 3), and these exposure-effects were more pronounced for the water-stable fraction (Figure 2; panel B). Consequently, the north-facing site was characterised by a higher exDNA/iDNA ratio in the bulk soil and the two aggregate size fractions (Figure 2; panel C, Table 3). The lowest ratio was detected in the water-stable fraction (Figure 2; panel C, Table 3). Soil microbial biomass (dsDNA) was generally higher at the north- than at the south-facing slope (Figure 2; panel D, Table 3).
Neither the slope aspect nor the sample type (bulk soil vs aggregate size fractions) significantly affected the activities of α-glucosidase and leucine aminopeptidase (Table 2 and Table 3). Other hydrolases such as β-glucosidase, cellulase, xylosidase, glucuronidase, nonanoate-esterase, acid phosphomonoesterase, and arylsulphatase showed the lowest activity in the water-stable fraction at both study sites (Table 2 and Table 3). Moreover, slope exposure largely influenced cellulase activity, but only in the dry-sieved fraction, reaching higher values at the south-facing site (Table 2 and Table 3). Likewise, the phosphodiesterase and pyrophosphate-phosphodiesterase activities had higher levels at the south-compared to the north-facing site, but this exposure-effect was only observed in the bulk soil (Table 2 and Table 3). Slope exposure also had a significant influence on both chitinase and alkaline phosphomonoesterase activities, with higher values at the north-facing slope (Table 2). This exposure-effect was dependent on the sample type. A higher chitinase activity was detected in the bulk soil and the dry-sieved fraction at the north-facing slope; whilst, at this slope, the alkaline phosphomonoesterase activity reached higher values in the water-stable fraction (Table 2 and Table 3).

3.3. Overview of the Physico-Chemical and Microbiological Properties in the AE Horizon

An overview of the soil physico-chemical and microbiological parameters of AE horizon is given in Table 4 and Table 5, and Figure 3. The statistical output is shown in Table 6. As observed for the OF horizon, higher pH values were also found in the water-stable fraction in the mineral horizon (Table 4 and Table 6). Nevertheless, we did not observe any exposure-effect on the concentrations of Fe and Mn bound to OM (Table 4 and Table 6). On the contrary, higher levels of Al bound to OM were recorded at the south- than at the north-facing site, and the lowest concentration was observed in the water-stable fraction at both study sites (Table 4 and Table 6). With respect to the TOC, ROC, and LOC contents, they were about two times higher at the south- than at the north-facing site for the bulk soil and for both the dry-sieved and the water-stable aggregate fractions (Table 4 and Table 6). An IOC content five times higher was found at the south-facing site for the bulk soil, while no significant differences with exposure were recorded for the two aggregate fractions (Table 4 and Table 6). TON and RON contents showed in general higher values at the south-facing site (Table 4 and Table 6); while the ION content was below the detection limit. A higher C/N ratio was found at the north- compared to the south-facing site (Table 4 and Table 6), and the lowest value was recorded in the water-stable fraction (Table 4).
In the AE horizon, higher exDNA yields were detected at the south- than at the north-facing site with regard to the bulk soil and the dry-sieved fraction (Figure 3; panel A, Table 6). The opposite trend was reported for the water-stable fraction (Figure 3; panel A, Table 6). The exposure-effects on iDNA yields were similar to those on exDNA (Figure 3; panel B). However, no significant differences were detected for the exDNA/iDNA ratio between the bulk soil and the aggregate size fractions regardless of the slope exposure (Figure 3; panel C, Table 6). Total dsDNA varied with exposure only for the dry-sieved fraction, being two times higher at the south- than at the north-facing site (Figure 3; panel D, Table 6).
Both α- and β-glucosidase activities were significantly higher at south- than at north exposure (Table 5 and Table 6); such exposure-effects were observed for the bulk soil and the dry-sieved fraction. While the α-glucosidase activity did not vary among samples (Table 6), the lowest β-glucosidase activity was found in the water-stable fraction at both study sites (Table 5 and Table 6). Cellulase and alkaline phosphomonoesterase activities neither varied among samples nor with exposure (Table 5 and Table 6). Xylosidase activity was significantly higher at the south-facing site irrespective of the sample type; and the lowest activity was recorded in the water-stable fraction (Table 5 and Table 6). Overall, the glucuronidase, nonanoate-esterase, phosphodiesterase, and pyrophosphate-phosphodiesterase activities were about two-times higher at the south- than at the north-facing site irrespective of the sample type (Table 5 and Table 6). Nonetheless, the chitinase and leucine aminopeptidase activities reached higher values at the south-facing site for the bulk soil and the dry-sieved fraction (Table 5 and Table 6), whereas similar levels of the two enzyme activities were generally observed in the water-stable fraction at the two slope exposures (Table 5). No significant changes in the activity of acid phosphomonoesterase were observed as a function of slope exposure, however remarkable differences in this activity were found among samples with a lower activity in the water-stable fraction at the south- than at the north-facing slope (Table 5 and Table 6). The arylsulphatase activity was not significantly affected by the slope exposure, while the lowest activity was recorded in the water-stable fraction (Table 5 and Table 6).

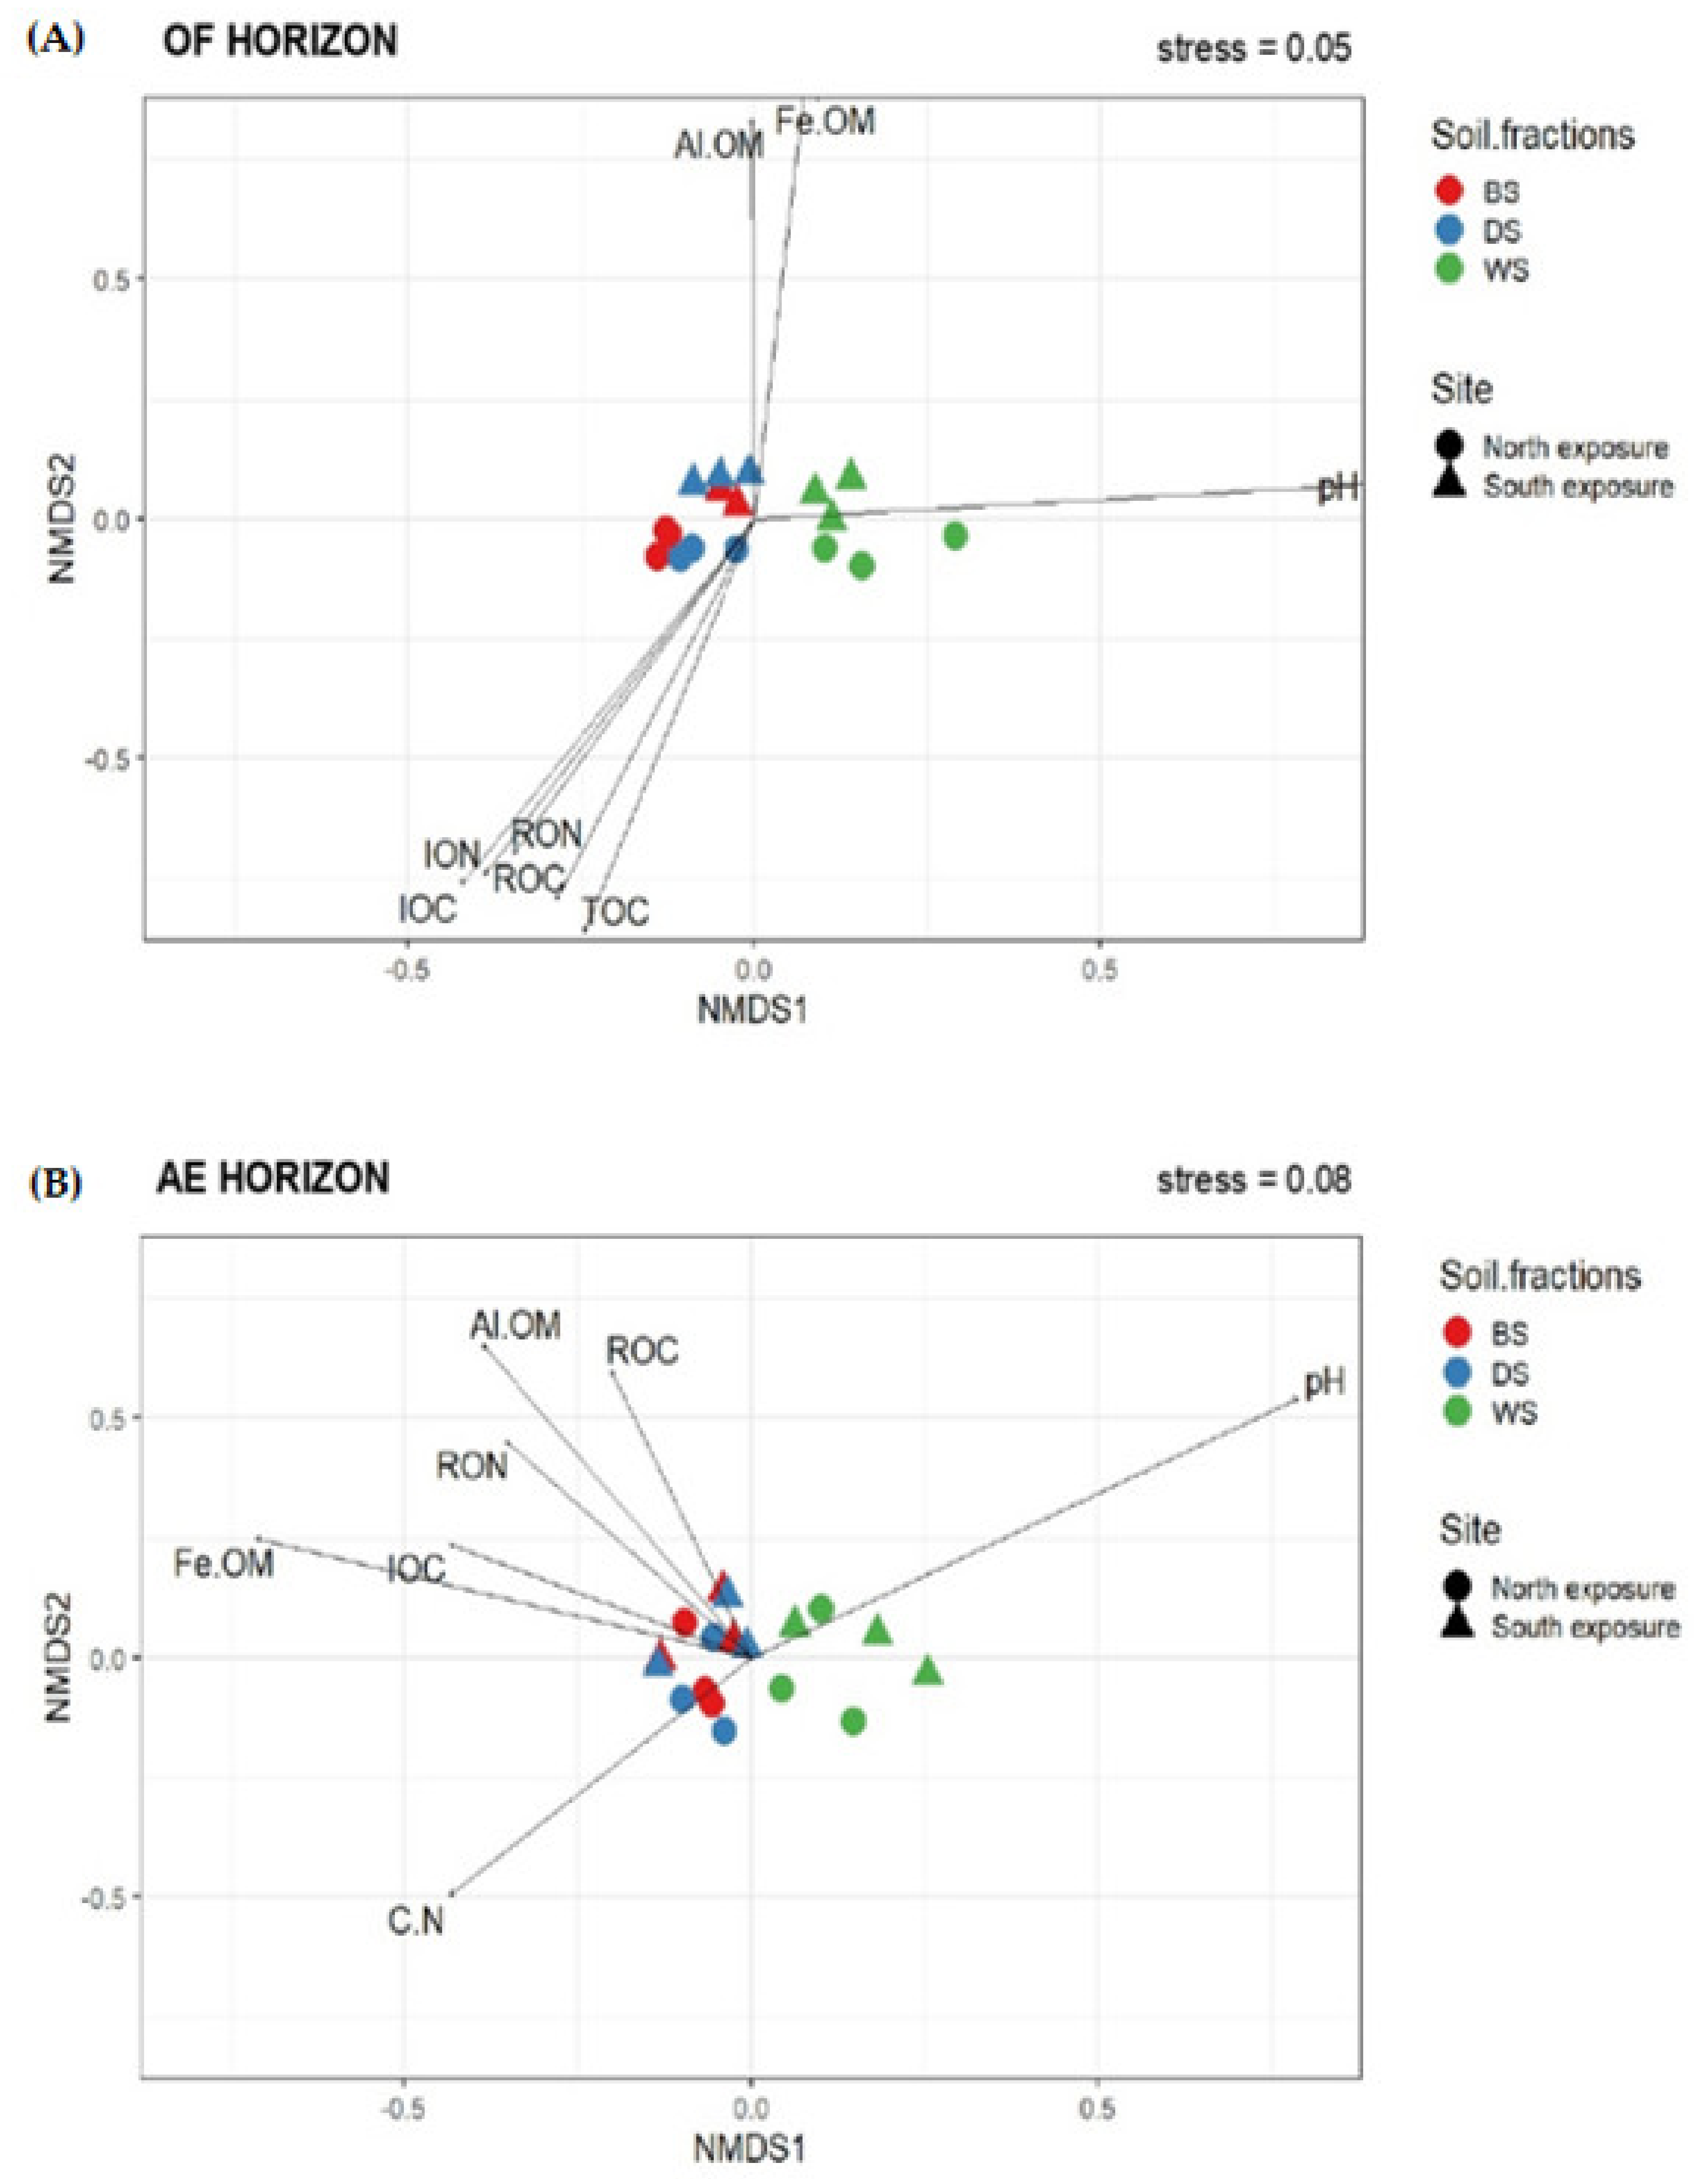
3.4. Non-Metric Multidimensional Scaling (NMDS) Analysis

In the OF horizon and for both slope exposures, the water-stable fractions grouped at the positive side of the first ordination axis and separated from the dry-sieved fraction and the bulk soil samples (Figure 4; panel A). The major physico-chemical parameters responsible for this differentiation were pH (R2 = 0.83, p ≤ 0.001), the OM-bound Fe (R2 = 0.81, p ≤ 0.001) and Al (R2 = 0.69, p ≤ 0.001). A clear separation was also observed as a function of slope exposure for all the samples along the second ordination axis (north: negative side; south: positive side), being TOC (R2 = 0.80, p ≤ 0.001) the most determinant parameter (Figure 4; panel A). In the AE horizon, there was also discrimination among the samples, primarily for the water-stable fraction, along the first ordinate (Figure 4; panel B). Soil pH (R2 = 0.91, p ≤ 0.001), Al-OM (R2 = 0.57, p ≤ 0.01) and Fe-OM (R2 = 0.57, p ≤ 0.01) contributed the most to this clustering. However, there was no differentiation in terms of slope exposure for the bulk soil and the aggregate size fraction along the second ordination axis.

4. Discussion

Previous studies have shown that the MWD index can be used to evaluate soil aggregate stability [45,46,47], with higher values indicating higher stability. In the present study, the aggregate stability assessed by the MWD index was not affected by the slope exposure. However, higher values of the MWD index were found in the AE compared to the OF horizon at both the north- and the south-facing slopes. This could be attributed to the higher presence of mineral colloids in the AE horizon that may act as binding and cementing agents for soil aggregates improving their stability [40]. In line with this, Peng et al. [48] reported that the MWD index was affected by the content of SOC and the presence of inorganic colloids such as Fe- and Al-oxides.
Fe- and Al-oxides are among the major mineral complexes involved in the formation and stabilization processes of aggregates and organic matter [40]. In our study, the content of Fe and Al bound to OM was three to five times higher in the AE horizon with respect to the OF ones at both slopes. In the OF horizon, the Fe-, Al-, and Mn-OM values were higher at the south- than at the north-facing slope in the bulk soil and the two aggregate size fractions. This could be a consequence of the higher chemical weathering intensity at north exposure [49]. Indeed, the authors highlighted that the eluviation and illuviation processes of Fe and Al increased from the south- to the north-facing slope due to the harsher thermal conditions at north exposure that resulted in the leaching of cations from the topsoil to the subsoil horizons. In the AE horizon, the Al-OM content followed a similar trend as for the OF horizon; however, the Fe- and Mn-OM levels did not vary as a function of exposure.
The amount of organic substances allocated in the soil also confers physical protection to the aggregates [45]. In our study, the north-facing slope was characterized by higher contents of recalcitrant and insoluble C and N fractions in the OF horizon when compared to the south-facing one. Our findings are in line with those from Egli et al. [24] who studied the climate effects on the soil weathering in the same study area. These authors observed a more pronounced accumulation of undecomposed and weakly degraded material in the upper soil layer at the northern slope, characterized by cooler, moister, and higher acidic conditions [26,34]. On the contrary, in the AE horizon we observed higher amounts of recalcitrant organic fractions at the south- than at the north-facing site, probably due to less soil acidic conditions observed at this slope. In fact, soil acidity is one of the main drivers of the SOM turnover and controls the distribution of the organic compounds along the soil profile [25].
Although SOM is characterized by distinct molecular compounds with different degrees of water solubility, its composition depends on the properties of the ground cover plant debris [50]. Our experimental plots were dominated by the grass family Poaceae, and this could have affected the composition of the organic C fractions, particularly those more resistant to decomposition, leading to a prevalence of low rather than high molecular compounds. This could have favored the leaching of these compounds with the water fluxes—a phenomenon mimicked by the wet-sieving method—along the soil profile. In addition, through both dry- and wet-sieving, disruptive forces are generated that can break up the structure of the aggregates, leading to an increased loss of organic fractions [51]. Moreover, soil pH was generally one unit higher in the water-stable aggregate fraction compared to the dry-sieved fraction and the bulk soil, which is supported by a reduction of weakly-degraded OM, -COOH, and -OH functional groups for this specific aggregate fraction. In fact, NMDS analysis revealed the soil pH as the most important factor—together with Al bound to OM—for discriminating the water stable aggregate fraction from the other sample types in both OF and AE horizons.
The total DNA pool in a soil is characterized by its intracellular (iDNA) and extracellular fractions (exDNA) that represent the DNA located inside (iDNA) and outside (exDNA) the microbial cell, respectively [52,53,54]. The ratio between these fractions (exDNA/iDNA) can be used as a proxy of microbial activity where the assumption is connected to an increase in lysed/dead cells (exDNA) with respect to the intact ones (iDNA) [55]. In this context, Gómez-Brandón et al. [31] recorded an increase in microbial activity with the progressing deadwood decomposition, while Ceccherini et al. [56] detected a lower microbial activity in deeper soil horizons. In the present study, we found a higher ratio, indicative of a lower microbial activity, in the OF horizon at the north-facing slope for the bulk soil and the aggregate size fractions. Our findings are in line with those from Gómez-Brandón et al. [32] who detected a higher ratio for bulk soil in the same grass plots at the northern slope. The accumulation and/or a lower degradation of exDNA and subsequently its persistence in soil depends, among other factors, on the level of activity of secreted extracellular nucleases and/or nucleases released into the environment upon cell death [52]. In this regard, low temperatures and low pH, together with the presence of salt and clay minerals, can contribute to slowing down exDNA degradation [57,58]. Moreover, these conditions also favored dsDNA-based soil microbial biomass having higher values at the north-facing slope. Supporting the view that C compounds are the principal energy source for microbial activity [59], we found a significant positive correlation between the exDNA content and the organic C and N fractions in the bulk soil (TOC: R = 0.851, p = 0.03; ROC: R = 0.866, p = 0.02; IOC: R = 0.820, p = 0.04; ION: R = 0.848, p = 0.03) and the dry-sieved fraction (TOC: R = 0.874, p = 0.02). Among the multiple features and roles of exDNA [53,58] there is the potential to act as a binding agent, as it constitutes one of the principal components of the extracellular polymeric substances (EPS)—matrix of biofilms, contributing thus to the aggregation (also) of soil particles [60,61]. However, the water-stable fraction showed the lowest exDNA content in both soil horizons, indicating that a large amount of the exDNA present in this fraction was likely lost with the water fluxes as the consequence of the applied wet-sieving method. This result is in line with the susceptibility of exDNA to the water leaching process where it should be supporting the phenomenon of exDNA movement/transport within the soil percolation water along a soil profile [56]. In the OF horizon, the highest amounts of iDNA in the water-stable fraction suggest a strong physical protection by both the microbial cells and the soil aggregates, persisting even after the wet-sieving procedure. Although the exDNA/iDNA ratio did not show a clear exposure-effect in the AE horizon, higher amounts of exDNA and iDNA fractions (sequential extraction) as well as total dsDNA (direct extraction) were recorded at the southern exposure, with generally higher amounts in the bulk soil and the dry-sieved fraction.
The quality and quantity of OM together with the physical protection by soil aggregates may affect the overall nutrient dynamics, and as such, the patterns of the related enzyme activities [20,59]. Nonetheless, in the OF horizon most of the C-, N-, and P-related enzyme activities were not influenced by slope exposure, except for cellulase, chitinase, pyrophosphate-phosphodiesterase, and alkaline phosphomonoesterase activities. These enzymatic activities were exposure-specific (S > N: cellulase and pyrophosphate-phosphodiesterase; N > S: chitinase and alkaline phosphomonoesterase) and dependent on the type of aggregate size fraction. For instance, the alkaline-phosphomonoesterase reached the highest activity in the water-stable fraction at the north-facing slope, probably due to the lower P availability in this aggregate fraction. In fact, an increase in P-acquiring enzyme activities would be expected in case of P deficiency [62]. For all the enzyme activities, except for alkaline-phosphomonoesterase, the lowest values were recorded in the water-stable fraction in the OF horizon and irrespective of the slope exposure. This feature could, as for exDNA, be related to the leaching process (water fluxes) promoted by the wet-sieving method.
In the AE horizon, higher levels of enzymes activities were found at the south-facing slope. Generally, this exposure-effect was more evident in the bulk soil and the dry-sieved aggregate fraction. Indeed, positive correlations between C-enzyme activities and recalcitrant C (α-glucosidase: R = 0.961, p = 0.002; β-glucosidase: R = 0.870, p = 0.024), and between chitinase activity and recalcitrant N (R = 0.908, p = 0.012), were recorded in the dry-sieved fraction (AE horizon; south-facing slope).
Overall, the availability of soil organic substances together with the protective mechanisms exerted by soil aggregates might have affected the general enzyme pattern and activity [20] with distinct consequences on overall SOM/SOC- stability and dynamics in soil.

5. Conclusions

Our findings indicate that slope exposure largely affected the dynamics of organic carbon and microbial processes in the bulk soil and at the aggregate scale in an alpine forest. Our first hypothesis was partially corroborated since higher levels of soil microbial biomass and activity were observed in the OF than the AE horizons, although they were more pronounced at the north- compared to the south-facing slope. In addition, the fine-tuning DNA approach based on the sequential extraction of the exDNA and iDNA fractions combined with the fine-tuning aggregate approach evidenced the role of exDNA as an aggregate stabilizing agent, and its use as a proxy of microbial activity. Furthermore, as expected, a general reduction in the chemical and microbiological parameters was observed in the 1.00–0.50 mm water-stable fraction, confirming our second hypothesis. In particular, the discrimination between the dry-sieved and the wet-sieved water-stable fractions has revealed insights into soil C dynamics in these specific study sites of the Alps. Overall, our results encourage the application of our combined fine-tuning aggregate and DNA approach in different types of soil ecosystems, for in depth-assessment of the complex physico-chemical processes and microbial dynamics reflecting changing environmental conditions.

Supplementary Materials

The following supporting information can be downloaded at: https://www.mdpi.com/article/10.3390/land11050750/s1, Table S1: Overview of the distribution of soil aggregate size classes by using the dry sieving method in the organic (OF) and mineral (AE) horizons at the north- and the south-facing sites. Values are given as means with the standard deviations in brackets. In each column, different letters indicate significant differences (p < 0.05 according to Duncan post-hoc test) as a function of slope exposure and soil horizon for each aggregate size class; Table S2: Supplementary Table S2 Statistical output for each aggregate size class as a function of slope exposure (north- vs. south-facing sites) and soil horizon (organic [OF] vs. mineral [AE]).

Author Contributions

Data curation, T.B., P.A. and J.A.-J.; Formal analysis, T.B., P.A., N.V., S.P. and F.F.; Methodology: T.B., P.A., G.P. and J.A.-J.; Writing—original draft: T.P and J.A.-J.; Writing-review & editing: T.B., S.I.P., P.A., N.V., S.P., F.F., M.E., M.G.-B., H.I., G.P. and J.A.-J.; supervision, G.P., J.A.-J. and H.I.; project administration, G.P. and H.I.; funding acquisition G.P., H.I., J.A.-J. and M.G.-B. All authors have read and agreed to the published version of the manuscript.

Funding

This research is part of the DecAlp D.A.CH. project (Project I989-B16). T. Bardelli has been funded by a PhD grant from the University of Florence (Italy) and by the Doctoral Scholarship Programme for Junior Researchers (2017/3/BIO-1; Vizerektorat für Forschung) at the University of Innsbruck. M. Gómez-Brandón and J. Ascher-Jenull have been funded by the Fonds zur Förderung der wissenschaftlichen Forschung (FWF; I989-B16). María Gómez-Brandón also acknowledges support by the Programa Ramón y Cajal (RYC-2016-21231; Ministerio de Economía y Competitividad).

Data Availability Statement

Not applicable.

Acknowledgments

We would like to thank Ljubica Begovic and Luisa Andrenelli for their help in the laboratory. We acknowledge Paul Fraiz for his help in language editing. We are also indebted to Fabio Angeli of the Ufficio distrettuale forestale—Malé (Trento, Italy) and his team for their support in the field.

Conflicts of Interest

The authors declare no conflict of interest.

References

  1. Six, J.; Paustian, K. Aggregate-associated soil organic matter as an ecosystem property and a measurement tool. Soil Biol. Biochem. 2014, 68, A4–A9. [Google Scholar] [CrossRef]
  2. Kim, H.; Nunan, N.; Dechesne, A.; Juarez, S.; Grundmann, G.L. The spatial distribution of exoenzyme activities across the soil micro-landscape, as measured in micro-and macro-aggregates, and ecosystem processes. Soil Biol. Biochem. 2015, 91, 258–267. [Google Scholar] [CrossRef]
  3. Dinakaran, J.; Mohammad, H.; Archana, M.; Rao, K.S. The chronological advancement of soil organic carbon sequestration research: A review. Proc. Natl. Acad. Sci. India Sect. B Biol. Sci. 2014, 84, 487–504. [Google Scholar] [CrossRef]
  4. Xu, Z.; Yu, G.; Zhang, X.; Ge, J.; He, N.; Wang, Q.; Wang, D. The variations in soil microbial communities, enzyme activities and their relationships with soil organic matter decomposition along the northern slope of Changbai Mountain. Appl. Soil Ecol. 2015, 86, 19–29. [Google Scholar] [CrossRef]
  5. Hillel, D. Fundamentals of Soil Physics; Academic Press: New York, NY, USA, 1980. [Google Scholar]
  6. Sarker, T.C.; Incerti, G.; Spaccini, R.; Piccolo, A.; Mazzoleni, S.; Bonanomi, G. Linking organic matter chemistry with soil aggregate stability: Insight from 13C NMR spectroscopy. Soil Biol. Biochem. 2018, 117, 175–184. [Google Scholar] [CrossRef]
  7. Voltolini, M.; Tas, N.; Wang, S.; Brodie, E.L.; Ajo-Franklin, J.B. Quantitative characterization of soil micro-aggregates: New opportunities from sub-micron resolution synchrotron X-ray microtomography. Geoderma 2017, 305, 382–393. [Google Scholar] [CrossRef] [Green Version]
  8. Zhao, M.; Xue, K.; Wang, F.; Liu, S.; Bai, S.; Sun, B.; Zhou, J.; Yang, Y. Microbial mediation of biogeochemical cycles revealed by simulation of global changes with soil transplant and cropping. ISME J. 2014, 8, 2045–2055. [Google Scholar] [CrossRef] [Green Version]
  9. Six, J.; Bossuyt, H.; Degryze, S.; Denef, K. A history of research on the link between (micro) aggregates, soil biota, and soil organic matter dynamics. Soil Tillage Res. 2004, 79, 7–31. [Google Scholar] [CrossRef]
  10. Alagöz, Z.; Yilmaz, E. Effects of different sources of organic matter on soil aggregate formation and stability: A laboratory study on a Lithic Rhodoxeralf from Turkey. Soil Tillage Res. 2009, 103, 419–424. [Google Scholar] [CrossRef]
  11. Elliott, E.T. Aggregate structure and carbon, nitrogen, and phosphorus in native and cultivated soils. Soil Sci. Soc. Am. J. 1986, 5, 627–633. [Google Scholar] [CrossRef]
  12. Gunina, A.; Kuzyakov, Y. Pathways of litter C by formation of aggregates and SOM density fractions: Implications from 13C natural abundance. Soil Biol. Biochem. 2014, 71, 95–104. [Google Scholar] [CrossRef]
  13. Hemkemeyer, M.; Dohrmann, A.B.; Christensen, B.T.; Tebbe, C.C. Bacterial preferences for specific soil particle size fractions revealed by community analyses. Front. Microbiol. 2018, 9, 149. [Google Scholar] [CrossRef] [PubMed] [Green Version]
  14. Wilpiszeski, R.L.; Aufrecht, J.A.; Retterer, S.T.; Sullivan, M.B.; Graham, D.E.; Pierce, E.M.; Zablocki, O.D.; Palumbo, A.V.; Elias, D.A. Soil aggregate microbial communities: Towards understanding microbiome interactions at biologically relevant scales. Appl. Environ. Microbiol. 2019, 85, e00324-e19. [Google Scholar] [CrossRef] [PubMed] [Green Version]
  15. Qi, R.; Li, J.; Lin, Z.; Li, Z.; Li, Y.; Yang, X.; Zhang, J.; Zhao, B. Temperature effects on soil organic carbon, soil labile organic carbon fractions, and soil enzyme activities under long-term fertilization regimes. Appl. Soil Ecol. 2016, 102, 36–45. [Google Scholar] [CrossRef]
  16. López-Mondéjar, R.; Zühlke, D.; Becher, D.; Riedel, K.; Baldrian, P. Cellulose and hemicellulose decomposition by forest soil bacteria proceeds by the action of structurally variable enzymatic systems. Sci. Rep. 2016, 6, 25279. [Google Scholar] [CrossRef]
  17. Burke, D.J.; Weintraub, M.N.; Hewins, C.R.; Kalisz, S. Relationship between soil enzyme activities, nutrient cycling and soil fungal communities in a northern hardwood forest. Soil Biol. Biochem. 2011, 43, 795–803. [Google Scholar] [CrossRef]
  18. Wang, R.; Dorodnikov, M.; Yang, S.; Zhang, Y.; Filley, T.R.; Turco, R.F.; Jiang, Y. Responses of enzymatic activities within soil aggregates to 9-year nitrogen and water addition in a semi-arid grassland. Soil Biol. Biochem. 2015, 201881, 159–167. [Google Scholar] [CrossRef]
  19. Bhattacharyya, R.; Rabbi, S.M.; Zhang, Y.; Young, I.M.; Jones, A.R.; Dennis, P.G.; Dalal, R.C. Soil organic carbon is significantly associated with the pore geometry, microbial diversity and enzyme activity of the macro-aggregates under different land uses. Sci. Total Environ. 2021, 778, 146286. [Google Scholar] [CrossRef]
  20. Lagomarsino, A.; Grego, S.; Kandeler, E. Soil organic carbon distribution drives microbial activity and functional diversity in particle and aggregate-size fractions. Pedobiologia 2012, 55, 101–110. [Google Scholar] [CrossRef]
  21. Nie, M.; Pendall, E.; Bell, C.; Wallenstein, M.D. Soil aggregate size distribution mediates microbial climate change feedbacks. Soil Biol. Biochem. 2014, 68, 357–365. [Google Scholar] [CrossRef]
  22. Cenini, V.L.; Fornara, D.A.; McMullan, G.; Ternan, N.; Carolan, R.; Crawley, M.J.; Clément, J.C.; Lavorel, S. Linkages between extracellular enzyme activities and the carbon and nitrogen content of grassland soils. Soil Biol. Biochem. 2016, 96, 198–206. [Google Scholar] [CrossRef] [Green Version]
  23. Feng, J.; Turner, B.L.; Wei, K.; Tian, J.; Chen, Z.; Lü, X.; Wang, C.; Chen, L. Divergent composition and turnover of soil organic nitrogen along a climate gradient in arid and semiarid grasslands. Geoderma 2018, 327, 36–44. [Google Scholar] [CrossRef]
  24. Egli, M.; Sartori, G.; Mirabella, A.; Giaccai, D.; Favilli, F. Effect of north and south exposure on organic matter in high Alpine soils. Geoderma 2009, 149, 124–136. [Google Scholar] [CrossRef] [Green Version]
  25. Egli, M.; Hafner, S.; Derungs, C.; Ascher-Jenull, J.; Camin, F.; Sartori, G.; Raab, G.; Paolini, M.; Bontempo, L.; Ziller, L.; et al. Decomposition and stabilisation of Norway spruce needle-derived material in Alpine soils using a 13C-labelling approach in the field. Biogeochemistry 2016, 13, 321–338. [Google Scholar] [CrossRef]
  26. Fravolini, G.; Egli, M.; Derungs, C.; Cherubini, P.; Ascher-Jenull, J.; Gómez-Brandón, M.; Bardelli, T.; Tognetti, R.; Lombardi, F.; Marchetti, M. Soil attributes and microclimate are important drivers of initial deadwood decay in sub-alpine Norway spruce forests. Sci. Total Environ. 2016, 569–570, 1064–1076. [Google Scholar] [CrossRef] [Green Version]
  27. Ascher, J.; Sartori, G.; Graefe, U.; Thornton, B.; Ceccherini, M.T.; Pietramellara, G.; Egli, M. Are humus forms, mesofauna and microflora in subalpine forest soils sensitive to thermal conditions? Biol. Fertil. Soils 2012, 48, 709–725. [Google Scholar] [CrossRef] [Green Version]
  28. Bardelli, T.; Gómez-Brandón, M.; Fornasier, F.; Arfaioli, P.; Egli, M.; Pietramellara, G.; Ceccherini, M.T.; Insam, H.; Ascher-Jenull, J. Chemical and microbiological changes in Norway spruce deadwood during the early stage of decomposition as a function of exposure in an Alpine setting. Arct. Antarct. Alpine Res. 2018, 50, 1–13. [Google Scholar] [CrossRef] [Green Version]
  29. Bardelli, T.; Ascher-Jenull, J.; Burkia-Stocker, E.; Fornasier, F.; Arfaioli, P.; Fravolini, G.; Alves Medeiros, L.R.; Egli, M.; Pietramellara, G.; Insam, H.; et al. Impact of slope exposure on chemical and microbiological properties of Norway spruce deadwood and underlying soil during early stages of decomposition in the Italian Alps. Catena 2018, 167, 110–115. [Google Scholar] [CrossRef]
  30. Probst, M.; Gómez-Brandón, M.; Bardelli, T.; Egli, M.; Insam, H.; Ascher-Jenull, J. Bacterial communities of decaying Norway spruce follow distinct slope exposure and time-dependent trajectories. Environ. Microbiol. 2018, 20, 3657–3670. [Google Scholar] [CrossRef]
  31. Gómez-Brandón, M.; Probst, M.; Siles, J.A.; Peintner, U.; Bardelli, T.; Egli, M.; Insam, H.; Ascher-Jenull, J. Fungal communities and their association with nitrogen-fixing bacteria affect early decomposition of Norway spruce deadwood. Sci. Rep. 2020, 10, 8025. [Google Scholar] [CrossRef]
  32. Gómez-Brandón, M.; Asher-Jenull, J.; Bardelli, T.; Fornasier, F.; Sartori, G.; Pietramellara, G.; Arfaioli, P.; Egli, M.; Beylich, A.; Insam, H.; et al. Ground cover and slope exposure effects on micro- and mesobiota in forest soils. Ecol. Indic. 2017, 80, 174–185. [Google Scholar] [CrossRef]
  33. Egli, M.; Mirabella, A.; Sartori, G.; Zanelli, R.; Bischof, S. Effect of north and south exposure on weathering rates and clay mineral formation in Alpine soils. Catena 2006, 67, 155–174. [Google Scholar] [CrossRef]
  34. Bardelli, T.; Gómez-Brandón, M.; Ascher-Jenull, J.; Fornasier, F.; Arfaioli, P.; Francioli, D.; Egli, M.; Sartori, G.; Insam, H.; Pietramellara, G. Effects of slope exposure on soil physico-chemical and microbiological properties along an altitudinal climosequence in the Italian Alps. Sci. Total Environ. 2017, 575, 1041–1055. [Google Scholar] [CrossRef] [PubMed]
  35. Sboarina, C.; Cescatti, A. Il Clima Del Trentino—Distribuzione Spaziale Delle Principali Variabili Climatiche [The Climate of Trentino—Spatial Distribution of the Principal Climatic Variables]; Report 33; Centro di Ecologia Alpina Monte Bondone: Trento, Italy, 2004; p. 20. [Google Scholar]
  36. Diaz-Zorita, M.; Perfect, E.; Grove, G.H. Disruptive methods for assessing soil structure. Soil Till. Res. 2002, 64, 3–22. [Google Scholar] [CrossRef]
  37. Kemper, W.D.; Rosenau, R.C. Aggregate stability and size distribution. In Methods of Soil Analysis, Part 1. Physical and Mineralogical Methods; Klute, A., Ed.; Society of Agronomy/Soil Science Society of America: Madison, WI, USA, 1986; pp. 425–442. [Google Scholar]
  38. Van Bavel, C.H.M. Mean Weight-Diameter of Soil Aggregates as a Statistical Index of Aggregation. Soil Sci. Soc. Am. J. 1949, 14, 20–23. [Google Scholar] [CrossRef] [Green Version]
  39. Zimmermann, M.; Leifeld, J.; Abiven, S.; Schmidt, M.W.I.; Fuhrer, J. Sodium hypochlorite separates an older soil organic matter fraction than acid hydrolysis. Geoderma 2007, 139, 171–179. [Google Scholar] [CrossRef]
  40. Barral, M.T.; Arias, M.; Guérif, J. Effects of iron and organic matter on the porosity and structural stability of soil aggregates. Soil Tillage Res. 1998, 46, 261–272. [Google Scholar] [CrossRef]
  41. Fornasier, F.; Ascher, J.; Ceccherini, M.T.; Tomat, E.; Pietramellara, G. A simplified rapid, low-cost and versatile DNA-based assessment of soil microbial biomass. Ecol. Indic. 2014, 45, 75–82. [Google Scholar] [CrossRef]
  42. Ascher, J.; Ceccherini, M.T.; Pantani, O.L.; Agnelli, A.; Borgogni, F.; Guerri, G.; Nannipieri, P.; Pietramellara, G. Sequential extraction and genetic fingerprinting of a forest soil metagenome. Appl. Soil Ecol. 2009, 42, 176–181. [Google Scholar] [CrossRef]
  43. Fornasier, F.; Margon, A. Bovine serum albumin and Triton X-100 greatly increase phosphomonoesterases and arylsulphatase extraction yield from soil. Soil. Biol. Biochem. 2007, 39, 2682–2684. [Google Scholar] [CrossRef]
  44. Oksanen, J.; Kindt, R.; Legendre, P.; Simpson, G.; Sólymos, P.; Stevens, M.H.H.; Wagner, H. Vegan: Community Ecology Package—R Package Version 1.15–2 2008. Available online: http://cran.r-project.org/ (accessed on 19 December 2013).
  45. Li, C.; Cao, Z.; Chang, J.; Zhang, Y.; Zhu, G.; Zong, N.; He, Y.; Zhang, J.; He, N. Elevational gradient affect functional fractions of soil organic carbon and aggregates stability in a Tibetan alpine meadow. Catena 2017, 156, 139–148. [Google Scholar] [CrossRef]
  46. Vignozzi, N.; Agnelli, A.E.; Brandi, G.; Gagnarli, E.; Goggioli, D.; Lagomarsino, A.; Pellegrini, S.; Simoncini, S.; Simoni, S.; Valboa, G.; et al. Soil ecosystem functions in a high-density olive orchard managed by different soil conservation practices. Appl. Soil Ecol. 2019, 134, 64–76. [Google Scholar] [CrossRef]
  47. Zhou, M.; Liu, C.; Wang, J.; Meng, Q.; Yuan, Y.; Ma, X.; Liu, X.; Zhu, Y.; Ding, G.; Zhang, J.; et al. Soil aggregates stability and storage of soil organic carbon respond to cropping systems on Black Soils of Northeast China. Sci. Rep. 2020, 10, 265. [Google Scholar] [CrossRef] [PubMed]
  48. Peng, X.; Yan, X.; Zhou, H.; Zhang, Y.Z.; Sun, H. Assessing the Contributions of sesquioxides and soil organic matter to aggregation in an Ultisol under long-term fertilization. Soil Tillage Res. 2015, 146, 89–98. [Google Scholar] [CrossRef]
  49. Egli, M.; Sartori, G.; Mirabella, A.; Giaccai, D.; Favilli, F.; Scherrer, D.; Krebs, R.; Delbos, E. The influence of weathering and organic matter on heavy metals lability in silicatic, Alpine soils. Sci. Total Environ. 2010, 408, 931–946. [Google Scholar] [CrossRef] [Green Version]
  50. Hayes, M.H.; Mylotte, R.; Swift, R.S. Humin: Its composition and importance in soil organic matter. Adv. Agron. 2017, 143, 47–138. [Google Scholar]
  51. Bronick, C.J.; Lal, R. Soil structure and management: A review. Geoderma 2005, 124, 3–22. [Google Scholar] [CrossRef]
  52. Nagler, M.; Podmirseg, S.M.; Griffith, G.W.; Insam, H.; Ascher-Jenull, J. The use of extracellular DNA as a proxy for specific microbial activity. Appl. Microbiol. Biot. 2018, 102, 2885–2898. [Google Scholar] [CrossRef] [Green Version]
  53. Nagler, M.; Insam, H.; Pietramellara, G.; Ascher-Jenull, J. Extracellular DNA in natural environments: Features, relevance and applications. Appl. Microbiol. Biot. 2018, 102, 6343–6356. [Google Scholar] [CrossRef] [Green Version]
  54. Pathan, S.I.; Arfaioli, P.; Ceccherini, M.T.; Ascher-Jenull, J.; Nannipieri, P.; Pietramellara, G. Physical protection of extracellular and intracellular DNA in soil aggregates against simulated natural oxidative processes. Appl Soil Ecol. 2021, 165, 104002. [Google Scholar] [CrossRef]
  55. Bardelli, T.; Rossetti, L.; Zago, M.; Carminati, D.; Giraffa, G.; Tidona, F. Extracellular and intracellular DNA for bacterial profiling of long-ripened cheeses. FEMS Microbiol. Lett. 2020, 367, 13. [Google Scholar] [CrossRef] [PubMed]
  56. Ceccherini, M.T.; Ascher, J.; Agnelli, A.; Borgogni, F.; Pantani, O.L.; Pietramellara, G. Experimental discrimination and molecular characterization of the extracellular soil DNA fraction. Anton Leeuw. Antonie Van Leeuwenhoek 2009, 96, 653–657. [Google Scholar]
  57. Nielsen, K.M.; Johnsen, P.J.; Bensasson, D.; Daffonchio, D. Release and persistence of extracellular DNA in the environment. Environ. Res. 2007, 6, 37–53. [Google Scholar] [CrossRef] [PubMed] [Green Version]
  58. Pietramellara, G.; Ascher, J.; Borgogni, F.; Ceccherini, M.T.; Guerri, G.; Nannipieri, P. Extracellular DNA in soil and sediment: Fate and ecological relevance. Biol. Fertil. Soils 2009, 45, 219–235. [Google Scholar] [CrossRef]
  59. Nannipieri, P.; Giagnoni, L.; Renella, G.; Puglisi, E.; Ceccanti, B.; Masciandaro, G.; Fornasier, F.; Moscatelli, M.C.; Marinari, S. Soil enzymology: Classical and molecular approaches. Biol. Fertil. Soils 2012, 48, 743–762. [Google Scholar] [CrossRef]
  60. Theerthankar, D.; Sharma, P.K.; Busscher, H.J.; van der Mei, H.C.; Krom, B.P. Role of extracellular DNA in initial bacterial adhesion and surface aggregation. Appl. Environ. Microbiol. 2010, 76, 3405–3408. [Google Scholar]
  61. Costa, O.Y.; Raaijmakers, J.M.; Kuramae, E.E. Microbial extracellular polymeric substances: Ecological function and impact on soil aggregation. Front. Microbiol. 2018, 9, 1636. [Google Scholar] [CrossRef] [Green Version]
  62. Fraser, T.D.; Lynch, D.H.; Bent, E.; Entz, M.H.; Dunfield, K.E. Soil bacterial phoD gene abundance and expression in response to applied phosphorus and long-term management. Soil Biol. Biochem. 2015, 88, 137–147. [Google Scholar] [CrossRef]
Figure 1. Overview of the study area (Trentino Alto Adige, Italy) [26,33].
Land 11 00750 g001
Figure 2. Yields of sequentially extracted extracellular DNA (exDNA; (A)), intracellular DNA (iDNA; (B)), and exDNA/iDNA ratio (C), and directly extracted double-stranded total DNA (dsDNA; (D)) in the bulk soil and the aggregate size fractions in the organic (OF) horizon at the north- and the south-facing sites. Values are mean values ± standard deviation. Different letters indicate significant differences (p < 0.05; ANOVA followed by Duncan post-hoc test) regarding the bulk soil (BS), and the dry-sieved (DS) and wet-sieved water-stable (WS) 1.00–0.50 mm fractions.
Land 11 00750 g002
Figure 3. Yields of sequentially extracted extracellular DNA (exDNA; (A)), intracellular DNA (iDNA; (B)), and exDNA/iDNA ratio (C), and directly extracted double-stranded total DNA (dsDNA; (D)) in the bulk soil and the aggregate size fractions in the mineral (AE) horizon at the north- and the south-facing sites. Different letters indicate significant differences (p < 0.05; ANOVA followed by Duncan post-hoc test) regarding the bulk soil (BS), and the dry-sieved (DS) and wet-sieved water-stable (WS) 1.00–0.50 mm fractions.
Land 11 00750 g003
Figure 4. Nonmetric multidimensional scaling (NMDS) ordination to map the physico-chemical parameters to the shifts in organic (OF; (A)) and mineral (AE; (B)) horizons of microbiological properties (microbial biomass—dsDNA; and microbial activity—exDNA/iDNA ratio; and enzyme activities) as a function of slope exposure (north exposure = point symbol; south exposure = triangle symbol), and between the bulk soil (BS) and the different aggregate fractions (dry-sieved [DS] and water-stable [WS] 1.00–0.50 mm fractions).
Land 11 00750 g004
Table 1. Overview of the physico-chemical properties recorded in the bulk soil and the aggregate size fractions (dry-sieved and water-stable 1.00–0.50 mm) in the organic (OF) horizon at the north- and the south-facing sites. Values are means (n = 3) with the standard deviations in brackets. Data are expressed on a dry weight basis. In each column, different letters indicate significant differences (p < 0.05 according to Duncan post-hoc test) among the soil fractions (bulk soil [BS], dry-sieved [DS] and water-stable [WS] 1.00–0.50 mm aggregate size fractions).
ExposureSoil
Fractions
pHFe-OM
(mg g−1 dw)
Al-OM
(mg g−1 dw)
Mn-OM
(mg g−1 dw)
TOC
(%)
ROC
(%)
LOC
(%)
IOC
(%)
TON
(%)
RON
(%)
ION
(%)
C/N
NorthBS5.1 (0.2) c570 (385.2) b461 (88.8) c8.4 (7.3) b41.6 (2.4) a28.8 (3.6) a12.8 (1.8) a27.7 (2.7) a1.2 (0.01) a2.8 (0.5) a0.4 (0.1) a35.5 (2.3) ab
DS5.4 (0.4) b533 (179.6) b453 (56.0) c8.1 (6.6) b41.0 (2.3) a24.3 (8.1) ab16.7 (5.8) a26.9 (1.7) ab1.4 (0.1) a2.5 (0.9) a0.4 (0.01) a28.6 (0.8) bc
WS6.4 (0.4) a553 (371.8) b561 (238.7) c17.4 (11.4) ab37.9 (7.2) ab22.9 (6.8) ab14.9 (1.9) a19.6 (6.3) bc1.0 (0.3) a2.3 (0.7) a0.3 (0.1) ab40.4 (8.9) a
SouthBS5.2 (0.3) c1583 (119.2) a2538 (629.1) a23.4 (6.6) a29.4 (3.1) bc13.5 (2.4) bc16.0 (1.6) a18.2 (2.5) c0.9 (0.3) a1.6 (0.5) ab0.2 (0.1) b35.1 (8.1) ab
DS5.6 (0.3) b1313 (65.4) a1739 (470.4) b26.1 (6.0) a29.7 (5.2) bc17.0 (7.8) bc12.7 (3.0) a17.7 (6.3) c1.1 (0.3) a2.1 (1.0) ab0.3 (0.1) ab27.1 (3.4) bc
WS6.5 (0.2) a1445 (204.6) a1562 (249.0) b16.2 (7.6) ab25.7 (7.9) c8.2 (4.9) c17.5 (3.7) a5.7 (3.4) d1.1 (0.3) a0.8 (0.5) b0.01 (0.1) c22.9 (2.3) c
TOC (total organic carbon), ROC (recalcitrant organic carbon), LOC (labile organic carbon), IOC (insoluble organic carbon), TON (total organic nitrogen), RON (recalcitrant organic nitrogen), ION (insoluble organic nitrogen).
Table 2. Overview of the potential enzymatic activities observed in the bulk soil and the aggregate size fractions (dry-sieved and water-stable 1.00–0.50 mm) in the organic (OF) horizon at the north- and the south-facing sites. Values are means (n = 3) with the standard deviations in brackets. Data are expressed as nanomoles of MUF h−1 g−1 soil dry weight. In each column, different letters indicate significant differences (p < 0.05 according to Duncan post-hoc test) among the soil fractions (bulk soil [BS], dry-sieved [DS] and water-stable [WS] 1.00–0.50 mm aggregate size fractions).
ExposureSoil
Fractions
AlfaglucBetaglucCellxylouroniester_nonachitleuacPalkPbisPpiroParyS
NorthBS18.2 (4.8) a281.4 (158.2) a61.8 (42.8) b40.6 (14.5) a23.8 (7.3) ab3053 (662.6) ab231.3 (88.4) a339 (172.7) a1351 (68.8) a255 (70.5) c55.9 (15.2) c11.1 (5.1) b192 (26.7) ab
DS24.5 (4.9) a179.5 (35.6) ab54.5 (40.1) b35.9 (16.6) a23.2 (4.9) abc4086 (534.0) a291.2 (27.4) a542 (224.1) a1437 (204.0) a410 (260.4) bc82.0 (40.1) bc18.6 (15.8) b237 (64.3) a
WS26.8 (8.7) a72.3 (2.6) c12.4 (4.4) b22.2 (5.2) ab12.3 (4.7) bc2107 (53.9) b110.9 (43.4) b367 (191.1) a294 (106.2) b2102 (1763.0) a233 (135.7) a84.9 (51.3) a77.4 (31.0) c
SouthBS18.4 (7.1) a261.3 (133.3) ab70.4 (46.2) b36.5 (14.2) a22.0 (8.6) abc3590 (1730.0) ab111.6 (63.8) b403 (145.6) a2977 (1642.2) a462 (139.5) bc159 (59.0) ab60.3 (14.3) a195 (50.4) ab
DS21.0 (1.7) a265.1 (49.8) ab134.4 (44.7) a35.7 (8.2) a30.5 (6.9) a5021 (2649.7) a124.8 (55.2) b406 (100.4) a2209 (1389.8) a467 (49.5) bc110 (19.5) abc54.0 (34.5) a205 (32.1) ab
WS21.0 (6.9) a99.2 (11.1) bc19.6 (2.1) b12.8 (1.9) b11.8 (1.6) c2070 (438.8) b78.0 (15.3) b314 (129.1) a340 (59.3) b592 (58.1) b116 (30.6) abc73.3 (53.7) a125 (42.6) bc
alfagluc (α-glucosidase), betagluc (β-glucosidase), cell (cellulase), xylo (xylosidase), uroni (glucuronidase), ester_nona (nonanoate-esterase), chit (chitinase), leu (leucine-aminopeptidase), acP (acid phosphomonoesterase), alkP (alkaline phosphomonoesterase), bisp (phosphodiesterase), piroP (pyrophosphatase-phosphodiesterase), aryS (arylsulphatase).
Table 3. Statistical output of the physico-chemical and microbiological parameters as a function of slope exposure (north- vs. south-facing sites) and between bulk soil (BS) and aggregate sizes fractions (dry-sieved [DS] and water-stable [WS] 1.00–0.50 mm) in the organic (OF) horizon.
Slope Exposure (North vs. South)Sample Type (BS vs. DS vs. WS)Interaction
OFFpFOFFp
pH1.90ns47.81pH1.90ns
Fe-OM57.19***0.56Fe-OM57.19***
Al-OM76.50***2.85Al-OM76.50***
Mn-OM9.39**0.04Mn-OM9.39**
TOC23.60***0.99TOC23.60***
ROC19.56***1.61ROC19.56***
LOC0.15ns0.53LOC0.15ns
IOC29.66***11.12IOC29.66***
TON1.83ns1.76TON1.83ns
RON9.27*2.22RON9.27*
ION27.44***8.36ION27.44***
C/N6.69*2.92C/N6.69*
exDNA51.82***74.77exDNA51.82***
iDNA8.43*7.11iDNA8.43*
exDNA/iDNA60.99***17.69exDNA/iDNA60.99***
dsDNA11.95**1.83dsDNA11.95**
alfagluc1.30ns1.68alfagluc1.30ns
betagluc0.01ns8.61betagluc0.01ns
cell4.9*10.12cell4.9*
xylo0.70ns6.02xylo0.70ns
uroni0.34ns9.49uroni0.34ns
ester_nona0.14ns7.20ester_nona0.14ns
chit25.7***10.2chit25.7***
leu0.34ns1.26leu0.34ns
acP4.32ns39.38acP4.32ns
alkP0.11ns10.48alkP0.11ns
bisP2.01ns3.72bisP2.01ns
piroP10.29**5.32piroP10.29**
aryS0.09ns12.69aryS0.09ns
pH (pH H2O), Fe-OM (iron bound to OM), Al-OM (aluminium bound to OM), Mn-OM (manganese bound to OM), TOC (total OC), ROC (recalcitrant OC), LOC (labile OC), IOC (insoluble OC), TON (total ON), RON (recalcitrant ON), ION (insoluble ON), exDNA (extracellular DNA), iDNA (intracellular DNA), exDNA/iDNA ratio, dsDNA (double stranded DNA), alfagluc (α-glucosidase), betagluc (β-glucosidase), cell (cellulase), xylo (xylosidase), uroni (glucuronidase), ester_nona (nonanoate-esterase), chit (chitinase), leu (leucine-aminopeptidase), acP (acid phosphomonoesterase), alkP (alkaline phosphomonoesterase), bisp (phosphodiesterase), piroP (pyrophosphatase-phosphodiesterase), aryS (arylsulphatase). F (Fisher test): ratio of two variances. p-value: ns (not significant); * p < 0.05; ** p < 0.01; *** p < 0.001.
Table 4. Overview of the physico-chemical properties observed in the bulk soil and the aggregate size fractions (dry-sieved and water-stable 1.00–0.50 mm) in the mineral (AE) horizon at the north- and the south-facing sites. Values are means (n = 3) with the standard deviations in brackets. Data are expressed on a dry weight basis. In each column, different letters indicate significant differences (p < 0.05 according to Duncan post-hoc test) among the soil fractions (bulk soil [BS], dry-sieved [DS] and water-stable [WS] 1.00–0.50 mm aggregate size fractions).
ExposureSoil
Fractions
pHFe-OM
(mg g−1 dw)
Al-OM
(mg g−1 dw)
Mn-OM
(mg g−1 dw)
TOC
(%)
ROC
(%)
LOC
(%)
IOC
(%)
TON
(%)
RON
(%)
ION
(%)
C/N
NorthBS5.1 (0.2) c5293 (1508.3) a3616 (780.1) ab20.1 (11.5) a5.6 (1.2) b1.7 (0.4) c3.8 (0.8) c1.0 (0.2) b0.2 (0.1) b0.4 (0.1) abudl44.5 (21.8) ab
DS4.9 (0.5) c5180 (884.6) a2801 (526.8) bc17.6 (9.8) a7.2 (2.1) b1.6 (0.4) c5.5 (1.7) abc2.5 (2.2) b0.1 (0.1) b0.2 (0.1) budl55.8 (10.5) a
WS5.8 (0.4) b4320 (937.8) a2607 (671.1) c18.5 (9.8) a5.8 (2.1) b1.3 (0.2) c4.5 (1.9) bc0.7 (0.2) b0.3 (0.1) ab0.2 (0.1) budl19.3 (3.1) c
SouthBS5.3 (0.5) bc4608 (1439.7) a4040 (259.4) a12.6 (7.7) a12.9 (3.3) a4.4 (0.9) a8.5 (2.5) ab4.8 (0.6) a0.5 (0.1) a0.6 (0.3) audl28.6 (2.6) bc
DS5.3 (0.4) bc5432 (597.2) a4054 (188.6) a10.3 (4.8) a12.5 (3.5) a2.9 (0.7) b9.6 (3.3) a2.1 (0.1) b0.4 (0.2) a0.4 (0.01) abudl35.8 (6.1) bc
WS6.8 (0.1) a3206 (1076.1) a3024 (191.3) bc9.6 (4.2) a8.6 (2.3) ab2.0 (0.2) bc6.6 (2.2) abc1.1 (0.1) b0.4 (0.1) a0.2 (0.1) budl23.2 (2.2) c
TOC (total OC), ROC (recalcitrant OC), LOC (labile OC), IOC (insoluble OC), TON (total ON), RON (recalcitrant ON), ION (insoluble ON); udl (under detection limit).
Table 5. Overview of the potential enzymatic activities observed in the bulk soil and the aggregate size fractions (dry-sieved and water-stable 1.00–0.50 mm) in the mineral (AE) horizon at the north- and the south-facing sites. Values are means (n = 3) with the standard deviations in brackets. Data are expressed as nanomoles of MUF h−1 g−1 soil dry weight. In each column, different letters indicate significant differences (p < 0.05 according to Duncan post-hoc test) among the soil fractions (bulk soil [BS], dry-sieved [DS], and water-stable [WS] 1.00–0.50 mm aggregate size fractions).
ExposureSoil
fractions
AlfaglucBetaglucCellxylouroniester_nonachitleuacPalkPbisPpiroParyS
NorthBS3.2 (1.2) a27.5 (7.4) b3.9 (3.0) a4.5 (1.0) bc4.5 (3.8) ab346 (103.0) ab19.9 (5.5) bc49.7 (19.3) b622 (495.8) ab48.9 (47.7) a32.9 (27.2) ab11.5 (8.7) ab310 (166.1) ab
DS3.6 (2.0) a27.6 (9.9) b2.1 (0.5) a4.6 (1.7) bc4.2 (2.8) ab358 (96.4) ab21.8 (4.5) bc52.5 (35.2) b575 (554.5) ab47.6 (45.5) a31.0 (27.9) b13.1 (8.3) ab272 (180.6) ab
WS4.3 (2.7) a15.1 (3.4) b1.5 (1.3) a2.4 (0.8) c4.1 (2.5) ab478 (132.3) ab15.5 (3.9) bc97.6 (42.8) ab195 (111.0) bc115 (108.8) a40.3 (39.6) ab13.5 (11.2) ab162 (76.4) ab
SouthBS7.8 (3.8) a60.8 (33.7) ab10.6 (7.7) a11.6 (4.9) a11.6 (5.5) a867 (617.7) a38.0 (11.4) ab165.2 (79.1) a1498 (400.4) a208 (187.8) a110 (55.8) a75.2 (64.3) a386 (186.3) a
DS7.2 (2.6) a46.6 (10.4) ab7.6 (3.5) a9.1 (2.6) ab10.1 (3.0) ab781 (323.3) a50.4 (12.0) a140.1 (65.6) ab1280 (503.7) a151 (131.2) a97.9 (41.2) a63.0 (55.7) a321 (145.4) ab
WS4.0 (0.4) a14.8 (15.1) b1.9 (2.3) a2.6 (3.2) c4.0 (4.7) b430 (217.6) a13.1 (9.6) c90.2 (52.2) ab99.6 (90.3) c106 (62.4) a43.5 (15.2) ab9.1 (5.3) b70.3 (34.9) b
alfagluc (α-glucosidase), betagluc (β-glucosidase), cell (cellulase), xylo (xylosidase), uroni (glucuronidase), ester_nona (nonanoate-esterase), chit (chitinase), leu (leucine-aminopeptidase), acP (acid phosphomonoesterase), alkP (alkaline phosphomonoesterase), bisp (phosphodiesterase), piroP (pyrophosphatase-phosphodiesterase), aryS (arylsulphatase).
Table 6. Statistical output of the physico-chemical and microbiological parameters as a function of slope exposure (north- vs. south-facing sites) and between bulk soil (BS) and aggregate sizes fractions (dry-sieved [DS] and water-stable [WS] 1.00–0.50 mm) in the mineral (AE) horizon.
Slope Exposure (North- vs. South)Sample Type (BS vs. DS vs. WS)Interaction
AEFpFpFp
pH11.06**20.24***2.07ns
Fe-OM0.98ns3.20ns0.60ns
Al-OM9.02*6.43*1.43ns
Mn-OM3.97ns0.16ns0.02ns
TOC18.24**1.74ns1.66ns
ROC37.48***10.41**5.32*
LOC12.39**1.39ns0.58ns
IOC8.23*7.20**8.36**
TON15.77**0.92ns1.69ns
RON4.93*8.15**1.1ns
IONnananananana
C/N4.74*8.59**2.28ns
exDNA13.63**20.53***9.44**
iDNA4.97*5.54*1.20ns
exDNA/iDNA0.61ns0.57ns0.54ns
dsDNA4.81*1.26ns3.96*
alfagluc5.52*0.58ns1.72ns
betagluc4.93*5.12*1.56ns
cell0.01ns1.34ns0.78ns
xylo9.11*6.78*2.38ns
uroni5.45*1.77ns1.49ns
ester_nona5.11*0.26ns2.34ns
chit6.47*3.34ns2.16ns
leu6.87*0.11ns2.23ns
acP1.24ns15.20***3.91*
alkP4.23ns0.29ns0.89ns
bisP9.15*0.40ns1.10ns
piroP7.17*0.29ns1.44ns
aryS0.02ns4.34*0.59ns
pH (pH H2O), Fe-OM (iron bound to OM), Al-OM (aluminium bound to OM), Mn-OM (manganese bound to OM), TOC (total OC), ROC (recalcitrant OC), LOC (labile OC), IOC (insoluble OC), TON (total ON), RON (recalcitrant ON), ION (insoluble ON), exDNA (extracellular DNA), iDNA (intracellular DNA), exDNA/iDNA ratio, dsDNA (double stranded DNA), alfagluc (α-glucosidase), betagluc (β-glucosidase), cell (cellulase), xylo (xylosidase), uroni (glucuronidase), ester_nona (nonanoate-esterase), chit (chitinase), leu (leucine-aminopeptidase), acP (acid phosphomonoesterase), alkP (alkaline phosphomonoesterase), bisp (phosphodiesterase), piroP (pyrophosphatase-phosphodiesterase), aryS (arylsulphatase). F (Fisher test): ratio of two variances. p-value: na (not available); ns (not significant); * p < 0.05; ** p < 0.01; *** p < 0.001.
Publisher’s Note: MDPI stays neutral with regard to jurisdictional claims in published maps and institutional affiliations.

