
Large Shear Strength Parameters for Landslide Analyses on Highly Weathered Flysch


1
Laboratory of Engineering Geology, Department of Geology, University of Patras, 26504 Patras, Greece
2
Laboratory of Geotechnical Engineering, Department of Civil Engineering, University of Patras, 26504 Patras, Greece
*
Author to whom correspondence should be addressed.
Land 2022, 11(8), 1353; https://doi.org/10.3390/land11081353
Submission received: 31 July 2022
/
Revised: 12 August 2022
/
Accepted: 13 August 2022
/
Published: 19 August 2022
(This article belongs to the Special Issue Landslides Analysis and Management: From Data Acquisition to Modelling and Monitoring)
Abstract
:Many significant landslide movements are often observed in the upper weathering zone of flysch, which constitutes the most critical landslide-prone geological formation in Western Greece. In this article, a laboratory approach is adopted to investigate the behavior of highly weathered and tectonically decomposed flysch for slope stability analyses with the performance of large shear testing in reconstituted soil specimens. The testing program included several reconstituted flysch specimens derived from three representative landslides. Tests under large direct shearing (300 × 300 × 120 mm) were conducted in moisture- and density-controlled conditions and ring shear tests were conducted in the finer material. The test results revealed that the values of the effective angle of friction in the flysch material decrease with the increasing water content. Moreover, dense specimens showed curved failure envelopes due to dilatancy, especially in dry conditions. A comparison of laboratory test results with those obtained by performing back-analyses under saturated conditions has shown that the sliding of the weathered and decomposed flysch mainly depends on its residual angle of friction which was found to be 1°–6° lower than the ultimate angle of friction as it was estimated by the large shear tests.
1. Introduction
The main input for a landslide stability analysis is the shear strength parameters of the soil materials that form the failure surface. In order to determine the relevant shear strength parameters for design purposes, the widely commonly used laboratory tests are the direct shear box test, even though they have several limitations [1,2,3,4,5,6], as well as the triaxial compression test [7,8,9]. Moreover, for the determination of the residual shear strength, the ring shear apparatus is used [10,11,12,13,14,15]. These tests are usually conducted on undisturbed soil samples obtained from ground investigation data or reconstituted specimens, prepared by well-specified techniques in the laboratory [16,17,18]. More particularly, these methods are based on preparing remolded and reconstituted representative samples of the soils in both dry and wet testing conditions, and the soils are tamped in layers in the mold of the apparatus in a mechanical way.
The flysch generally constitutes a high landslide-prone formation causing significant instability problems and settlements in major infrastructure networks, especially in hilly and mountainous areas. In the case of this weak geological formation, the difficulties arise from representative sampling and testing. Those difficulties have often resulted in empirical slope stability design that is mainly based on experience and engineering judgment. Flysch constitutes a “structurally complex” anisotropic geological formation with behavior ranging from firm and moderately hard soil to strong rock (e.g., good quality rock mass of compact thick-bedded sandstone). The “soil-like” flysch material mainly involves the formation’s weathering zone (mantle)and the decomposed and disintegrated geological formations derived from past intense tectonic activity and weathering that suffered during previous events of geologic deformation.
The weathered flysch usually contains a large percentage of fragments and coarse-grained material (gravels and cobbles), which make undisturbed sampling and testing by triaxial and direct shear box apparatuses extremely difficult or even impossible. To overcome this problem and simultaneously model the actual field conditions, as closely as possible, the large shear box apparatus seems to offer a plausible alternative. In the current research, reconstituted test specimens (300 mm × 300 mm × 120 mm) were prepared [16,17,18], while care was taken to include in the samples a sufficient percentage of coarse-grained material of the weathered flysch.
The paper aims to investigate the possibility of using large shear apparatus to obtain representative shear strength parameters in “complex anisotropic, non-uniform” soil materials, such as the strongly sheared and decomposed flysch for modeling landslide behavior. Moreover, to compare the shear parameters obtained from the large shear and ring shear tests and estimate the shear strength characteristics of representative landslides.
The use of a large shear box on reconstituted samples can generally compose a promising method to extrapolate the in-situ state and model their behavior [19,20]. The main limitation associated with direct shear tests conducted especially on granular materials is the presence of scale effects that lead to unreliable results [21,22,23]. These effects are related to the size of the apparatus, the soil particle size, the particle reduction in the retested soil samples, as well as the shearing rates so that shearing takes place under drained conditions. As a general trend, the angle of shear resistance at peak values decreases as far as the size of the shear box increase.
The large shear box (LSB) that was used gave the advantage of the large scale, resulting in a better field simulation tool. The weathered flysch usually contains coarse-grained material, which makes using the triaxial and direct shear box testing apparatuses challenging or even impossible. The LSB apparatus overcomes this issue and simultaneously models the actual field conditions as precisely as possible. Thus, the large shear apparatus proved to be a reliable solution to simulate representative flysch materials with different moisture and density test conditions.
On the other hand, there exist some limitations and difficulties. The test procedure seems demanding, which means that the handling of the apparatus needs to be undergone by an expert. Moreover, it only measures total stresses; due to lack of control of pore water pressure, the shear stress on the failure plane is not uniform, and the failure occurs progressively from the edges towards the center of the specimen.
2. Materials and Methods
2.1. Landslides and Engineering Geological Aspects of Flysch
The typical flysch sequence in Western Greece consists of different lithological units of Upper Eocene sediments, including clays, shales, marls, siltstones, sandstones, and conglomerates. It is closely related to the Alpine orogenesis, having suffered the post-Miocene tectonism distinguished by E-W tangential movements, resulting in a westwards ductile thrusting [24] and subsequent intense folding, fracturing, and faulting of the Alpine formations. It can be generally characterized as clayey–silty or psammitic (sandy) according to the predominant composition phase. The “psammitic” flysch is brown colored (yellowish-greyish brown) and usually constitutes the upper horizon of the sequence consisting of sandstones with marly and sandy layers. The “clayey-silty” flysch that generally is encountered in the lower horizon consists of dark grey colored siltstones and locally dark red claystones, shales, and cherts. The weathered zone or mantle that mainly appears in a mixed formation phase consists of loose sandy-clayey materials of varying thickness. A transition zone often exists between the weathered mantle and the typical formation, which is characterized by intense fracturing, gradually reducing with depth.
The formation is often tectonically highly sheared, decomposed, and weathered with disintegrated rock material, making it a major predisposing factor in the induced instabilities [25]. Flysch constitutes the most critical landslide-prone geological formation in Greece and exhibits the highest frequency of landslide occurrences, exceeding 30% of the total cases recorded in the country [26,27]. In addition, heavy rainfall events that seasonally affect the Hellenic region as a consequence of climate change impacts constitute the main triggering factor [28,29].
Flysch deteriorates by a series of successive slips, following their chemical weathering, swelling due to the water absorption, and the consequent reduction in its strength [30]. The complex geological setting influences the groundwater system, including different lithological units, alternative layers of permeable and impermeable formations, and intensively fractured rock masses. The intense fracturing allows water to infiltrate freely into the rock mass. During heavy and intense rainfall, the groundwater level rises and reaches the surface, acting as a triggering mechanism.
Active landslides are observed in the weathered flysch upper zone, which, depending on its thickness, can be classified either as superficial translational or rotational slides and flows. Slides which usually take place in the gentle slopes of the flysch mantle are typically relatively shallow and take the form of a sheet of weathered zone sliding on a slip surface parallel to the ground [29]. Deep-seated failures and large mass movements are also frequently closely related to fault tectonics and still geodynamically active grabens [31]. Most of that occurrences can be recognized as fault-scarp retreating processes, which can be intensified during earthquake activity [32].
2.2. Sampling Methodology
An extensive program of in situ and laboratory work was organized and carried out, including sampling on the highly weathered and decomposed flysch, as well as laboratory testing on soil-like material with an emphasis on shearing. The sampling procedure included many disturbed soil samples obtained by compact excavator and ground investigation. The samples were collected from three typical flysch landslide sites in Western Greece named Panagopoula, Karya, and Platanitis (Figure 1). These constitute extensive instability zones of periodically induced landslide events interspersed with creep activity.
2.2.1. Panagopoula Area
Panagopoula landslide is one of the most ‘‘well-known’’ landslides in Greece. The landslides that occurred in April and May 1971 destroyed the traffic connection between Athens and Patras. The recently constructed motorway and railway tunnels are now by-passing the instability zone. The extensive instability zone extending to an area of about 0.20 km2 consisted of two prominent successive landslides, a translational and a rotational one about 25 m deep, that developed into earth flows in the lower parts [33]. These occurred in the transition zone to flysch and in the structurally highly sheared and weathered grey and brownish grey “clayey-silty” flysch of the Olonos—Pindos geological sequence. The construction of remedial works from 1973 to 1976 (two drainage tunnels 460 and 390 m long, a network of diversion ditches, gravity and cantilevered concrete walls, and horizontal drains) contributed significantly to the landslide stabilization but without definitively solving the problem. In the last twenty-five years, instability phenomena have been continuously recorded with cracks in the motorway and railway up to the coastal zone. New remedial works to stabilize the landslide zone were constructed in 2002, including a double row retention system with 256 cast in situ vertical drive piles, while inclinometers continuously monitored the long-term behavior of the site. Long-term monitoring and kinematic analysis of inclinometer datasets in the area show an extremely slow landslide movement with mean annual velocities of about 5.5 mm/year [25,34]. More recently, in 2017, a twin tunnel up to 3.5 km long was constructed to traffic divert the landslide zone.
2.2.2. Karya Village
This area comprises an extensive instability zone of periodically induced landslide events extending to an area of about 0.175 km2 and very close to the residential area of the city of Patras. In February 1999, a mass movement occurred during intense rainfall, including debris flow followed by a multiple translational slide. In December 2001, an intense rainfall produced a large volume of debris failure, triggering a new translational slide in the lower part [35,36]. It was evident that the presence of the tectonically highly sheared and weathered grey to greyish red “clayey-silty” flysch of Pindos geological sequence contributed to the periodically induced instability phenomena. The formation was generally covered by the recent debris and displaced materials. Long-term kinematic analysis of inclinometer datasets shows an extremely slow landslide movement with mean annual velocities of about 2.5 mm/year [25,27].
2.2.3. Platanitis Area
The area constitutes an instability zone where periodically induced landslide events have been interspersed with translational and rotational movements, affecting the national bypass road of the town of Nafpaktos. In 2006 just after the road construction, translational movements were initiated upslope involving superficial Quaternary scree and the weathered brown and yellowish-brown “psammitic” flysch of the Gavrovo geological sequence, followed in 2009 by rotational movements. The total length of the landslide zone is around 195 m in a transverse direction towards the bypass road, and the width reaches 220 m, while the failures destroyed the surrounding cutting slopes and road embankments. Inclinometer measurements, conducted by the Hellenic Ministry of Infrastructures and Environment, detected sliding surfaces passing through the central section 13 to 14 m deep and the second one in a greater depth of about 20 m.
2.3. Applied Methodology and Laboratory Testing
A flowchart of the applied methodology of the current research is shown in Figure 2.
The sampling procedure included many flysch soil-like samples obtained by exploratory boreholes and surface trench exposures (Table 1).
To minimize the scale effects during shear tests (as prescribed by ASTM D3080 [37], every bulk sample was initially screened to remove all particles greater than 19 mm (it was generally less than 10% of the raw sample). These were crushed to pass a 19 mm sieve, and then they were returned and blended evenly through the sample.
The flysch material of this state was initially investigated as regards its composition and physical-classification characteristics through X-ray diffraction analyses, as well as typical classification and Proctor compaction testing.
The laboratory tests on the soil material were performed following ASTM standards [37], while EN 1997-2 [38] was also used to provide the general requirements for the evaluation of test results.
From each material type of the three sites, a series of large shear tests were carried out according to ASTM D3080 [37] using a VJT/2780A direct shear machine, with a shear box of 300 × 300 × 140 mm on reconstituted 120 mm thick specimens prepared inside the shear box carriage. The general procedure for the reconstitution of flysch specimens is described below:
- Low density (loose) specimens were obtained by pouring the flysch material into the shear box carriage from a funnel with a very low drop height (up to 20 cm). The funnel was moved from the center to the periphery of the box and vice versa. This method produced an initial bulk unit weight (γb) range of 13.1 to 19.4 kN/m3.
- Dense specimens were prepared inside the apparatus carriage by manual dynamic compaction (tapping) in several layers so that the shear plane coincides with the middle of the central layer. A material with an initial bulk unit weight (γb) of 14.3 to 20.5 kN/m3 was produced.
- Both loose and dense specimens were tested in dry or wet conditions. The wet conditions included partially saturated (in different states of saturation) and saturated states to simulate all potential situations.
- Wet specimens were prepared by carefully mixing the soil material with a predetermined quantity of water and were tested in optimum dense conditions according to ASTM D1557 [39] (with Optimum Moisture Content OMC), partially saturated (with OMC + 2%), as well as fully saturated. An additional water content check was always performed in the shear zone material just after shearing.
- Saturated specimens were prepared in a two-step process. The first step is pouring (loose state) or tapping the material (dense state). The second step is pouring water into the carriage so that the water percolates very slowly upwards through the specimen (Figure 3). This procedure was used to avoid material segregation phenomena due to fine-grained contents.
- Consolidation loads were applied for 24 h in the loose normally-consolidated materials and about 3–4 h in the dense over-consolidated materials.
A summary of the flysch specimen preparation techniques with the pre-consolidation and post-shearing characteristics is shown in Table 2. During reconstitution, the specimens were placed into the shear box in a dense or loose state. This resulted in different unit weights in all samples ranging from 13.1 kN/m3 to 20.5 kN/m3 for the pre-consolidation initial conditions (γbi), which was measured from 14.0 to 21.7 kN/m3 after the end of shearing (final bulk unit weight).
Concerning the large shear testing conditions, it should be emphasized that: (a) the large shear box carriage was filled with water only in saturated specimens. In all other cases, the tests were performed under dry or partially saturated conditions, and (b) the shear displacement rate was determined from the consolidation stage to allow induced pore pressures to dissipate. For this purpose, the time to failure (tf) was estimated by the sample consolidation before shearing. A conservative estimate of the time to failure is given by t90, where t90 is the time to achieve 90 % consolidation (tf = 11.68 * t90, based on ASTM D3080-11 [37]). Then it was decided that the shear rate could be calculated by using the estimated (tf) shear failure deformation.
In this study, the large shear tests were conducted with a shearing rate in the range of 0.010–1.0 mm/min, keeping almost constant a value around 1 mm/min for dry, optimal, and partially saturated conditions and a range of 0.010–0.30 mm/min for fully saturated conditions. The tests were conducted under normal stresses σn’ (100, 200, and 300 or 400 kPa), while they were adjusted to stop when the shear strain γ (10%) was reached (ASTM D3080-11 [37]).
In the representative samples from each site, ring shear tests were also conducted according to ASTM D6467-21 [40] to determine the finer material’s residual angle of friction. For this purpose, the ring shear apparatus developed by Bromhead (1979, 1986) [41,42] was used by applying four different normal stresses σn´ (50, 100, 200, and 400 kPa). The apparatus allowed testing of ring-shaped test specimens having an outer and inner diameter of 100 mm and 70 mm, respectively a thickness of 5 mm. Those tests were performed under consolidated drained conditions on remolded materials passing the No 200 ASTM sieve (<0.075 mm), first mixed at a water content lying between the plastic limit PL and the liquid limit LL. All specimens were sheared at a displacement rate of 0.048 deg/min (or 0.036 mm/min) to allow induced pore pressures to dissipate.
3. Results
3.1. Test Results and Discussion
3.1.1. Physical Characteristics and Mineralogy of the Material
As shown in Table 3, the samples are generally described as clayey sands (SC) to silty sands (SM) with clay fractions up to 17% and low plasticity. Their standard compaction characteristics were determined with an 8–9% optimum moisture content (OMC) and about 20 kN/m3 maximum dry density by using the Proctor apparatus and the ASTM D1557-2021 standards [39].
The fine material composition is characterized by a dominant presence (67 to 77%) of quartz and calcite and small amounts of plagioclase (feldspars) 9–12%. The clay minerals mainly consist of chlorite-smectite (8–11%) and illite-clay micas-muscovite (3–23%), as well as mixed layers of montmorillonite–muscovite. The clay fraction, calculated from semi-quantitative X-ray diffraction analyses (XRD), was generally higher than the measured in the soil classification tests. This is mainly due to aggregation of silt and the fine sand-sized fraction of flysch caused by the diagenesis processes.
Generally, a clay fraction of less than 20% has little effect on residual strength, as the strength is largely controlled by the sand and silt particles [43]. Since the estimated percentage of clay minerals in the studied flysch material was less than 23%, the residual shear strength could be most affected by the sandy and silty fractions.
3.1.2. Shear Strength Characteristics
The obtained shear stress–horizontal-strain curves for some typical states of flysch specimens are shown in Figure 4, under the normal loading of 200 kPa. For the dense optimum over-consolidated state (Figure 4a), the peak shear stress reaches its highest values at approximately 4–6% shear strain, and the identical or slightly lower ultimate shear stress reaches 10% shear strain. On the other hand, for the fully saturated dense state (Figure 4b), the peak shear stress seems to be reached by more than 10% strain, whereas for the fully saturated loose state (Figure 4c), the peak and ultimate shear stresses are identical and reached their final values at 10% strain. Moreover, shear strength decreases as it passes from the dense optimum state to the dense saturated and the loose saturated state. This decrease proves that the normally consolidated (loose) flysch specimens provide a lower shear strength than their similar over-consolidated (dense) specimens and may be more representative for landslide analysis when using reconstituted specimens in a large shear box.
The testing results illustrated in Figure 5 indicate that dense specimens provide curved failure envelopes in all states of saturation, while the curvature decreases for the wet specimens. This is mainly due to the cohesionless nature of the flysch material and its dilatancy. The dilatancy describes the ability of soils to change in volume under shearing. It can be generally interpreted by the grain sliding over each other upward (positive) or downward (negative) during the shear process.
Many sophisticated theories have been put forward to explain the dilatancy concept and its relationship with shear parameters [44,45,46,47]. In general, the magnitude of dilatancy depends on (a) the soil density with the denser state expanding more rapidly [44], (b) the normal effective stress as dilatancy takes place after a slight initial compression [45], (c) the grain shape and the structural arrangement (grain geometry) of soil [46] and (d) the fine contents of soil as the increase in clay content decreases the dilatancy [47].
A representative example of dilatant behavior in the dense, dry specimens of this research is shown in the following stress–strain curves (Figure 6), on which the peak shear stress (maximum) is reached in some cases before the ultimate (critical) state. This is usually observed before the 10% of shear strain followed by lower ultimate shear stress, which at the end of shearing may reach even lower stress which corresponds to the residual shear stress [48]. On the contrary, in the wet, normally consolidated specimens, the peak shear stress was the ultimate stress.
Figure 7 shows the plots of the shear-normal stress from which the effective friction angle was determined using the best fitted linear trends for each data set and the normal loads of the tests conducted.
The range of the estimated effective angles of friction for each flysch specimen and density/moisture state is summarized in Table 4.
Table 5 summarizes the results of the effective angles of friction of the flysch material for each landslide area as they were determined by the performance of large and ring shear tests.
It should be mentioned that in large shear tests, the effective angles correspond to the peak shear strength both in the dense-dry and dense partially saturated states and the ultimate shear strength in all other states. In comparison, ring shear tests correspond to the residual shear strength. Moreover, in all loose and saturated test conditions, the peak state reached equal to or above 10% of the shear strain.
Figure 8a illustrates the variation of the residual friction angle/residual friction coefficient (τ/σ’) with effective normal stress for representative flysch material of the studied areas using the Bromhead ring shear apparatus. It can be observed that the residual friction angle φr΄ varies from 22.5° up to 24.6° under different normal stresses σ΄ (50, 100, 200, and 400 kPa), while the “best fit” residual envelopes are characterized by effective stress cohesion intercept values equal to zero (Figure 8b).
Additionally, all the trendlines from the large-shear tests were used to project both the peak shear strength and the ring shear strength envelopes (Figure 9). In contrast to the dense partially saturated (Figure 9c,d) angle of friction, the angle of friction of the saturated loose normally consolidated specimens(Figure 9a) and the saturated dense over-consolidated specimens(Figure 9b), all from the large-shear tests, are closer to the respective values of the residual state.
Furthermore, it should also be mentioned that shear strength decreases as water content increases. An increase in water content up to the saturation state (φ’ > 40° for the dry state is reduced to values φ’ < 30° for the saturation state) resulted in a clear decrease in the effective angle of friction. Finally, the density significantly affects the soil strength in the case of dry and wet specimens. In contrast, unexpectedly, the strength of dense and loose saturated specimens is generally coincident in the range of 25° to 30°. It seems that under fully saturation conditions, the soil matrix dominates the strength behavior, and (c) the strength of dense and loose dry specimens is quite high with large effective friction angles because of the granular material structure that mainly influences its behavior.
3.1.3. Back Analysis of the Sheared Material
A slope stability analysis was carried out in representative slip sections of the studied areas. The geotechnical, hydrogeological, and morphological conditions have been attributed through detailed appraisals, and long-term monitoring carried out by the laboratory of Engineering Geology of The University of Patras, as well as from data derived by the Hellenic Ministry of Infrastructures. The analysis was performed by using the Slide2 (Rocscience Inc., 54 St Patrick Street, Toronto, ON M5T 1V1, Canada) software and applying the Janbu corrected method on the potential failure surface of the flysch sheared zone (Figure 10).
The strength material properties of the flysch sheared zone that were used in the analysis were those that had been calculated with the Large Shear tests by considering a saturated scenario in the sheared zone with ru = 0.5.
The analysis results revealed a safety factor equal to 1.099, 1.089, and 1.169 for the Panagopoula, Karya, and Platanitis areas, respectively, which are close to unity. Given the accuracy of the model on the Slide software and the reliability of the geotechnical analyses, the safety factor of FOS = 1.167 in Karya village, as derived along the potential failure surface, indicates that the landslide does not reach the state of activation and maybe will not cause any significant movements on the landslide body. As the results of the 2D analysis for this particular surface are so close to the slope stability limit (FOS = 1), we would say that a reactivation of the landslide is possible under the conditions of long-lasting precipitation events and the resulting rise in the groundwater level and/or a further weathering will occur along the weak material of flysch.
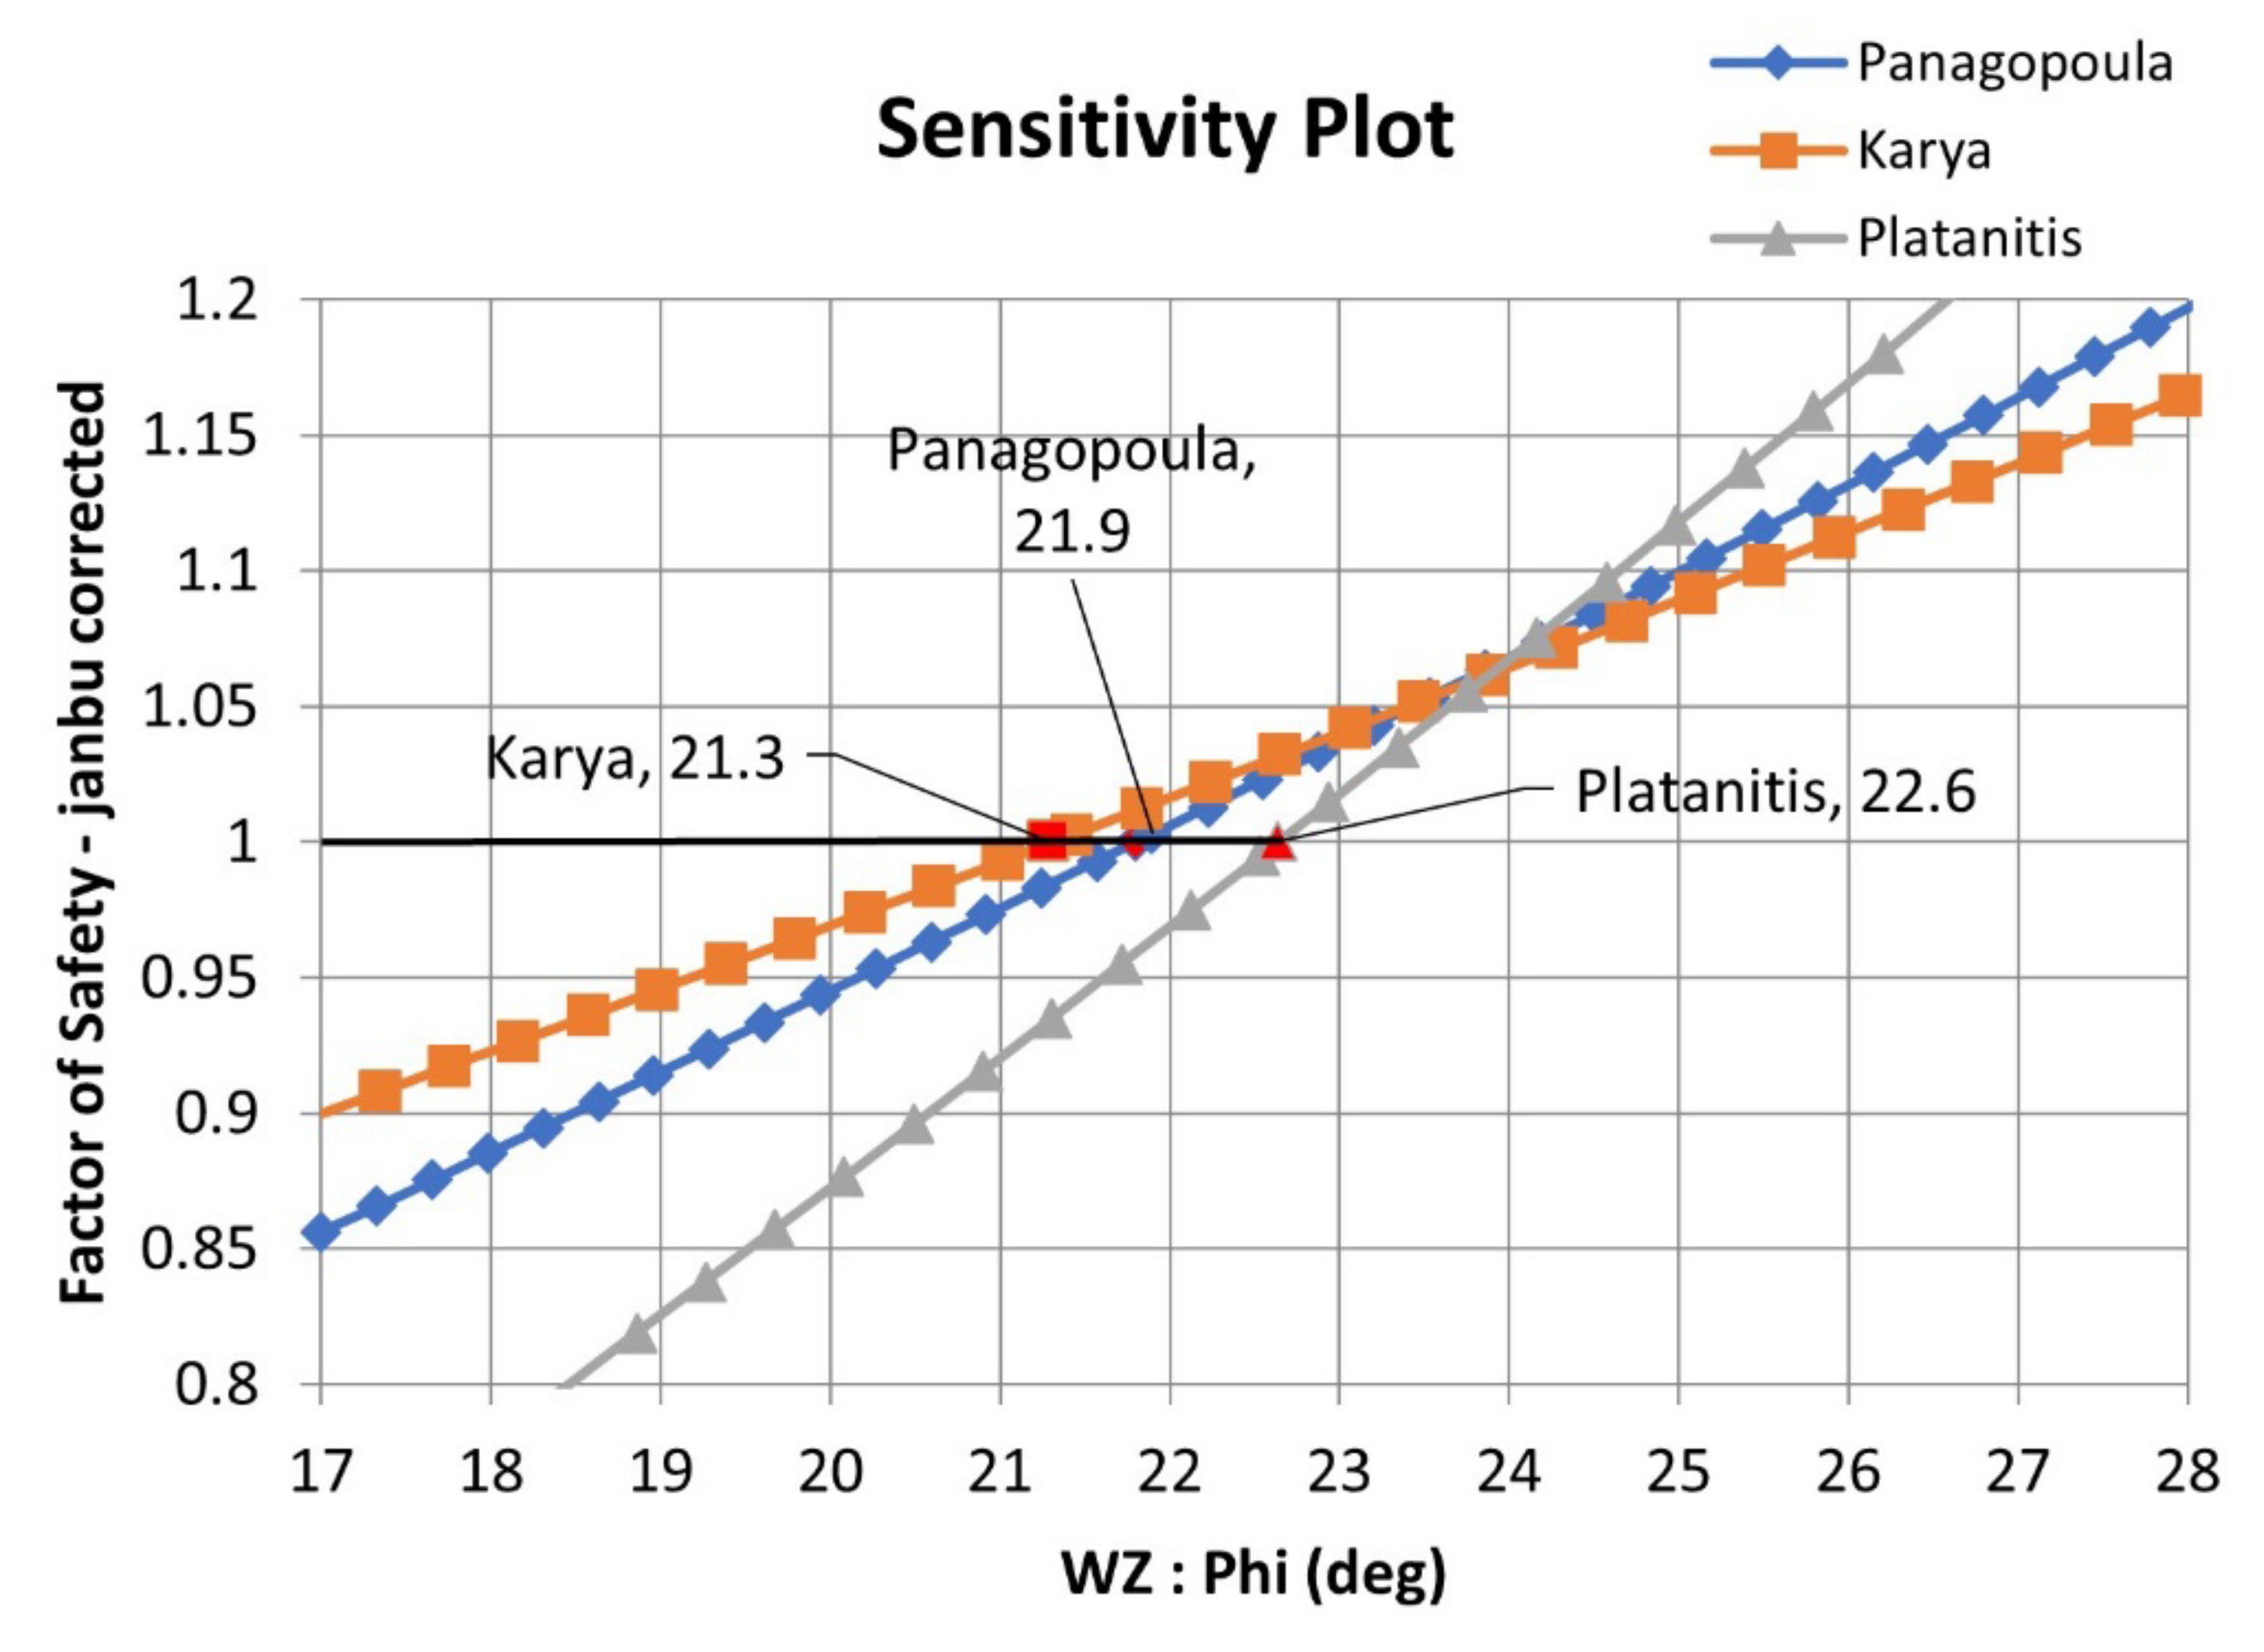
The next step was to perform a sensitivity analysis to recalculate the effective angle of friction of the flysch sheared material for FOS = 1 (Figure 11).
From the analysis of the sensitivity plots, it is noted that the angle of friction values, as they have been obtained from the sensitivity (back) analysis, are close to the ones derived from the ring shear tests. In particular, the angle of friction was found to be equal to 21.9°, 21.3°, and 22.6° for the Panagopoula, Karya, and Platanitis areas, respectively. These values are lower by 0.6–2.7° than the residual values obtained by the ring shear. This deviation leads to the conclusion that the shear strength parameters derived from the Large Shear tests have significantly contributed to the slope stability analysis of the potential failure zones.
4. Discussion
In the current study, the LSB and the Ring Shear apparatuses were used to investigate the behavior of the highly weathered and tectonically decomposed flysch for slope stability analyses by using reconstituted specimens. The testing program included only reconstituted specimens since the material derived from three representative landslides was impossible to be undisturbed. This is due to the limitations that exist when the material is weathered and decomposed and has to be received either from boreholes with circular dimensions that are very different from the square dimensions of the LSB or trial pits in which undisturbed square sampling is extremely difficult. Therefore, well-prepared reconstituted specimens were used in both the LSB and the ring shear apparatuses following the respective ASTM standards [37,38,40] and other similar studies [16,17,18].
From the conducted tests, a good agreement was found between the effective angles of friction determined by the ring and large shear tests on partially and fully saturated conditions. Especially in the fully saturated state of the weathered flysch material, which usually constitutes a typical landslide-prone geological formation, the ultimate angle of friction, as the large shear tests estimated it, was found to be 1–6° higher than the residual one. This expected difference exists in granular materials such as flysch, on which the ultimate (critical) shear strength is slightly higher than the residual.
The landslides in question have undergone considerable movements over the past years. Laboratory and field experience in similar cases has generally shown that drained residual shear strength measured by laboratory tests is mobilized on reactivated landslide phenomena and is often used for slope stability analyses [49,50,51,52]. Eventually, it was assumed that enough displacement had occurred on the slip surfaces of the studied landslides to achieve residual conditions. Therefore, the angle of friction determined through back analysis in the flysch-sheared material was found to correspond very closely to the residual one. More specifically, the residual angles of friction obtained by the back analysis were 0.6–2.7 lower than the respective obtained by the ring shear tests.
It is widely known that the difference between laboratory shear testing results with those obtained by back analysis models may be due to “healing” or “strength regain” processes that are realized in time on preexisting slip surfaces already at residual condition [53,54,55,56,57]. It means that the required shear stress to reactivate a landslide is claimed to be larger than the modeled residual shear strength when using laboratory tests [56]. The main factors contributing to an increase in shearing resistance on a preexisting shear surface are chemical changes [58,59,60], suction resulting from a drop of groundwater [61,62], as well as non-uniform shrinkage and swelling phenomena, etc.
While analyzing the laboratory results, it is also clear that the relationship between the shear strength and the percentage of the moisture content seems to be inversely proportional [63]. Furthermore, the angle of friction derived from dense and loose saturated conditions ranged lower than 30 degrees, as it is also noted in other similar studies [23].
A similar approach to that presented in this paper for landslide analysis may be repeated in other similar areas prone to landslides along a flysch weak material, which is a very common situation in Western Greece.
5. Conclusions
The laboratory’s large shear testing on reconstituted flysch specimens showed that the shear strength of dry (dense and loose) flysch specimens is relatively high with large effective angles of friction because the granular material structure of flysch influences its mechanical behavior. A clear decrease in the effective friction angle is observed with an increase in water content up to a fully saturated state exhibiting lower values of friction angles. Fully saturated specimens in dense and loose states present a quite similar shear behavior.
Concerning the failure envelope, the dense and dry flysch specimens present a curved envelope due to dilatancy. Therefore, the peak shear stress (maximum) is reached in some cases before the ultimate (critical) state. The curvature decreases for the wet and saturated conditions. As a result, in the wet, normally consolidated specimens, the peak shear stress is found to be equal to the ultimate. This suggests that the normally consolidated flysch specimens provide a lower shear strength compared to their similar over-consolidated specimens and may be more representative for landslide analysis when using reconstituted specimens in a large shear box.
Comparing the testing results with those obtained by back analysis of the studied landslides, a good agreement was found between the residual friction angle values determined from back analyses and the respective values obtained by the ring shear tests, with the effective angle of friction values obtained by the large shear tests being slightly higher.
It may be concluded that realistic shear strength values of the flysch material mobilized in landslides can be determined through direct large shear tests on reconstituted specimens in the fully saturated state, which usually constitutes a typical landslide condition. Therefore, the large shear apparatus may overcome the problem of modeling representative samples for determining shear strength parameters in “difficult” soil materials, such as the strongly sheared and decomposed flysch, and thus examine its landslide behavior. It may be concluded that the use of a large shear box is a promising method in landslide analysis and a better approach to describe the strength behavior of weathered or remolded soils.
Author Contributions
Conceptualization, S.A., N.D. and N.S.; methodology, N.D. and N.S.; validation, N.D., N.S. and P.P.; formal analysis, S.A., N.D. and N.S.; investigation, S.A.; resources, N.D. and N.S.; data curation, N.D. and N.S.; writing—original draft preparation, S.A.; writing—review and editing, N.D., N.S. and P.P.; visualization, S.A.; supervision, N.D. and N.S.; project administration, N.D. and N.S.; funding acquisition, N.D. All authors have read and agreed to the published version of the manuscript.
Funding
This research received no external funding.
Institutional Review Board Statement
Not applicable.
Informed Consent Statement
Not applicable.
Data Availability Statement
The data used to support the findings of this study are available from the corresponding author upon reasonable request.
Acknowledgments
The publication of this article has been financed by the Research Committee of the University of Patras, Greece. The authors would like also to thank Rocscience Inc. for offering an educational trial version of the Slide2 Software to validate the experimental results through 2D analysis. Additionally, we would like to express our gratitude to our laboratory colleagues for their contribution to the execution of the classical laboratory tests and, finally, to the laboratory of X-ray Diffraction Analysis, Department of Geology, the University of Patras, for performing the semi-quantitative analysis of the clay minerals.
Conflicts of Interest
The authors declare no conflict of interest.
References
- Lambe, W.; Whitman, R. Soil Mechanics: Shear Strength of Cohesionless Soil; John Wiley and Sons: Hoboken, NJ, USA, 1969. [Google Scholar]
- Jewell, R.A. Direct Shear Tests on Sand. Géotechnique 1989, 39, 309–322. [Google Scholar] [CrossRef]
- Vithana, S.B.; Nakamura, S.; Gibo, S.; Yoshinaga, A.; Kimura, S. Correlation of Large Displacement Drained Shear Strength of Landslide Soils Measured by Direct Shear and Ring Shear Devices. Landslides 2012, 9, 305–314. [Google Scholar] [CrossRef]
- Wang, J.-J.; Zhang, H.-P.; Tang, S.-C.; Liang, Y. Effects of Particle Size Distribution on Shear Strength of Accumulation Soil. J. Geotech. Geoenviron. Eng. 2013, 139, 1994–1997. [Google Scholar] [CrossRef]
- Vivoda Prodan, M.; Arbanas, Ž. Analysis of the Possible Reactivation of the Krbavčići Landslide in Northern Istria, Croatia. Geosciences 2020, 10, 294. [Google Scholar] [CrossRef]
- Stark, T.D.; Eid, H.T. Drained Residual Strength of Cohesive Soils. J. Geotech. Eng. 1994, 120, 856–871. [Google Scholar] [CrossRef]
- Holtz, R.D.; Kovacs, W.D.; Sheahan, T.C. An Introduction to Geotechnical Engineering; Prentice-Hall: Hoboken, NJ, USA, 1981; Volume 733. [Google Scholar]
- Head, K.H. Manual of Soil Laboratory Testing. Volume 3: Effective Stress Tests; John Wiley & Sons: Chichester, UK, 1998. [Google Scholar]
- Price, D.G. Engineering Geology Principles and Practice; Springer: Berlin/Heidelberg, Germany, 2009. [Google Scholar]
- Stark, T.D.; Vettel, J.J. Bromhead Ring Shear Test Procedure. Geotech. Test. J. 1992, 15, 24–32. [Google Scholar] [CrossRef]
- Stark, T.D.; Choi, H.; Hangseok, C.; McCone, S. Drained Shear Strength Parameters for Analysis of Landslides. J. Geotech. Geoenviron. Eng. 2005, 131, 575–588. [Google Scholar] [CrossRef]
- Stark, T.D.; Hussain, M. Empirical Correlations: Drained Shear Strength for Slope Stability Analyses. J. Geotech. Geoenviron. Eng. 2013, 139, 853–862. [Google Scholar] [CrossRef]
- Kakou, B.G.; Shimizu, H.; Nishimura, S. Residual Strength of Colluvium and Stability Analysis of Farmland Slope. Agric. Eng. Int. CIGR J. 2001, 3, 1–12. [Google Scholar]
- Yu, M.; Huang, Y.; Deng, W.; Cheng, H. Forecasting Landslide Mobility Using an SPH Model and Ring Shear Strength Tests: A Case Study. Nat. Hazards Earth Syst. Sci. 2018, 18, 3343–3353. [Google Scholar] [CrossRef]
- Benac, Č.; Oštrić, M.; Dugonjić Jovančević, S. Geotechnical Properties in Relation to Grain-Size and Mineral Composition: The Grohovo Landslide Case Study (Croatia). Geol. Croat. 2014, 67, 127–136. [Google Scholar] [CrossRef]
- Raghunandan, M.; Juneja, A.; Hsiung, B. Preparation of Reconstituted Sand Samples in the Laboratory. Int. J. Geotech. Eng. 2012, 6, 125–131. [Google Scholar] [CrossRef]
- Tabaroei, A.; Abrishami, S.; Hosseininia, E.S. Comparison between Two Different Pluviation Setups of Sand Specimens. J. Mater. Civ. Eng. 2017, 29, 04017157. [Google Scholar] [CrossRef]
- Knudsen, S. The International Society for Soil Mechanics and Geotechnical Engineering. Effect of Reconstitution Techniques on the Triaxial Stress Strength Behaviour of a very Dense Sand. 2019. Available online: https://www.issmge.org/publications/publication/effect-of-reconstitution-techniques-on-the-triaxial-stress-strength-behaviour-of-a-very-dense-sand (accessed on 19 July 2022).
- Anagnostopoulou, S.; Boumpoulis, V.; Lampropoulou, P.; Servou, A.; Depountis, N.; Sabatakakis, N. The Behavior of the Highly Weathered and Partially Decomposed Flysch in the Reactivation of Landslide Phenomena in Greece. In IAEG/AEG Annual Meeting Proceedings, San Francisco, California, 2018-Volume 1; Springer: Cham, Switzerland, 2019; pp. 119–124. [Google Scholar] [CrossRef]
- Christoulas, S.; Kalteziotis, N.; Gassios, E.; Sabatakakis, N.; Tsiambaos, G. Instability Phenomena in Weathered Flysch in Greece. In International Symposium on Landslides, Proceedings of the 5th International Symposium on Landslides, Lausanne, Switzerland, 10–15 July 1988; Publication Rotterdam: Rotterdam, Switzerland, 1988; pp. 103–108. [Google Scholar] [CrossRef]
- Nakao, T.; Fityus, S. Direct Shear Testing of a Marginal Material Using a Large Shear Box. Geotech. Test. J. 2008, 31, 393–403. [Google Scholar] [CrossRef]
- Tanghetti, G.; Goodey, R.J.; Divall, S.; McNamara, A.M.; Mckinley, B. Design and Development of a Large Shear Box for Testing Working Platform Material. In Proceedings of the ECSMGE—2019. XVII European Conference on Soil Mechanics and Geotechnical Engineering, Reykjavik, Iceland, 1 September 2019. [Google Scholar]
- Vannucci, S.; D’Amato Avanzi, G.; Galanti, Y.; Giannecchini, R.; Lo Presti, D.; Capilleri, P.P. Strength Parameters of Debris Using a Large Shear Box Apparatus: Application to a Case History. Rock Mech. Rock Eng. 2019, 52, 4421–4437. [Google Scholar] [CrossRef]
- Doutsos, T.; Koukouvelas, I.; Poulimenos, G.; Kokkalas, S.; Xypolias, P.; Skourlis, K. An Exhumation Model of the South Peloponnesus, Greece. Int. J. Earth Sci. 2000, 89, 350–365. [Google Scholar] [CrossRef]
- Kavoura, K.; Konstantopoulou, M.; Depountis, N.; Sabatakakis, N. Slow-moving landslides: Kinematic analysis and movement evolution modeling. Environ. Earth Sciences 2020, 79, 130. [Google Scholar] [CrossRef]
- Sabatakakis, N.; Koukis, G.; Vassiliades, E.; Lainas, S. Landslide Susceptibility Zonation in Greece. Nat. Hazards 2013, 65, 523–543. [Google Scholar] [CrossRef]
- Kavoura, K.; Sabatakakis, N. Investigating Landslide Susceptibility Procedures in Greece. Landslides 2020, 17, 127–145. [Google Scholar] [CrossRef]
- Lainas, S.; Sabatakakis, N.; Koukis, G. Rainfall Thresholds for Possible Landslide Initiation in Wildfire-Affected Areas of Western Greece. Bull. Eng. Geol. Environ. 2016, 75, 883–896. [Google Scholar] [CrossRef]
- Lainas, S.; Depountis, N.; Sabatakakis, N. Preliminary Forecasting of Rainfall-Induced Shallow Landslides in the Wildfire Burned Areas of Western Greece. Land 2021, 10, 877. [Google Scholar] [CrossRef]
- Vivoda Prodan, M.; Mileusnić, M.; Mihalić Arbanas, S.; Arbanas, Ž. Influence of Weathering Processes on the Shear Strength of Siltstones from a Flysch Rock Mass along the Northern Adriatic Coast of Croatia. Bull. Eng. Geol. Environ. 2017, 76, 695–711. [Google Scholar] [CrossRef]
- Koukis, G.; Sabatakakis, N.; Ferentinou, M.; Lainas, S.; Alexiadou, X.; Panagopoulos, A. Landslide Phenomena Related to Major Fault Tectonics: Rift Zone of Corinth Gulf, Greece. Bull. Eng. Geol. Environ. 2009, 68, 215–229. [Google Scholar] [CrossRef]
- Chousianitis, K.; Del Gaudio, V.; Sabatakakis, N.; Kavoura, K.; Drakatos, G.; Bathrellos, G.D.; Skilodimou, H.D. Assessment of Earthquake-Induced Landslide Hazard in Greece: From Arias Intensity to Spatial Distribution of Slope Resistance Demand. Bull. Seism. Soc. Am. 2016, 106, 174–188. [Google Scholar] [CrossRef]
- Sabatakakis, N.; Tsiambaos, G.; Rondoyanni, T.; Papanakli, S.; Kavoura, K. Deep-Seated Structurally Controlled Landslides of Corinth Gulf Rift Zone, Greece: The Case of Panagopoula Landslide. In Proceedings of the 3th ISRM International Congress of Rock Mechanics, Montreal, Canada, 10 May 2015. [Google Scholar]
- Aversa, S.; Kavoura, K.; Sabatakakis; Tsiambaos, N. Long Term Ground Displacements Due to a Large Landslide in Western Greece. In Landslides and Engineered Slopes. Experience, Theory and Practice; CRC Press: Boca Raton, FL, USA, 2016; pp. 1177–1181. [Google Scholar] [CrossRef]
- Sabatakakis, N.; Koukis, G.; Mourtas, D. Composite Landslides Induced by Heavy Rainfalls in Suburban Areas: City of Patras and Surrounding Area, Western Greece. Landslides 2005, 2, 202–211. [Google Scholar] [CrossRef]
- Tsiambaos, G.; Sabatakakis, N.; Rondoyanni, T.; Depountis, N.; Kavoura, K. Composite Landslides Affecting Flysch and Neogene Weak Rock Formations Induced by Heavy Rainfalls. In Proceedings of the 13th ISRM International Congress of Rock Mechanics, Montreal, Canada, 10 May 2015. [Google Scholar]
- D3080-11; Test Method for Direct Shear Test of Soils Under Consolidated Drained Conditions. American Society for Testing and Materials (ASTM): West Conshohocken, PA, USA, 2011.
- EN 1997-2:2007; Eurocode 7-Geotechnical design-Part 2: Ground investigation and testing. European Committee for Standardization: Brussels, Belgium, 2006.
- D1557-12; Test Methods for Laboratory Compaction Characteristics of Soil Using Modified Effort (56,000 Ft-Lbf/Ft3 (2700 KN-m/M3)). American Society for Testing and Materials (ASTM): West Conshohocken, PA, USA, 2012.
- D6467-21e01; Test Method for Torsional Ring Shear Test to Determine Drained Residual Shear Strength of Fine-Grained Soils. American Society for Testing and Materials (ASTM): West Conshohocken, PA, USA, 2021.
- Bromhead, E.N. A Simple Ring Shear Apparatus. Ground Eng. 1979, 12, 40–44. [Google Scholar]
- Bromhead, E.N. The Stability of Slopes; Surrey University Press: London, UK, 1986; p. 373. [Google Scholar]
- Skempton, A.W. Residual Strength of Clays in Landslides, Folded Strata and the Laboratory. Géotechnique 1985, 35, 3–18. [Google Scholar] [CrossRef]
- Taylor, D.W. Fundamentals of Soil Mechanics; John Wiley and Sons: Hoboken, NJ, USA, 1948. [Google Scholar]
- Yu, H.; Houlsby, G. Finite Cavity Expansion in Dilatant Soils: Loading Analysis. Géotechnique 1991, 41, 173–183. [Google Scholar] [CrossRef]
- Cox, M.R.B. The Influence of Grain Shape on Dilatancy; The University of Arizona: Tucson, AZ, USA, 2008. [Google Scholar]
- Georgiannou, V.N.; Burland, J.B.; Hight, D.W. The Undrained Behaviour of Clayey Sands in Triaxial Compression and Extension. Géotechnique 1990, 40, 431–449. [Google Scholar] [CrossRef]
- Atkinson, J. An Introduction to the Mechanics of Soils and Foundations: Through Critical State Soil Mechanics; McGraw-Hill Book Company (UK) Ltd: London, UK, 1993. [Google Scholar]
- Skempton, A.W. Long-Term Stability of Clay Slopes. Géotechnique 1964, 14, 77–102. [Google Scholar] [CrossRef]
- Hutchinson, J.N. A Reconsideration of the Coastal Landslides at Folkestone Warren, Kent. Géotechnique 1969, 19, 6–38. [Google Scholar] [CrossRef]
- Bromhead, E.N.; Dixon, N. The Field Residual Strength of London Clay and Its Correlation with Loboratory Measurements, Especially Ring Shear Tests. Géotechnique 1986, 36, 449–452. [Google Scholar] [CrossRef]
- Mesri, G.; Shahien, M. Residual Shear Strength Mobilized in First-Time Slope Failures. J. Geotech. Geoenviron. Eng. 2003, 129, 12–31. [Google Scholar] [CrossRef]
- D’Appolonia, E.; Alperstein, R.; D’Appolonia, D.J. Behavior of a Colluvial Slope. J. Soil Mech. Found. Div. 1967, 93, 447–473. [Google Scholar] [CrossRef]
- Angeli, M.-G.; Pasuto, A.; Silvano, S. Towards the Definition of Slope Instability Behaviour in the Alverà Mudslide (Cortina d’Ampezzo, Italy). Geomorphology 1999, 30, 201–211. [Google Scholar] [CrossRef]
- Angeli, M.-G.; Gasparetto, P.; Bromhead, E. Strength-Regain Mechanisms in Intermittently Moving Slides. 2004. Available online: https://www.researchgate.net/publication/281826436_Strength-Regain_Mechanism_in_Intermittently_Moving_Slides (accessed on 19 July 2022).
- Huvaj-Sarihan, N. Movement of Reactivated Landslides; University of Illinois at Urbana-Champaign: Urbana-Champaign, IL, USA, 2009. [Google Scholar]
- Mesri, G.; Huvaj-Sarihan, N. Residual Shear Strength Measured by Laboratory Tests and Mobilized in Landslides. J. Geotech. Geoenviron. Eng. 2012, 138, 585–593. [Google Scholar] [CrossRef]
- Chandler, R.J. The Effect of Weathering on the Shear Strength Properties of Keuper Marl. Géotechnique 1969, 19, 321–334. [Google Scholar] [CrossRef]
- Hawkins, A.B.; McDonald, C. Decalcification and Residual Shear Strength Reduction in Fuller’s Earth Clay. Géotechnique 1992, 42, 453–464. [Google Scholar] [CrossRef]
- Tiwari, B.; Brandon, T.L.; Marui, H.; Tuladhar, G.R. Comparison of Residual Shear Strengths from Back Analysis and Ring Shear Tests on Undisturbed and Remolded Specimens. J. Geotech. Geoenviron. Eng. 2005, 131, 1071–1079. [Google Scholar] [CrossRef]
- Au, S.W.C. Rain-Induced Slope Instability in Hong Kong. Eng. Geol. 1998, 51, 1–36. [Google Scholar] [CrossRef]
- Bromhead, E.N. Landslide Slip Surfaces: Their Origins, Behaviour and Geometry. Landslides 2004, 1, 3–21. [Google Scholar]
- Ukleja, J. Stabilization of Landslides Sliding Layer Using Electrokinetic Phenomena and Vacuum Treatment. Geosciences 2020, 10, 284. [Google Scholar] [CrossRef]
Figure 1.
Location map and views of the main landslide event in (a) Panagopoula, 1971, (b) Karya, 2001, and (c) Platanitis, 2010. The map margins correspond to the Hellenic Geodetic Reference System of 1987.
Figure 1.
Location map and views of the main landslide event in (a) Panagopoula, 1971, (b) Karya, 2001, and (c) Platanitis, 2010. The map margins correspond to the Hellenic Geodetic Reference System of 1987.
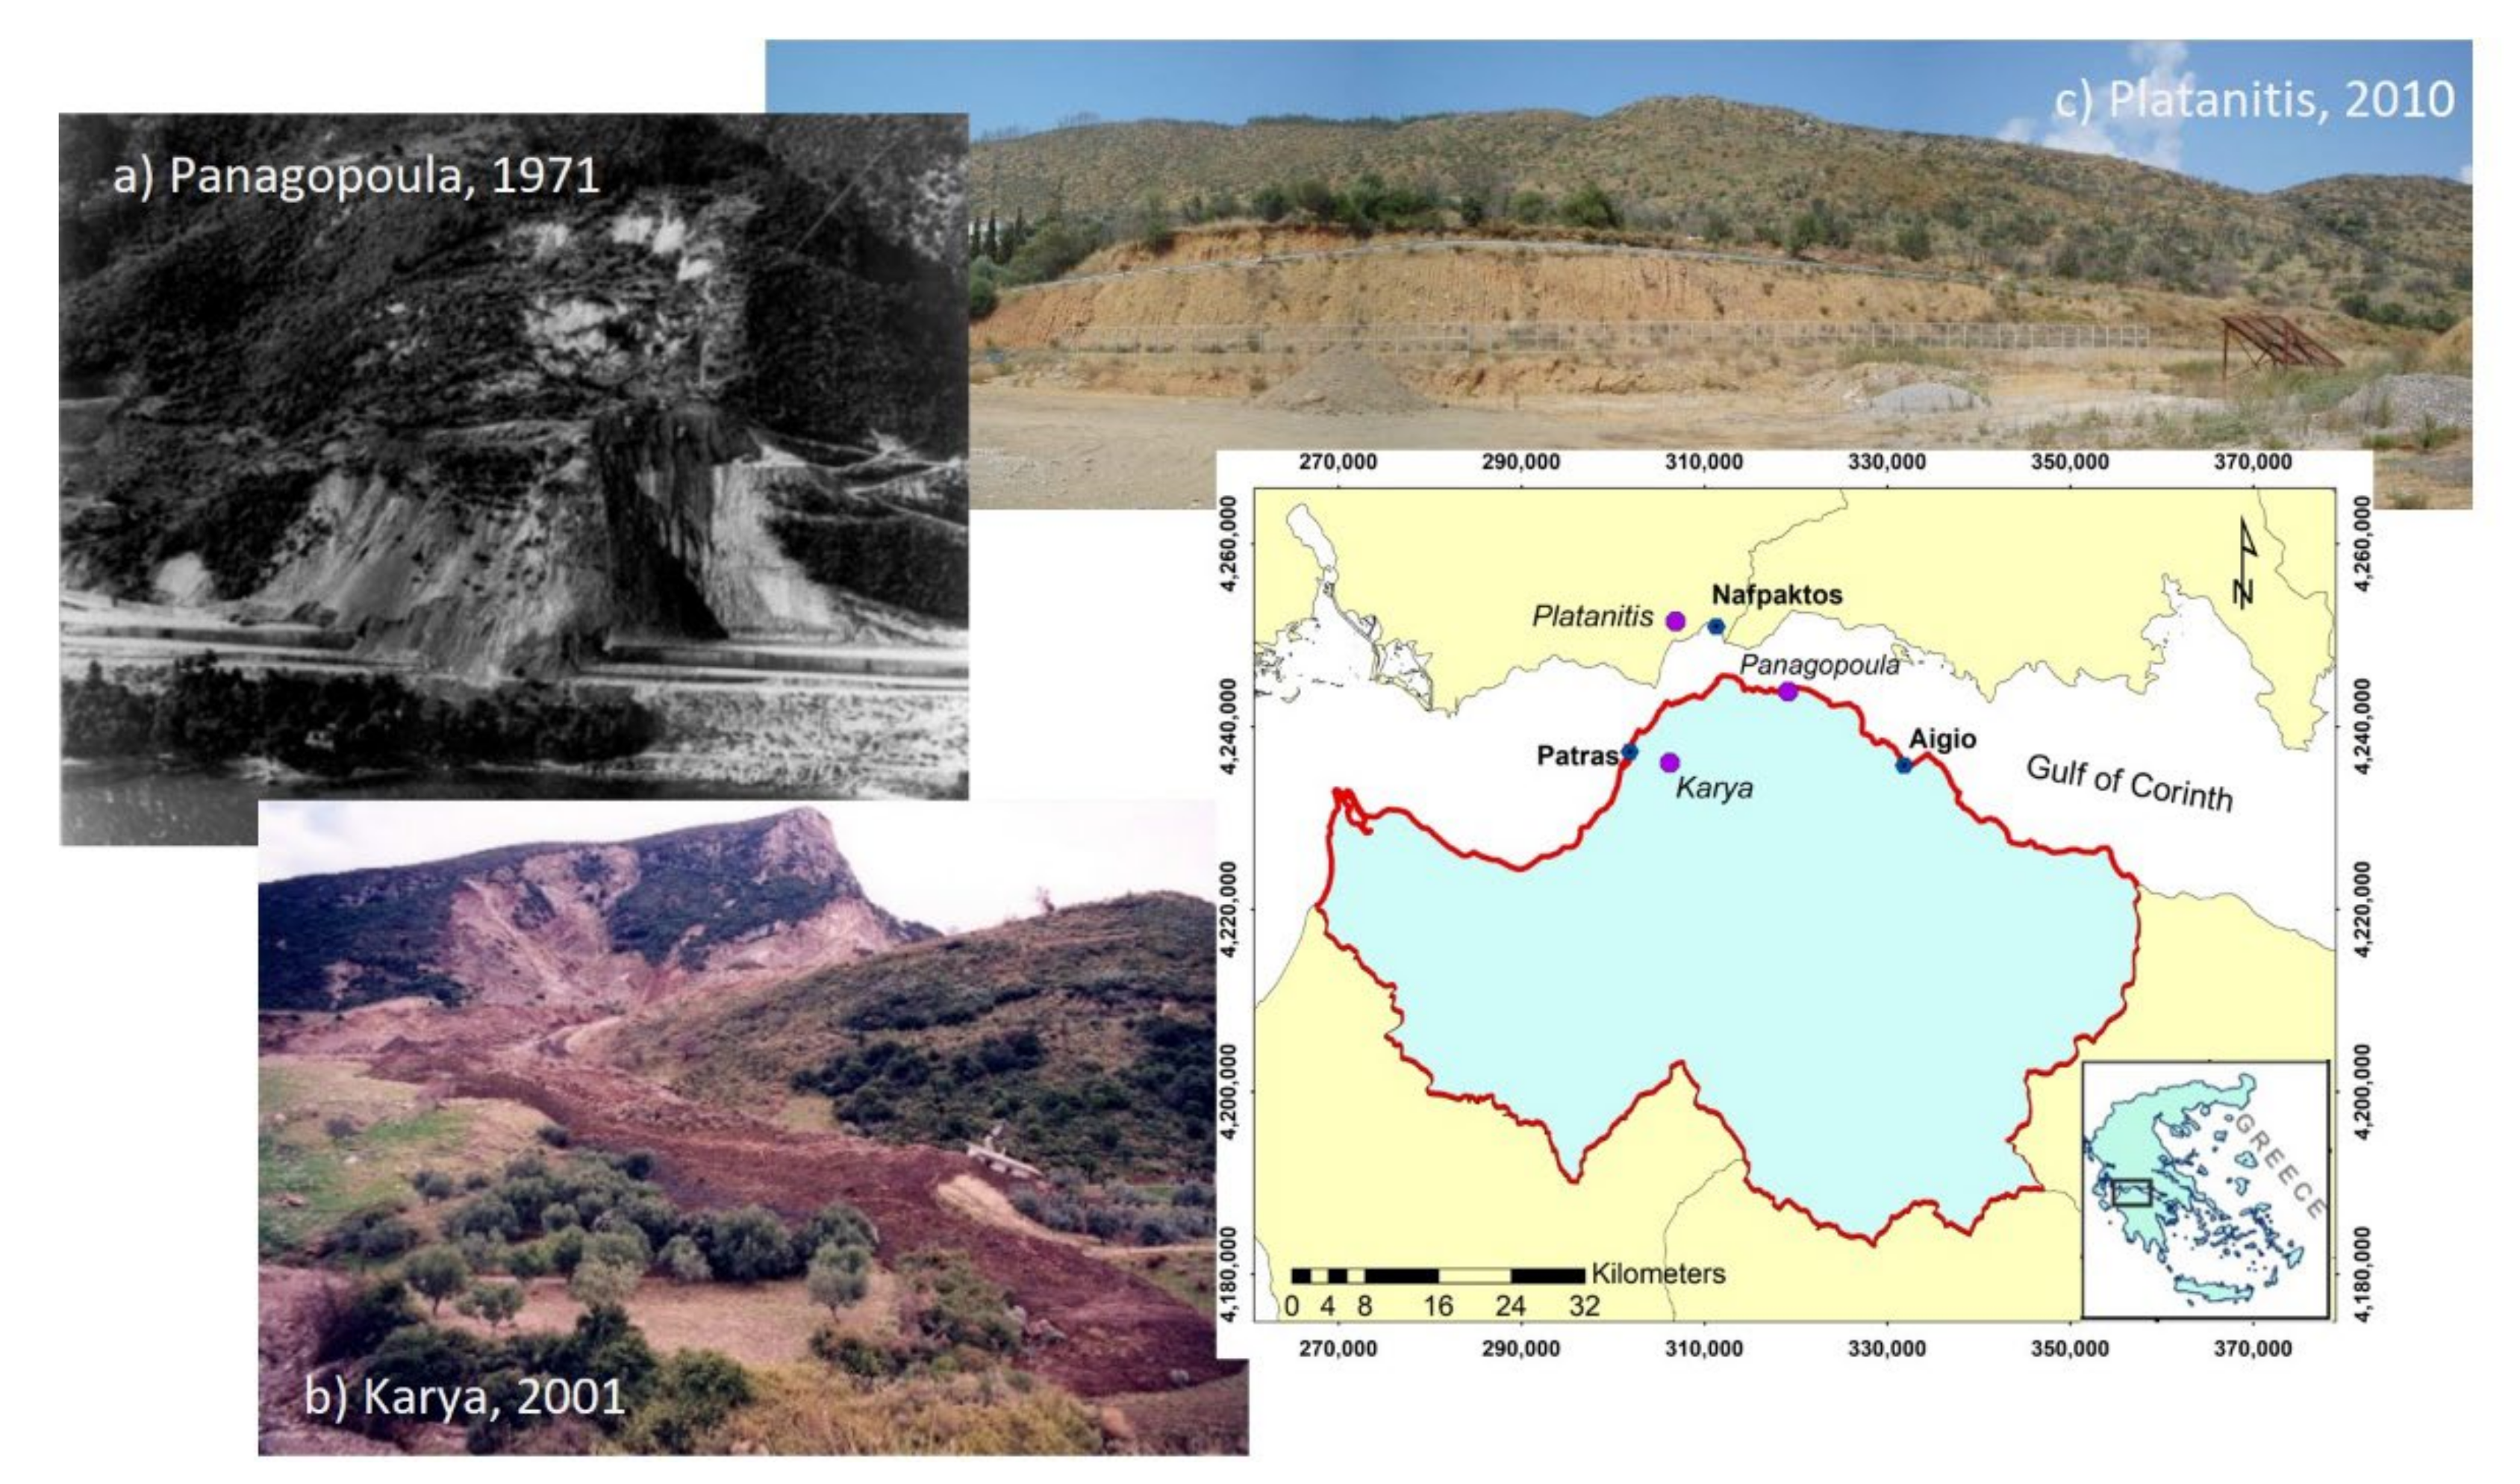
Figure 2.
Flow chart of applied methodology.

Figure 3.
Saturation level within (a) 5 (b) 15 (c) 30 and (d) 45 min in the large shear box carriage by upwards water percolation through the flysch specimen PLAT1-1.
Figure 3.
Saturation level within (a) 5 (b) 15 (c) 30 and (d) 45 min in the large shear box carriage by upwards water percolation through the flysch specimen PLAT1-1.

Figure 4.
Shear stress—horizontal strain curves under normal loading of 200 kPa for (a) Dense—OPT, (b) Dense—saturated, and (c) Loose—saturated specimen state.
Figure 4.
Shear stress—horizontal strain curves under normal loading of 200 kPa for (a) Dense—OPT, (b) Dense—saturated, and (c) Loose—saturated specimen state.

Figure 5.
Shear peak stress-normal stress plots in all different saturation states of the dense flysch specimens. PAN (a), KAR1 (b), KAR2 (c), PLAT1 (d) and PLAT2 (e).
Figure 5.
Shear peak stress-normal stress plots in all different saturation states of the dense flysch specimens. PAN (a), KAR1 (b), KAR2 (c), PLAT1 (d) and PLAT2 (e).
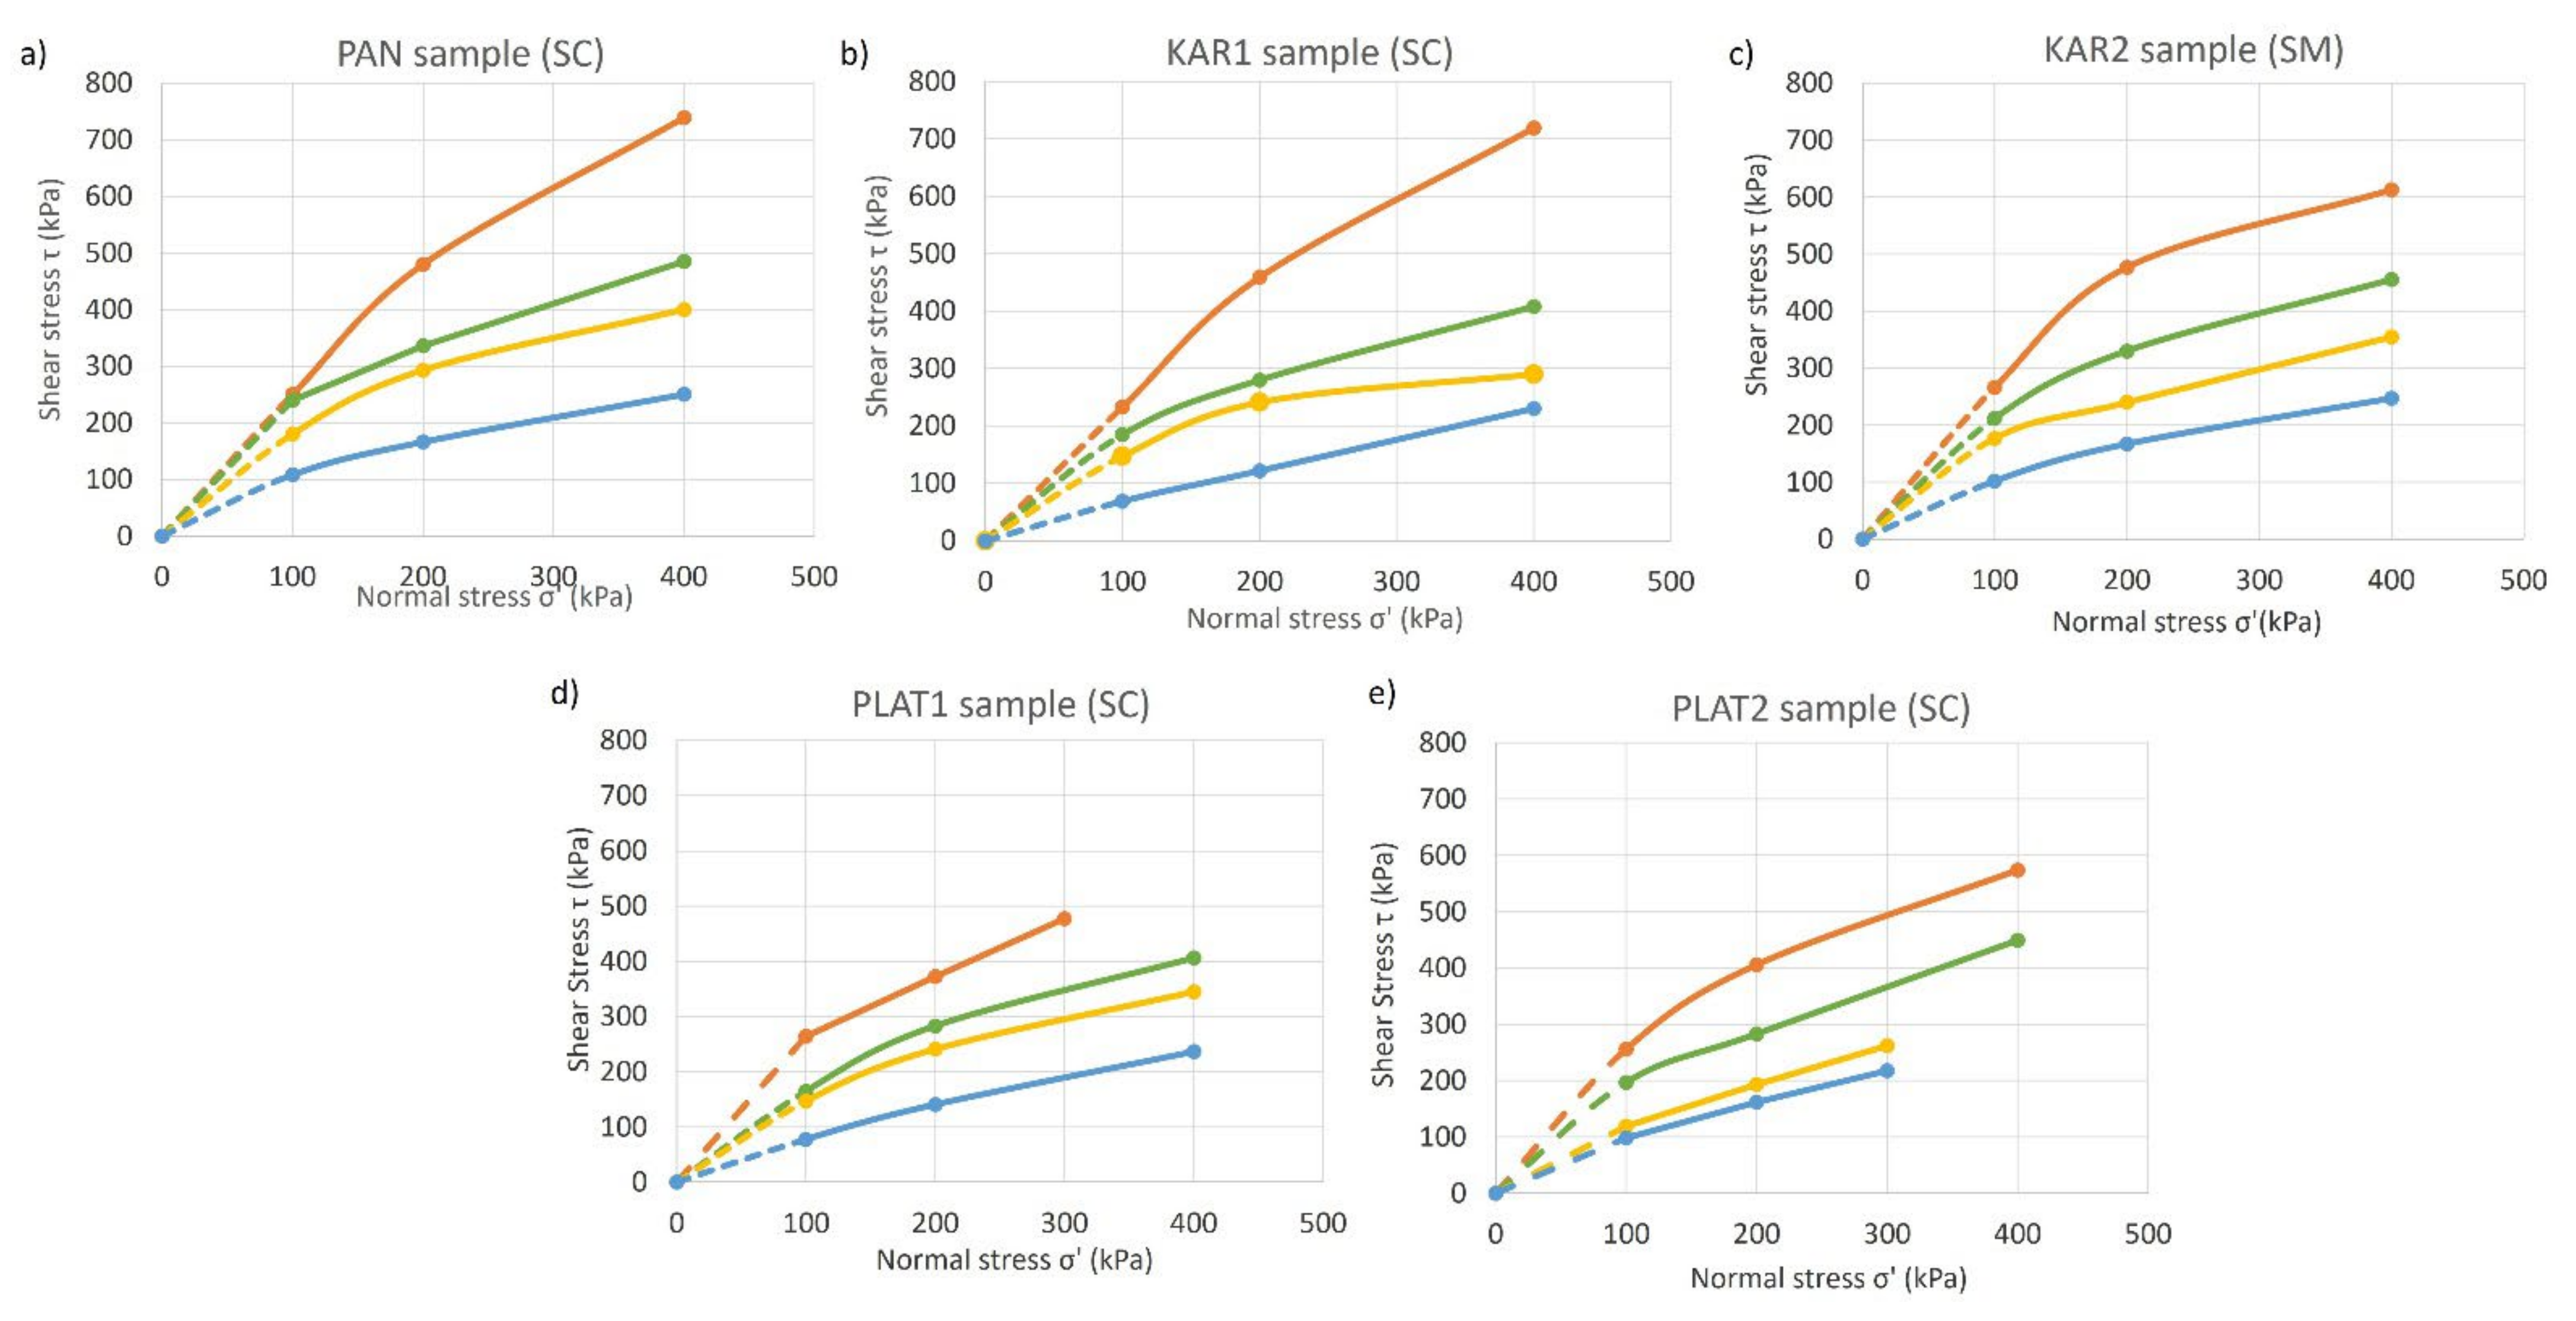
Figure 6.
Typical dilatant behavior of the dense dry flysch specimens.
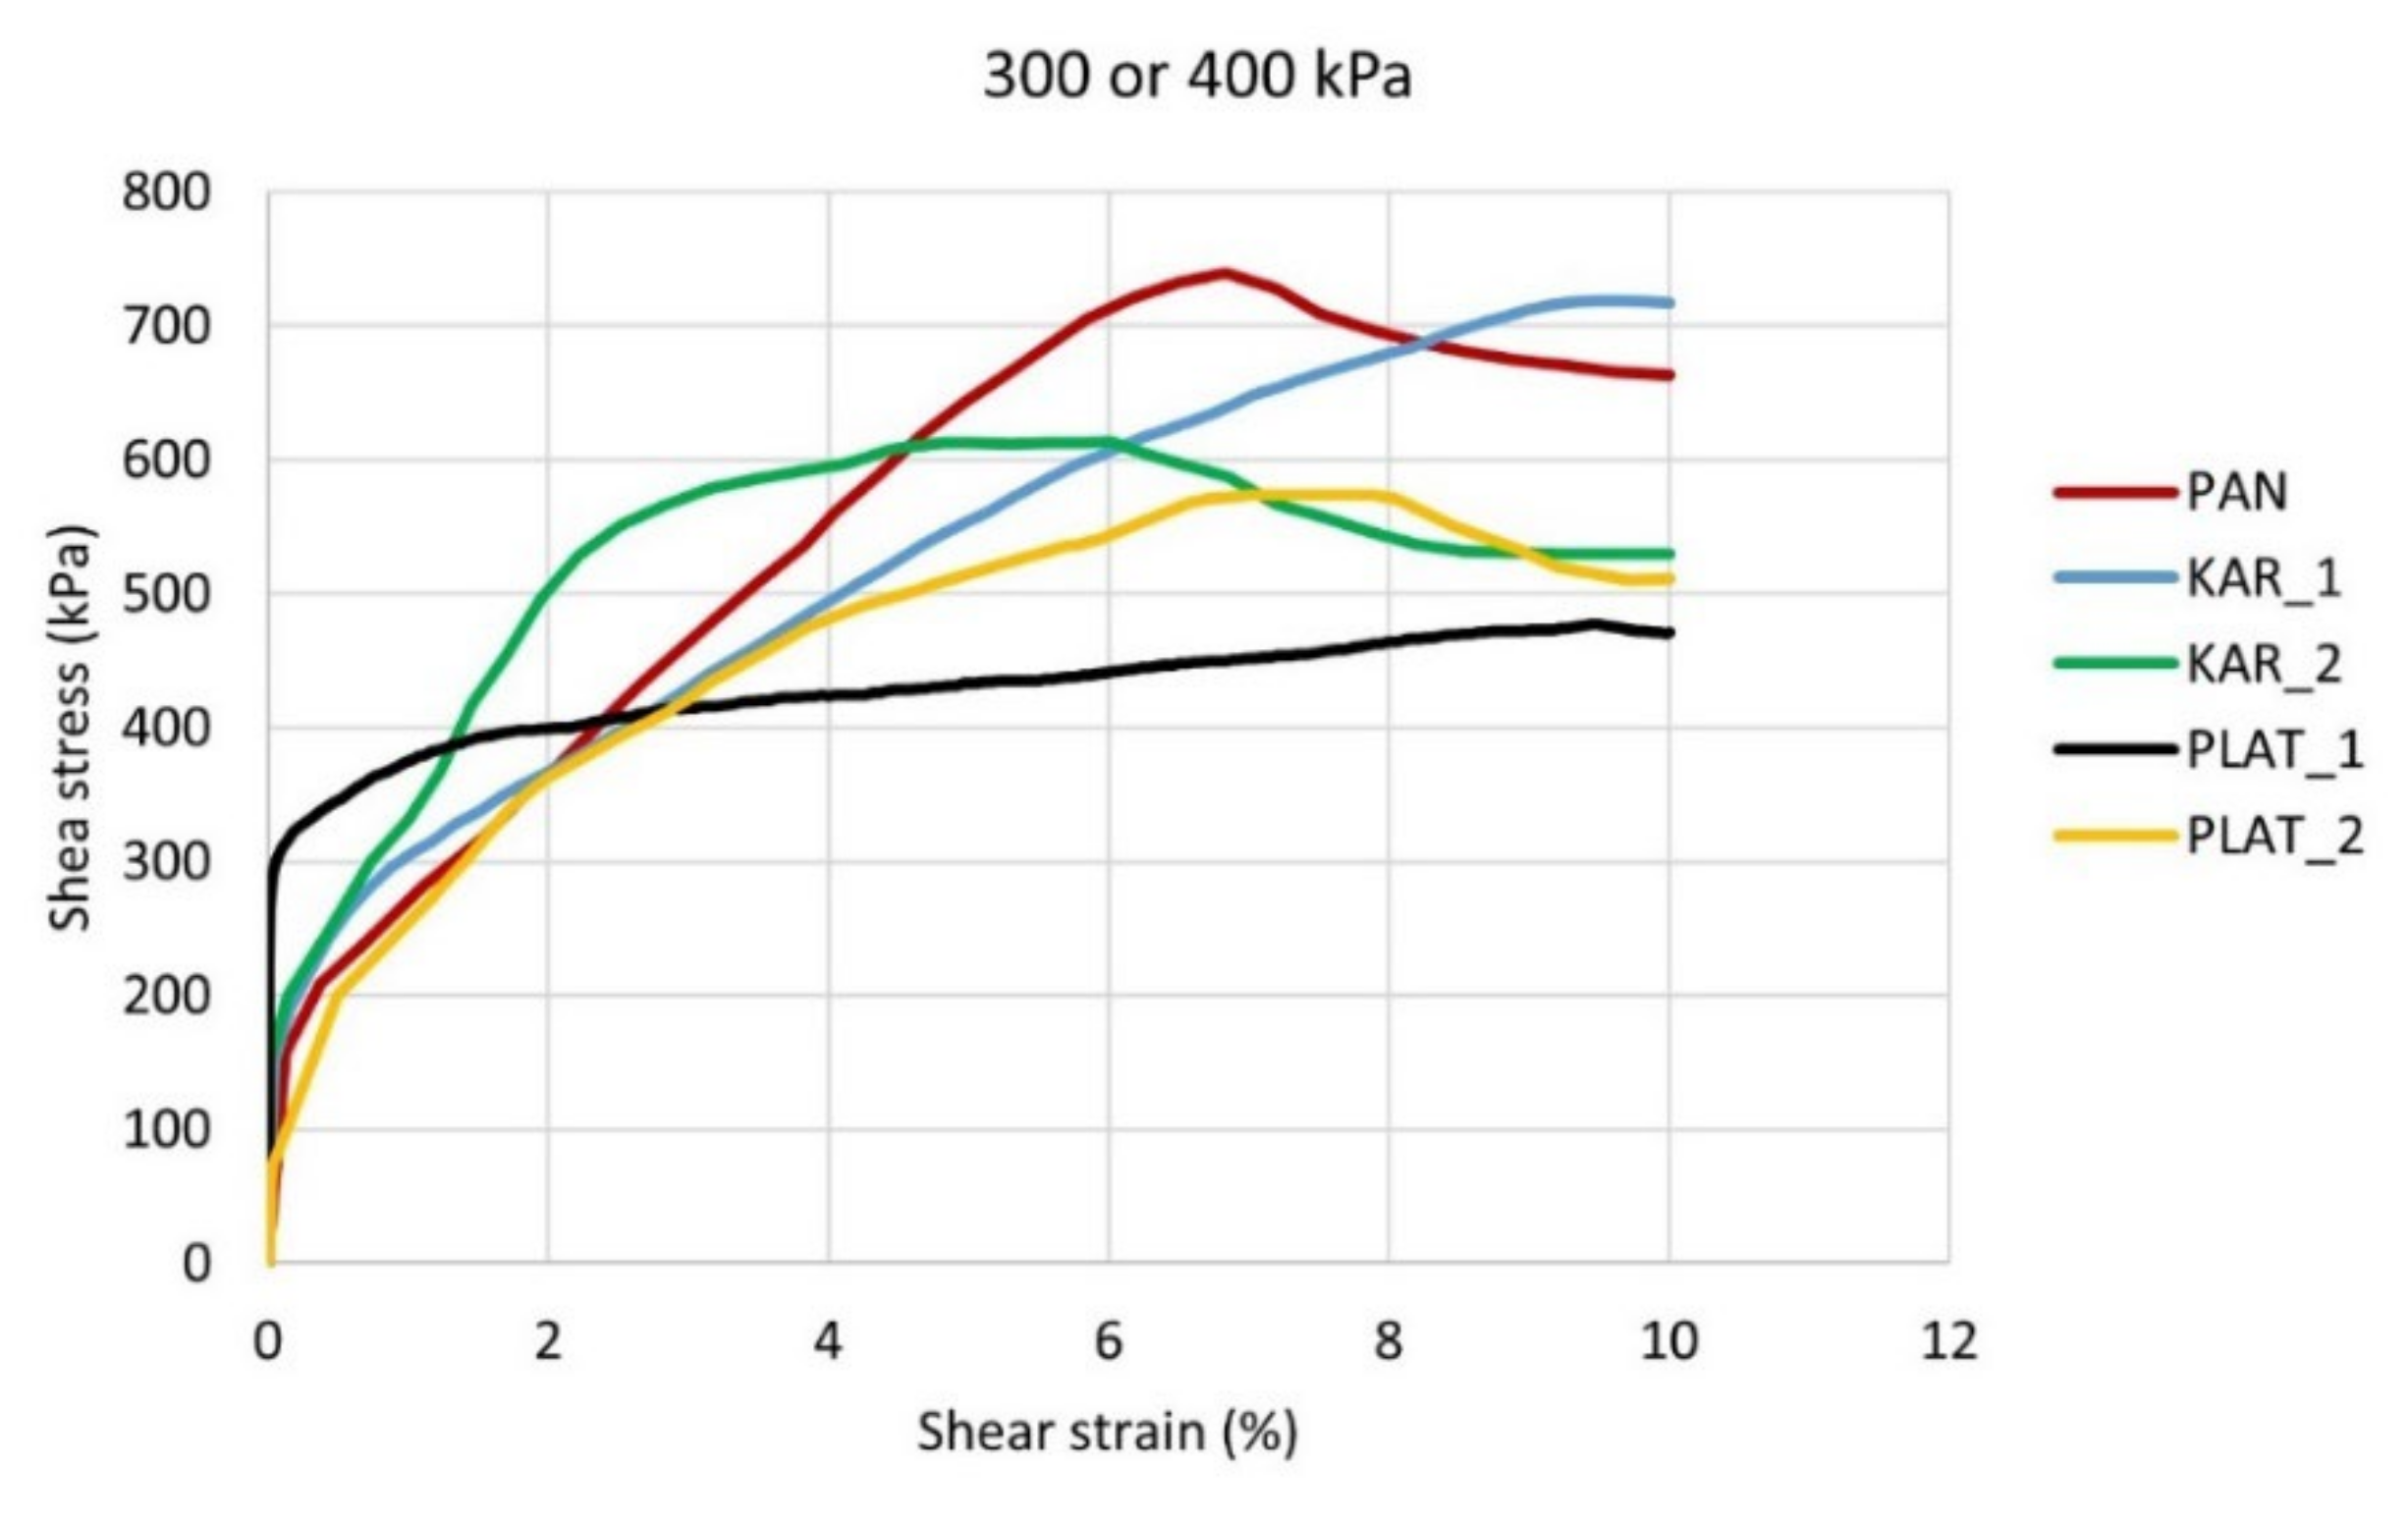
Figure 7.
Large shear failure envelopes of the tested flysch specimens. PAN (a), KAR1 (b), KAR2 (c), PLAT1 (d) and PLAT2 (e).
Figure 7.
Large shear failure envelopes of the tested flysch specimens. PAN (a), KAR1 (b), KAR2 (c), PLAT1 (d) and PLAT2 (e).

Figure 8.
(a) Variation of residual friction angle with effective normal stress (b) residual strength envelops measured by Bromhead ring shear.
Figure 8.
(a) Variation of residual friction angle with effective normal stress (b) residual strength envelops measured by Bromhead ring shear.
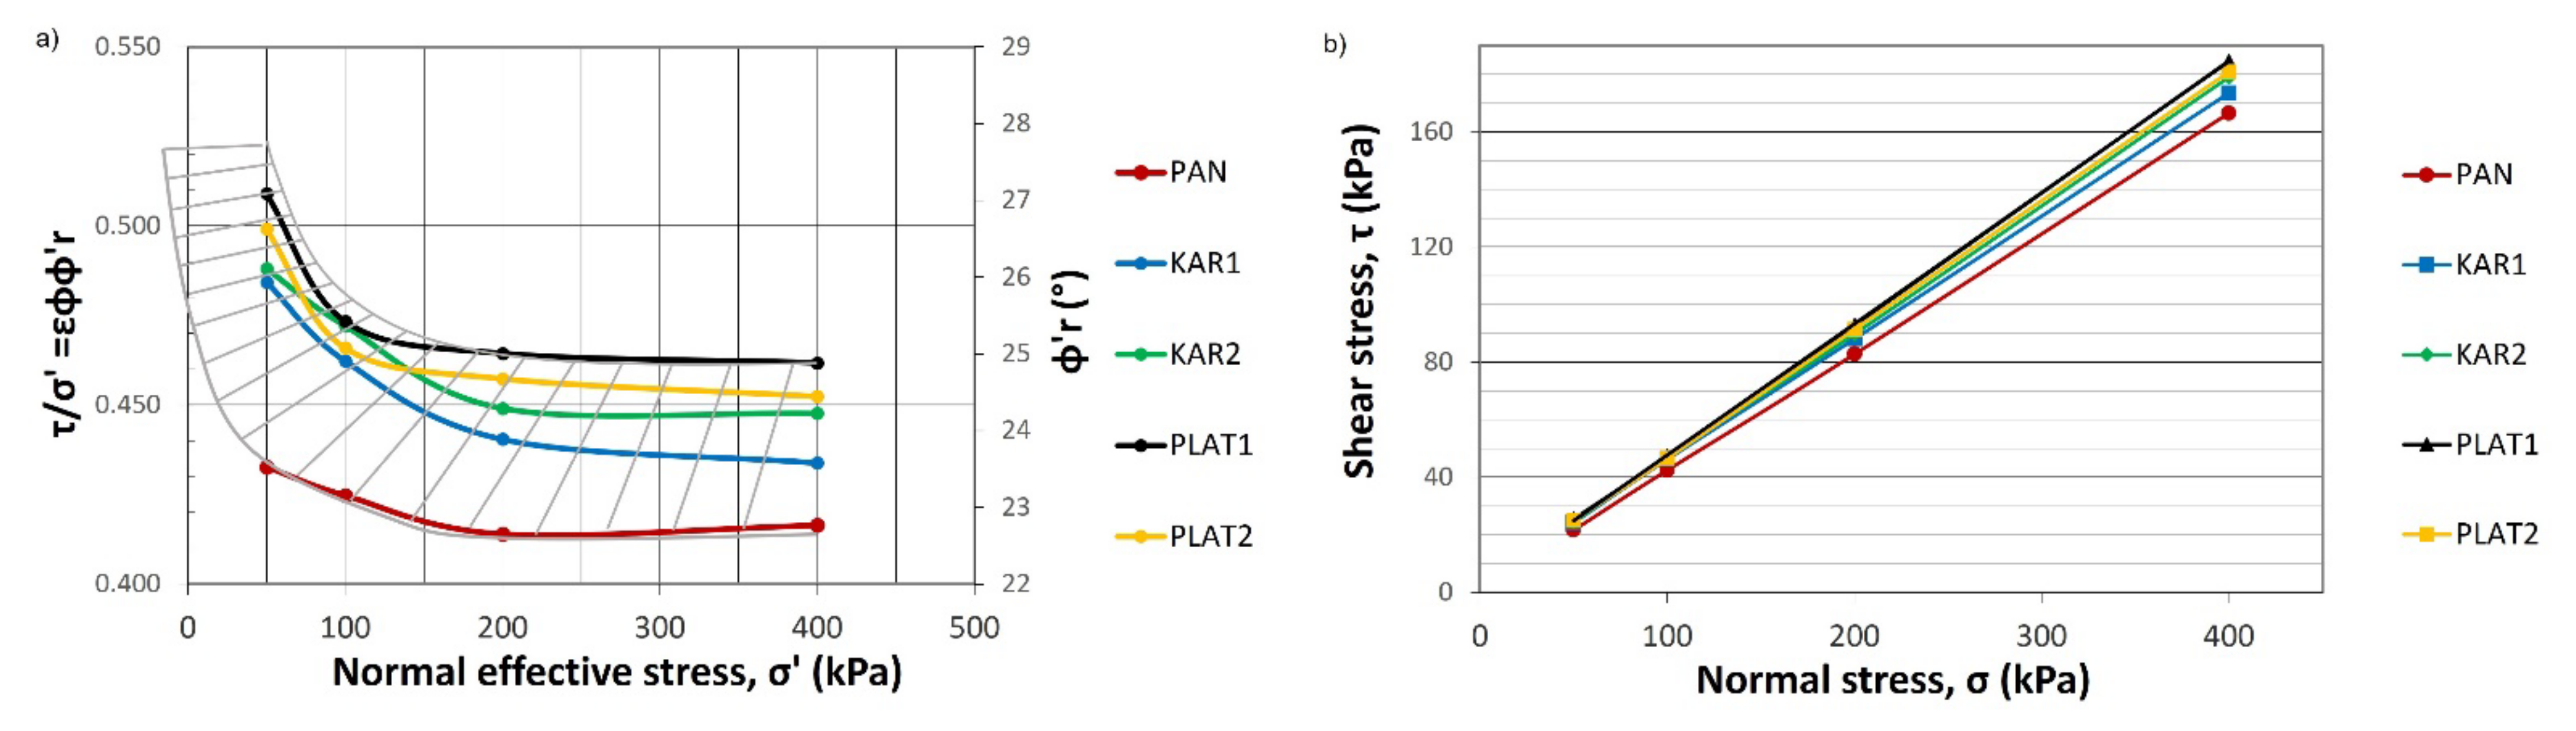
Figure 9.
Large shear (dashed lines) and ring shear (solid lines) failure envelops the flysch specimens in (a) loose saturated, (b) dense saturated, (c) dense partially saturated, and (d) dense optimum conditions.
Figure 9.
Large shear (dashed lines) and ring shear (solid lines) failure envelops the flysch specimens in (a) loose saturated, (b) dense saturated, (c) dense partially saturated, and (d) dense optimum conditions.

Figure 10.
Simplified geotechnical cross-sections of the three studied landslide cases (a) Panagopoula area (PAN), (b) Karya village (KAR), (c) Platanitis area (PLAT).
Figure 10.
Simplified geotechnical cross-sections of the three studied landslide cases (a) Panagopoula area (PAN), (b) Karya village (KAR), (c) Platanitis area (PLAT).

Figure 11.
Sensitivity plot of the angle of friction of the three studied landslide cases.

Table 1.
Geological characteristics and sampling data of the flysch material.
| Site (SYMBOL) | Geological Sequence—Age | Flysch Material Description (SYMBOL) | Sampling Location |
|---|---|---|---|
| Panagopoula coastal area (PAN) | Olonos Pindos—Eocene | Light grey to brownish grey highly sheared and weathered “clayey-silty” flysch (PAN) | rupture surface zone (21–26 m depth) using T6S core barrel |
| Karya village (KAR) | Olonos Pindos—Eocene | Brownish red to dark red highly sheared and weathered “clayey-silty” flysch (KAR1) | rupture surface zone (using a compact excavator) |
| Light grey to grey highly sheared and weathered “clayey-silty” flysch (KAR2) | rupture surface zone (16–22 m depth) using T6S core barrel | ||
| Platanitis area (PLAT) | Gavrovo—Eocene | Yellowish brown weathered “psammitic” flysch (PLAT1) | rupture surface zone (using a compact excavator) |
| Brownish grey weathered “psammitic” flysch (PLAT2) |
Table 2.
Summary of the flysch specimen preparation techniques for the large shear box testing with the unit weight (γ), moisture (w), and void ratio (e) specimen properties in the initial and after shearing stage.
Table 2.
Summary of the flysch specimen preparation techniques for the large shear box testing with the unit weight (γ), moisture (w), and void ratio (e) specimen properties in the initial and after shearing stage.
| Specimen Preparation State | Specimen Preparation Technique | Pre-Consolidation (Initial Stage) | Post Shearing (Final Stage) | ||||||
|---|---|---|---|---|---|---|---|---|---|
| Material Density | Moisture Content | γbi (kN/m3) | wi (%) | ei | γbf (kN/m3) | wf (%) | ef | ||
| loose | (1) Dry | poured material | dried in 100 °C | 13.1–14.0 | dry | 0.84–0.92 | 14.0–16.0 | dry | 0.70–0.88 |
| (2) Fully saturated | poured material | water percolation | 14.2–19.4 | 19.0–21.0 | 0.73–0.86 | 17.2–20.5 | 15.0–21.0 | 0.49–0.80 | |
| dense | (3) Dry | compacted in 3 layers | dried in 100 °C | 14.3–16.2 | dry | 0.60–0.78 | 14.7–17.3 | dry | 0.50–0.76 |
| (4) Optimum | compacted in 3 layers | close to OMC | 18.5–20.3 | 7.2–10.5 | 0.32–0.46 | 19.5–21.7 | 7.0–9.5 | 0.31–0.41 | |
| (5) Partially saturated | compacted in 3 layers | close to OMC + 2% | 18.7–20.4 | 9.5–11.3 | 0.31–0.37 | 19.4–21.3 | 9.0–11.0 | 0.30–0.32 | |
| (6) Fully saturated | compacted dry in 3 layers | water percolation | 18.9–20.5 | 17.0–21.5 | 0.33–0.57 | 16.6–21.3 | 16.0–21.0 | 0.30–0.52 | |
γbi: initial bulk density, wi: initial moisture content, ei: initial void ratio, γbf: final bulk density, wf: final moisture content, ef: final void ratio.
Table 3.
Summary of the physical and mineralogical characteristics of the flysch material.
| Material Classification Tests | Proctor Test | X-ray Diffraction | ||||||||||||
|---|---|---|---|---|---|---|---|---|---|---|---|---|---|---|
| Site-Sample | Fine gravel (%) | Sand (%) | Silt (%) | Clay (%) | WL | IP | USCS Classifi-cation D2487 | Wopt (%) | γd (kN/m3) | Q (%) | Ca (%) | Pl (%) | Sm-Ch (%) | Ill-M (%) |
| PAN | 6 | 53 | 27 | 14 | 21 | 9 | SC | 8.0 | 20.50 | 37 | 39 | 10 | 8 | 6 |
| KAR1 | 3 | 61 | 20 | 16 | 31 | 14 | SC | 8.7 | 20.35 | 50 | 18 | 9 | - | 23 |
| KAR2 | 10 | 57 | 16 | 17 | 33 | 8 | SM | 8.8 | 19.60 | 46 | 23 | 10 | 11 | 10 |
| PLAT1 | 18 | 60 | 12 | 10 | 31 | 9 | SC | 9.0 | 19.95 | 44 | 27 | 9 | 11 | 9 |
| PLAT2 | 15 | 58 | 15 | 12 | 32 | 16 | SC | 9.2 | 19.80 | 33 | 44 | 12 | 8 | 3 |
WL: Liquid Limit, IP: Plastic limit, Wopt: optimum water content, γd: maximum laboratory dry density, Q: Quartz, Ca: Calcite, Pl: Plagioclase, Sm—Ch: Smectite—Chlorite, Ill—M: Illite—Muscovite.
Table 4.
Summary of effective angles of friction of flysch as determined by large shear tests.
| State of Flysch Material | Effective Angle of Friction φ’ (o) | Effective Apparent Cohesion c’ (kPa) * |
|---|---|---|
| Loose-dry | >40 | >100 |
| Dense–dry | >40 | >100 |
| Dense–OPT | 35–40 | >100 |
| Dense–OPT + 2% | 30–35 | 50–100 |
| Dense–saturated | 25–30 | <30 |
| Loose–saturated |
* The term “apparent cohesion” is used because it has been estimated by the intercept of the best-fitted trendlines to the yy’ shear–stress axes. Since no data were available for normal loads lower than 100 kPa, it was not possible to estimate the real material cohesion.
Table 5.
Effective angles of friction obtained by large and ring shear tests.
| Effective Friction Angle (Degrees) | ||||||
|---|---|---|---|---|---|---|
| Large Shear test | Specimen preparation state | Panagopoula area | Karya village | Platanitis area | ||
| PAN | KAR1 | KAR2 | PLAT1 | PLAT2 | ||
| Loose-Dry | 40–60 | |||||
| Loose-Fully saturated | 26 | 30 | 28 | 28 | 26 | |
| Dense-Dry | 45–57 | |||||
| Dense-Optimum | 35 | 36 | 38 | 38 | 40 | |
| Dense-Partially saturated | 35 | 35 | 31 | 33 | 35 | |
| Dense-Fully saturated | 25 | 28 | 25 | 28 | 30 | |
| Ring Shear test (Bromhead) | 22.5 | 23.3 | 24 | 24.6 | 24.1 | |
Publisher’s Note: MDPI stays neutral with regard to jurisdictional claims in published maps and institutional affiliations. |
© 2022 by the authors. Licensee MDPI, Basel, Switzerland. This article is an open access article distributed under the terms and conditions of the Creative Commons Attribution (CC BY) license (https://creativecommons.org/licenses/by/4.0/).
Share and Cite
MDPI and ACS Style
Anagnostopoulou, S.; Depountis, N.; Sabatakakis, N.; Pelekis, P. Large Shear Strength Parameters for Landslide Analyses on Highly Weathered Flysch. Land 2022, 11, 1353. https://doi.org/10.3390/land11081353
AMA Style
Anagnostopoulou S, Depountis N, Sabatakakis N, Pelekis P. Large Shear Strength Parameters for Landslide Analyses on Highly Weathered Flysch. Land. 2022; 11(8):1353. https://doi.org/10.3390/land11081353
Chicago/Turabian StyleAnagnostopoulou, Sofia, Nikolaos Depountis, Nikolaos Sabatakakis, and Panagiotis Pelekis. 2022. "Large Shear Strength Parameters for Landslide Analyses on Highly Weathered Flysch" Land 11, no. 8: 1353. https://doi.org/10.3390/land11081353
Note that from the first issue of 2016, this journal uses article numbers instead of page numbers. See further details here.