
Urbanization Influences CO2 Emissions in the Pearl River Delta: A Perspective of the “Space of Flows”
by
 , ,
, ,
Yabo Zhao
1,2, 
Ruiyang Chen
2,
Tong Sun
2,
Ying Yang
3,
Shifa Ma
2,
Dixiang Xie
2,
Xiwen Zhang
2 and
Yunnan Cai
2,* 1
Key Laboratory of Urban Land Resources Monitoring and Simulation, Ministry of Natural Resources, Shenzhen 518034, China
2
School of Architecture and Urban Planning, Guangdong University of Technology, Guangzhou 510090, China
3
Data Management Center of Planning and Natural Resources of Shenzhen, Shenzhen 518034, China
*
Author to whom correspondence should be addressed.
Land 2022, 11(8), 1373; https://doi.org/10.3390/land11081373
Submission received: 7 July 2022
/
Revised: 5 August 2022
/
Accepted: 11 August 2022
/
Published: 22 August 2022
(This article belongs to the Special Issue Urban Planning Pathways to Carbon Neutrality)
Abstract
:As the largest carbon emitter in the world, China is facing increasing challenge to reduce CO2 emissions. Given this issue, exploring the influencing factors is of great significance for scientific low-carbon emission policymaking. Although previous literature has explored the effects of urbanization on CO2 emissions, the impact of the space of flow on urban carbon emissions have been less explored. Due to the increasing connection between cities, its impact on urban carbon emissions cannot be ignored. Thus, this paper takes the space of flows into account as an aspect of urbanization to supplement the existing literature and empirically examines the multiple effects of urbanization on CO2 emissions in the Pearl River Delta (PRD) urban agglomeration. By using a STIRPAT model, statistical data, and web crawler data, we examined impacts of different types of urbanization on CO2 emissions. Our empirical results show that: (1) Within the PRD urban agglomeration, urban linkage intensity is strongly connected to urban socioeconomic growth, establishing a geographical structure with Guangzhou and Shenzhen as the double core. (2) Our results show that urbanization exerts two opposite effects on CO2 emissions: positively connects carbon emissions with population urbanization, integrated urban linkage flow, and energy intensity, whereas economic urbanization and social urbanization are shown to be negatively correlated. However, spatial urbanization has no significant positive effect on urban CO2 emissions. (3) It is worth noting that urban linkage flows are the second most important factor affecting urban carbon emissions after economic urbanization. Our study could formulate effective planning suggestions for future CO2 emission reduction paths and development modes in the PRD.
1. Background of the Study
In promoting soaring energy consumption levels, processes of rapid urbanization raise a range of environmental concerns, not least with respect to the radical increases that have been witnessed in CO2 emissions globally. Increasing levels of atmospheric greenhouse gases—particularly CO2—constitute the major impact factor in global warming, which now poses a great threat to nature and the planet [1]. The issue of global warming has attracted widespread attention around the world.
Since 2006, China has been the world’s largest carbon emitter and is considered a region for international carbon reduction efforts [2]. According to the “Statistical Review of World Energy 2021,” which is published by Beyond Petroleum (BP), China’s carbon emissions increased from 7.71 billion tons in 2009 to 9.90 billion tons in 2020, an increase of 30.7% which places the country first in the world in terms of emissions growth [3]. In order to demonstrate its determination to achieve coordinated eco-environment and economic development, the Chinese Government has committed to reductions to the extent that “CO2 emissions per unit of GDP in 2020 will be reduced by 40–45% compared to 2005” [4]. It is not only emissions that have risen dramatically in recent decades: China’s urbanization level has grown rapidly, increasing from 17.9% in 1978 to 63.89% in 2020, with an average annual growth rate of more than 1%. Rapid urbanization of this kind brings with it a series of problems, including an intensification of production and living activities that has resulted in increased fossil energy consumption and thus increased carbon emissions [5,6]. Recognizing that urbanization constitutes the core unit of regional economic and social development, the question of how to achieve carbon emission reduction while ensuring continued, albeit low-carbon, urban development has become a focal issue in China. The relationship between urbanization and CO2 emissions has been extensively discussed by scholars around the world [7]. Previous findings have shown that urbanization has different degrees and types of impacts on energy consumption and CO2 emissions through mechanisms that operate at different scales and in different regions [8,9,10,11]. The impact of urbanization on CO2 emissions also varies according to its rate and quality [12,13]. Thus, further study of urban carbon emissions is imperative to meeting this challenge: in fact, if China is to meet its carbon reduction targets, the mechanism that links urbanization to carbon emissions must be uncovered. This knowledge would also be invaluable in guiding international responses and cooperation on matters of climate change.
The issue of urban carbon emissions has been extensively discussed by scholars, and this research has taken a range of different directions. The existing literature that addresses Chinese emissions can be divided into a number of categories, including studies which have addressed, variously: the impact of urbanization on carbon emissions [14,15], the drivers and mechanisms of urban carbon emissions [16,17], the analysis and prediction of carbon emission scenarios [18,19], the path of carbon emission reduction and policy proposals [20,21], the effect of energy consumption and type on carbon emissions in China [22,23], the externalities problems from carbon emission [24], and regional differences in carbon emission efficiency between Chinese cities [25,26].
When considering this body of work, we note that whilst identifying the driving mechanisms and factors behind carbon emissions is key to formulating emission reduction policies and implementing scenario simulations, no uniform conclusions have yet been reached. This is not to say that studies have not addressed the relationship between different drivers and carbon emissions—for example, we note that Solarin et al. [27] found a stable long-term equilibrium relationship between the level of urbanization and carbon emissions, and previous research has shown that the driving factors of carbon emissions include population structure [28], GDP [29], industrialization [30], energy consumption [31], urbanization level [32], and land-use change [33]. The study methods employed include least order squares [34], the STIRPAT model [35], the LMDI model [36], vector autoregressive models [37], geographically weighted regression models [38], and multiplier effects [39]. The action pathway of carbon emission increases and the countermeasure of carbon emission reductions have both been explored, among others, by Tan et al. [40], who predicted the CO2 reduction potential of Chongqing and analyzed its low-carbon transition path, proposing that improving technology, increasing energy efficiency, optimizing energy input structures, and adjusting the industrial structure are the most effective strategies in achieving Chongqing’s carbon emission reduction target. Furthermore, Zhang et al. [41] empirically investigated the impact of fiscal decentralization on environmental functional mechanisms using panel data from 29 Chinese provinces; these scholars found that the impact of fiscal decentralization on environmental policies significantly varies across geographic regions and municipalities, as a result recommending that improvements be made to the institutional environment by incorporating the reduction of emissions into the local government performance assessment system.
The relationship between urbanization and carbon emissions in urban agglomerations is becoming a hot topic in urban geography research. For example, Wang et al. [42] found that urbanization affects CO2 emissions in two, albeit opposite, ways: while land urbanization, economic urbanization, and social urbanization were shown to exert positive effects on emissions, population urbanization had a negative effect on CO2 emissions. It is worth noting that the industrial structure and social consumption were found by these scholars to have exerted a positive but not significant effect on CO2 emissions in the Pearl River Delta. The significant positive effect of energy intensity, on the other hand, suggests that lower energy efficiency tends to increase emissions. In contrast, Zhang et al. [43] empirically measured a city-level “total factor carbon emission efficiency index” (TCEI) at different stages of urbanization using dynamic panel data for four typical urban agglomerations in China from 2006 to 2016. They found the TCEI of these urban agglomerations at different urbanization stages to increase year by year, indicating that increasing economic development and the urbanization level will help to achieve low carbon development in specific urban agglomerations. The optimization of the industrial structure and making improvements to the ecological will in turn help to curb carbon emissions.
While scholars have also made in-depth studies on the relationship between urbanization and carbon emissions, there remain some disagreements on the nature of this relationship, and views tend to conform to three distinct types, each of which respectively support the presence of a driving effect, an inhibiting effect, or uncertainty regarding the effect of urbanization on carbon emissions. Sadorsky et al. [44] analyzed over 80 countries in the last 20 years in order to determine the influence of demographic factors on pollution emissions, pointing out that the level of carbon emissions in cities would increase with increases in their urbanization level. Tang et al. [45] found the carbon emission trading system on land use transition would affect China’s CO2 emissions peak. In contrast to the above studies, Martinez-Zarzoso et al. [46], using urban population data for 88 developing countries over the last 30 years, found an “inverted-U” relationship between urban population density and carbon emissions. Poumanyvong et al. [7] selected 99 countries and regions around the world, classifying them by income level; these scholars found that the impact of urbanization on carbon emissions varied by income. While they were able to show that for countries in the middle-income range, urbanization increases carbon emissions significantly, they were unable to confirm the exact relationship between urbanization and carbon emissions for the sample of low-income countries.
The flow space was originally proposed by Castells as a space of flow interactions [47]. It can reveal the connection of flow between regions. At present, most of the research on flow space is focused on regional spatial structure, theoretical research, and the application of “flow” data. Zhong et al., constructed a weighted directed graph based on tourism flow data, which can reveal the spatial structure of urban movement [48]. Roth et al., use personal mobility data from the London Underground to reveal the structure and organization of the city; the results of their study show that intra-city mobility patterns are quantitatively highly heterogeneous and that there is a polycentric structure consisting of large flows [49]. Shen et al., believe that flow space is a space built around the flow of elements such as human, logistics, capital, technology, and information flow, which is supported by information technology-based network flow lines and rapid traffic flow lines to create a purposeful, repeated, and programmable dynamic movement [50]. Based on the above research, this paper considers flow space as a networked dynamic space which is built around the exchange of people, logistics, and information flow between cities with information network and transportation network as the carrier.
Previous studies on the mechanism linking urbanization and carbon emissions have accomplished much and led to a rich range of results, which provide the theoretical basis and practical experience for this paper. These existing studies, however, have tended to ignore the interconnections between cities within urban agglomerations, instead treating urban agglomerations as static systems. Spaces of flows is a notion first introduced by Manuel Castells, who defined it as the material organization of time-sharing social practices that work through flows [51]. As China’s cities step into a new stage in their urbanization, the rapid development of modern transportation, communication technology, and other technologies make the connection between cities increasingly close—the resulting flows of people, goods, and information between cities will also have an impact on urban carbon emissions. Therefore, this paper selects the Pearl River Delta (PRD) urban agglomeration, with its strong inter-city linkages, especially the high-intensity, high-velocity, and high-frequency flow of multiple elements within it [52], as a research case and adds the indicator of “comprehensive urban linkage flow.” Establishing indicators across four dimensions, the study aims to explore the relationship between urbanization and carbon emissions and identify the mechanism at work in the impact of new urban development on carbon emissions.
The remainder of this article is organized according to the following structure. In Section 2, the study area, the data source and processing, and the methodology are introduced. In Section 3, the results of urban linkage intensity and the regression results of STIRPAT model are analyzed. Finally, the conclusions and policy implications are presented in Section 4.
2. Materials and Methods
2.1. Study Area
The PRD urban agglomeration forms the study area addressed in this paper. The region is located in the south of China and is one of the most dynamic economic regions in the Asia-Pacific region (Figure 1). The PRD urban agglomeration includes nine cities—Dongguan, Foshan, Guangzhou, Huizhou, Jiangmen, Shenzhen, Zhaoqing, Zhongshan, and Zhuhai.
The PRD urban agglomeration was one of the regions established in the early stages of China’s reform and opening-up policy and is an important economic center. It covers an area of about 55,368.7 km2—accounting for less than one third of the province’s area; in 2019, it gathered 53.35% of the province’s population and 79.67% of its GDP. The PRD urban agglomeration holds an important position in China’s national economic and social development as well as in the overall reform and opening up of the country.
2.2. Data Source and Processing
The data used in this study primarily took the forms of inter-city flow data, urbanization index data, and carbon emission data.
2.2.1. Urban Flow Data
City Passenger Flow
Since passenger flows between cities mainly occur through roads and railroads, we chose to use the passenger frequency of high-speed rail, ordinary trains, and intercity buses in order to calculate population movement between cities in the PRD. The data was mainly obtained by web crawling the bus schedules published on the 12306 websites (https://www.12306.cn (accessed on 7 June 2019)) and the passenger stations in each city using the software Python. We selected the average daily frequency of high-speed trains, trains, ordinary trains, and intercity buses between cities in 2019 to represent the traffic flow data between cities. Passenger trips were converted into passenger flow data. Since different modes of transportation have different carrying capacities, different passenger capacities were assigned to them. Passenger cars are standardized to carry 50 people, and ordinary trains are standardized to carry 1 soft sleeper, 8 hard sleepers, and 8 hard-seat cars, in total carrying 1200 people. Dynamic and high-speed trains are made up of a first-class car comprising of 4 sections and a second-class car comprising of 5 sections, carrying 600 people as the standard [53].
Traffic volume was defined using the following formula:
In the formula, Mij represents the connectivity of the city passenger flow network from city i to city j; Rij represents the connectivity of the city passenger flow network between city i and city j; and Aij, Bij, Cij, and Dij denotes the daily average intercity bus frequency, ordinary train frequency, moving train (subway) frequency, and high-speed rail frequency from city i to city j, respectively. The results of this calculation were used for the final construction of the city’s passenger flow linkage matrix (Table 1). The connection matrix is a matrix that represents the strength of the linkage between cities, with larger numbers in the matrix representing stronger linkages between two cities.
Logistics Flow
Logistics flow is the process of moving an object entity from one location to another. In the flow space, data from express sites can be used to calculate the level of logistics between regions, representing the frequency of flow of items. In this paper, 12 mainstream logistics companies—SF, CaiBird, Best, Debonair, Annen, China Tong, and Shunxin—were selected as research subjects. We obtained logistics flow data mainly by using Python to crawl the logistics routes between cities in the PRD urban agglomeration in 2019 using the Alibaba logistics network (https://x56.1688.com/56home/home.htm (accessed on 7 June 2019)). Drawing on the method proposed by Taylor for studying the world city network, the score value of a logistics outlet in city i, denoted by Xia, is defined as the importance of a logistics outlet in the whole network [54]. The calculation of the logistics linkage is expressed as:
Rij denotes the degree of logistics connection between two cities, city i and city j:
Finally, the logistics linkage matrix of the PRD urban agglomeration was constructed (Table 2).
Information Flow
With the development of communication technology, the internet has become an important communication channel between cities. In fact, the flow of information between cities within an urban agglomeration occurs mainly through the internet. This can be represented in a number of ways, but we used the Baidu index city search volume, which is able to visually show the information exchange status between cities. In this paper, the average daily search volume of Baidu users among cities in the PRD in 2019 was obtained using the keywords of each city in the PRD in the Baidu index interface. A city information connection flow matrix was constructed from the data [55]. The formula for calculating the information linkage flow between cities is as follows:
Ab in the formula is the search volume of city Baidu users to city A; Ba is the search volume of city A Baidu users to city B; and Rij is the information flow network connection degree between city i and city j. We used the results of this calculation in order to construct the city information flow connection matrix (Table 3).
Flow Data Integration Processing
We then normalized the three sets of data from the flow contact matrices described above using the following equation:
In the formula, x is the original data; Min is the minimum value of the matrix data; Max is the maximum value of the matrix data; and X is the normalized data. The standardized X indicates the degree of inter-city linkage—the higher the value, the stronger the inter-city linkage.
Summation of normalized data was used to express the intensity of urban linkage flows:
In the formula, Ri denotes the strength of linkage flow of city i and Rij is the degree of network connectivity between city i and city j. In order to study the spatial structure of integrated flow urban agglomerations, with reference to Liu [56], all factor flows were considered equally important with a weight of 0.33.
2.2.2. Urbanization Index Data
Drawing on the results of the existing comprehensive measurement index system [9,12,25,52,57,58], and following the principles of systematicity, completeness, validity, scientificity, and operability, it was summarized into four aspects from the connotation of the concept of urbanization: (1) Population urbanization indicators mainly reflect the process of population concentration in urban areas, including the proportion of urban population, population density, and the number of people employed in secondary and tertiary industries. (2) Economic urbanization indicators mainly reflect the transformation of economic structure into non-agricultural, including GDP per capita, the proportion of output value of secondary and tertiary industries, and the proportion of research and development investment in regional GDP. (3) Social urbanization indicators mainly reflect the change of lifestyle, including total social consumption, per capita electricity consumption, and the proportion of college students. (4) Spatial urbanization index. mainly reflects the process of change of geographical landscape. Specifically, it includes the proportion of built-up area and paved road area per capita. These four indicators are interrelated and distinct, aiming to reflect the comprehensive level of urbanization process (Table 4).
All data on new urbanization that we used in the evaluation system were taken from the Statistical Yearbook of Guangdong Province 2019 and the Statistical Yearbook of Urban Construction of China.
Each variable is described in Table 5.
2.2.3. Carbon Emissions Data
The carbon emission data refer to the study of Wang et al. [59], which accounted for the carbon emission of energy consumption with urban energy consumption data according to the IPCC [60,61] greenhouse gas emission inventory, followed by obtaining the nighttime lighting data within the city and counting the total nighttime lighting values based on the DMSP/OLS nighttime lighting images, and then fitting and analyzing them with the corresponding carbon emission statistics, which were simulated and inverted from the nighttime lighting images.
2.3. Methodology
2.3.1. The Entropy Method
Based on the index system of urbanization, the present paper constructs a comprehensive index system of urban carbon emissions. This was done by combining urban linkage flow and urban energy consumption intensity. The index system can be used to analyze the influence of different dimensional indicators on carbon emissions.
In consideration of the different importance of different dimensional indicators in the system, we selected the entropy method in order to calculate the weight index of each indicator. The entropy value method was used to calculate the entropy weight based on the information entropy of each dimensional index. Finally, the weights of each index were corrected using entropy weights, allowing more accurate and objective weighting results to be obtained [58].
The entropy value method is calculated as shown below:
In evaluating the six dimensions of population urbanization, economic urbanization, social urbanization, spatial urbanization, energy consumption intensity, and comprehensive urban linkage flow intensity, each dimensional index Uk was calculated as follows:
In formula (8), Xkj denotes the normalized indicator data and gj denotes the differentiation index of indicator j at that time. Accordingly, the weights of each dimension of the carbon emission index system were able to be obtained (Table 6).
2.3.2. STIRPAT Extension Model
York et al., originally developed the Stochastic Impacts by Regression on Population, Affluence, Technology (STIRPAT) [62] model, an extension of the IPAT model, in order to introduce random variation variables based on the previous model and in this way overcome the shortcomings of the original model.
The formula is as follows:
In practice, it is usually used in its logarithmic form:
In the formula, b, c, and d denote the elasticity coefficients of the population, affluence, and technology level, respectively, and e is the random error term.
Based on the STIRPAT model, in this study, we analyzed the effects of different urbanization and integrated urban connectivity on carbon emissions. When the calculated urbanization index variables for each dimension are substituted into the extended model, the model becomes:
In the formula, I denotes total carbon emission, PU denotes population urbanization, EU denotes economic urbanization, SU denotes social urbanization, LU denotes spatial urbanization, UC denotes urban integrated correlation, and EN denotes urban energy consumption intensity.
3. Results
3.1. Urban Linkage Intensity Analysis
After processing and normalizing the linkage intensity data for each city within the PRD urban agglomeration, we were able to obtain the city integrated linkage flow intensity (Figure 2).
Generally speaking, the core cities in the PRD urban agglomerations (e.g., Guangzhou, Dongguan, Shenzhen, etc.) have relatively consistent linkage intensities in relation to city passenger flows, logistics flows, and information flows. However, differences can be identified in the intensity of linkages between different cities located in peripheral areas. Guangzhou and Shenzhen are the top two cities in the urban agglomeration from the perspective of the intensity of city-integrated linkages, followed by Dongguan and Foshan. Among these cities, Guangzhou displayed the highest integrated linkage flow intensity and Jiangmen the lowest; the value of the former is 9.03 times higher that of the latter. Guangzhou and Shenzhen together form the center of gravity of the national economy as well as a world trade center and an international integrated transportation hub. They have a dominant position in terms of information interaction and transportation links. These two cities form a dual-core network linkage structure in the PRD urban agglomeration. At the same time, different types of mobility within the urban agglomeration exhibit different structural characteristics:
- (1)
- The population movement between Guangzhou and Shenzhen is the closest in network formed by passenger flow linkages between cities. Guangzhou and Shenzhen are closely linked to each other in terms of economy and information. The traffic flow between them far exceeds that between other cities, e.g., the average frequency of the high-speed train between the two cities is 6 shifts/hour. Guangzhou and Shenzhen form the most important urban passenger connection axis within the urban agglomeration, and they account for 18.8% of the total passenger flow in the PRD urban agglomeration.
- (2)
- In the network formed by logistics flow linkages between cities, Dongguan-Guangzhou is shown to be the strongest linkage. In terms of the strength of logistics flow linkage strength of individual cities, Dongguan has the highest value. The reason for this lies in the city’s e-tailing industry, which drove the development of the city’s economy and networks, opening up a variety of available service channels for the logistics flow industry. As an important commodity production base in the PRD urban agglomeration, Dongguan has thus witnessed rapid development in urban logistics. The logistics flow link between Dongguan and Guangzhou alone accounts for 10.4% of the total volume of the PRD urban agglomeration.
- (3)
- In the information flow linkage network, Shenzhen-Guangzhou, Shenzhen-Dongguan, and Guangzhou-Foshan have the three highest inter-city information flow intensities; together, they account for 43% of the total regional intensity. From a geospatial location perspective, the information exchange links within the PRD urban agglomeration tend to cluster along the Pearl River Estuary. With its high level of economic vitality, Shenzhen ranks first in terms of overall information linkage intensity—the city’s rapid development has allowed Shenzhen to gradually surpass Guangzhou in terms of information linkage flow intensity. Shenzhen is the core city of the PRD urban agglomeration, with an increasing number of internet users and increasing degree of informatization. Topics about Shenzhen often trigger discussions among internet users in different cities on the Internet. Hot topics, such as soaring house prices and technological development in Shenzhen, push internet users in different cities to learn about Shenzhen through online channels.
- (4)
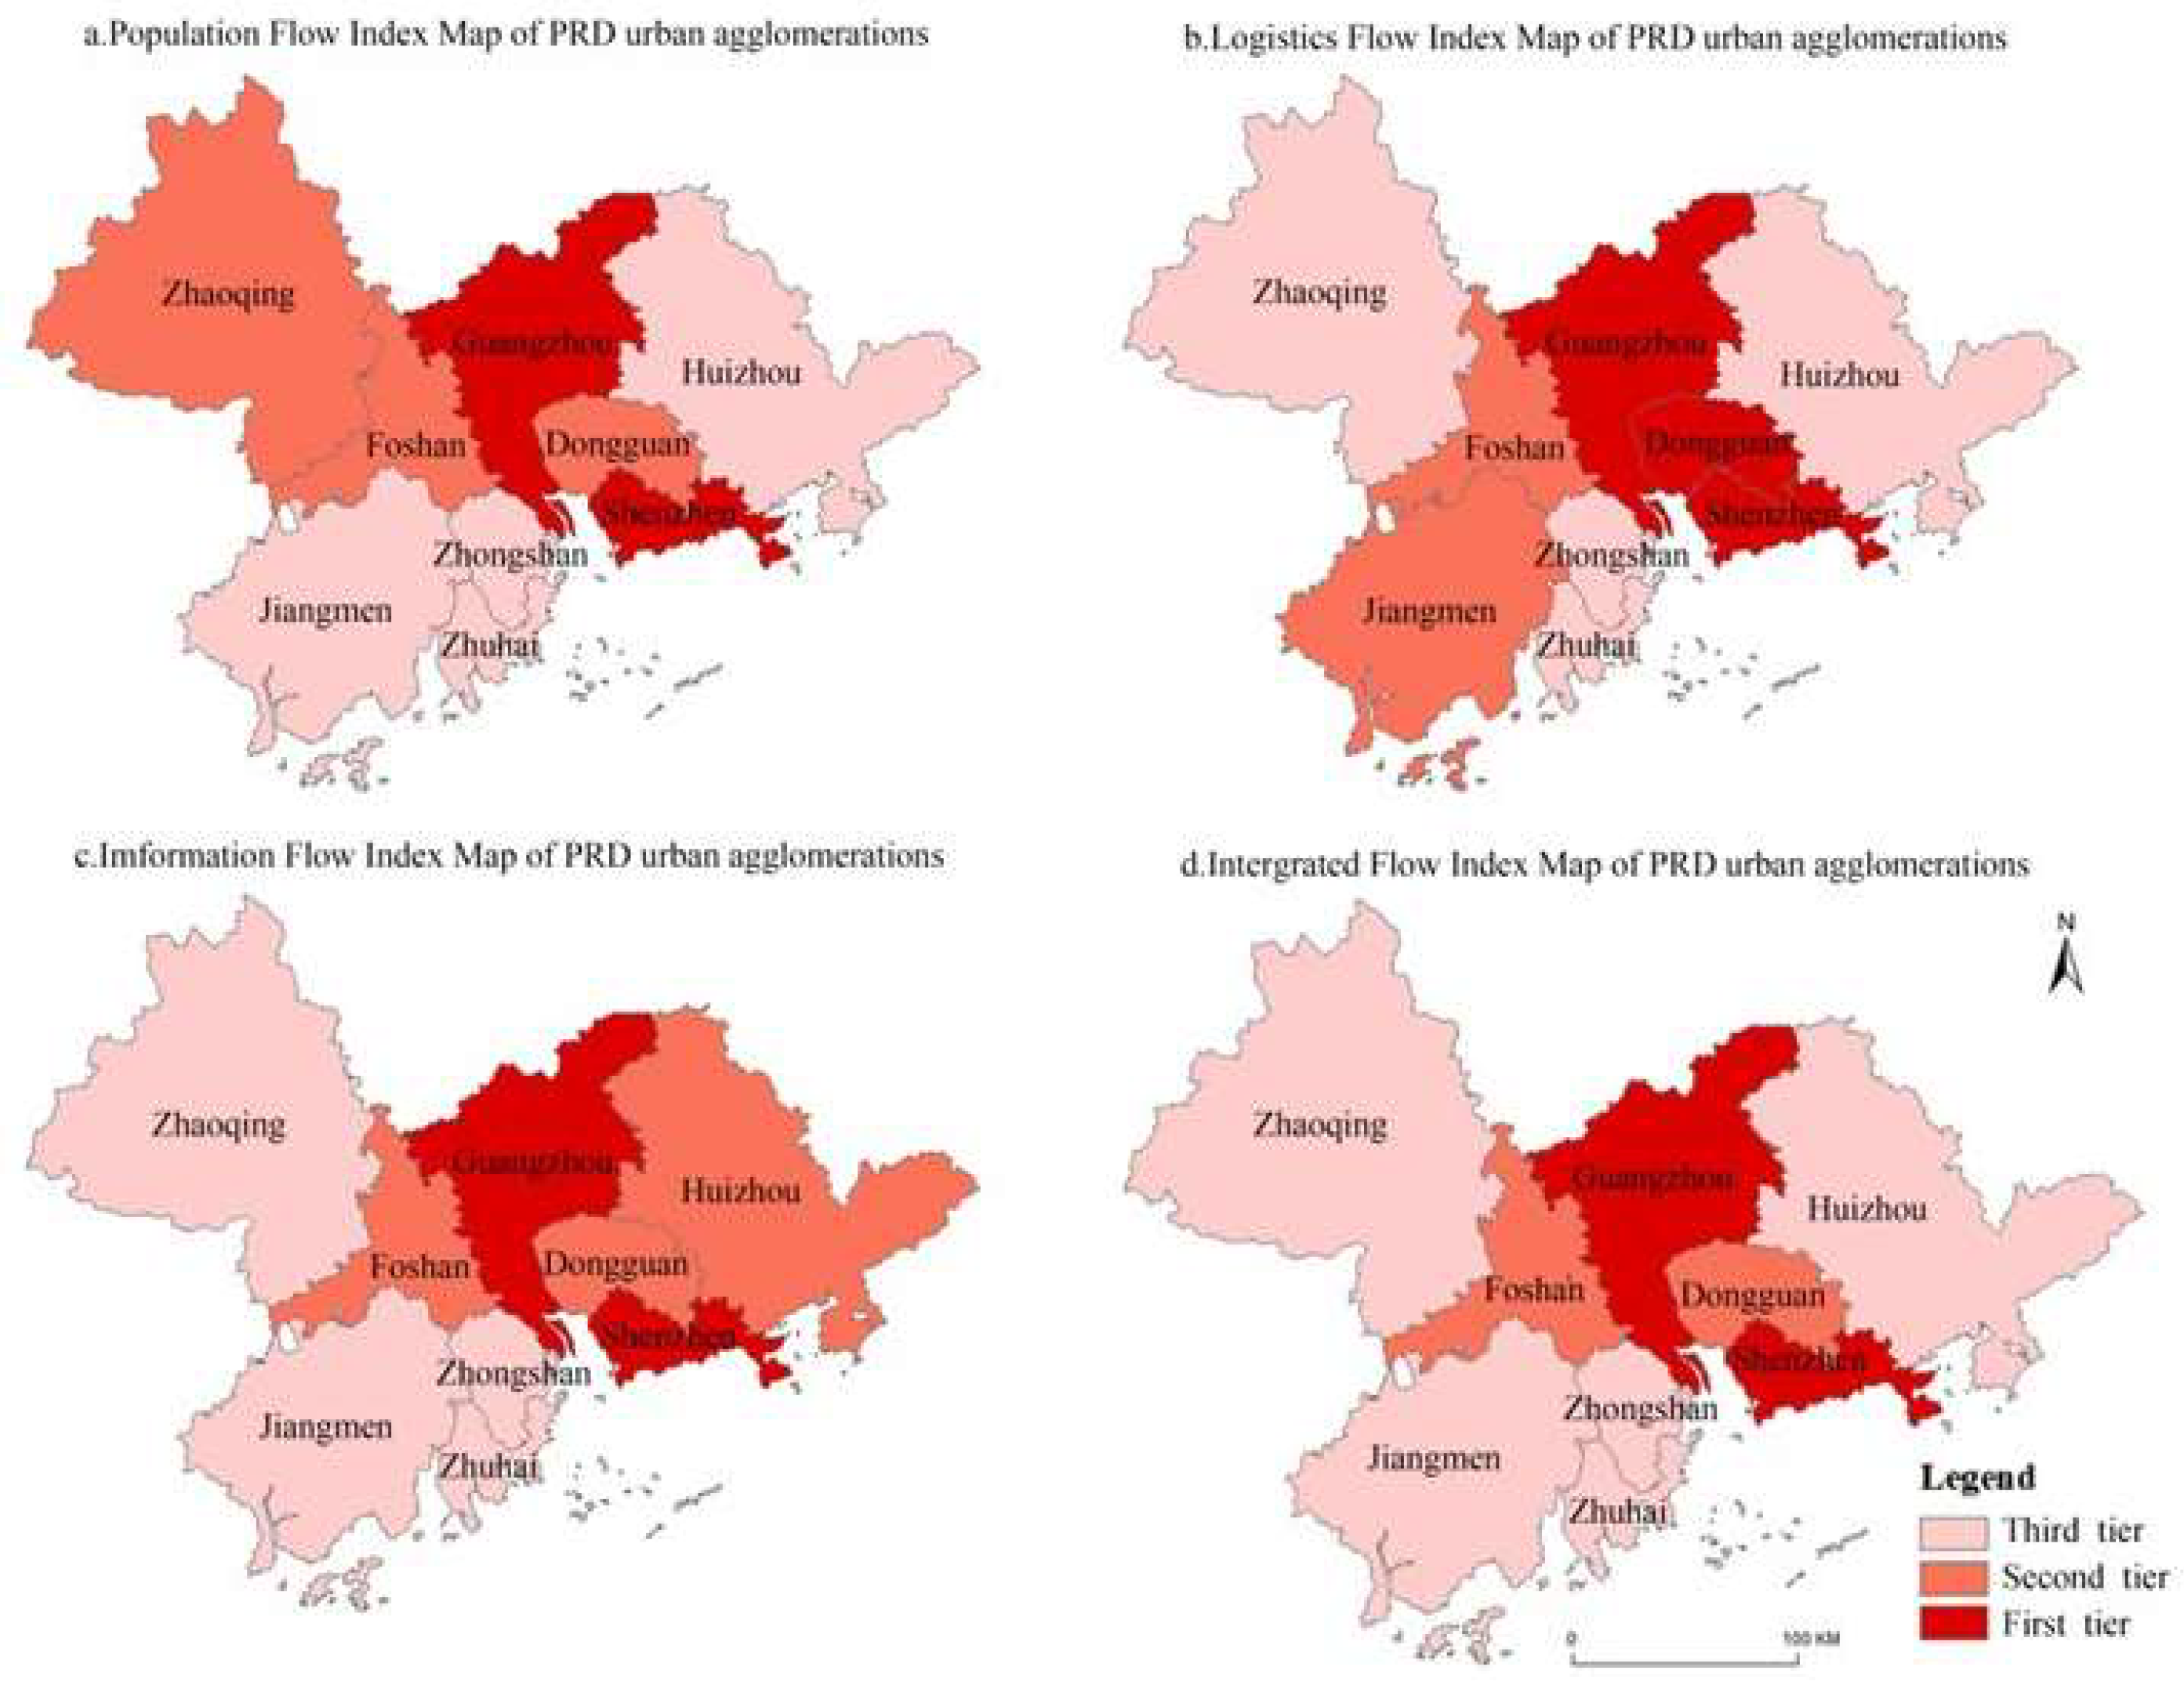
- The intensity of linkage flows in the PRD urban agglomeration can be divided into three tiers (Figure 3). Guangzhou and Shenzhen occupy the core position and in the three tiers of urban passenger flow, logistics flow, and information flow division, both cities belong to the first tier, although Shenzhen’s position is relatively lower than that of Guangzhou. Dongguan and Foshan are in the second tier of the city linkage flow hierarchy. Dongguan is ranked in the first tier of the logistics linkage hierarchy. The cities in the urban tier of all connected flows are basically the same. In addition, cities place within different tiers for the different flow types. For example, Zhaoqing has stronger passenger flow linkages and is in the second tier, while in terms of logistics flow and information flow, it is located within the third tier. Jiangmen has relatively stronger logistics flow connections, which also reflects the diversity of development and the difference of relative advantages of different city flow types. From the perspective of the integrated flow of the cities studied, the PRD urban agglomeration shows a distribution pattern of “two cores—multiple centers.”
Compared to Dongguan and Foshan, Zhaoqing, and Jiangmen are further away from the urban agglomeration center. They receive relatively less radiation from the core of the urban agglomeration.
3.2. Analysis of Regression Results of STIRPAT Model
The regression results of the STIRPAT model showed that the model had a decidable coefficient R² of 0.999 and the Durbin–Watson value of 2.263. The Durbin–Watson value refers to a test statistic proposed by Durbin and Watson for the autocorrelation of diagnostic model residuals. The value of this statistic is between 0 and 4, and the closer it is to 2, the more the model tends not to have autocorrelation. All variables passed the 5% significance test. This shows that the model is statistically significant and has a good fit. The VIF values of each variable were below 10, indicating that no multicollinearity existed among them (Table 7).
(1) Population urbanization was found to exert a significant positive effect on urban carbon emissions. For every 1% increase in population urbanization, urban carbon emissions were shown to increase by 1.185%; population urbanization is thus an important factor in increases in carbon emissions. As one of the regions with the highest level of development in the country, the PRD urban agglomeration has absorbed a large number of foreign populations. According to data published by the National Health and Wellness Commission, the PRD urban agglomeration had a resident population of 59.985 million in 2016, with 33.5053 million local household residents and 26.4797 million migrants, which is one of the largest influxes of migrants in the country. At the same time, the large number of migrants keeps the population density high and drives urban development, the latter of which in turns stimulates the consumption of logistics goods like fuel and cement, which in turn has led to increases in carbon emissions. Compared with other cities, megacities within urban agglomerations have higher urbanization levels, higher population densities, and more diverse consumption patterns. Urban residents can afford higher consumption levels, and many families have purchased private cars due to their improved living standards, all of which increase CO2 emissions from transportation trips. In addition, the limited size of the built-up areas of megacities and the rapid population growth rates are not matched by corresponding levels of urban facilities and environmental population affordability (such as urban park green space, sewage treatment plant, sanitation facilities, etc.). These reasons further contribute to the deterioration of the carbon emission situation in cities. As a result, cities should consider measures to relieve urban population pressure (such as optimize the layout of urban population, guide the population to the peripheral areas of the PRD urban agglomeration orderly transfer, fully liberalize the restrictions on settlement in established towns and small cities, liberalize the restrictions on settlement in medium-sized cities in an organized manner, reasonably determine the conditions for settlement in large cities, and strictly control the size of the population of megacities), develop and improve urban facilities, and build new urban areas.
(2) Economic urbanization is the most important factor that affects urban carbon emissions, and a negative correlation exists between the two. Our results show that for every 1% increase in the economic urbanization index, there is a corresponding 1.207% reduction in urban carbon emissions. This is the largest regression variable among the five independent variables. Moreover, the economic urbanization index passed the 1% significance test, indicating that this variable is the important factor affecting urban carbon emissions. With the national goals of “carbon peaking in 2030” and “carbon neutral in 2060,” the PRD urban agglomeration is facing double pressures in the form of economic development and energy consumption control. Therefore, cities in the PRD urban agglomeration have increased their investment in research and development and strengthened their policy support for new energy technology enterprises, such as photovoltaic and hydrogen-based energy. Moreover, the PRD urban agglomeration has economic advantages, market potential, and talent structure, and these advantages have attracted many large enterprises and foreign businesspeople to collaborate and start businesses. These collaborations have helped introduce advanced pollution prevention technologies and management methods, and they have also promoted the transformation and upgrading of enterprises. At the same time, these energy technology advances have also driven carbon emission reduction in cities within the agglomeration and improved the energy utilization efficiency and clean energy capabilities of the cities.
For example, most cities have switched from previously fuel-driven to electric buses. In December 2020, the electrification rate of urban buses in Guangdong Province reached 93.5%. Among the cities, the bus electrification rates of Guangzhou, Shenzhen, and Zhuhai have reached 100%, effectively optimizing these cities’ energy consumption structures. While cities are investing in research and development in energy technology, they are also targeting higher pollution emission standards in some heavy industries. The impact of traditional high-polluting industries on carbon emissions is being limited, which indirectly promotes the reduction of carbon dioxide emissions in cities and the implementation and effectiveness of national emission reduction initiatives. Finally, the operation of the carbon trading market should be promoted, the carbon emission statistics and accounting system should be improved, and more binding regulations should be introduced for key emitters in different industries to better play the role of energy conservation and emission reduction. Although total carbon emissions have slowed in the past two years, there is still a long way to go to achieve the goal of “carbon neutrality” by 2060. The PRD urban agglomeration should continue to encourage and support the research and development of clean energy and energy storage technologies, optimize the overall industrial structure of the urban agglomeration (such as promote the transformation and development of the PRD region with a single industrial structure, use national policies to promote counterpart cooperation with the central cities in urban agglomeration, and accelerate the joint construction of industrial parks, factor flow, and resource sharing), guide the gradual replacement of traditional energy with clean energy, and promote low-carbon urban development.
(3) Social urbanization has a negative effect on urban carbon emissions. Specifically, for every 1% increase in the social urbanization index, urban carbon emissions are reduced by 0.275%. Since the number of college students in cities has increased in recent years, the overall quality of the urban population has also improved. In addition, with the publicity and encouragement of environmental behaviors by urban media, residents are gradually establishing basic environmental concepts such as green travel and water conservation. People are gradually aware of the importance of establishing a more harmonious coexistence between human beings and nature.
Cities in the PRD urban agglomeration have also proposed policies to promote energy conservation and emission reduction in recent years. In December 2013, the PRD urban agglomeration officially launched a carbon emissions trading scheme. Heavy chemical industries with high energy consumption—such as steel, petrochemicals, electricity, and cement—were included in the scope of the carbon trading market. At the same time, enterprises with serious pollution emissions were required to carry out rectification measures. Market mechanisms are thus being employed to effectively control greenhouse gas emissions. In addition, Guangdong Province decided to implement the “Emission Limits and Measurement Methods for Light Duty Vehicles (China Stage 6)” in 2018, which strictly limits the pol-luting exhaust emissions from vehicle production. Some cities even have introduced policies to restrict the travel of motorcycles and other means of transport with serious exhaust emissions, as well as to strengthen the control of energy consumption standards for the production that enterprises produce. All these measures have effectively slowed down the contribution of total social energy consumption and per capita electricity consumption to carbon emissions. In this way, urban carbon emissions are effectively curbed.
(4) Spatial urbanization is positively correlated with carbon emissions. For every 1% increase in the spatial urbanization index, the corresponding increase in urban carbon emissions is 0.265%. During the pre-city construction period, the population was heavily concentrated as well as the industries were rapidly upgraded and expanded. To meet the needs of accelerated urbanization, commercial development was built substantially within the city and the scale of urban roads was expanded. High levels of energy consumption are known to cause environmental stress, destroy urban greenery, and worsen the carbon emission situation of cities. Compared to other indicators, however, spatial urbanization was found to exert the least impact on carbon emissions, which can be attributed to the following reasons: First, the improvement of the environment by park green space. While the extent of urban development is expanding in cities within the PRD, the scale of green spaces is also being expanded and the construction of green spaces accelerated, in line with the greening of urban parks; these initiatives have a positive effect on the mitigation of carbon emissions in cities. Second, the expansion of urban built-up areas and traffic roads in urban agglomerations has slowed, which has allowed the environmental impacts of spatial urbanization to also slow in recent years as the urbanization rate has increased. Third, the regional implementation of building energy efficiency standards and energy limit standards for building material products have been raised. With the improvement of technology and techniques, green building materials are gradually put into use. The state has improved building energy efficiency standards and encouraged the construction of low-energy buildings. The energy consumption generated in urban construction has been reduced and the energy-saving capacity of buildings has been improved—for these reasons, the rate of increase of carbon emissions generated by the expansion of urban development has slowed.
(5) Our results indicate that a positive correlation exists between the intensity of urban integrated linkage flows and carbon emissions. In fact, every 1% increase in this index is shown to increase the city’s carbon emissions by 1.140%. Although the economic growth rate of cities in the PRD has slowed in recent years, the economic cooperation and development links between cities continue to gain in strength. The formation of Guangzhou-Foshan-Zhuhai, Shenzhen-Dongguan-Huizhou, and Zhuhai-Zhongshan-Jiangmen metropolitan areas is gradually establishing a new urban cluster development pattern with a clear division of labor and complementary functions. The construction of several intercity transportation arteries, such as the Guangzhou-Zhuhai Intercity Railway and the Guangzhou-Foshan Ring Road, has shortened transportation travel time and reduced the cost of factor movement. This has had a long-term impact on optimizing urban functions and smoothing economic links between these cities, but the tailpipe emissions generated by transportation have exacerbated urban carbon emissions. It is worth noting that urban integrated linkage flows within the PRD urban agglomeration are mostly in the direction of Guangzhou, Shenzhen, Dongguan, and other developed cities in the region, rather than the relatively backward economic industries cities in the outer layer of the urban agglomeration. In the long run, this will be detrimental to the future development of the urban agglomeration as a whole. As the core of the PRD urban agglomeration, Guangzhou and Shenzhen should actively use their industrial and location advantages to play a guiding role. These cities should accelerate the economic and logistics links with the cities at the edge of the urban agglomeration, drive the backward economic industries cities to accelerate their development, alleviate the situation of excessive concentration of resource elements in the core cities, and promote the coordinated development of carbon emission reduction and economy.
(6) Urban energy consumption intensity was found to positively correlated with carbon emissions and emerges as one of the main factors affecting carbon emissions in urban agglomerations. For every 1% increase in urban energy consumption intensity, urban carbon emissions are shown to increase by 0.415%. For a long time, China’s energy consumption structure was coal-fired, making the energy structure inefficient. According to data published by the National Bureau of Statistics in 2020, the power generation structure of Guangdong Province is still dominated and thermal power generation, and thermal power generation accounts for 71.38% of the energy grid. To break the traditional coal-fired energy structure, ease the “double control pressure on energy consumption,” and achieve the “double carbon goal,” Guangdong Province should improve the energy efficiency of traditional heavy industries and accelerate the optimization and upgrading of industrial structures, such as metal smelting, construction logistics, cement, and other heavy chemical industries. However, these industries cannot be replaced in the short term, because of the huge demand that still exists in the current market. Therefore, on the one hand, we should target high energy-consuming and high-emission projects, strengthen the supervision work of relevant departments, while controlling high-energy-consuming and high-emission enterprises, replacing and shutting down excess capacity, and improve the pollution emission standards of high-energy-consuming and high-emission enterprises. On the other hand, we suggest that more attention be paid to research and development investment in the direction of strategic future industries such as green materials, advanced high-end equipment manufacturing, and new energy by driving technological innovation, improving energy utilization efficiency, and reducing the energy consumption of products to promote the transformation of high-energy-consumption industries to low-carbon development. At the same time, the PRD urban agglomeration should optimize the energy consumption structure within the urban agglomeration. A gap still exists between the environmental quality of the PRD region and other international urban agglomeration. To achieve a green development model and build ecological power systems as soon as possible, it is necessary to adhere to the green and low-carbon development of energy in the future, even in the face of rapid economic growth, by establishing an energy consumption system centered on new energy to promote research and development into clean energy technologies such as hydropower, nuclear power, and wind power. Furthermore, status quo energy consumption—dominated by coal-fired thermal power generation—will need to be controlled if cities are to reduce their carbon emissions.
4. Conclusions and Policy Implications
4.1. Conclusions
Cities are complex systems composed of multiple elements, and changes in population growth, logistics flows, the economic structure, development patterns, and other factors within a city will cause changes in the scale, intensity, and impact of these factors on carbon emissions [63]. The present study has constructed a comprehensive index system for urban carbon emissions based on a STIRPAT model, combining integrated urban linkage flows and a 4-dimensional urbanization index. The results of this research provide a number of important findings.
Primarily, the PRD urban agglomeration has formed a network linkage structure which places Guangzhou and Shenzhen at its core—these two cities are among the top urban agglomerations in terms of population, logistics, information flow, and other factor flows. In contrast, Jiangmen, Zhaoqing, and other cities located in the peripheral areas of the PRD urban agglomeration find themselves at a lower level in terms of the intensity of their linkage flows. Guangzhou has the highest integrated linkage flow intensity—a level 9.03 times higher than Jiangmen, which has the lowest flow intensity. However, cities are also located at quite different levels in terms of different categories of flow types, and the development structure of the linked flows in each city is diverse and differentiated in terms of relative advantages. For example, Zhaoqing has a strong, second-tier position in terms of passenger flow linkages, while it is third tier in terms of logistics and information flows; despite having low flow intensity, Jiangmen has a relatively strong logistics linkage. It is worth noting that Dongguan, as a new first-tier city and the production base of goods in the PRD urban agglomeration, is at the top level of the urban agglomeration in terms of the strength of its logistics links; it also performs well in terms of the strength of its population and information flows linkages.
Secondly, the regression analysis that we conducted using a STIRPAT model revealed that population urbanization, spatial urbanization, and urban integrated linkage flows all correlated positively with urban carbon emissions, while economic urbanization and social urbanization showed a negative correlation. Economic urbanization was found to be the most significant and important factor affecting urban carbon emissions, with every 1% increase in this variable reducing urban carbon emissions by 1.207% accordingly. Population urbanization exerted the second highest influence, increasing urban carbon emissions by 1.185% for every 1% increase. The spatial urbanization index exerted the least impact, with a regression coefficient of only 0.265%.
Based on these analysis results, the following insights can be drawn:
First, the government clearly has a guiding role to play in reducing carbon emissions, e.g., through actions such as continuing to increase economic investment in research and development [64]; accelerating the transformation of the city’s economic structure to low-energy-consuming industries; developing new energy enterprises in cities, focusing on solar energy, water energy, wind energy, and other renewable energy sources; improving the city’s energy consumption structure [65,66]; and allowing renewable energy to gradually replace local traditional high-energy-consuming production capacity [67]. Such measures would allow the slowing of growth in urban carbon emissions while achieving sustainable development goals and protecting the ecology of urban areas [68].
Second, our results emphasize the importance of improvements to the infrastructure of cities, through measures such as the provision of sanitation facilities and sewage treatment plants, which are appropriately scaled for the population of a given area or improving the affordability of living expenses for the populations of cities. In 2011, Cai Fang [69] pointed out that China’s demographic dividend would be lost around 2015, and that the total population would experience negative growth in 2025. If this is true, this also means that China’s total population will reach its peak in coming years, and the huge population size of the PRD urban agglomeration, one of China’s major population clusters, poses a serious challenge to the development of a low-carbon economy. Therefore, controlling the external population of cities, curbing the high levels of energy consumption caused by urban overpopulation, and mitigating the impact of population growth on carbon emissions constitute important priorities [70].
Third, knowledge about saving energy and green environmental protection must be popularized. There are many migrant workers in the PRD urban agglomeration, who, whilst they are less educated and less aware of environmental protection, could in the future play a more positive role in promoting carbon emission reduction in the city. In this regard, municipalities should increase the public dissemination of environmental protection knowledge, improve the legal systems around environmental protection, and raise environmental awareness amongst urban residents. While controlling the outflow of highly skilled personnel to overseas, China should formulate relevant policies to attract high-end talent for improving the structure of external population, thereby effectively reducing energy consumption and the energy consumption ratio per unit of GDP [71].
Fourth, strengthen the regulatory work of urban carbon emissions. For high energy-consuming and high-emission projects, promote local pilot projects, study and improve the double control degree of energy consumption, establish a long-term carbon emission management evaluation system, incorporate it into the environmental assessment work, and strengthen the supervision of pollution emissions by ecological-related departments. At the same time, improve management effectiveness and curb blind development. Control high energy-consuming and high-emission enterprises (such as coal power, petrochemical, chemical, steel, non-ferrous metal smelting, building materials, and other industries), replace the shutdown of excess capacity, improve the pollution emission standards of double-high industries, and expand the regional environmental capacity.
Fifth, promote the smooth operation of the carbon trading market and carbon market links to improve the construction of the green financial system. According to the 2019 Guangdong Province Ecological and Environmental Status Bulletin released by the Department of Ecology and Environment of Guangdong Province, the province’s carbon market ranked first in the country with a cumulative turnover of 139 million tons of carbon emission allowances and a turnover of 2.715 billion yuan. Obviously, the operation of the carbon trading market has provided an effective method to promote carbon emission reduction in Guangdong Province. However, there are still problems in the current carbon trading market, such as the statistical accounting system needs to be improved, the quality of carbon emission data varies; the market access rules of the carbon pilot are of low standard, and the type of entering enterprises is single. Accordingly, we should continue to improve the system of the carbon trading market and introduce more binding regulations for key emitters in different industries to better guide the carbon emission reduction work of key emitters. At the same time, we should encourage the innovative development of green financial products in many aspects, increase policy support and improve standards, and provide more flexible financing methods for green industries to achieve the purpose of carbon emission reduction [72].
Last but not least, developed cities have a role in strengthening linkages between core cities and edge cities within urban agglomerations. This is particularly true of the PRD urban agglomeration, where measures must be taken in order to break the pattern of strong central cities and weak peripheral cities, and rather promote the coordinated development of the cities in the PRD urban agglomeration, the optimization of regional development, and the formation of a complementary pattern of advantages. The outline of the PRD Reform and Development Plan is put forward as a core policy instrument which could be used to build a polycentric spatial structure of “three major metropolitan areas” and make the development of the three major metropolitan areas of “Guangzhou-Foshan-Zhaoqing,” “Shenzhen-Dongguan-Huizhou,” and “Zhuhai-Zhongshan- Jiangmen” the focus of future economic and social development within the agglomeration. The definition of these three metropolitan areas could work to combine the social characteristics and advantages of different cities in the area, with each area carrying out a differentiated division of economic industries based on that area’s complementary industrial advantages [73]. In order to develop sustainable transport links, intercity rail lines need to be expanded and adjusted according to the traffic flow between different cities and future urban development needs, optimizing the planning and construction of inter-city transportation networks and strengthening transportation links. In this way, each city, metropolitan area, urban agglomeration, and the region as a whole might better utilize the advantages of metropolitan area cooperation, promote the integration and interactive development between regional cities [74], establish an urban development pattern with complementary functions, realize differential industrial construction, enhance economic cooperation, drive the construction and development of science and technology and economic quality in marginal cities, and relieve the pressure of core cities in terms of population and land [75].
4.2. Limitations and Future Direction of the Research
In this study, we used a STIRPAT model to construct an urban carbon emission index system by combining the comprehensive urban linkage flows and a four-dimensional urbanization index, taking into account the methods and finding of existing studies. In this way, we conducted an in-depth study of the factors influencing urban carbon emissions. However, due to some constraints, this study still has several limitations.
First, in terms of research data, we acknowledge that the data accuracy is still not high enough—for example, the data of city passenger flows in urban linkage flows ignore the travel of private cars, and the logistics data lack the consideration of large material operation problems. In addition, the research data are only collected for one year in 2019. In the following study, we need to further improve the accuracy, representativeness, and rigor of the data by obtaining supplementary data, data from multiple channels, and data from a longer time series; such measures would improve the richness of the study. Secondly, in terms of the study area, the selected area is limited to the Pearl River Delta urban agglomeration in Guangdong Province, China, and we will consider expanding the study area in the next study so that the conclusions can have a broader reference value. Third, in terms of indicator selection, the secondary indicators selected in this study were uniformly grouped into one level for uniform calculation. In the subsequent study, we will consider calculating the more detailed secondary indicators separately to obtain more accurate results. Finally, the policy recommendations presented at the end of the article are too general due to various objective factors in the study. In future research, we will focus more on more targeted policy recommendations.
Author Contributions
Y.Z., Y.C. conceived and designed the research; Y.Z., R.C., T.S., Y.Y., S.M. and X.Z. performed the methodology and wrote the original draft; Y.Z., R.C., T.S., Y.Y., S.M., D.X. and Y.C. finished the final manuscript. All authors have read and agreed to the published version of the manuscript.
Funding
This work was supported by the Project Supported by the Open Fund of Key Laboratory of Urban Land Resources Monitoring and Simulation, Ministry of Natural Resources (Grant No. KF-2020-05-010), Natural Science Foundation of Guangdong Province (Grant No. 2019A1515011653), National Natural Science Foundation of China (Grant No. 51978173; Grant No. 42101186), and Science and Technology Program of Guangzhou (Grant No. 201904010465).
Institutional Review Board Statement
Not applicable.
Informed Consent Statement
Not applicable.
Data Availability Statement
Not applicable.
Acknowledgments
The authors’ deepest gratitude goes to the anonymous reviewers and editors for their careful work and thoughtful suggestions that have helped improve this paper substantially.
Conflicts of Interest
The authors declare no conflict of interest.
References
- Friedlingstein, P.; Andrew, R.; Rogelj, J.; Peters, G.; Canadell, J.; Knutti, R.; Luderer, G.; Raupach, M.; Schaeffer, M.; van Vuuren, D.P.; et al. Persistent growth of CO2 emissions and implications for reaching climate targets. Nat. Geosci. 2014, 7, 709–715. [Google Scholar] [CrossRef]
- Wang, H.; Jin, Y.; Hong, X.; Tian, F.; Wu, J.; Nie, X. Integrating IPAT and CLU Mondo models to assess the impact of carbon peak on land use. Land 2022, 11, 573. [Google Scholar] [CrossRef]
- British Petroleum (BP). Statistical Review of World Energy 2021. Available online: https://www.bp.com/statisticalreview (accessed on 12 September 2021).
- Zhang, X.; Geng, Y.; Shao, S.; Dong, H.; Wu, R.; Yao, T. How to achieve China’s CO2 emission reduction targets by provincial efforts?—An analysis based on generalized Divisia index and dynamic scenario simulation. Renew. Sust. Energy Rev. 2020, 127, 109892. [Google Scholar] [CrossRef]
- Yang, J.; Chen, B. Using LMDI method to analyze the change of industrial CO2 emission from energy use in Chongqing. Front. Earth Sci. 2011, 5, 103–109. [Google Scholar] [CrossRef]
- Huang, Y.; Raza, S.M.F.; Hanif, I.; Alharthi, M.; Abbas, Q.; Zain-ul-Abidin, S. The role of forest resources, mineral resources, and oil extraction in economic progress of developing Asian economies. Resour. Policy 2020, 69, 101878. [Google Scholar] [CrossRef]
- Poumanyvong, P.; Kaneko, S. Does urbanization lead to less energy use and lower CO2 emissions? A cross-country analysis. Ecol. Econ. 2010, 70, 434–444. [Google Scholar] [CrossRef]
- Cole, M.A.; Neumayer, E. Examining the impact of demographic factors on air pollution. Popul. Environ. 2004, 26, 5–21. [Google Scholar] [CrossRef] [Green Version]
- Zhang, C.; Lin, Y. Panel estimation for urbanization, energy consumption and CO2 emissions: A regional analysis in China. Energ. Policy 2012, 49, 488–498. [Google Scholar] [CrossRef]
- Zi, C.; Jie, W.; Hong-Bo, C. CO2 emissions and urbanization correlation in China based on threshold analysis. Ecol. Indic. 2016, 61, 193–201. [Google Scholar] [CrossRef]
- Ji, X.; Chen, B. Assessing the energy-saving effect of urbanization in China based on stochastic impacts by regression on population, affluence and technology (STIRPAT) model. J. Clean. Prod. 2017, 163, S306–S314. [Google Scholar] [CrossRef]
- Du, L.; Wei, C.; Cai, S. Economic development and carbon dioxide emissions in China: Provincial panel data analysis. China Econ. Rev. 2012, 23, 371–384. [Google Scholar] [CrossRef]
- He, Z.; Xu, S.; Shen, W.; Long, R.; Chen, H. Impact of urbanization on energy related CO2 emission at different development levels: Regional difference in China based on panel estimation. J. Clean. Prod. 2017, 140, 1719–1730. [Google Scholar] [CrossRef]
- Dogan, E.; Turkekul, B. CO2 emissions, real output, energy consumption, trade, urbanization and financial development: Testing the EKC hypothesis for the USA. Environ. Sci. Pollut. Res. 2016, 23, 1203–1213. [Google Scholar] [CrossRef]
- Farhani, S.; Ozturk, I. Causal relationship between CO2 emissions, real GDP, energy consumption, financial development, trade openness, and urbanization in Tunisia. Environ. Sci. Pollut. Res. 2015, 22, 15663–15676. [Google Scholar] [CrossRef]
- Nguyen, D.; Huynh, T.; Nasir, M. Carbon emissions determinants and forecasting: Evidence from G6 countries. J. Environ. Manag. 2021, 285, 111988. [Google Scholar] [CrossRef]
- Shen, L.; Wu, Y.; Lou, Y.; Zeng, D.; Shuai, C.; Song, X. What drives the carbon emission in the Chinese cities? —A case of pilot low carbon city of Beijing. J. Clean. Prod. 2018, 174, 343–354. [Google Scholar] [CrossRef]
- Qiao, W.; Lu, H.; Zhou, G.; Azimi, M.; Yang, Q.; Tian, W. A hybrid algorithm for carbon dioxide emissions forecasting based on improved lion swarm optimizer. J. Clean. Prod. 2020, 244, 118612. [Google Scholar] [CrossRef]
- Nathaniel, S.; Khan, S. The nexus between urbanization, renewable energy, trade, and ecological footprint in ASEAN countries. J. Clean. Prod. 2020, 272, 122709. [Google Scholar] [CrossRef]
- Adebayo, T.; Udemba, E.; Ahmed, Z.; Kirikkaleli, D. Determinants of consumption-based carbon emissions in Chile: An application of non-linear ARDL. Environ. Sci. Pollut. Res. 2021, 28, 43908–43922. [Google Scholar] [CrossRef]
- Yuan, J.; Ng, S. Emission reduction measures ranking under uncertainty. Appl. Energy 2017, 188, 270–279. [Google Scholar] [CrossRef]
- Khan, M.; Teng, J.; Khan, M. Effect of energy consumption and economic growth on carbon dioxide emissions in Pakistan with dynamic ARDL simulations approach. Environ. Sci. Pollut. Res. 2019, 26, 23480–23490. [Google Scholar] [CrossRef]
- De Oliveira-De Jesus, P. Effect of generation capacity factors on carbon emission intensity of electricity of Latin America & the Caribbean, a temporal IDA-LMDI analysis. Renew. Sust. Energ. Rev. 2019, 101, 516–526. [Google Scholar]
- Waldo, S.; Jensen, F.; Nielsen, M.; Ellefsen, H.; Hallgrimsson, J.; Hammarlund, C.; Hermansen, O.; Isaksen, J. Regulating Multiple Externalities: The case of Nordic Fisheries. Mar. Resour. Econ. 2016, 31, 233–257. [Google Scholar] [CrossRef]
- Wang, S.; Liu, X. China’s city-level energy-related CO2 emissions: Spatiotemporal patterns and driving forces. Appl. Energy 2017, 200, 204–214. [Google Scholar] [CrossRef]
- Wang, K.; Wei, Y. China’s regional industrial energy efficiency and carbon emissions abatement costs. Appl. Energy 2014, 130, 617–631. [Google Scholar] [CrossRef]
- Solarin, S.; Nathaniel, S.; Bekun, F.; Okunola, A.; Alhassan, A. Towards achieving environmental sustainability: Environmental quality versus economic growth in a developing economy on ecological footprint via dynamic simulations of ARDL. Environ. Sci. Pollut. Res. 2021, 28, 17942–17959. [Google Scholar] [CrossRef]
- Huo, T.; Li, X.; Cai, W.; Zuo, J.; Jia, F.; Wei, H. Exploring the impact of urbanization on urban building carbon emissions in China: Evidence from a provincial panel data model. Sustain. Cities Soc. 2020, 56, 102068. [Google Scholar] [CrossRef]
- Nasir, M.; Canh, N.; Le, T. Environmental degradation & role of financialization, economic development, industrialization and trade liberalization. J. Environ. Manag. 2021, 277, 111471. [Google Scholar]
- Dong, F.; Wang, Y.; Su, B.; Hua, Y.; Zhang, Y. The process of peak CO2 emissions in developed economies: A perspective of industrialization and urbanization. Resour. Conserv. Recycl. 2019, 141, 61–75. [Google Scholar] [CrossRef]
- Naz, S.; Sultan, R.; Zaman, K.; Aldakhil, A.; Nassani, A.; Abro, M. Moderating and mediating role of renewable energy consumption, FDI inflows, and economic growth on carbon dioxide emissions: Evidence from robust least square estimator. Environ. Sci. Pollut. Res. 2019, 26, 2806–2819. [Google Scholar] [CrossRef] [PubMed]
- Pang, Q.; Zhou, W.; Zhao, T.; Zhang, L. Impact of urbanization and industrial structure on carbon emissions: Evidence from Huaihe River Eco-Economic Zone. Land 2021, 10, 1130. [Google Scholar] [CrossRef]
- Searchinger, T.; Wirsenius, S.; Beringer, T.; Dumas, P. Assessing the efficiency of changes in land use for mitigating climate change. Nature 2019, 565, E9. [Google Scholar] [CrossRef] [PubMed]
- Al-Mulali, U.; Sheau-Ting, L.; Ozturk, I. The global move toward Internet shopping and its influence on pollution: An empirical analysis. Environ. Impact Assess. Rev. 2015, 22, 9717–9727. [Google Scholar] [CrossRef]
- Shahbaz, M.; Loganathan, N.; Muzaffar, A.; Ahmed, K.; Jabran, M. How urbanization affects CO2 emissions of STIRPAT model in Malaysia? The application. Renew. Sust. Energ. Rev. 2016, 57, 83–93. [Google Scholar] [CrossRef] [Green Version]
- Zhao, Y.; Ma, S.; Fan, J.; Cai, Y. Examining the effects of land use on carbon emissions: Evidence from Pearl River Delta. Int. J. Environ. Res. Public Health 2021, 18, 3623. [Google Scholar] [CrossRef]
- Zeng, S.; Nan, X.; Liu, C.; Chen, J. The response of the Beijing carbon emissions allowance price (BJC) to macroeconomic and energy price indices. Energy Policy 2017, 106, 111–121. [Google Scholar] [CrossRef]
- Qin, H.; Huang, Q.; Zhang, Z.; Lu, Y.; Li, M.; Xu, L.; Chen, Z. Carbon dioxide emission driving factors analysis and policy implications of Chinese cities: Combining geographically weighted regression with two-step cluster. Sci. Total Environ. 2019, 684, 413–424. [Google Scholar] [CrossRef]
- Zhang, Y.; Zhang, K. The linkage of CO2 emissions for China, EU, and USA: Evidence from the regional and sectoral analyses. Environ. Sci. Pollut. Res. 2018, 25, 20179–20192. [Google Scholar] [CrossRef]
- Tan, X.; Dong, L.; Chen, D.; Gu, B.; Zeng, Y. China’s regional CO2 emissions reduction potential: A study of Chongqing city. Appl. Energy 2016, 162, 1345–1354. [Google Scholar] [CrossRef]
- Zhang, K.; Zhang, Z.; Liang, Q. An empirical analysis of the green paradox in China: From the perspective of fiscal decentralization. Energy Policy 2017, 103, 203–211. [Google Scholar] [CrossRef]
- Wang, S.; Zeng, J.; Huang, Y.; Shi, C.; Zhan, P. The effects of urbanization on CO2 emissions in the Pearl River Delta: A comprehensive assessment and panel data analysis. Appl. Energy 2018, 228, 1693–1706. [Google Scholar] [CrossRef]
- Zhang, F.; Jin, G.; Li, J.; Wang, C.; Xu, N. Study on dynamic total factor carbon emission efficiency in China’s urban agglomerations. Sustainability 2020, 12, 2675. [Google Scholar] [CrossRef] [Green Version]
- Sadorsky, P. The effect of urbanization on CO2 emissions in emerging economies. Energ. Econ. 2014, 41, 147–153. [Google Scholar] [CrossRef]
- Tang, Y.; Yang, Y.; Xu, H. The impact of China carbon emission trading system on land use transition: A macroscopic economic perspective. Land 2022, 11, 41. [Google Scholar] [CrossRef]
- Martinez-Zarzoso, I.; Maruotti, A. The impact of urbanization on CO2 emissions: Evidence from developing countries. Ecol. Econ. 2011, 70, 1344–1353. [Google Scholar] [CrossRef] [Green Version]
- Castells, M. High technology, economic restructuring and the urban regional process in the United States. High Technol. Spaces Soc. 1985, 28, 11–40. [Google Scholar]
- Zhong, C.; Arisona, S.M.; Huang, X.; Batty, M.; Schmitt, G. Detecting the dynamics of urban structure through spatial network analysis. Int. J. Geogr. Inf. Sci. 2015, 28, 2178–2199. [Google Scholar] [CrossRef]
- Roth, C.; Kang, S.M.; Batty, M.; Barthelemy, M. Structure of urban movements: Polycentric activity and entangled hierarchical flows. PLoS ONE 2011, 6, e15923. [Google Scholar] [CrossRef] [Green Version]
- Shen, L.; Gu, Z. Integration of regional space of flows and construction of global urban network. Sci. Geol. Sin. 2009, 29, 787–793. (In Chinese) [Google Scholar]
- Manuel, C. The Informational City: Information Technology, Economic Restructuring and the Urban-Regional Progress; Blackwell: Oxford, UK; Cambridge, MA, USA, 1989. [Google Scholar]
- Wang, S.; Gao, S.; Wang, Y. Spatial structure of the urban agglomeration based on space of flows: The study of the Pearl River Delta. Geogr. Res. 2019, 38, 1849–1861. (In Chinese) [Google Scholar]
- Xia, C.; Zhang, A.; Wang, H.; Zhang, B.; Zhang, Y. Bidirectional urban flows in rapidly urbanizing metropolitan areas and their macro and micro impacts on urban growth: A case study of the Yangtze River middle reaches megalopolis, China. Land Use Policy 2019, 82, 158–168. [Google Scholar] [CrossRef]
- Li, W.; Wu, Q.; Wu, K.; Wang, Y.; Zhang, H.; Zhou, Z. Spatial structure of the urban agglomeration based on space of flows: The study of the Pearl River Delta. Area Res. Dev. 2021, 40, 20–26. (In Chinese) [Google Scholar]
- Zong, H.; Hao, L.; Dai, J. Study of urban network structure in Chengdu-Chongqing economic circle based on Baidu Index. J. Southwest Univ. 2021, 44, 36–45. (In Chinese) [Google Scholar]
- Liu, C.; Zeng, J. The calculating method about the comprehensive transport accessibility and its correlation with economic development at county level: The statistical analysis of 79 counties in Hubei Province. Geogr. Res. 2011, 30, 2209–2221. (In Chinese) [Google Scholar]
- Chen, M.; Lu, D.; Zhang, H. Comprehensive evaluation and the driving factors of China’s urbanization. Acta. Geogr. Sin. 2009, 64, 387–398. (In Chinese) [Google Scholar]
- Zhao, Y.; Wang, S.; Zhou, C. Understanding the relation between urbanization and the eco-environment in China’s Yangtze River Delta using an improved EKC model and coupling analysis. Sci. Total Environ. 2016, 571, 862–875. [Google Scholar] [CrossRef] [PubMed]
- Wang, Y.; Li, G. Mapping urban CO2 emissions using DMSP/OLS ‘city lights’ satellite data in China. Environ. Plann. A 2017, 49, 248–251. [Google Scholar] [CrossRef] [Green Version]
- IPCC. IPCC Guidelines for National Greenhouse Gas Inventories; IGES: Kanagawa, Japan, 2006. [Google Scholar]
- Shan, Y.; Huang, Q.; Guan, D.; Hubacek, H. China CO2 emission accounts 2016–2017. Sci. Data 2020, 7, 54. [Google Scholar] [CrossRef] [Green Version]
- York, R.; Rose, E.; Dietz, T. STIRPAT, IPAT and IMPACT: Analystic tools for unpacking the draving forces of environmental impacts. Ecol. Econ. 2003, 46, 351–365. [Google Scholar] [CrossRef]
- He, J.; Wang, S.; Liu, Y.; Ma, H.; Liu, Q. Examining the relationship between urbanization and the eco-environment using a coupling analysis: Case study of Shanghai, China. Ecol. Indic. 2017, 77, 185–193. [Google Scholar] [CrossRef]
- Shao, S.; Yang, L.; Gan, C.; Cao, J.; Geng, Y.; Guan, D. Using an extended LMDI model to explore techno-economic drivers of energy-related industrial CO2 emission changes: A case study for Shanghai (China). Renew. Sust. Energy. Rev. 2016, 55, 516–536. [Google Scholar] [CrossRef] [Green Version]
- Hanif, I.; Raza, S.M.F.; Gago-de-Santos, P.; Abbas, Q. Fossil fuels, foreign direct investment, and economic growth have triggered CO2 emissions in emerging Asian economies: Some empirical evidence. Energy 2019, 171, 493–501. [Google Scholar] [CrossRef]
- Leng, C.; Zain-ul-Abidin, S.; Majeed, W.; Raza, S.M.F.; Ahmad, I. The non-linear relationship between carbon dioxide emissions, financial development and energy consumption in developing European and Central Asian economies. Environ. Sci. Pollut. Res. 2021, 28, 63330–63345. [Google Scholar]
- Batool, Z.; Raza, S.M.F.; Ali, S.; Ul Abidin, S.Z. ICT, renewable energy, financial development, and CO2 emissions in developing countries of East and South Asia. Environ. Sci. Pollut. Res. 2022, 29, 35025–35035. [Google Scholar] [CrossRef]
- Zhang, X.; Zhao, X.; Jiang, Z.; Shao, S. How to achieve the 2030 CO2 emission-reduction targets for China’s industrial sector: Retrospective decomposition and prospective trajectories. Glob. Environ. Chang. 2017, 44, 83–97. [Google Scholar] [CrossRef]
- Wang, H.; Yang, Q. Seventy years of population dynamics and the current aging challenge: A literature review and policy analysis. J. Macro-Qual. Res. 2019, 7, 30–54. (In Chinese) [Google Scholar]
- Zhang, Y.; Liu, Z.; Zhang, H.; Tan, T. The impact of economic growth, industrial structure and urbanization on carbon emission intensity in China. Nat. Hazards 2014, 73, 579–595. [Google Scholar] [CrossRef]
- Madlener, R.; Sunak, Y. Impacts of urbanization on urban structures and energy demand: What can we learn for urban energy planning and urbanization management? Sustain. Cities Soc. 2011, 1, 45–53. [Google Scholar] [CrossRef]
- Jiang, Y.; Batool, Z.; Raza, S.M.F.; Haseeb, M.; Ali, S.; Ul Abidin, S.Z. Analyzing the Asymmetric Effect of Renewable Energy Consumption on Environment in STIRPAT-Kaya-EKC Framework: A NARDL Approach for China. Int. J. Env. Res. Public Health 2022, 19, 7100. [Google Scholar] [CrossRef]
- Liang, L.; Wang, Z.; Li, J. The effect of urbanization on environmental pollution in rapidly developing urban agglomerations. J. Clean. Prod. 2019, 237, 117649. [Google Scholar] [CrossRef]
- He, D.; Liu, H.; He, K.; Meng, F.; Jiang, Y.; Wang, M.; Zhou, J.; Calthorpe, P.; Guo, J.; Yao, Z.; et al. Energy use of, and CO2 emissions from China’s urban passenger transportation sector—Carbon mitigation scenarios upon the transportation mode choices. Transp. Res. Part-Policy Pract. 2013, 53, 53–67. [Google Scholar] [CrossRef]
- Fan, F.; Lei, Y. Decomposition analysis of energy-related carbon emissions from the transportation sector in Beijing. Transp. Res. Part-Transp. Environ. 2016, 42, 135–145. [Google Scholar] [CrossRef] [Green Version]
Figure 1.
Study area: PRD urban agglomeration.

Figure 2.
Histogram of urban linkage flow intensity in the PRD urban agglomeration.

Figure 3.
Spatial distribution of urban linkage flow intensity in the PRD urban agglomeration.

Table 1.
PRD city people flow connection matrix 2019.
| DongGuan | FoShan | GuangZhou | HuiZhou | JJiangMen | ShenZhen | ZhaoQing | ZhongShan | ZhuHai | |
|---|---|---|---|---|---|---|---|---|---|
| DongGuan | 15,000 | 237,550 | 101,350 | 3150 | 211,800 | 6850 | 6250 | 8500 | |
| FoShan | 235,550 | 4650 | 7800 | 105,400 | 360,800 | 9600 | 7450 | ||
| GuangZhou | 66,100 | 151,150 | 664,300 | 337,050 | 148,000 | 209,600 | |||
| HuiZhou | 1500 | 146,350 | 1600 | 2750 | 2600 | ||||
| JiangMen | 3500 | 1500 | 1000 | 13,200 | |||||
| ShenZhen | 214,100 | 13,050 | 5800 | ||||||
| ZhaoQing | 2700 | 3650 | |||||||
| ZhongShan | 217,550 | ||||||||
| ZhuHai |
Table 2.
PRD city logistics linkage matrix 2019.
| DongGuan | FoShan | GuangZhou | HuiZhou | JiangMen | ShenZhen | ZhaoQing | ZhongShan | ZhuHai | |
|---|---|---|---|---|---|---|---|---|---|
| DongGuan | 362,451 | 1,354,832 | 101,586 | 241,344 | 1,127,103 | 118,841 | 112,980 | 84,404 | |
| FoShan | 222,935 | 44,334 | 55709 | 299,405 | 64,878 | 18,159 | 22,410 | ||
| GuangZhou | 93,767 | 386,066 | 1,240,088 | 128,623 | 21,202 | 68801 | |||
| HuiZhou | 93,767 | 114,535 | 33,800 | 27,795 | 21,704 | ||||
| JiangMen | 117,300 | 57,563 | 10,359 | 31,075 | |||||
| ShenZhen | 52,260 | 22,088 | 28,170 | ||||||
| ZhaoQing | 8436 | 24,352 | |||||||
| ZhongShan | 5245 | ||||||||
| ZhuHai |
Table 3.
PRD city information flow linkage matrix 2019.
| DongGuan | FoShan | GuangZhou | HuiZhou | JJiangMen | ShenZhen | ZhaoQing | ZhongShan | ZhuHai | |
|---|---|---|---|---|---|---|---|---|---|
| DongGuan | 74,784 | 299,088 | 89,585 | 28,776 | 550,232 | 29,190 | 28,356 | 43920 | |
| FoShan | 433,782 | 46,200 | 39,579 | 173,038 | 36,894 | 49,644 | 76,440 | ||
| GuangZhou | 159,104 | 100,128 | 923,520 | 96,084 | 93,840 | 146,256 | |||
| HuiZhou | 20,574 | 339,735 | 18,522 | 18,810 | 23,040 | ||||
| JiangMen | 62,037 | 22,969 | 18,207 | 23,490 | |||||
| ShenZhen | 61,204 | 64,944 | 113,928 | ||||||
| ZhaoQing | 12,936 | 15,295 | |||||||
| ZhongShan | 38,100 | ||||||||
| ZhuHai |
Table 4.
Urbanization index system table.
| Tier 1 Indicators | Secondary Indicators | Reference |
|---|---|---|
| Population urbanization | Urban population to total population | [9] |
| Population density | [58] | |
| Percentage of population in secondary and tertiary industries | [52] | |
| Economic urbanization | The proportion of output value on secondary and tertiary industries to regional GDP | [9] |
| GDP per capita | [58] | |
| Research and development investment as a percentage of regional GDP | [25] | |
| Social urbanization | Total social consumption | [25] |
| Urban electricity consumption per capita | [57] | |
| University student rate | [57] | |
| Spatial urbanization | Area share of built-up area | [57] |
| Paved road area per capita | [25] | |
| Urban integrated linkage intensity | City passenger flow | [52] |
| Logistics flow | [52] | |
| Information flow | [52] | |
| Control variables | Energy consumption intensity | [12] |
Table 5.
Results of descriptive statistics for each variable.
| Variables | Unit | Minimum Value | Maximum Value | Average Value | Standard Deviation |
|---|---|---|---|---|---|
| Carbon dioxide emissions | million tons | 16.1 | 67.6 | 36.3 | 15.0 |
| Urban population ratio | % | 48.6 | 100.0 | 82.2 | 15.5 |
| Population density | person/km2 | 281 | 6484 | 1870.8 | 1747.6 |
| Percentage of population in secondary and tertiary industries | % | 0.549 | 0.998 | 0.881 | 0.144 |
| The proportion of output value of secondary and tertiary industries | % | 99.9 | 82.8 | 95.9 | 5.2 |
| GDP per capita | Yuan/Person | 53,936 | 203,489 | 119,858.7 | 48,495.5 |
| R&D investment ratio | % | 4.93 | 1.11 | 2.55 | 0.97 |
| Total social consumption | Billion Yuan | 996.3 | 9551.6 | 3664.2 | 3193.3 |
| Urban electricity consumption per capita | kWh/person | 6363.4 | 12,752.6 | 9017.4 | 1969.3 |
| Percentage of college students | Name/10,000 people | 45.1 | 745.4 | 244.5 | 254.8 |
| Area share of built-up area | % | 20.0 | 60.0 | 38.4 | 14.3 |
| Paved road area per capita | km2/person | 8.5 | 24.2 | 17.4 | 4.7 |
| Energy consumption intensity | million tons of standard coal | 407.6 | 2379.9 | 1186.0 | 659.0 |
Table 6.
Weights of each dimension of the carbon emission index system.
| Dimensionality | Population Urbanization | Economic Urbanization | Social Urbanization | Spatial Urbanization | Energy Consumption Intensity | Comprehensive City Connection Degree |
|---|---|---|---|---|---|---|
| Weights | 0.220 | 0.211 | 0.220 | 0.131 | 0.104 | 0.114 |
Table 7.
Model regression results.
| Variables | Regression Coefficient | Std.Error | Significance | VIF |
|---|---|---|---|---|
| CONSTANT | 3.136 | 0.100 | 0.000 | |
| Ln(PU) | 1.185 | 0.064 | 0.002 | 6.503 |
| Ln(EU) | −1.207 | 0.175 | 0.038 | 9.811 |
| Ln(SU) | −0.275 | 0.028 | 0.013 | 2.309 |
| Ln(LU) | 0.265 | 0.083 | 0.033 | 5.731 |
| Ln(NYXF) | 0.415 | 0.042 | 0.004 | 1.697 |
| LXD | 1.140 | 0.116 | 0.003 | 9.967 |
| F Value | 13.683 | 0.028 | ||
| R2 | 0.999 |
Publisher’s Note: MDPI stays neutral with regard to jurisdictional claims in published maps and institutional affiliations. |
© 2022 by the authors. Licensee MDPI, Basel, Switzerland. This article is an open access article distributed under the terms and conditions of the Creative Commons Attribution (CC BY) license (https://creativecommons.org/licenses/by/4.0/).
Share and Cite
MDPI and ACS Style
Zhao, Y.; Chen, R.; Sun, T.; Yang, Y.; Ma, S.; Xie, D.; Zhang, X.; Cai, Y. Urbanization Influences CO2 Emissions in the Pearl River Delta: A Perspective of the “Space of Flows”. Land 2022, 11, 1373. https://doi.org/10.3390/land11081373
AMA Style
Zhao Y, Chen R, Sun T, Yang Y, Ma S, Xie D, Zhang X, Cai Y. Urbanization Influences CO2 Emissions in the Pearl River Delta: A Perspective of the “Space of Flows”. Land. 2022; 11(8):1373. https://doi.org/10.3390/land11081373
Chicago/Turabian StyleZhao, Yabo, Ruiyang Chen, Tong Sun, Ying Yang, Shifa Ma, Dixiang Xie, Xiwen Zhang, and Yunnan Cai. 2022. "Urbanization Influences CO2 Emissions in the Pearl River Delta: A Perspective of the “Space of Flows”" Land 11, no. 8: 1373. https://doi.org/10.3390/land11081373
Note that from the first issue of 2016, this journal uses article numbers instead of page numbers. See further details here.