Article

Production–Living–Ecological Risk Assessment and Corresponding Strategies in China’s Provinces under Climate Change Scenario

1
Key Laboratory of Land Surface Pattern and Simulation, Institute of Geographic Sciences and Natural Resources Research, Chinese Academy of Sciences, Beijing 100101, China
2
College of Resources and Environment, University of Chinese Academy of Sciences, Beijing 100049, China
3
College of Land Science and Technology, China Agricultural University, Beijing 100193, China
*
Author to whom correspondence should be addressed.
Land 2022, 11(9), 1424; https://doi.org/10.3390/land11091424
Submission received: 19 July 2022 / Revised: 22 August 2022 / Accepted: 25 August 2022 / Published: 29 August 2022

Abstract

:
In the context of the increasing frequency of natural disasters caused by climate change in recent years, rational territorial spatial planning must pay attention to production–living–ecological (PLE) risks under climate change scenarios. In this study, a method synthesizing the Box–Cox transformation and area weighted averaging is established for characterizing the PLE risks in China’s provinces, which are divided into three zones to cope with PLE risks. Further, targeted strategies from the perspective of the disaster-induced factors and disaster-affected objects are explored for the regions within the different zones. The results show that the regions with a high production risk are mainly distributed in Guangdong, Henan, and Shandong, with an index between 0.80 and 1.00; the regions with a high living risk are concentrated in Jiangsu, Anhui, Guangdong, and Hainan, with an index exceeding 0.72; and the regions with a high ecological risk are concentrated in Guangxi, Ningxia, and Yunnan, with an index exceeding 0.50. The overall PLE risk is high along the southeastern coast, intermediate in central and western China, and low on the Tibetan Plateau. From the A to C zones, the number of risk types and intensity of risks requiring attention gradually decrease. For the category A zone, recommended measures include the construction of disaster risk monitoring and early warning systems for coastal cities and major grain-producing regions, the development of urban ecological protection zones, and the adjustment of economic and energy structures, etc. Production and living risks are central to the category B zone, while ecological and production risks are central to the category C zone. This study can provide theoretical support for China’s scientific development of land planning and the realization of a beautiful China.

1. Introduction

Since the Industrial Revolution, the global temperature has continued to rise, extreme weather and climate events such as heat waves and heavy rainfall have occurred frequently, and natural disasters have become more frequent [1,2,3,4], with serious impacts on global natural and social systems [5,6]. Climate change has also produced many adverse effects in China, including increasingly frequent floods in the southeastern and central regions due to increases in temperature and precipitation [7,8,9], and potential extreme heat waves in North China [10]. In the context of global climate change, China, where frequent natural disasters occur, has suffered considerable losses from such events in the past two decades [11,12]. In particular, multiple rounds of heavy rainfall occurred in China in 2020. According to data released by the Ministry of Emergency Management of China, 63.46 million people were affected by the first and second floods of the Yangtze River and Yellow River in 2020, and the direct economic losses reached CNY 178.96 B [13]. The expected value of casualties, property losses, and resource and environmental damage caused by natural disaster events is defined as the natural disaster risk. China’s high sensitivity to climate change exacerbates its disaster risk [14,15].
At present, China is at a critical stage of building “Beautiful China”. In its report to the 19th National Congress of China, President Xi Jinping proposed that the focus of building a “Beautiful China” lies in “the formation of spatial pattern, industrial structures, production modes, and ways of work and life that help to conserve resources and protect environment” [16]. Scientific planning of the production–living–ecological (PLE) functions of territorial space has become an important way to achieve a beautiful China and the construction of an ecological civilization [17,18]. The “Outline of the People’s Republic of China 14th Five-Year Plan for National Economic and Social Development and Long-Range Objectives for 2035” proposed, that in the future, it will be necessary to “optimize the pattern of territorial space development and protection” and “gradually form three spatial patterns, namely, urbanized areas, major agricultural production areas, and ecological function areas” [19]. However, in recent years, due to the spatial coupling effects of global climate change and socioeconomic changes, the natural disasters caused by climate change and extreme weather events have caused serious losses in living and production functions [20] and irreversible effects on ecological functions [21]. In the next 10–15 years, the risk of various disasters in China will remain extremely serious, and the risk of extreme weather and climate events and corresponding secondary and derived disasters will become increasingly uncertain [22]. Natural disasters associated with climate change are among the most important factors restricting China’s socioeconomic development and ecological environment improvement [23], and they may become an obstacle to the realization of the goals of territorial spatial planning. Therefore, it is of great practical significance to systematically optimize China’s PLE risks in the context of climate change.
Most studies of territorial spatial planning have focused on land use, environmental protection, ecosystem restoration, and infrastructures [24,25], and the attention given to natural disaster risk in such studies has mostly focused on the frequency of disaster-causing factors [26,27]. Under the current and future conditions, it is necessary to further explore the impacts of natural disasters caused by climate change on living and production functions, and the effects of the exposure and vulnerability of hazard-affected objects cannot be ignored. Therefore, it has become an important issue that needs to be solved in the process of rational territorial space planning that accurately evaluates the PLE risks around China under the climate change scenario, and is based on synthesizing the effects of hazard-induce factors and hazard-affected bodies. Following this, the issue of how to cope with the risks among various provinces with regional differences must also be solved. This study takes this as the research goal to conduct the risk assessment of PLE function in China and corresponding strategies that aim to deal with risks, so as to provide scientific and technological support for the construction of a beautiful China. The three major areas (ecosystems, food security, and socioeconomic systems) that the United Nations Framework Convention on Climate Change (UNFCCC) focuses on [28] correspond well to the concept of the PLE function. From the perspective of the PLE space concept with Chinese characteristics, this paper focuses on the PLE risk of China’s provincial units, since territorial spatial planning is often performed at the administrative unit scale. This paper also combines the major function-oriented zoning of China [26] and current territorial spatial planning concepts, and the risks and their conflict are explored in the main zones based on the spatial analysis method. Further, strategies are proposed to cope with the risks in various provinces.

2. Materials and Methods

2.1. Data and Methods

Data for the disaster-inducing factors and hazard-affected objects required for risk calculations are included in this study. The former includes information for extreme climatic events such as heat waves, droughts, and floods, as well as meteorological factors such as temperature and precipitation. To fully understand the severity of the risk of climate change, the disaster-inducing factor data in this study correspond to RCP8.5, the representative concentration pathway (RCP) scenario with the highest greenhouse gas emissions. The daily climate scenario data are downscaled from the Inter-Sectoral Impact Model Inter-comparison Project (ISI-MIP), with a spatial resolution of 0.5° × 0.5° and a time range of 1950–2099 [29]. The climatological data for the reference period (1981–2010) are from the China Meteorological Data Service Center. The relevant records for disaster onset and end dates, disaster intensity, and loss are from the National Disaster Reduction Center of China (http://www.ndrcc.org.cn/sjcx/index.jhtml [accessed on 2 February 2022]). The data for hazard-affected objects mainly include gross domestic product (GDP), grain output, population density, and the net primary productivity of vegetation. The GDP and population density data are from the downscaled national population and GDP datasets from 1980 to 2010 (every 10 years represents one period) simulated by the National Institute for Environmental Studies of Japan, with a spatial resolution of 0.5° × 0.5° [30]. The future grain output is from RCP8.5 simulations with the regional crop production model [31] performed by the Institute of Environment and Sustainable Development in Agriculture of the Chinese Academy of Agricultural Sciences. The net primary productivity of vegetation is obtained using the Lund–Potsdam–Jena dynamic global vegetation model (LPJ DGVM).
The PLE risks of each grid in China are explored based on a quantitative assessment of climate change risk [32]. In this study, the calculation of risk covers two dimensions: disaster-inducing factors and hazard-affected objects [32]. Disaster-inducing factors characterize changes in the natural climate and influence the possibility of hazard occurrence [33], including gradual events such as changes in climate conditions and emergencies such as extreme weather/climate events. Hazard-affected objects refer to socioeconomic, resource, and environmental factors that are negatively affected by hazards, including people, livelihoods, various resources, as well as socioeconomic assets. From the perspective of disaster-inducing factors, risk can be categorized into risk for sudden disasters—that is, the risk associated with extreme weather/climate events (floods, heat waves, droughts, etc.), and risk for gradual disasters, which refers to the adverse systemic effects of sudden changes that occur when a system index exceeds a certain threshold. Risk for sudden disasters is a function of disaster-inducing factors and hazard-affected bodies (Equation (1)). Risks of floods, heat waves, and droughts are different, and detailed calculations are available in past publications [34]. Since climatic factors are both driving forces and disaster-inducing factors for ecosystem production, and considering the elastic resilience of ecosystems, the concept of threshold values was introduced to evaluate the risk. This evaluation was carried out according to the trend of the indicator and the key threshold (10% loss of the average value is the threshold). Detailed calculations refer to past research [34].
R = P × ( E × V )
where P is the probability of the extreme events, E is the exposure of hazard-affected bodies, and V is the vulnerability of hazard-affected bodies.

2.2. Identification of PLE Risks from Climate Change Risks

Grain output, which can be directly affected by droughts and floods, is the most important indicator of production risk under climate change [35]. Studies of the North China Plain [36], the middle and lower reaches of the Yangtze River [37], the southwestern region [38], and the other Asian regions [39] have shown that disasters such as floods and droughts are significantly correlated with grain yield reduction. In addition, economic losses caused by floods and droughts are production risks [40] and are significantly positively correlated with the severity of disasters [41]. People are affected by heat waves and flood disasters under climate change, with an important impact on the quantification of living risks [42,43]. In recent years, heat waves have occurred frequently around the world and have greatly exacerbated the risk of heat stroke or even heat-related death [44,45]. People may die when the temperature exceeds a certain threshold [46]. Globally, the influence of flood disasters on societies accounts for 52% of the effect of all natural disasters [47]. Heat waves and floods affect the health and lives of the population and are important components of living risk [48,49]. Although an ecosystem is characterized by anti-disturbance and restorability capabilities [50,51], ecological risk occurs when the impact of climate change reaches a given threshold. For example, climate change affects the patterns and processes in wetland ecosystems by changing the water and soil temperatures and eventually leading to the succession of wetland ecosystems [52]. In the background of climate change, the structure [53] and functions [54,55] of global terrestrial ecosystems and the characteristics of carbon sources and sinks change [56,57], resulting in nonnegligible ecological risks. The production risk identified in this paper represents the possible socioeconomic and grain yield loss and the corresponding impacts due to floods and droughts. The living risk is associated with the possible impact on and loss of population due to heat waves and floods. The production risk and living risk are both types of sudden disaster risk. Ecological risk includes the ecosystem trends and the rate of change of ecosystem functions due to the effects of climate factors such as temperature and precipitation [32], reflecting gradual disaster risk (Figure 1).
Based on the above data, the PLE risks are classified at the grid scale in China by using the standard deviation multiple method [58] (Figure 2). Areas with a high production risk account for approximately 17% of the total area of China, according to the obtained spatial statistics (Figure 2A). Areas with a high living risk are concentrated in North China and some areas along the southeastern coast (Figure 2B), accounting for 12% of the total area of China; areas with an intermediate living risk account for 11%. Additionally, areas with a high ecological risk account for 9%.

2.3. Assessment of PLE Risk Index at Provincial Scale in China

The provincial PLE risks refer to the comprehensive risk of each province in China, which is used to characterize the severity of the PLE risk. It is the weighted average of the PLE risk indexes obtained at the grid scale. However, because the indexes of production, living, and ecological risks are not completely the same in terms of calculation method, magnitude, and frequency distribution, it is difficult to compare and calculate the relative magnitudes of various risk indexes in the same region. Therefore, the production, living, and ecological risks are subjected to the Box–Cox transformation [59] and normalization before the calculation of the provincial PLE risk.
First, the Box–Cox transformation of these three types of risks is performed, as shown in Equation (2).
p i ( λ ) = p i λ 1 λ , λ 0 ln p i , λ = 0
λ = arg max L ( λ )
L ( λ ) = n 2 ln 1 n i = 1 n p i λ 1 n i = 1 n p i λ + ( λ 1 ) i = 1 n ln p i
where p i and p i ( λ ) are the production (or living or ecological) risk indexes before and after the transformation of the i th grid; λ is the transformation parameter corresponding to the maximum value of L ( λ ) in Equation (4); and n is the total number of grids.
Then, the transformed p i ( λ ) is normalized. In general, the risk index has a minimum value of 0 and a maximum value of 1. The normalization equation is as follows.
p s i = p i ( λ ) min p i ( λ ) max   p i ( λ ) min p i ( λ )
where p s i is the production (or living or ecological) risk index after the Box–Cox transformation and normalization. For any region A, the weighted average risk index PA of the region is calculated using Equation (4):
P A = i = 1 m s i × p s i S A
where m is the total number of grids in region A, si is the area of the ith grid in region A, and SA is the total area of region A.

2.4. Principles and Methods for Determining Category to Cope with the PLE Risks

The categories are used to characterize the intensity of the implementation of strategies and countermeasures to cope with the production, living, and ecological risks in a certain province. The categories are classified according to the category and size of the PLE risk, with decreasing implementation strength from category A to category C (Table 1). Category A zones include areas at a high risk for all three risk types, and areas at a high risk for two of the risk types and at an intermediate risk for the remaining risk type. Category B zones include areas at a high risk for one risk type and an intermediate risk for the remaining risk types; areas at a high risk for one risk type, intermediate risk for one risk type and low risk for the remaining risk type; areas at an intermediate risk for all three risk types; and areas at an intermediate risk for two risk types and a low risk for the remaining risk type. Category C zones include areas at an intermediate risk for one risk type and a low risk for the remaining risk types, and areas at a low risk for all three risk types.

3. Results

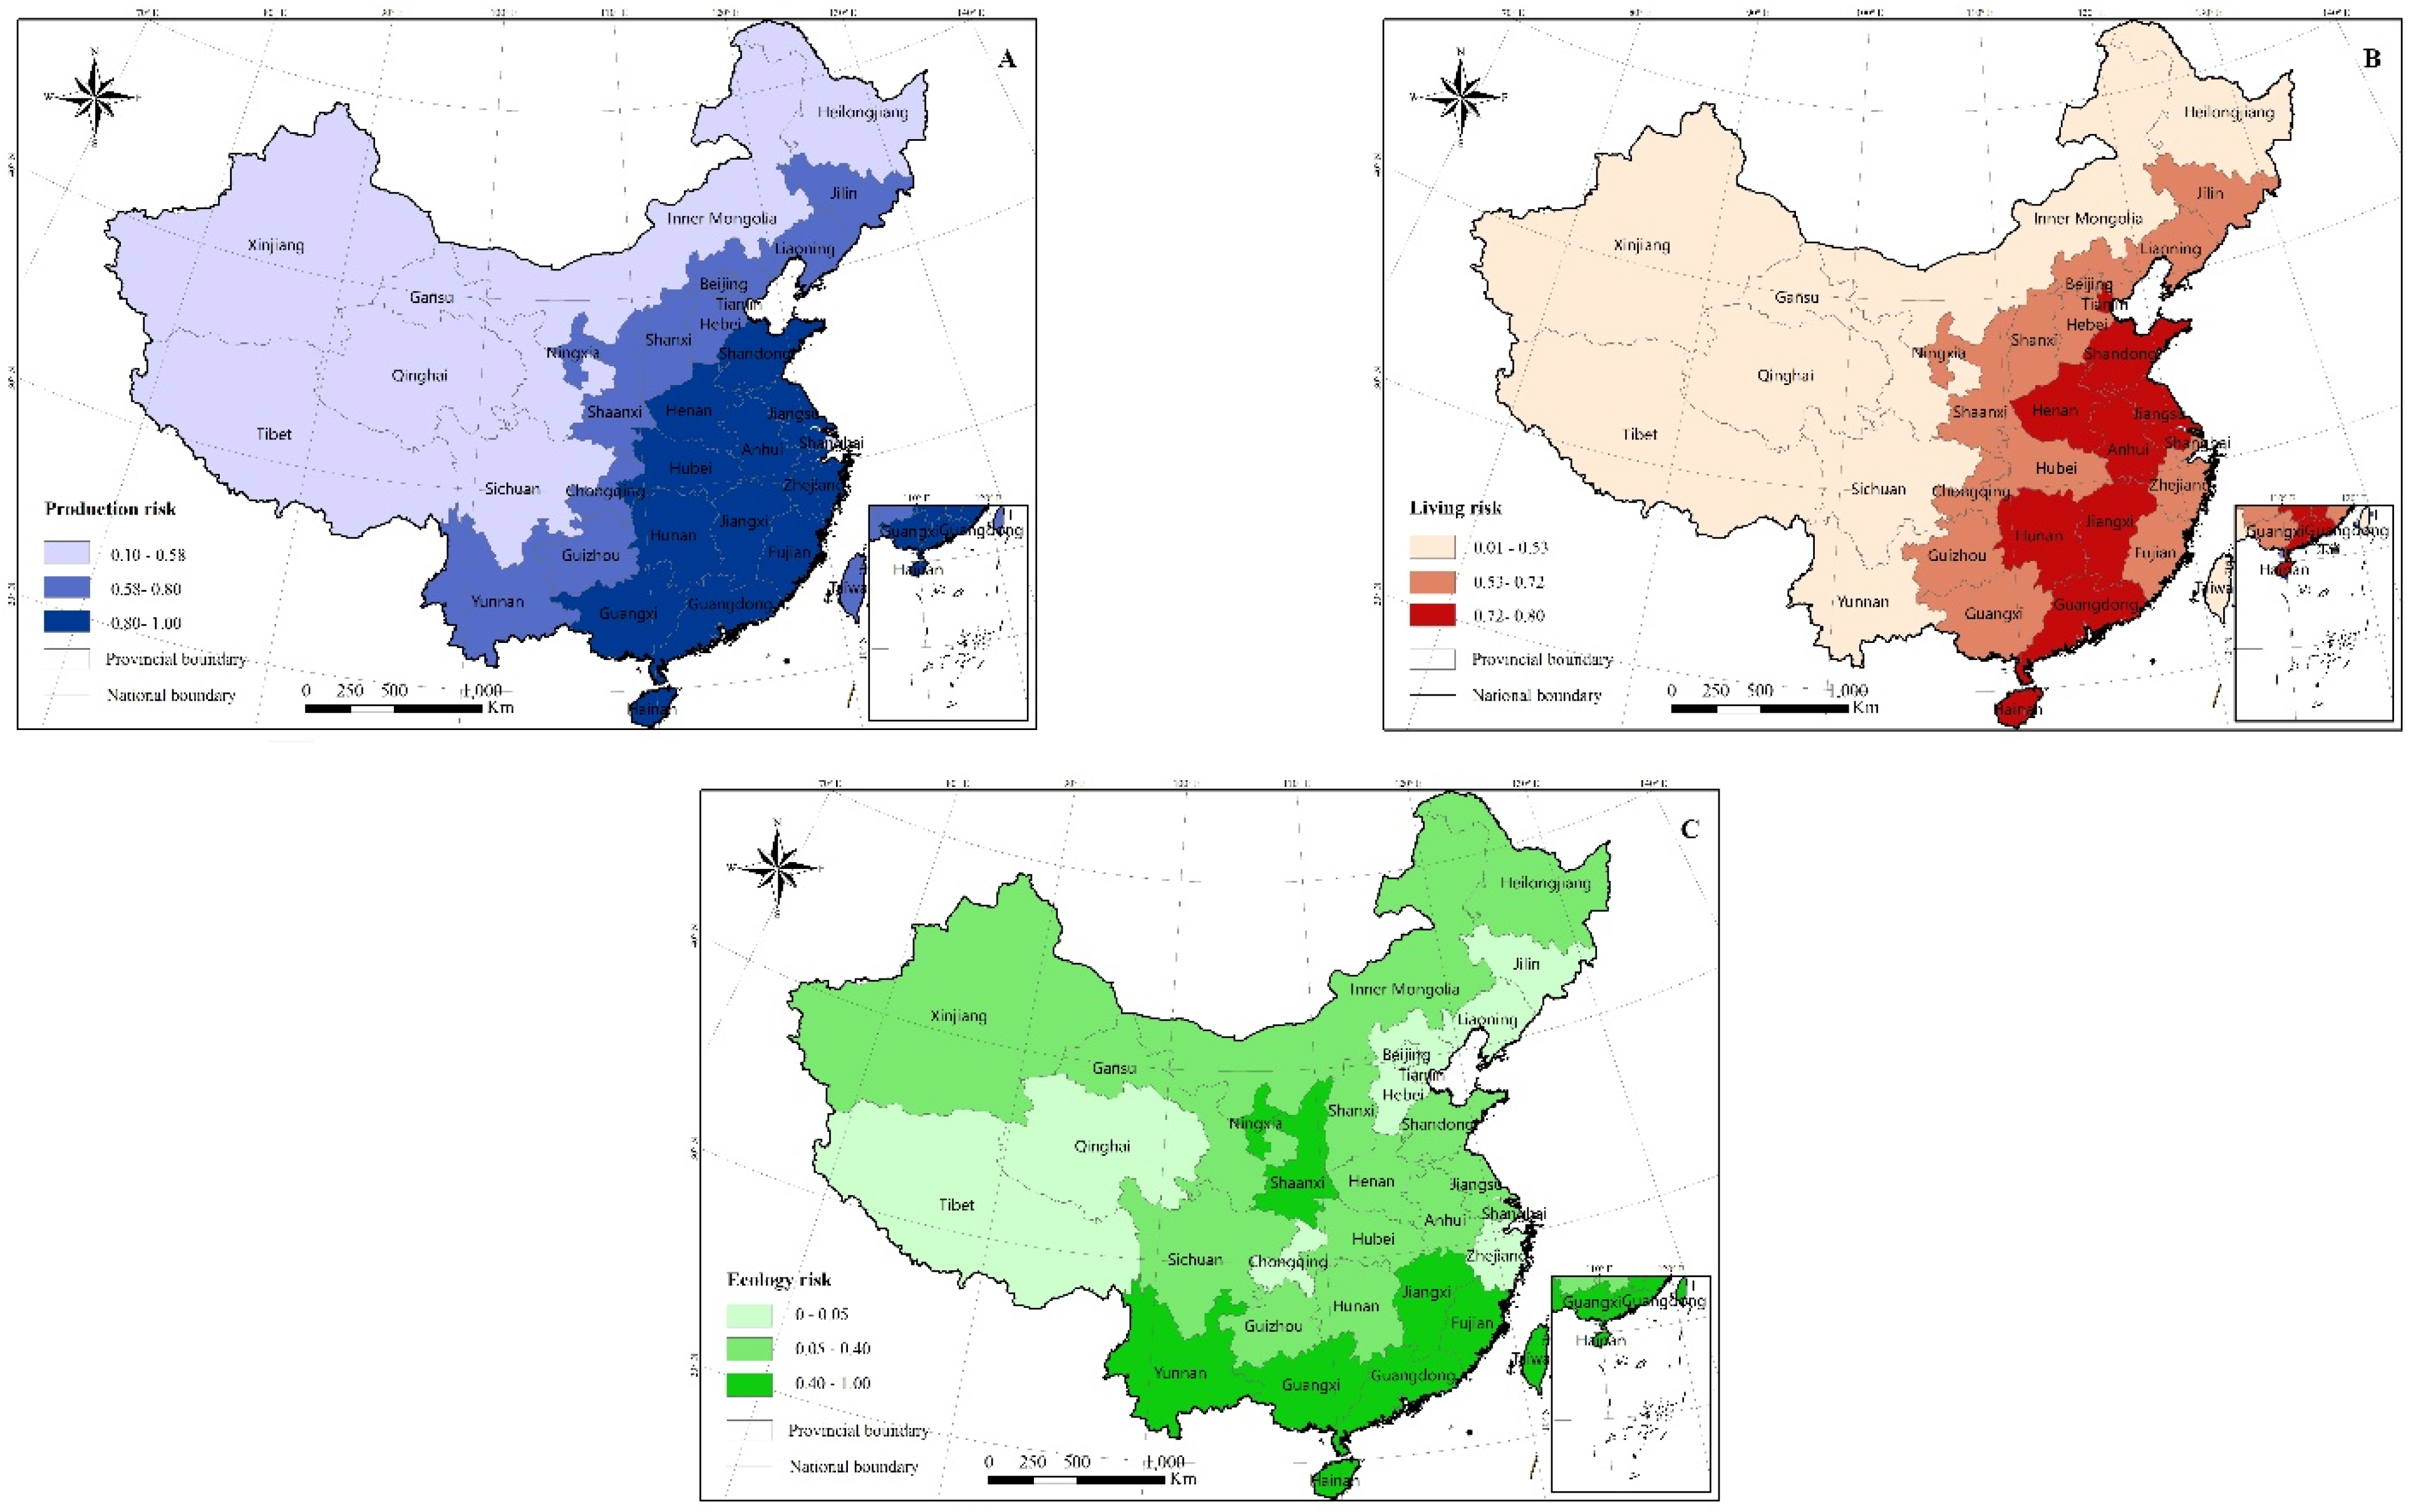
3.1. Distribution Patterns of Production, Living, and Ecological Risks in the Provinces of China under Climate Change

The production risk index for each province varies between 0.10 and 1.00. Approximately 81% of the provinces have a risk index above 0.50. The overall production risk level in China is high. The areas with a high production risk are concentrated along the southeastern coast and in the Huang–Huai–Hai area (Figure 3A), which mainly includes 12 provinces, such as Guangdong, Fujian, Guangxi, Shandong, and Henan, with a risk index higher than 0.80. The high production risk of the southeastern coastal areas occurs under the influences of floods, while that of the Huang–Huai–Hai region is affected not only by floods, but also by droughts. The areas with an intermediate production risk are distributed to the west of the areas with a high production risk, such as Jilin, Liaoning, Beijing, Tianjin, Hebei, Shanxi, Ningxia, Shaanxi, Chongqing, Guizhou, and Yunnan from northeast to southwest, with risk indexes from 0.58 to 0.80. The areas with a low production risk are mainly distributed in arid and semiarid areas, such as Inner Mongolia, Xinjiang, Gansu, Qinghai, Tibet, Heilongjiang, and Sichuan, with a risk index of less than 0.58.
The living risk index is concentrated in the range of 0.01–0.80. In 75% of the provinces, it is concentrated above 0.5 and most of these provinces are at a high level of living risk. The areas with a high living risk are mainly distributed in eight provinces in North China and the middle and lower reaches of the Yangtze River, such as Shandong, Henan, Jiangsu, Jiangxi, and Hunan, with a risk index above 0.72. The concentrated distribution of areas with a high living risk in this region is a result of the joint effect of heat waves and floods, as well as the high exposure of hazard-affected objects due to a high population density. The areas with an intermediate living risk are mainly distributed in the 13 central and coastal provinces surrounding the areas with a high living risk, such as Jilin, Liaoning, Beijing, Hebei, Shanxi, and Zhejiang, with risk indexes of 0.53–0.72. The areas with a low living risk are mainly concentrated in Heilongjiang, Inner Mongolia, Gansu, Ningxia, Yunnan, and Xinjiang, with risk indexes of 0.01–0.53.
The ecological risk index varies from 0 to 1.00 in China. In addition, 84% of the provinces have an ecological risk index below 0.50, indicating the low level of ecological risk in China in general. Only five provinces, such as Hainan, Guangdong, Guangxi and Yunnan in southern China and Ningxia in the middle and upper reaches of the Yellow River, have an ecological risk index above 0.50. The areas with an intermediate ecological risk include Xinjiang, Inner Mongolia, and Gansu in northwestern China, as well as Sichuan and Guizhou in the Yangtze River, and Shaanxi and Henan in the Yellow River basins, with risk indexes ranging from 0.05 to 0.40. The areas with a low ecological risk include Qinghai and Tibet, as well as Jilin and Liaoning, with ecological risk indexes below 0.05. The spatial pattern of ecological risk is different from that of production or living risk, with no evident distribution pattern. The ecological risk levels are relatively high in Heilongjiang, Inner Mongolia, Xinjiang, Gansu, and Sichuan, where production and living risks are both at low levels. The native ecosystems in these areas are fragile, and changes in temperature and precipitation are susceptible to changes in their ecological functions and services.

3.2. Problem Diagnosis for Coping with PLE Risk at the Provincial Level in China

Based on the levels of PLE risks, the provinces in China are classified into three categories to cope with PLE risks (A, B, and C), and potential problems and challenges in the areas of the three categories are identified based on mathematical statistics and spatial analysis (Figure 4). Category A zones in China span 10 provinces (e.g., Guangdong, Fujian, Jiangsu and Anhui). Of these 10 provinces, Hainan, Guangdong, and Jiangxi are all at high levels of these three types of risk (Table 2). Furthermore, Hainan and Guangdong, where the PLE risks are all high, are within the optimized development zones, such as the Guangdong-Hong Kong-Macao Greater Bay Area and the Hainan Free Trade Port, as well as the Beibu Gulf Economic Zone, which are key areas with high production and ecological risks (Figure 4A). These regions are characterized by developed economies, dense populations, and high development intensities. In addition, Jiangxi, Jiangsu, and Henan, located in the main agricultural production zones of the Yellow River and Yangtze River Basins in China, have the highest levels of production risk. Moreover, these provinces are densely populated, so the living risk is high during floods and heat waves. For example, the heavy rainfall in Henan Province in July 2021 resulted in extensive casualties and economic losses. Due to the frequent occurrence of inland floods, which have caused significant losses in recent years, flooding has become one of the major disaster types in North China. The provinces in the category A zones also have different values among production, living and ecological risks, and future development and layout should be considered the main problem in each area.
Most of the 16 provinces and cities in the category B zones in China are located to the west of the category A zones. The category B areas include the main agricultural production zones in the Northeast Plain, the Huang-Huai-Hai Plain, the Fen-Wei Plain, and the Yangtze River Basin regions, with excellent background conditions, abundant cultivated land, and favorable conditions for agricultural development. However, due to the environmental changes and human activities in recent years, Hubei and Zhejiang are projected to be at a high production risk under future climate change, and Liaoning, Tianjin, Hebei, and Guizhou are at an intermediate production risk. Ningxia and Shaanxi, which are located in national key ecological function zones, have intermediate production and living risks but high ecological risks, with ecological risk indexes as high as 0.62 and 0.48, ranking fourth and sixth among the 32 provinces, respectively. Severe challenges have been created in the four major grain-producing areas by the PLE risks and their regional differences in category B zones, thus, mitigating the conflicts of spatial land use allocation is key.
The category C zones are mainly located on the Tibetan Plateau and in Northwest China, with low production, living and ecological risk levels. Among them, Inner Mongolia, Gansu, and Sichuan have low production and living risks but an intermediate ecological risk, with ecological risk indexes of 0.27, 0.26, and 0.10, respectively. In addition, these areas are home to the Great and Lesser Khingan forest regions, the Hunshandake desertification control zone, the important water supply ecological function zone of the Yellow River in Gannan, and the ecological functional zones of Sichuan-Yunnan forest and biodiversity. The PLE risks in the category C risk areas need to be optimized based on local conditions and optimally managed according to risk characteristics. In addition, the PLE risks are low in the areas to the west and north of the boundary between category C and categories A and B but are complex and gradually aggravated to the east of the boundary. In other words, the PLE risks are low in the western regions, with low population densities and socioeconomic development levels, thus, suggesting that there is a lack of practical meaning in analyzing the risks without considering the associated hazard-affected objects.

3.3. Strategy to Cope with PLE Risk

Based on the diagnostic analysis of PLE risks and spatial conflicts in China’s provinces, specific plans are proposed for each category (Table 3). Countermeasures, which were combined with the types and degree of risk, mainly target the two elements of risk, aiming to reduce exposure and vulnerability.
In the category A zone, the coping strategies target production, living and ecological risks. Establishing disaster risk monitoring and early warning systems is recommended, as well as to raise natural disaster prevention standards for the southeastern coastal areas of Jiangsu, Fujian and Guangdong; the main agricultural production areas of the Yellow River (such as Henan) and Yangtze River Basins (such as Jiangxi); and the main production areas of South China (such as Guangxi). In coastal cities, improving typhoon and storm tide mitigation systems and strengthening the construction of seawalls are very important. The optimization of urban waterlogging drainage systems is necessary for reducing the economic losses and number of casualties caused by urban waterlogging. The protection of marine ecosystems and construction of coastal ecological shelters are required. Urban ecological protection areas with the potential to serve as ecological shelters, such as areas in Nanning and Haikou, could be developed to alleviate the urban heat island effect. Travel should be reduced in periods of heat waves and floods, and densely populated areas should not be planned in extreme event-prone regions. Droughts in winter and spring are the main disasters on the Huang–Huai–Hai Plain, and floods in summer are the primary disasters in the main agricultural production areas of the Yangtze River Basin and South China, which indicates the importance of natural disaster monitoring and early warning systems. Energy structure transformation and a reduction in greenhouse gases and other pollutant emissions would further help China to achieve carbon neutrality by 2060.
In category B zones, the strategies mainly target production and living risks. On the one hand, we start with risk prediction, improving the flood and drought early warning system, and taking precautionary measures against disasters. On the other hand, we optimize areas by reducing the vulnerability of hazard-affected objects such as social development and grain production to strengthen self-adaptation and restorability in responding to disaster. Specifically, natural disaster risk monitoring and early warning systems must be established in the main agricultural production areas to scientifically and efficiently avoid disaster risks. Agricultural infrastructure construction is recommended in traditional agricultural production areas, such as the Huang–Huai–Hai Plain and the Northeast Plain, in order to improve the mechanization rate and water use efficiency. Accelerating the development of competitive agriculture and the integration of farming and animal husbandry is important to promote the coordinated development of economic and ecological agriculture. We recommend strengthening the protection of black earth on the Northeast Plain. The tourism industry characterized by culture should be rationally structured, and the development of ice/snow-related tourism resources should be strengthened. In addition, in the eastern regions with high population densities, such as Hebei and Zhejiang, promoting relocation programs and planning regional relocation are important in disaster-prone areas. In urban areas, rational planning in urban agglomerations, and constructing emergency disaster infrastructure in densely populated urban agglomerates is necessary.
Category C zones are mainly home to national key ecological function areas. The focus is on maintaining the ecosystem services in key ecological function areas under the influence of different natural disasters, improving the agricultural production capacity, and protecting the natural environment in national development-prohibited zones. Comprehensive projects for water and soil erosion and land desertification control are recommended in the middle and upper reaches of the Yangtze River and the Yellow River, where ecological risks are high, in order to promote ecosystem restoration and reconstruction. Improving the ecosystem environment and maintaining the original ecosystems are important. In ecologically fragile areas, restoration and protection projects should be strengthened. Enhancing grassland grazing management and optimizing irrigation measures are the necessary measures. Qinghai and Tibet, where production, living, and ecological risks are low, encompass large areas of national nature reserves. The best measures are to maintain their original statuses, reduce the impact of human activities on the ecological environment of the plateau, and perfect ecological protection laws and regulations.

4. Discussion and Conclusions

4.1. Discussion

In this study, it is worth noting that the production, living, and ecological risks are near zero in 23% of the regions in China, which are mainly distributed on the Tibetan Plateau and along the southeastern margin of Xinjiang. Although the PLE risks are close to zero in these regions, their comprehensive development levels are low, and their development and utilization values are at lower levels compared to those of the southeastern coastal areas from the perspective of territorial spatial planning. Notably, the low degree of socioeconomic development and the low exposure of the hazard-affected objects in these regions results in low PLE risks. This conclusion reflects the problems in risk research: risk-prone areas may not have poor development potential, and near-zero risk areas may not have high development potential. Therefore, the joint effect of disaster-inducing and hazard-affected objects should be comprehensively considered. That is, an area with high development potential should not be solely determined based on its superior natural geographical conditions and resource endowment, and factors such as socioeconomic conditions should be considered. Thus, the final results of spatial optimization can resolve the conflict between social development and ecological civilization construction. In addition, quantitative optimization for PLE risks in the space is an important issue. However, due to validation indexes, their basic data for quantitative optimization has not been obtained, and the optimization models are also being further improved, so they are not shown in this work. In the future, if the data and methods are perfected to meet the objective, we would quantify the optimization research for PLE risks.

4.2. Conclusions

This study identifies the production, living, and ecological risks in China based on our research results of previous climate change risk assessments; converts these risks to PLE risk at the provincial scale through a Box–Cox transformation; and classifies the whole region into three categories: A, B and C. A strategy to cope with PLE risk in China considering provincial differences is proposed based on an analysis of the conflicts and problems related to risks. The main results are as follows:
(1)
Under climate change scenarios, various provinces in China had different levels of production, living, and ecological risks due to the impact of different disasters. When affected by heat waves and floods, the production and living risks were high in Jiangsu and Guangdong in the southeastern coastal areas of China. Due to the impact of droughts, the production risks were high in Shandong, Anhui, and Henan of the Huang–Huai–Hai Plain area. When affected by floods, the living risks were high in Jiangxi and Jiangsu in the middle and lower reaches of the Yangtze River. With the gradual changes in climatic factors such as temperature and precipitation, the ecological risks were high in Yunnan and Guangxi in southern China, and Ningxia and Shaanxi in the middle and upper reaches of the Yellow River.
(2)
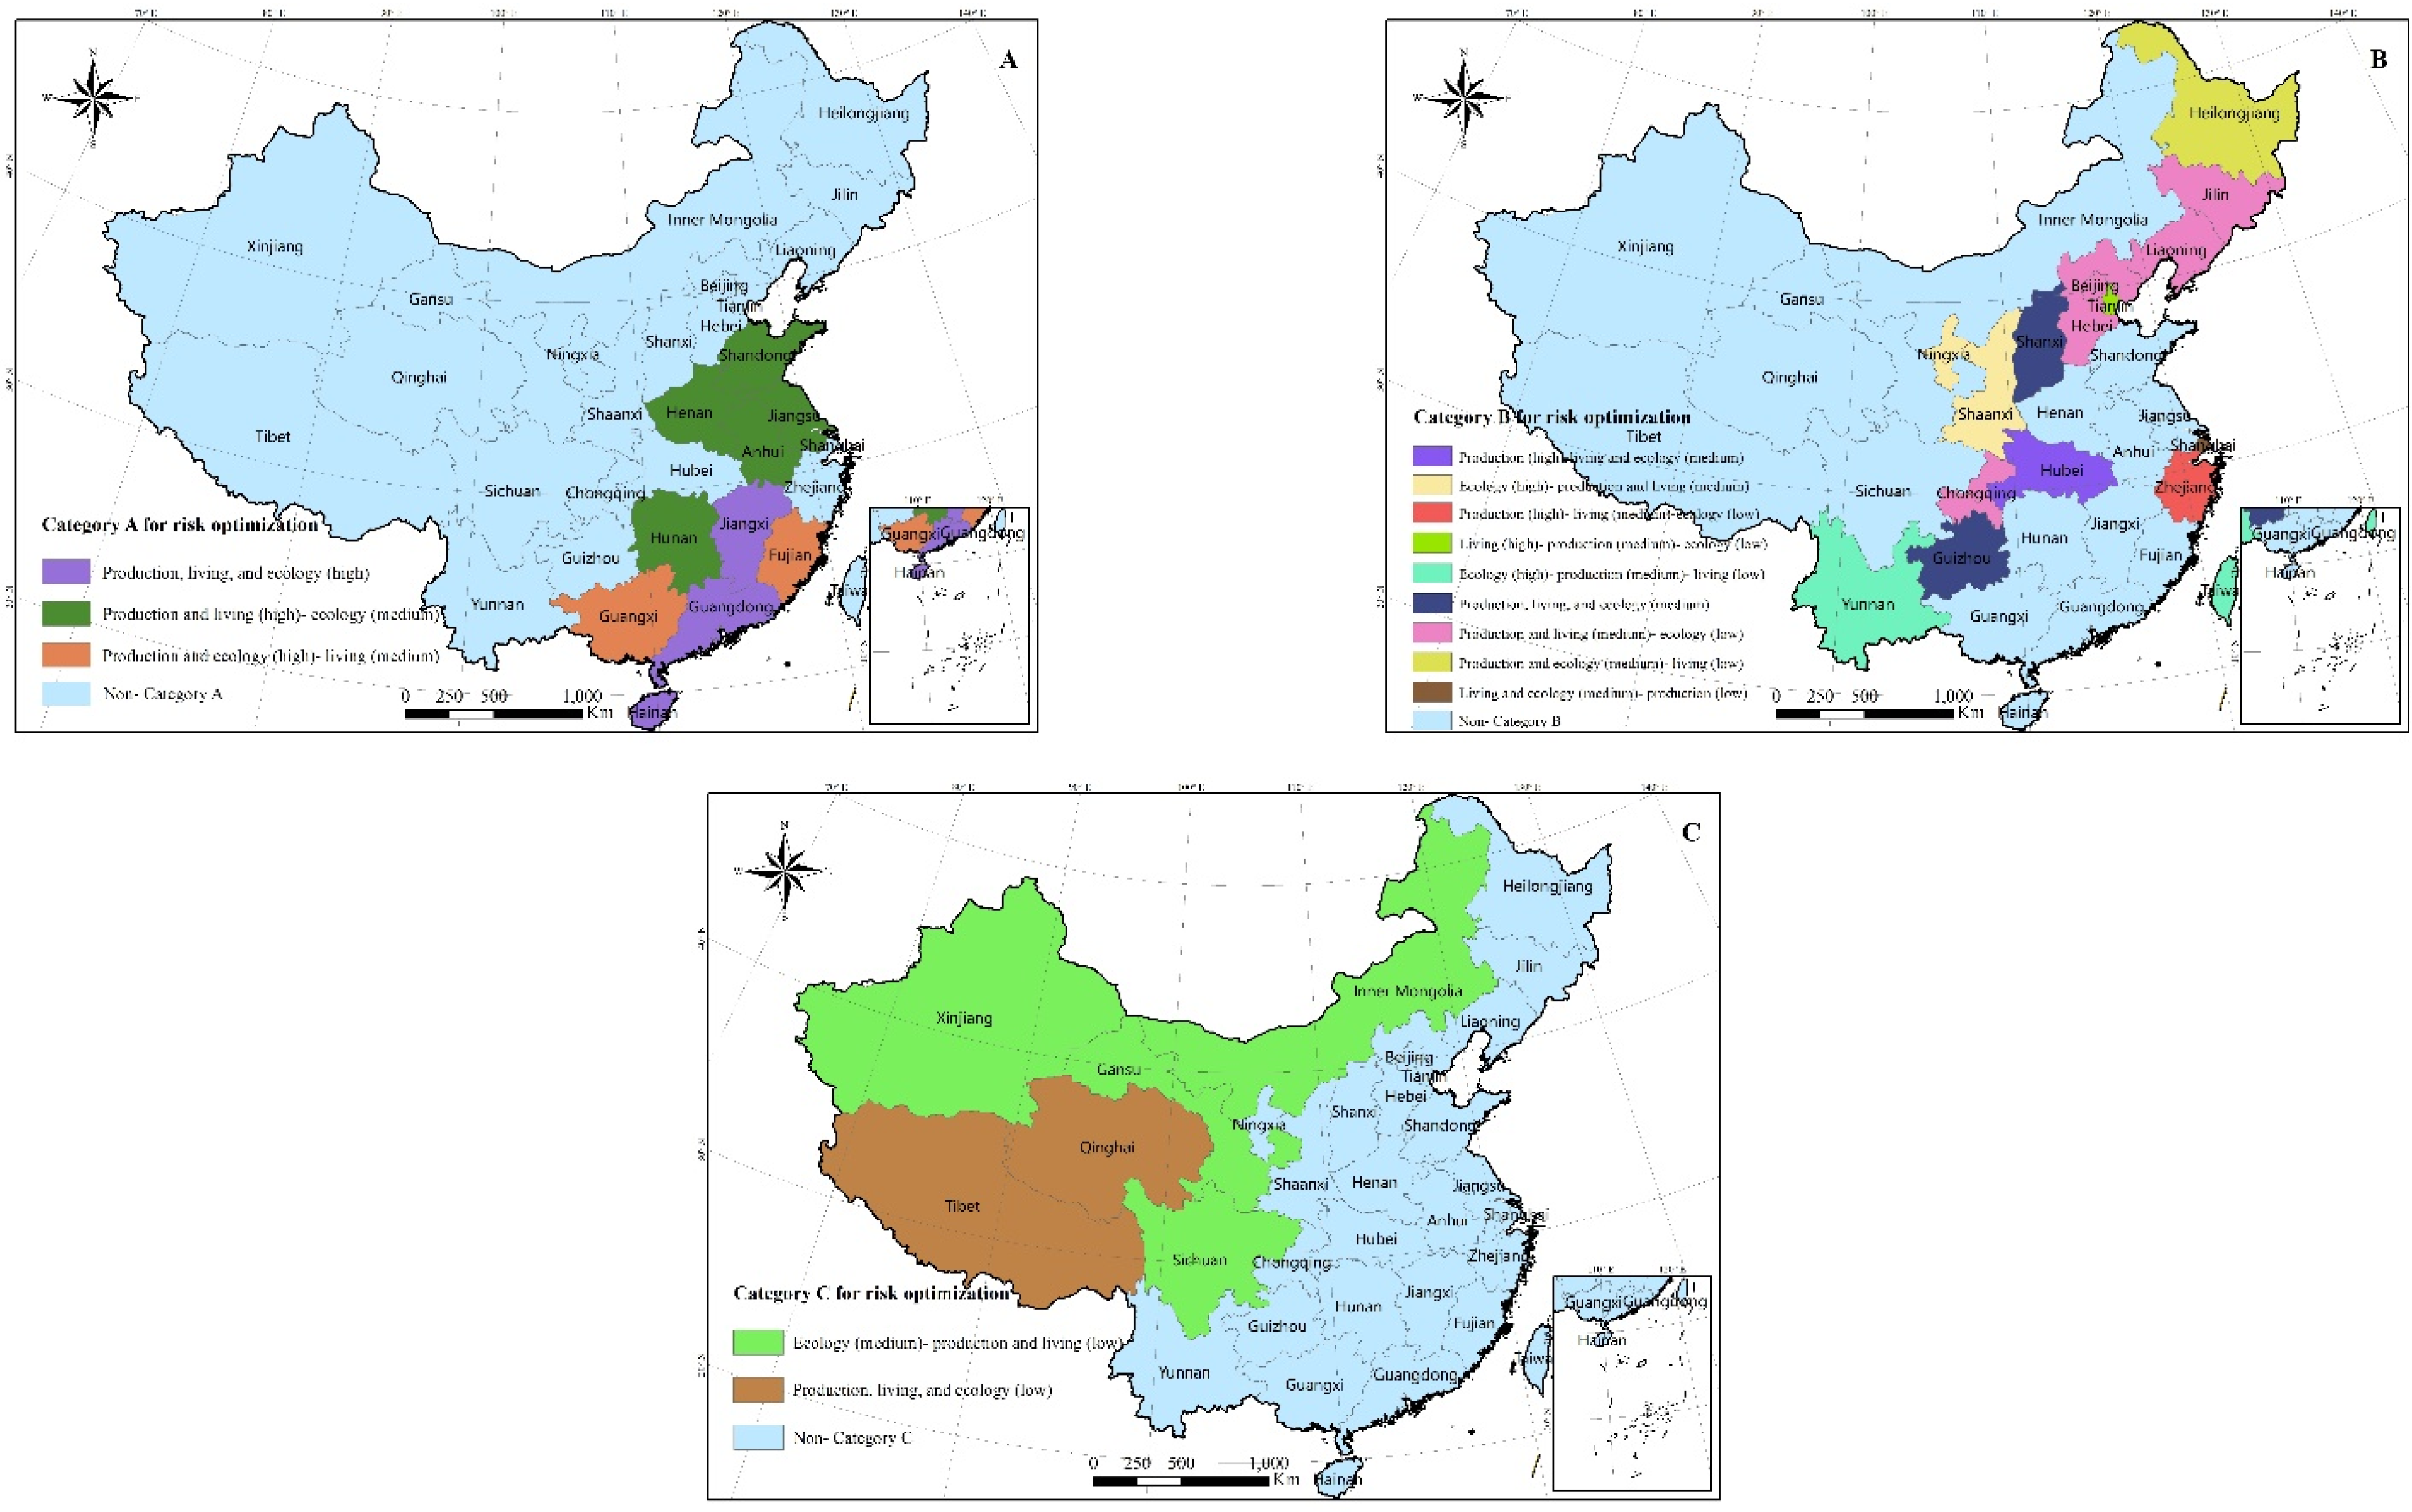
Based on the production, living, and ecological risks in various provinces in China, these provinces were classified into three categories to cope with PLE risks: A, B and C. Category A zones include the Guangdong-Hong Kong-Macao Greater Bay Area with Guangzhou as the center, the Beibu Gulf optimized development zone with Nanning as the center, the Hainan Free Trade Port, and Henan and Jiangsu in the main production areas of the Huang–Huai–Hai Plain. Category B zones include Heilongjiang, Hebei, Hubei, and Guizhou in the main production areas of the Northeast Plain, the Huang–Huai–Hai Plain, and the Yangtze River Basin. Category C zones include Inner Mongolia, Xinjiang, Qinghai, and Tibet, which are located in national key ecological function zones and development-prohibited zones.
(3)
Strategies to cope with PLE risk in China were proposed from the perspective of territorial spatial planning. The specific recommendations for each category to cope with the risks are as follows. Category A zones should be optimized by establishing disaster risk monitoring and early warning systems for the southeastern coast and the main agricultural production areas to cope with high risks. Moreover, urban protection areas with the potential to serve as ecological shelters, such as Nanning and Haikou, should be developed. The economic and energy structures should be adjusted, and greenhouse gases and other pollutant emissions should be controlled. Category B zones are mainly characterized by high production and living risks. In the main production areas of the Huang–Huai–Hai Plain, the construction of agricultural infrastructure and improving the agricultural mechanization rate is key. Promoting water-saving economics is very important, especially in this area, which suffers from water shortages. Additionally, crops with strong adaptability need to be established in each main production area. Relocation programs are necessary for disaster-prone rural areas with living risks at a high level. In category C zones, where ecological risks are the focus, strengthening ecological restoration and permafrost protection in ecologically fragile areas, and reducing the impact of human activities are indispensable. For the three-river source region, the improvement of water use efficiency is important. The stability of alpine ecosystems should be maintained. The ice/snow-related tourism resources are an opportunity for Northeast China.
This study compensated for the fact that few previous studies on territorial space planning have included the impact of natural disasters or hazard-affected bodies under future climate change, which suggests that study in this field should add the factor of natural disaster risk generated by climate change, especially the impact of hazard-affected bodies. It could provide a more comprehensive level of scientifical support for the PLE space optimization, enable a new perspective for researchers in related fields, and also provide a decision-making basis for policy makers. In the future, we will develop and improve a more scientific model to quantify the optimization of territorial space, combined with the existing research.

Author Contributions

Conceptualization, W.H. and S.W.; Data curation, W.H. and H.D.; Formal analysis, W.H.; Methodology, M.W., H.D. and L.L.; Project administration, S.W.; Software, L.L.; Supervision, L.Y. and Y.Y.; Validation, J.G. and X.L.; Visualization, W.H.; Writing―original draft, W.H. and S.W. All authors have read and agreed to the published version of the manuscript.

Funding

This research was financially supported by the “Strategic Priority Research Program” of the Chinese Academy of Sciences, No. XDA23100403, No. XDA19040304.

Institutional Review Board Statement

Not applicable.

Informed Consent Statement

Not applicable.

Data Availability Statement

Not applicable.

Acknowledgments

Thank you to everyone who contributed to this study.

Conflicts of Interest

The authors declare no conflict of interest.

References

  1. Xiao, C.D.; Wang, S.J.; Qin, D.H. A preliminary study of cryosphere service function and value evaluation. Adv. Clim. Change Res. 2015, 6, 181–187. [Google Scholar] [CrossRef]
  2. Jenkins, K.; Dobson, B.; Decker, C.; Hall, J.W. An integrated framework for risk-based analysis of economic impacts of drought and water scarcity in England and Wales. Water Resour. Res. 2021, 57, e2020WR027715. [Google Scholar] [CrossRef]
  3. Bonan, G.B.; Doney, S.C. Climate, ecosystems, and planetary futures: The challenge to predict life in Earth system models. Science 2018, 359, 6375. [Google Scholar] [CrossRef]
  4. IPCC. 2021: Summary for Policymakers. In Climate Change 2021: The Physical Science Basis. Contribution of Working Group I to the Sixth Assessment Report of the Intergovernmental Panel on Climate Change; Cambridge University Press: Cambridge, UK; New York, NY, USA, 2021; pp. 3–32. [Google Scholar]
  5. Sanderson, B.M.; Xu, Y.Y.; Tebaldi, C.; Wehner, M.; O’Neill, B.; Alexandra, J.; Pendergrass, A.G.; Lehner, F.; Strand, W.G.; Lin, L.; et al. Community climate simulations to assess avoided impacts in 1.5 and 2 °C futures. Earth Syst. Dyn. 2017, 8, 827–847. [Google Scholar] [CrossRef]
  6. Dosio, A.; Fischer, E.M. Will half a degree make a difference? Robust projections of indices of mean and extreme climate in Europe under 1.5, 2, and 3 °C global warming. Geophys. Res. Lett. 2018, 45, 935–944. [Google Scholar] [CrossRef]
  7. Cao, L.; Zhu, Y.N.; Tang, G.L.; Yuan, F.; Yan, Z. Climatic warming in China according to a homogenized data set from 2419 stations. Int. J. Clim. 2016, 36, 4384–4392. [Google Scholar] [CrossRef]
  8. Fang, J.; Kong, F.; Fang, J.Y.; Zhao, L. Observed changes in hydrological extremes and flood disaster in Yangtze River Basin: Spatial-temporal variability and climate change impacts. Nat. Hazards 2018, 93, 89–107. [Google Scholar] [CrossRef]
  9. Peng, J.; Wei, H.; Wu, W.H.; Liu, Y.X.; Wang, Y.L. Storm flood disaster risk assessment in urban area based on the simulation of land use scenarios: A case of Maozhou Watershed in Shenzhen City. Acta Ecol. Sin. 2018, 38, 3741–3755. [Google Scholar]
  10. Kang, S.; Eltahir, E.A.B. North China Plain threatened by deadly heatwaves due to climate change and irrigation. Nat. Commun. 2018, 9, 2894. [Google Scholar] [CrossRef]
  11. Ding, Y.H.; Ren, G.Y.; Shi, G.Y.; Gong, P. National assessment report of climate change (I): Climate change in China and its future trend. Adv. Clim. Change Res. 2006, 2, 3–8. [Google Scholar]
  12. Wallemacq, P.; Below, R.; McLean, D. Economic Losses, Poverty, and Disasters 1998–2017; Centre for Research on the Epidemiology of Disasters (CRED); United Nations Office for Disaster Risk Reduction (UNISDR); United Nations: New York, NY, USA, 2018. [Google Scholar]
  13. The State Council of the People’s Republic of China. The Information Office of the State Council Held a Press Conference on Flood Control and Disaster Relief Work. 2020. Available online: http://www.gov.cn/xinwen/2020-08/13/content_5534534.htm (accessed on 20 June 2022).
  14. Yin, J.; Xu, S.J.; Jing, Y.M.; Yin, Z.E.; Liao, B.G. Evaluating the impact of fluvial flooding on emergency responses accessibility for a mega-city’s public services: A case study of emergency medical service. Acta Geogr. Sin. 2018, 73, 1737–1747. [Google Scholar]
  15. Zhang, J.Z.; Yuan, F.; Wang, J.; Sun, H.M.; Liu, H.; Ma, W.L. The rainstorm and flooding disaster risk in Beijing under the global warming of 1.5 °C and 2.0 °C. Adv. Clim. Change Res. 2020, 16, 78–87. [Google Scholar]
  16. People’s Government of the People’s Republic of China. Win a Decisive Victory in Building a Moderately Prosperous Society in an All-Round Way and Win the Great Victory of Socialism with Chinese Characteristics in the New Era—Report at the 19th National Congress of the Communist Party of China. 2017. Available online: http://www.gov.cn/zhuanti/2017-10/27/content_5234876.htm (accessed on 20 June 2022).
  17. Yang, Y.; Bao, W.; Liu, Y. Coupling coordination analysis of rural production-living-ecological space in the Beijing-Tianjin-Hebei region. Ecol. Indic. 2020, 117, 106512. [Google Scholar] [CrossRef]
  18. Duan, Y.; Wang, H.; Huang, A.; Xu, Y.Q.; Lu, L.H.; Ji, Z.X. Identification and spatial-temporal evolution of rural “production-living-ecological” space from the perspective of villagers’ behavior—A case study of Ertai Town, Zhangjiakou City. Land Use Policy 2021, 106, 105457. [Google Scholar] [CrossRef]
  19. People’s Government of the People’s Republic of China. The 14th Five-Year Plan for National Economic and Social Development of the People’s Republic of China and Outline of Vision 2035. 2021. Available online: http://www.gov.cn/xinwen/2021-03/13/content_5592681.htm (accessed on 20 June 2022).
  20. Shi, J.; Cui, L.; Tian, Z. Spatial and temporal distribution and trend in flood and drought disasters in East China. Environ. Res. 2020, 185, 109406. [Google Scholar] [CrossRef]
  21. Wang, X.; Zhou, H.J. Progress and prospect of statistics and assessment of large-scale natural disaster damage and losses. Adv. Earth Sci. 2018, 33, 914–921. [Google Scholar]
  22. Steptoe, H.; Jones, S.E.O.; Fox, H. Correlations between extreme atmospheric hazards and global teleconnections: Implications for multihazard resilience. Rev. Geophys. 2018, 56, 50–78. [Google Scholar] [CrossRef]
  23. Shi, P.J.; Wang, J.W.; Zhang, G.F.; Kong, F.; Wang, J.A. Research review and prospects of natural disasters regionalization in China. Geogr. Res. 2017, 36, 1401–1414. [Google Scholar]
  24. Guo, R.; Chen, D.; Fan, J. Territory spatial planning system and the convergence between different levels. Geogr. Res. 2019, 38, 2518–2526. [Google Scholar]
  25. Wang, K.Y.; Chen, T. The reform of institutional environment based on the reconstruction of spatial planning in the new era. Geogr. Res. 2019, 38, 2541–2551. [Google Scholar]
  26. Fan, J. Draft of major function oriented zoning of China. Acta Geogr. Sin. 2015, 70, 16. [Google Scholar]
  27. Duan, Y.M.; Xu, Y.Q.; Huang, A.; Lu, L.H.; Ji, Z.X. Progress and prospects of “production-living-ecological” functions evaluation. J. China Agric. Univ. 2021, 26, 113–124. [Google Scholar]
  28. United Nations. United Nations Framework Convention on Climate Change. 1992. Available online: https://unfccc.int/resource/docs/convkp/conveng.pdf (accessed on 20 June 2022).
  29. Warszawski, L.; Frieler, K.; Huber, V.; Piontek, F.; Serdeczny, O.; Schewe, J. The inter-sectoral impact model intercomparison project (ISI-MIP): Project framework. Proc. Natl. Acad. Sci. USA 2014, 111, 3228–3232. [Google Scholar] [CrossRef]
  30. Murakami, D.; Yamagata, Y. Estimation of gridded population and GDP scenarios with spatially explicit statistical downscaling. Sustainability 2016, 11, 2106. [Google Scholar] [CrossRef]
  31. Xiong, W.; Lin, E.D. Performance of CERES-Maize in regional application. Chin. J. Agrometeorol. 2009, 30, 3–7. [Google Scholar]
  32. Wu, S.X.; Pan, T.; Liu, Y.H.; Deng, H.Y.; Jiao, K.W.; Lu, Q.; Feng, A.Q.; Yue, X.L.; Yin, Y.H.; Zhao, D.S.; et al. Comprehensive climate change risk regionalization of China. Acta Geogr. Sin. 2017, 72, 3–17. [Google Scholar]
  33. IPCC. Climate Change 2007: Impacts, Adaptations and Vulnerability: The Fourth Assessment Report of Working Group II; Cambridge University Press: Cambridge, UK, 2007. [Google Scholar]
  34. Wu, S.H.; Liu, L.L.; Gao, J.B.; Wang, W.T. Integrate risk from climate change in China under global warming of 1.5 and 2.0 °C. Earth’s Future 2019, 7, 1307–1322. [Google Scholar] [CrossRef]
  35. Wang, C.L.; Xiong, Y.F. Analysis of agricultural meteorological disasters in Shaanxi Province from 1981 to 2018 and their impact on grain production. E3S Web Conf. 2020, 204, 01002. [Google Scholar]
  36. Liu, X.F.; Pan, Y.Z.; Zhu, X.F.; Yang, T.T.; Bai, J.J.; Sun, Z.L. Drought evolution and its impact on the crop yield in the North China Plain. J. Hydrol. 2018, 564, 984–996. [Google Scholar] [CrossRef]
  37. Zhang, Y.; Liu, B.C.; Yang, X.J.; Liu, Y.; Bai, W.; Dong, B.C. Grain yield loss evaluation based on agro-meteorological disaster exposure in the middle-lower Yangtze Plain. Chin. J. Agrometeorol. 2018, 39, 280–291. [Google Scholar]
  38. Wang, J.; Fang, F.; Zhang, Q.; Wang, J.S.; Yao, Y.B.; Wang, W. Risk evaluation of agricultural disaster impacts on food production in southern China by probability density method. Nat. Hazards 2016, 83, 1605–1634. [Google Scholar] [CrossRef]
  39. Wang, X.J.; Xia, J.Q.; Dong, B.L.; Zhou, M.R.; Deng, S.S. Spatiotemporal distribution of flood disasters in Asia and influencing factors in 1980–2019. Nat. Hazards 2021, 108, 2721–2738. [Google Scholar] [CrossRef]
  40. Lassa, J.A.; Lai, Y.H.; Goh, T. Climate extremes: An observation and projection of its impacts on food production in ASEAN. Nat. Hazards 2016, 84, 19–33. [Google Scholar] [CrossRef]
  41. Wang, D.S.; Yuan, S.T. Analysis and simulation of 1980–2017 flood disasters in Yunnan province, China. Mt. Res. 2018, 36, 898–906. [Google Scholar]
  42. He, M.; Xu, Y.M.; Li, N.; Bai, L. Assessing heat wave risk in beijing by remote sensing. Ecol. Environ. Sci. 2017, 26, 635–642. [Google Scholar]
  43. Makakov, V.T.; Velichkova, R.T.; Simova, I.S.; MarKo, D.G. Floods Risk Assessment in Bulgaria. In Proceedings of the CBU International Conference on Innovations in Science and Education, Prague, Czech Republic, 22–24 March 2017. [Google Scholar]
  44. Sun, S.Q.; Lu, W.H.; Guo, J.M.; Qian, Y.Z.; Lu, J.J. Analysis of the epidemic characteristics of heat stroke and the influence of heat wave on it in Ningbo city from 2012 to 2016. J. Meteorol. Environ. 2019, 35, 66–71. [Google Scholar]
  45. Gong, Y.M.; Gou, A.P.; Tang, M. Research Progress of Urban Heat Wave Environment. In Proceedings of the 2nd International Conference on Civil Engineering, Environment Resources and Energy Materials, Changsha, China, 18–20 September 2020. [Google Scholar]
  46. De Troeyer, K.; Bauwelinck, M.; Aerts, R.; Profer, D.; Berckmans, J.; Delcloo, A.; Hamdi, R.; Van Schaeybroeck, B.; Hooyberghs, H.; Lauwaet, D.; et al. Heat related mortality in the two largest Belgian urban areas: A time series analysis. Environ. Res. 2020, 188, 109848. [Google Scholar] [CrossRef]
  47. Jonkman, S.N. Global perspectives on loss of human life caused by floods. Nat. Hazards 2005, 34, 151–175. [Google Scholar] [CrossRef]
  48. Heusinkveld, B.G.; Van Hove, L.W.A.; Jacobs, C.M.J.; Steeneveld, G.J.; Elbers, J.A.; Moors, E.J.; Holtslag, A.A.M. Use of a mobile platform for assessing urban heat stress in Rotterdam. In Proceedings of the 7th Conference on Biometeorology, Albert-Ludwigs-University, Freiburg, Germany, 12–14 April 2010. [Google Scholar]
  49. Hwang, M.K.; Bang, J.H.; Kim, S.; Kim, Y.K.; Oh, I. Estimation of thermal comfort felt by human exposed to extreme heat wave in a complex urban area using a WRF-MENEX model. Int. J. Biometeorol. 2019, 63, 927–938. [Google Scholar] [CrossRef]
  50. Gao, J.X.; Xu, D.L.; Qiao, Q.; Zou, C.X.; Wang, Y.; Tian, M.R.; Wang, Y. Pattern construction of natural ecological space and planning theory exploration. Acta Ecol. Sin. 2020, 40, 749–755. [Google Scholar]
  51. Zhang, X.; Liang, X.Y.; Liu, D.; Shi, Q.Q.; Chen, H. The resilience evolution and scenario simulation of social-ecological landscape in the fragile area. Acta Geogr. Sin. 2019, 74, 1450–1466. [Google Scholar]
  52. Meng, H.; Wang, L.; Zhang, Z.S.; Xue, Z.S.; Lu, X.G.; Zou, Y.C. Researches on the impacts of climate change on spatial distribution and main ecological functions of inland wetland ecosystem in China. Wetl. Sci. 2016, 14, 710–716. [Google Scholar]
  53. Mori, A.S. Advancing nature-based approaches to address the biodiversity and climate emergency. Ecol. Lett. 2020, 23, 1729–1732. [Google Scholar] [CrossRef]
  54. Jennings, M.D.; Harris, G.M. Climate change and ecosystem composition across large landscapes. Landsc. Ecol. 2017, 32, 195–207. [Google Scholar] [CrossRef]
  55. Piao, S.L.; Zhang, X.Z.; Wang, T.; Liang, E.Y.; Wang, S.P.; Zhu, J.T.; Niu, Z. Responses and feedback of the Tibetan Plateau’s alpine ecosystem to climate change. Chin. Sci. Bull. 2019, 64, 2842–2855. [Google Scholar] [CrossRef]
  56. Sleeter, B.M.; Marvin, D.C.; Cameron, D.R.; Selmants, P.C.; Westerling, A.L.; Kreitler, J.; Daniel, C.J.; Liu, J.X.; Wilson, T.S. Effects of 21st-century climate, land use, and disturbances on ecosystem carbon balance in California. Glob. Change Biol. 2019, 25, 3334–3353. [Google Scholar] [CrossRef]
  57. Fang, J.Y.; Zhu, J.L.; Shi, Y. The responses of ecosystems to global warming. Chin. Sci. Bull. 2018, 63, 136–140. [Google Scholar] [CrossRef] [Green Version]
  58. Wu, S.H.; Gao, J.B.; Deng, H.Y.; Liu, L.L.; Pan, T. Climate change risk and methodology for its quantitative assessment. Prog. Geogr. 2018, 37, 28–35. [Google Scholar]
  59. Box, G.; Cox, D. An analysis of transformations revisited. J. R. Stat. Soc. B Methodol. 1964, 26, 211–246. [Google Scholar]
Figure 1. Evaluation system of production, living, and ecology risks.
Land 11 01424 g001
Figure 2. Distribution pattern of production (A), living (B), and ecological (C) risk level at grid scale under climate change scenario.
Land 11 01424 g002
Figure 3. Distribution pattern of production (A), living (B), and ecology (C) risk level at provincial scale under climate change scenario.
Land 11 01424 g003
Figure 4. Distribution pattern of category A (A), B (B), and C (C) to cope with PLE risk.
Land 11 01424 g004
Table 1. Contents of categories to cope with PLE risks.
CategoriesContentsValues
A(1) Production, living, and ecology risks all at a high level
(2) Two types of production, living, and ecology risks are at a high level, and the remining risk is at a medium level
(1) Production risk
High: 0.80–1.00
Medium: 0.58–0.80
Low: 0.10–0.58
(2) Living risk
High: 0.72–0.80
Medium: 0.53–0.72
Low: 0.01–0.53
(3) Ecology risk
High: 0.40–1.00
Medium: 0.05–0.40
Low: 0–0.05
B(1) One type of production, living, and ecology risk is at a high level, and the remining risks are at a medium level
(2) One type of production, living, and ecology risk is at a high level, one is at a medium level, and the other is at a low level
(3) Production, living, and ecology risks are all at a medium level
(4) Two types of production, living, and ecology risks are at a medium level, and the remining risk is at a low level
C(1) One type of production, living, and ecology risk is at a medium level, and the remining risks are at a low level
(2) Production, living, and ecology risks are all at a low level
Table 2. Statistical analysis within the categories to cope with production, living, and ecology risks.
CategoriesDistribution
Risks LevelProvinces
AProduction, living, and ecology risks are all at a high levelGuangdong, Hainan, Jiangxi
Production and living risks are at a high level, and ecology risks at a medium levelHenan, Jiangsu, Shandong, Anhui, Hunan
Production and ecology risks are at a high level, and living risks at a medium levelFujian, Guangxi
Ecology risk is at a high level, production risk at a medium level, and living risk at a low levelYunnan
BProduction risk is at a high level, and living and ecology risk is at a medium levelHubei
Ecology risk is at a high level, and living and ecology risk is at a medium levelShaanxi, Ningxia
Production risk is at a high level, living risk is at a medium level, and ecology risk is at a low levelZhejiang
Living risk is at a high level, production risk is at a medium level, and ecology risk is at a low levelTianjin
Ecology risk is at a high level, production risk is at a medium level, and living risk is at a low levelTaiwan
Production, living, and ecology risks are all at a medium levelShanxi, Guizhou
Production and living risks are at a medium level, and ecology risks are at a low levelBeijing, Hebei, Liaoning, Jilin, Chongqing
Production and ecology risks are at a medium level, and living risk is at a low levelHeilongjiang
Living and ecology risks are at a medium level, and production risk is at a low levelShanghai
CEcology risk is at a medium level, and production and living risks are at a low level.Inner Mongolia, Gansu, Sichuan, Xinjiang
Production, living and ecology risk are all at a low levelQinghai, Tibet
Table 3. Strategy to cope with PLE risk under climate change scenario.
CategoriesDistributed RangeExisting ProblemsStrategy
A
Jiangsu, Fujian, and Guangdong in southeast coastal areas
Henan, Shandong, and Jiangxi in Yellow River and Yangtze River agricultural production areas
Guangxi in agricultural production areas of South China
Optimized and key development zones characterized by developed economies, dense populations, and high development intensities.
Production, living, and ecology risks are all at a high level
Production, living, and ecological risks
  • Establishing disaster risk monitoring and early warning systems in the southeastern coastal areas and agricultural production areas
  • Strengthening the protection for marine ecosystems
  • Developing urban ecological protection areas
  • Avoiding the extreme event-prone regions’ densely populated areas for living space planning
B
Heilongjiang, Jilin, and Liaoning in Northeast Plain
Beijing, Tianjin, and Hebei in Huang-Huai-Hai Plain
Ningxia, Shaanxi, and Shanxi in Yellow River basin
Zhejiang, Hubei, Guizhou, and Yunnan in Yangtze River basin
Agricultural production areas intensely distributed in this region
Production risk is at high and medium levels in 15 provinces (Zhejiang, Hubei, etc.)
Living risk is at high and medium levels in 13 provinces (Tianjin, etc.)
Production and living risks
  • Strengthening agricultural infrastructure construction in agricultural production areas
  • Accelerating the development of competitive agriculture and integration of farming and animal husbandry
  • Adjusting the cropping system and agricultural configuration
  • Strengthening the protection of black earth in northeast plain
  • Developing tourism resources of ice and snow industry
  • Promoting migration projects in rural disaster-prone areas
  • Optimizing drainage system in urban area
C
Inner Mongolia, Xinjiang, Ningxia, and Gansu of northwest China
Qinghai and Tibet on Tibet Plateau
National key ecological areas intensely distributed in this region
Ecological risk at medium level in all provinces except Qinghai and Tibet.
Ecology risk
  • Strengthening ecological restoration and protection for vulnerable areas along Yangtze and Yellow River basin
  • Reducing the disturbance of human activities on the ecological environment
Publisher’s Note: MDPI stays neutral with regard to jurisdictional claims in published maps and institutional affiliations.

