
Uncovering Network Heterogeneity of China’s Three Major Urban Agglomerations from Hybrid Space Perspective-Based on TikTok Check-In Records

1
School of Urban Design, Wuhan University, Wuhan 430072, China
2
China Southwest Architectural Design and Research Institute Corp. Ltd., Chengdu 610041, China
3
School of Architecture and Design, Beijing Jiaotong University, Beijing 100044, China
*
Author to whom correspondence should be addressed.
Land 2023, 12(1), 134; https://doi.org/10.3390/land12010134
Submission received: 21 November 2022
/
Revised: 21 December 2022
/
Accepted: 27 December 2022
/
Published: 31 December 2022
(This article belongs to the Special Issue Feature Papers for Land Innovations – Data and Machine Learning)
Abstract
:Urban agglomeration is an essential spatial support for the urbanization strategies of emerging economies, including China, especially in the era of mediatization. From a hybrid space perspective, this paper invites TikTok cross-city check-in records to empirically investigate the vertical and flattened distribution characteristics of check-in networks of China’s three major urban agglomerations by the hierarchical property, community scale, and node centrality. The result shows that (1) average check-in flow in the Yangtze River Delta, Beijing-Tianjin-Hebei, and Pearl River Delta network decreases in descending order, forming a Z-shaped, single-point radial, and N-shaped structure, respectively. (2) All three urban agglomerations exhibit a nexus community structure with the regional high-flow cities as the core and the surrounding cities as the coordinator. (3) Geographically proximate or recreation-resource cities have a high degree of hybrid spatial accessibility, highlighting their nexus role. Finally, the article further discusses the flattened evolutionary structure of the check-in network and proposes policy recommendations for optimizing check-in networks at both the digital and geospatial levels. The study gains from the lack of network relationship perspective in the study of location-based social media and provides a novel research method and theoretical support for urban agglomeration integration in the context of urban mediatization.
1. Introduction
In the context of rapid globalization, urban agglomerations, as an advanced form of regional urbanization, formulate multiple cities into a mega-city system with continuous spatial patterns and close functional connections. Promoting the development of urban agglomeration has been considered an essential part of urbanization strategies in China and even in emerging economies worldwide. Meanwhile, with the innovation of communication and information technology, the dominant urban network is no longer “local space” but “flow space” [1]. The interaction between local space and flow space gradually transforms the traditional hierarchical structure into a networked one [2], which further brings about changes in spatial form, structure, and function of cities and regions [3], and the resulting network organization eventually becomes an essential structural element of the economic and social system. With the signing of the United States-Mexico-Canada Agreement and the official implementation of the Horizon 2020 plan, economic and scientific cooperation between different countries and cities has been promoted, further strengthening urban network development [4,5]. Similarly, China has also implemented regional integration and spatial network development policies in major urban agglomerations such as the Yangtze River Delta Integration and the Pearl River Delta Integration [6,7]. These phenomena reflect the importance of strengthening urban networks for spatial optimization and the high-quality development of urban agglomerations. Therefore, identifying the flow network characteristics of urban agglomerations is vital for optimizing the regional spatial structure and promoting regional collaborative development.
Castell [8], Hall [9], and Taylor [10] have laid the theoretical foundations for the study of urban agglomeration networks. Related research has focused on transport, economic, innovation, and tourism networks. Road [11,12], rail [13,14,15], and airflow [16,17] data were used to characterize transport networks. Corporate headquarters branch [18,19], listed companies’ off-site investment data [4], and energy consumption [20] data were used to characterize economic networks. Academic papers [21,22], invention patents [23], logistics, and transportation [24] were used to represent the innovation network structure. Questionnaires [25], online travelogue texts [26], online travel booking data [27,28], and taxi tracks [29] were used to characterize the tourism flow network. Multiple factor flows are used to synthetically describe the structure of urban networks within urban agglomerations and provinces [30,31,32,33]. These studies explore the overall topological features and spatial structure characteristics of urban networks and identify the characteristics of urban networks, such as scale-free, small-world, hierarchical hierarchy, and spatial agglomeration [34,35]. Chinese research mainly focuses on the major urban agglomerations, such as the Yangtze River Delta, the Pearl River Delta, and the Beijing-Tianjin-Hebei region. It is found that the structural characteristics of different types of flow networks exhibit different spatial patterns. Still, the three major urban agglomerations’ structures show a shift from a hierarchical system to a flat network and present a multi-core network shape [36,37]. Some scholars have also suggested after comparative analysis that the Yangtze River Delta cities have the most robust horizontal connections and the strongest integration, the Pearl River Delta is the second, and Beijing-Tianjin-Hebei is the weakest [38]. In conclusion, the above studies have explored the urban network structure characteristics of urban agglomerations from a multidimensional perspective. As SMPs are increasingly integrated into residents’ daily lives and influence their travel patterns, it is necessary to dissect the mobility patterns of media users in urban agglomerations and thus examine the impact of social media platforms on regional integration.
The theory of hybrid space offers a new perspective on the urban agglomeration network. With the increasing popularity of information and communication technologies, location-based social media platforms (SMPs) have become one of the most common virtual spaces in everyday life, linked to physical space through various geo-tagged and real-time logging data, delimiting neospatiality with its logic and structure [39]. Souza introduces the concept of hybrid space at the beginning of the 21st century and pointed out three main characteristics of hybrid space as mobile and social space, namely the blurring of the physical-digital spatial boundary, the physical carrying-in of the static-mobile interface, and the reconfiguration of urban space [40]. Similarly, Soja proposes a triadic dialectic of ‘history-society-space’ and constructs the third space theory [41]. He points out that the third space is a hybrid space that transcends physical space (the first space) and imaginary space (the second space) and is composed of sensory experiences, intuitive experiences, and abstract symbols. He asserts that the third space is characterized by complete openness, reconstruction, and the transcendence of relations of production and space [42]. The theory of hybrid space and third space lays the foundation for the spatial epistemology of media and communication geography. Along with the multi-functional development of short video applications, they can satisfy not only the essential functions of browsing, entertainment, and recording daily life, but also multiple functions such as socializing with fans, professional learning, and live shopping. As a result, short video applications such as Tik Tok, Auto Quicker, and Xiaohongshu are rapidly overtaking Weibo, WeChat, and traditional news media in terms of downloads and views. The third space it represents breaks the long-standing binary separation between immaterial media texts and material geographical landscapes, integrating into the space of everyday life and completing the reproduction of spatial relations.
Hybrid spaces influence the spatial dynamics of cities and the correlation between multiple geospatial units by shaping “communication networks”. Social annotative, or “check-in” behavior, is a typical spatial, social practice shaped by such correlation. Check-in users obtain urban spatial information in digital space and then take videos in geospatial space and upload them to digital space, thus forming a set of check-in behaviors. In this process, check-in users, on the one hand, descend from digital space to geographic space, driving the infiltration and interaction between digital space and geographic space; on the other hand, they move from one space to another, strengthening the geographic interaction between different urban spaces, and even between different cities. Previous studies have used the number of geo-tagged images, records, comments, and check-ins to capture people’s activities in physical space. Paldino et al. analyzed the number of geo-tagged Flickr images [43], and Sulis et al. used spatial information recorded by Twitter to characterize the spatial distribution of Londoners’ activities [44]. Several studies in China have also used geolocation tags [45,46] on social networking sites, the inter-city Baidu index [47,48], Baidu Post Bar [49,50], and Douban [51] to characterize the urban network patterns [52] constructed by information flow. Studies on check-in behavior generally regard it as a representation of spatial vitality, focusing on identifying the spatial characteristics of user activity [53,54] and followership [55], but neglecting the impact of SMPs on geospatial interactions. SMPs change the popularity of geographic space but also the mobility of people between different geographic spatial units, shaping the spatial interaction pattern between cities. With location-based social media embedded in daily life, social platforms such as TikTok and Instagram have gradually replaced television advertisements as a channel for people to obtain spatial information about cities. Social-targeted behaviors such as visiting and check-in have become increasingly popular, intensifying the shaping of inter-city connectedness. Therefore, we consider the hybrid space a valuable addition to describing the urban network. It is necessary to analyze how check-in behavior shapes the interactions between cities to respond to the increasing mediatization of cities.
Given this, the current paper adopts a hybrid space perspective to construct urban association networks in three major urban agglomerations using cross-city check-in data from Tik Tok and uses social network analysis to analyze the hierarchical attributes, community scale, and node centrality of cross-city check-in networks, based on which, it attempts to summarize the spatial organizational patterns of check-in networks.
The significance of this paper is mainly reflected in the following aspects. This paper constructs a framework for analyzing urban networks based on a hybrid spatial perspective and conducts a comparative study with three major urban agglomerations as a case study, which provides a new view and method for the analysis of urban networks and urban agglomeration integrations, and provides theoretical support for promoting the synergistic regional development of urban agglomerations. In addition, this paper introduces Jitterbug cross-city punch card data to characterize inter-city association patterns. It verifies the method validity, which gains from the lack of spatial interaction in geographic annotation behavior research, and provides new data and methods for media geography research.
The remainder of the paper is structured as follows: Section 2 introduces the study area of this paper, the data sources, and the methods used in this paper. Section 3 shows the results of these methods. In Section 4, we have a further discussion of these research results. Section 5 is the conclusion of the paper.
2. Data and Methods
2.1. Study Area
The area of this paper is the three major urban agglomerations in China, i.e., the Yangtze River Delta (YRD), the Pearl River Delta (PRD), and the Beijing-Tianjin-Hebei (BTH) (Figure 1). Among the 19 urban agglomerations in China, the YRD, PRD, and BTH are the three most economically active urban agglomerations, with high shares of tertiary industries, penetration rates of geographic media facilities, and increased numbers of media users. According to the “Statistics Yearbook of 2021 China’s Top nineteen Urban Agglomerations (Giant Engine Urban Institute)”, the YRD, PRD, and BTH urban agglomerations rank among the top three in terms of TikTok online prosperity. This shows that the three major urban agglomerations are more mature in terms of hardware and software for location-based social media, which is a typical model for examining the movement of people between cities in a hybrid space.
2.2. Data Sources
This paper chooses the TikTok short video platform (www.douyin.com accessed on 1 August 2022) as the location-based social media check-in data source. TikTok is currently one of China’s most popular platforms for producing and disseminating short videos. As of June 2022, the number of active users of TikTok was 697.93 million, which ranked first in the sector. With the increase in mobile phone penetration, short videos have become one of the critical digital scenarios for users to access information, and the public has accepted TikTok. To strengthen offline-online interaction and promote the physical tourism industry, the TikTok platform has launched a series of online and offline check-in activities over the past few years, attracting a large number of users to spontaneously share and spread the word, leading to the creation of urban online scenes and boosting the “check-in economy” with recreational activities as the primary purpose. Based on this, this paper writes a crawler by Python and obtained 263,791 check-in records within the three major urban agglomerations from 1 August to 7 August 2022 (Table 1). We pay particular attention to only the check-in locations and origin city attached to check-in users rather than the videos themselves.
The process of check-in behavior is usually as follows: after being attracted to a scenario on an Internet platform, media users tend to travel to the physical space recorded in the digital space. Then the users usually record the interaction between humans and the physical space along with the geographic location in a short video and upload the SMPs again, thus completing the “check-in” of a geospatial space (Figure 2). Therefore, the check-in behavior is an offline representation of virtual space, which connects the virtual and physical spaces and enhances the geographical interaction between different cities. During this process, users wander through virtual and physical spaces and create more and more artworks online, eventually improving the vitality of urban spaces and influencing the correlation between multiple geospatial units.
2.3. Methods
The technical route of this study is shown in Figure 2 below. According to Figure 3, our work was divided into three parts: data collection, check-in network modeling, and network characteristics evaluation.
2.3.1. Modeling the check-in network
Drawing on the current research on travel flows based on travelogue data, we propose the following methods to model a check-in network:
- (1)
- Address resolution. Based on the check-in data, we locate the city from where the check-in users originate and the city to which the check-in location belongs ). City names are geocoded through the AMap Web API (https://restapi.amap.com/v3/geocode/geo?parameters, access date: 21 September 2022) to get latitude and longitude coordinates.
- (2)
- Data filtering. The data from the same city as and are eliminated, and the 23,301 records from different cities are retained as cross-city check-in data.
- (3)
- Network modeling. We aggregate cross-city check-in data according to city units and transform it into an OD matrix. Point O is the city from which the check-in users originated (), point D is the city to which the check-in location belongs ().
Finally, the matrix was fed into the Gephi software to generate a graphical network of check-in flows. The network type is a directed, weighted network. The network nodes are the municipalities within the study area. The network edge weights are the check-in flows delivered from one city to another, characterized by the sum of the above check-in frequencies.
2.3.2. Evaluating the Characteristics of the Check-In Network
This paper mainly adopts the social network analysis (SNA) method to evaluate the check-in network characteristics. SNA method is a quantitative analysis method developed on the mathematical method and graph theory, which conceptualizes each subject in the social relationship into independent points, converts various relationships between subjects into lines, and analyzes the laws and characteristics of social structure through different quantitative data of nodes and networks [56]. This method has been widely used in the urban network, urban cluster structure, and population mobility. The check-in network studied in this paper is a mobile network of cross-city check-in holders, which belongs to one of the types of population mobility networks, and what it characterizes is the spatial interaction between cities in a diverse spatial perspective and explores the structure of urban clusters, which applies to the network research paradigm.
Integrating a hybrid space perspective with existing spatial network research, this paper selects indicators related to the social network analysis method to examine the check-in networks of the three major urban agglomerations in terms of hierarchical property, community range, and node centrality, respectively.
The traditional vertical town system has been impacted in the information age and evolved into a flat structure. In a hybrid spatial perspective, the network of punching streams is influenced by both digital and geographical space; the check-in behavior is more likely to be embedded in the short-distance recreation function, which is more susceptible to the geographical distance factor. Therefore, it needs to be further examined whether the urban spatial network constructed by the check-in flow is a vertical-distributed structure or has shifted to a flattened one. This paper examines the vertical and flattened distribution of the check-in network by analyzing hierarchical and community characteristics, respectively. In addition, based on the overall network characteristics portrayed above, this study conducts individual network characteristics through node characteristics analysis.
- Hierarchical property
The weighted degree is a fundamental indicator of complex networks. The weighted degree in a check-in network indicates the total number of check-in flows generated in the city. The weighted degree distribution refers to the probability of the weighted degree of the network nodes. In this paper, we analyze the hierarchical properties among the nodes by examining the scale-free property of the weighted degree distribution. The scale-free property means that most nodes in a complex network have minimal weighting, but conversely, a few nodes have a tremendous amount of weighting. Existing research on urban networks has found that innovation, trade, enterprise, and tourism flow networks are scale-free. Still, it remains to be examined whether check-in networks have this property. In this paper, we use a power function in the logarithmic form to fit the scale-free property of check-in networks. The algorithm is as follows:
where denotes the weighted degree of node h; denotes the ranking of the weighted degree values of node h; is a constant; and denotes the slope of the weighted degree distribution curve. The larger the value of , the more pronounced the network hierarchy is.
Further, the natural discontinuity method is used to classify the node weighting degree and edge weights. A spatial network map is drawn based on ArcGIS to analyze inter-city check-in flows’ spatial vertical distribution characteristics.
In addition, we used the average weighted degree, the average degree, and the number of nodes to examine the size of the network. The average weighted degree is the average sum of the weighted degrees of the entire network and characterizes the average amount of punching traffic formed by each node. The average degree is the average of the whole network of degrees, representing the average number of cities connected per city.
- 2.
- Community scale
A community is a structural unit within a network, with relatively dense connections between nodes within a community and sparse connections between communities, creating a parallel rather than vertical structure. Analyzing the community structure of the check-in network identifies the well-connected urban assemblages in a diverse spatial perspective. It reveals the degree of flattening of the check-in network structure. The modularity algorithm is commonly used to classify communities, which is an efficient and accurate method for medium-sized networks but fails to consider weighted information. This paper uses a weighted modularity algorithm for community segmentation of check-in networks. Q-value is a metric to evaluate the results of community segmentation. A higher Q-value means the more significant the module segmentation feature. This means the more obvious division between communities and the more flattening of the check-in network. A value greater than 0.3 is generally considered to be a significant degree of network modularity. The algorithm is as follows.
where is the module degree value, is the edge weight between city and ; and are the degree values of city and in the unweighted network; and are the communities into which city and are divided; is the sum of all weights in the network.
In addition, this paper examines the small-world phenomenon of the check-in network through the average clustering coefficient and the average path length. The network structure of sparse random long connections accompanied by rich partial connections revealed by the small-world phenomenon is essentially an interpretation of community structure. Established research has commonly examined whether the small-world properties of real networks are significant by comparing them with stochastic models. Specifically, a network is said to have a small-world phenomenon if its average clustering coefficient is much larger than a random network. In contrast, its average path length is comparable.
- 3.
- Node centrality
This paper applies weighted degrees to examine the intensity of check-in flows. It assesses whether cities prefer to export or receive check-in flows in a cross-city network by comparing the weighted indegree with the weighted-out degree. The activities carried out by the cross-city check-in flows regulate income distribution by tourism consumption. The difference is that, in a hybrid space perspective, the outward flow of check-in from the city reflects the flow of economic factors. It can also be interpreted as a flow of media resources. As a participant in mobile social media, the act of check-in across cities can be interpreted as carrying media resources into another city and sharing media resources through the act of check-in. Thus, the weighted out-degree is a measure of a city’s capability to export check-in users or media resources, while the weighted in-degree is the one to attract check-in users or provide check-in users places to the outside world.
Based on existing research, Node Symmetry is applied to reflect the inflow and outflow of individual nodes.
denotes the weighted in-degree of node and denotes the weighted out-degree of node . If is greater than 0, it means that the city is an input-flow city; if is equal to 0, it means that the city is a balanced-flow city; if is less than 0, it means that the city is an output-flow city.
Compared to the city delivering the check-in flow, the city receiving the check-in flow is where the check-in behavior occurs. In the node evaluation of the urban network, the weighted in-degree can be used to assess the visibility of a city in digital space as it more intuitively characterizes the frequency of completion of check-in behavior. However, the weighted in degree only takes into account the total volume aggregated by a city, but not the number of cities towards that city, thus losing the overall network perspective in terms of examining the importance of city nodes. This feature has been confirmed in numerous network studies and is also reflected in check-in networks. In detail, a node may gather a large amount of check-in flow that originates from one city while not connected to other cities. It is structurally at the edge of the network. Such nodes do not significantly shape the network’s structure, and their importance is relatively limited.
The PageRank algorithm avoids the isolated perspective of the weighted in degree described above and examines the node’s importance in link quantity and quality. It is, therefore, widely used for identifying core nodes in directed networks such as virtual communities, academic collaboration networks, and social networks. The PageRank algorithm, proposed by Google, is an algorithm for ranking the importance of web pages. The core idea is that the extent of a page on the World Wide Web depends on the number and volume of the other pages pointing to it and that pages pointed to by multiple high-importance pages will also have high priority. The algorithm measures the extent of a node by its PageRank value (PR). The formula is as follows:
where and denote nodes, and denote their values, denotes the set of nodes pointing to node , and denotes the number of nodes pointed to by node . PageRank defines a random wander model, a first-order Markov chain, on a directed graph that describes the behavior of random wanderers visiting individual nodes at random along the directed graph. Through iteration, a stable PR is eventually computed for all nodes in the network. Based on this, the PageRank algorithm can be understood as modeling the probability of a user’s attention reaching each web page on the Internet.
This algorithmic mechanism for modeling the flow of attention has theoretical applicability to the analysis of check-in networks. In a hybrid space perspective, digital space overlaps with geographical space. The media user’s attention first flows in the digital space, then descends to the geographic space through the check-in behavior to transform into a check-in flow. As the check-in behavior is completed, it is uploaded to the digital space again to enhance the attention of the check-in place. Accordingly, the PageRank algorithm can be applied to the check-in network to simulate the probability of a media user arriving in each city in an urban agglomeration and completing a check-in behavior. The higher the PR of a city, the greater the mixed spatial accessibility.
3. Results
3.1. Hierarchical Attributes
The hierarchical characteristics of the three city clusters are prominent. In terms of statistical indicators, the highest average weighted degree of the check-in network of the three urban agglomerations is in the YRD, with BTH and the PRD in decreasing order, while the most apparent vertical hierarchical feature of the network is in BTH, with the PRD and YRD in decreasing order. Spatially, the check-in network of YRD shows a Z-shaped skeleton with Suzhou, Shanghai, and Hangzhou as the core. The PRD check-in network shows an N-shaped structure with Guangzhou and Shenzhen as the core. The BTH check-in network shows a Beijing single-point radiation-type core skeleton. The specific results are as follows.
First, the highest average weighted degree of the check-in network of the three urban agglomerations is the YRD, with BTH and the PRD in decreasing order (Table 2). Each YRD city is connected to an average of 10.077 cities in the check-in network, and the average check-in flow of each city is 433, which is much higher than that of BTH (293.357) and PRD (264.556). The weighted degree distributions of the three networks all conform to the power-law distribution (R2 > 0.8), indicating that they are scale-free networks. It also illustrates the fact that a small number of cities create large-scale check-in flow, while the majority of cities create only a minimal amount. In addition, the distribution fit coefficients of check-in networks of YRD, PRD, and BTH are 0.91903, 0.96918, and 1.02552, respectively, indicating that the vertical hierarchy of the network is most clearly characterized by BTH, with the PRD and YRD diminishing in that order (Figure 4).
Further, we divide the nodes and edges into five levels according to the weighted degree and edge weight by the natural breakpoint method and draw the networks’ topological map and spatial distribution map based on Gephi and ArcGIS, respectively (Figure 5).
In the YRD check-in network, the first level nodes include Shanghai (3112), Suzhou (2859), and Hangzhou (2121), and the first level edges include Shanghai-Hangzhou (403) and Shanghai-Suzhou (388), which forms the open triangle pattern. At the second level, Hangzhou connects to Huzhou, Shaoxing, and Jiaxing, strengthening the internal check-in connection of Zhejiang Province cities. The third level emerges with cities south of the Yangtze River in Jiangsu Province, such as Nanjing (1535), Yancheng (973), Changzhou (840), and Nantong (735), as well as Zhejiang Province cities, such as Ningbo (911) and Jinhua (771), generating check-in flow among cities within each province. The fourth level mainly includes check-in connections among existing nodes. At the same time, Anhui Province cities such as Hefei and Wuhu also emerge and form less intense check-in connections with Suzhou Province cities such as Nanjing, Chuzhou, and Suzhou. Chizhou and Tongling appear in the fifth level, complementing all YRD cities.
In the PRD check-in network, Guangzhou-Foshan forms the first level with an edge weight of 799. At the second level, Shenzhen, as the core, connects to Dongguan and Huizhou with edge weights of 545 and 481, respectively. At the third level, Guangzhou forms the two-way links with Shenzhen-Dongguan and Foshan. Huizhou also establishes connections with Guangzhou and Dongguan, strengthening the relationship between the central and eastern cities. At the fourth and fifth levels, Zhuhai, Jiangmen, and Zhongshan emerge, yielding a relatively lower check-in connection.
In the BTH check-in network, Beijing, as the core, connects to Langfang and Baoding with edge weights of 417 and 282, respectively, forming the first and second levels. At the third level, Beijing complements the two-way links with Langfang and Baoding on the one hand. It connects to Shijiazhuang, Tianjin, Chengde, Handan, and Zhangjiakou on the other hand. At the fourth level, Beijing complements the two-way connection with Qinhuangdao, Cangzhou, and Xingtai. At the fourth and fifth levels, relationships are formed mainly among nodes outside Beijing.
In general, the check-in network of YRD is spatially centered on Suzhou-Shanghai-Hangzhou, forming a Z-shaped spatial structure. The PRD network forms the N-shaped spatial structure, with Guangzhou and Shenzhen as the dual cores. The BTH check-in network forms a single-point radial spatial structure with Beijing as the core.
3.2. Communities Scale
The three check-in networks show obvious small-world characteristics, but the flattening characteristics are immature, and the community division needs to be further clarified. The community division of the three major urban agglomerations shows a spatial structure with the regional high check-in flow cities as the core and the neighboring cities as the coordinator. The specific results are as follows.
First, a small-world network has a similar average shortest path and a more significant clustering coefficient when compared with a random network of the same size [57]. The check-in networks of three urban agglomerations show small-world characteristics (Table 3). Specifically, the average clustering coefficients of the YRD, BTH, and PRD networks are 0.658, 0.626, and 0.597, respectively, which are larger than the average clustering coefficients of the random networks. The average path lengths of the YRD, BTH, and PRD networks are 1.6, 1.556, and 1.361, which are smaller than those of the random networks. It means that the networks are characterized by high aggregation and high topological accessibility, which further confirms the small-world characteristics of the three check-in networks. Among the three agglomerations, the average clustering coefficient of the check-in network of YRD is the largest, indicating it has the most significant small-world characteristics and the highest degree of flatness.
Second, we used the weighted modularity community detection algorithm for the three check-in networks. The urban communities in each network were obtained, as shown in Figure 6, and the community attributes were shown in Table 4. The modularity of the three networks is below 0.3, indicating that the communities are not clearly divided, which further reflects that none have significant flat distribution characteristics.
The modularity of the YRD network is the highest (0.278). It emerges three major communities based on provincial boundaries. Specifically, there are 11 cities in community 1, with nearly 40% of the YRD check-in network. In this community, Shanghai is the core and connects cities in Jiangsu Province. In addition, Chuzhou in Anhui Province is also integrated into this community by emerging a close connection with Nanjing. In community 2, there are 8 cities and 23.77% check-in flow. Hangzhou is the center, connecting cities in Zhejiang Province. Community 3 has a shallow check-in flow (4.62%). As the center of the community, Hefei connects cities in Anhui Province.
The PRD check-in network has a low modularity (0.195) and forms two communities on the east and west sides of the Pearl River Estuary. Community 1 emerges the triangle structure of Shenzhen-Dongguan-Huizhou with 26.87% of the PRD check-in network. Other cities from the PRD form community 2 with 39.95% check-in flow. In this community, Guangzhou-Foshan-Zhaoqing is the core triangle, connecting Zhuhai, Zhongshan, and Jiangmen.
The BTH check-in network has the lowest modularity (0.058), forming two significantly unbalanced communities. Beijing, as the core, coordinates and organizes the surrounding cities, creating community 1 with high check-in flow (83.01%). Anyang, Xingtai, and Handan are not included in community 1 because they are at the periphery of the urban agglomeration but form community 2 with a low check-in flow (3.03%).
3.3. Node Centrality
Through the node centrality analysis, we found that megacities such as Beijing, Shanghai, Guangzhou, and Shenzhen perform as an outward export type, sending many media resources outward and promoting the integration of urban agglomerations. Cities with geographical proximity to the core nodes or specific recreational resources, such as Dongguan, Foshan, and Chengde, have a stronger weighted indegree and present inward aggregation type. These cities have hybrid spatial accessibility. The specific results are as follows.
- 4.
- Node weighted degree and NSI
This paper assesses a city’s ability to generate check-in flow by node weighted degree and evaluates whether a city is an inward aggregator or outward exporter by nodal symmetry (NSI) (Table 5). Shanghai and Hangzhou are the two centers of check-in flow generated in YRD with a weighted degree of 2208 and 1588, respectively. The difference is that Shanghai shows apparent spillover, with the weighted out-degree (2208) being much higher than the weighted in-degree (904), with an NSI of −0.419, while Hangzhou is relatively balanced (−0.111). The check-in flow of Suzhou, Nanjing, and Wuxi are above 1000, with Nanjing showing some spillover (−0.165) and the other two cities showing a not-so-subtle aggregation phenomenon (0.05). Yancheng, Hefei, Ningbo, and Jiaxing all have a weighted degree above the average value (870). In contrast, the weighted degree of other cities is relatively low, most of which show strong aggregation characteristics, especially Zhoushan (0.785), Huzhou (0.575), Nantong (0.376), and Zhenjiang (0.359). These cities have created many internet-famous spots with their high-quality tourism resources and become important nodes for gathering check-in flow.
In PRD, Guangzhou (3246) and Shenzhen (2426) have the highest weighted degree and both show strong spillover characteristics (−0.234, −0.359), indicating that a large number of check-in flows are delivered to other cities in PRD from these two cities. Due to the geographical proximity to Guangzhou and Shenzhen, Foshan and Dongguan have a high check-in flow, which is 2008 and 1880, respectively, and show strong aggregation characteristics (0.249, 0.127). The weighted degrees of other cities are below the average value (1429), among which Huizhou, Zhongshan, and Zhuhai show strong aggregation characteristics, especially Huizhou with weighted indegree and NSI as high as 974 and 0.517, respectively. These cities are the strongest aggregation in PRD, reflecting tourist cities’ ability to gather social media resources from outside.
The only core node in BTH is Beijing, with a weighted degree of 2332. It far exceeds those of Langfang (1003), Baoding (973), and Shijiazhuang (676). In addition, Beijing also shows significant spillover characteristics (−0.431), while the check-in flow of Langfang and Baoding is relatively balanced, with no obvious spillover or aggregation characteristics. The other cities are all weighted below the average value (588). It is worth noting that the other cities, although all weighted below the mean (588), generally show a strong aggregation. In particular, Zhangjiakou (0.762), Chengde (0.636), and Qinhuangdao (0.865), although not sending strong outward check-in flows (<450), attract a large number of media users originating from Beijing through their positioning as suburban Beijing tourist cities.
- 5.
- PageRank
PageRank (PR) is applied to simulate the probability of media users arriving and completing the check-in behavior in each city and further examine the hybrid space accessibility of each city. In YRD, the PR of Hangzhou is the highest (0.109), indicating that media users in YRD have the highest probability of arriving in Hangzhou for check-in activities. Suzhou, Nanjing, Ningbo, Wuxi, Zhoushan, Changzhou, Shaoxing, and Huzhou follow with Hangzhou, with PR above the average (0.047), among which Zhoushan, Changzhou, Shaoxing, and Huzhou are all weighted below the average. It indicates that although these cities do not generate a very high check-in flow, they are the media resource input for many cities with a large amount of check-in flow.
In the PRD, Guangzhou has an absolute advantage in PR (0.214), gathering a wide range of check-in flow from various cities. Foshan (0.159) and Dongguan (0.140) have a high PR by gathering check-in flow from Guangzhou and Shenzhen, reflecting the co-location effect of Guangzhou-Foshan and Shenzhen-Dongguan. On the contrary, although Shenzhen’s weighted degree is significant, it only has a small amount of check-in flow from big weighted degree cities due to its outward-oriented export characteristics. It leads to Shenzhen’s lower PR (0.137) than Foshan and Dongguan’s.
With the highest PR of 0.224, Beijing is the primary node for gathering check-in flow from other cities in the BTH region. Although Chengde and Qinhuangdao have a lower weighted degree, they attract check-in flow from several high check-in flow nodes through their high-quality tourism resources. Their PRs are second only to that of Beijing, with 0.156 and 0.081, respectively. In contrast, although Langfang and Baoding both have higher weighted degrees, they are less connected to other nodes as most of the check-in flow originates from Beijing only. They are at the edge of the network structure and therefore do not lead in PR. The other cities have lower PR than the average (0.071) and thus lower accessibility in the hybrid space due to the long geographical distance from Beijing and the lack of recreational resources to attract mobile media.
4. Discussion
4.1. Key Findings and Significance of This Study
As mobile Internet devices represented by cell phones are increasingly integrated into people’s daily lives, social media platforms, such as TikTok and Facebook, have become virtual places to experience, shape, and communicate city imagery. It leads to an increase in the popularity of geo-tagging and the dissolution of the boundaries between urban geospatial and digital spaces, resulting in hybrid spaces. Existing studies have focused on the impact of SMPs on urban spatial dynamics while neglecting the ability to influence cross-city connections at a more macroscopic scale. On the other hand, the integration of urban agglomerations is the current theme of regional research. In the face of the increasing trend of urban mediatization, it is necessary to examine the impact of geo-tagged behavior on regional integration. We invite the TikTok data to conduct the check-in networks of YRD, PRD, and BTH. The structural features of the check-in networks are examined in terms of hierarchical attributes, community scale, and node centrality. The study yields some interesting findings:
The first important finding of this paper is that YRD, PRD, and BTH respectively exhibit Z-shaped, N-shaped, and single-point radial spatial distribution as well as the vertical hierarchical characteristics of check-in networks. This spatial distribution is similar to the urban network structure of the three major urban agglomerations in terms of service [36] and finance [37]. In terms of urban system structure, the YRD has the most robust flattening characteristics, followed by the PRD and BTH. This is consistent with the results of comparative studies on integrating the three major urban agglomerations [51,58]. The innovative finding of this paper is that the flatness is weaker, and the vertical distribution feature is stronger in the check-in network compared to the demographic migration network, such as the tourism network [38]. This may be because check-in behavior is more in line with the characteristics of short-distance leisure behavior, and the distance friction effect of the check-in network is more significant. The behavior of check-in users is motivated by recording geospatial experiences to build virtual personality and media image. In this quality, the urban spatial experience is as important as arriving at the destination and recording electronically. Therefore, geographic distance becomes an essential influencing factor. This is a powerful response to the question of the death of geography. The second important finding of this paper is that the megacities such as Beijing, Shanghai, Guangzhou, and Shenzhen perform as an outward export type, sending many media resources outward and promoting the integration of urban agglomerations. Cities with geographical proximity to the core nodes, such as Dongguan, Foshan, and Chengde, have a stronger weighted indegree and present inward aggregation type. This is somewhat inconsistent with the role exhibited by mega-cities in existing tourism networks [38,59]. According to the established theories, the hub role and agglomeration effect of core cities in the network are the fundamental driving force for their growth into mega-cities, which attract more flows than those sent outward [60,61]. While the innovative finding of this paper is that cities with high check-in flow tend to send outward check-in flow more than gathering check-in flow. Guangzhou, Shenzhen, Shanghai, and Beijing all demonstrate the diffusion effect. This is a manifestation of shared media resources. When high-ranking cities send check-in flow to low-ranking cities, they also send media resources. With the geo-tagging behavior of check-in in high-ranking cities, low-ranking cities will further expand their visibility in digital space. It is helpful to promote the balanced development of cities in urban agglomerations.
In addition, this paper also found that cities with high-quality tourism resources can break the geographical proximity effect to a certain extent and be fed into the check-in flow by multiple cities, thus becoming essential nodes in the check-in network. This feature can be seen when comparing the node characteristics of Chengde and Langfang in the BTH check-in network. Langfang gathers a large number of check-in flow from Beijing through its proximity to Beijing but is not strongly connected to other cities except Beijing. In contrast, although Chengde is relatively far from other cities, it plays a pivotal role in the network structure by attracting check-in flow from many cities through its high-quality tourism resources. It is essential to notice that Zhuhai, a famous tourist city in PRD, is recognized as a core node in established tourism flow network studies but is at the edge of the network in this study. This is partly due to its distance from Guangzhou and Shenzhen. On the other hand, it is because of the significant decline in tourism activities in Macau due to the COVID-19 epidemic, and as the spatial hinterland of Macau tourism, Zhuhai’s tourism industry is also more significantly affected, especially the number of cross-city types of tourism activities is sharply reduced.
4.2. Spatial Organizational Pattern of Three Major Urban Agglomerations
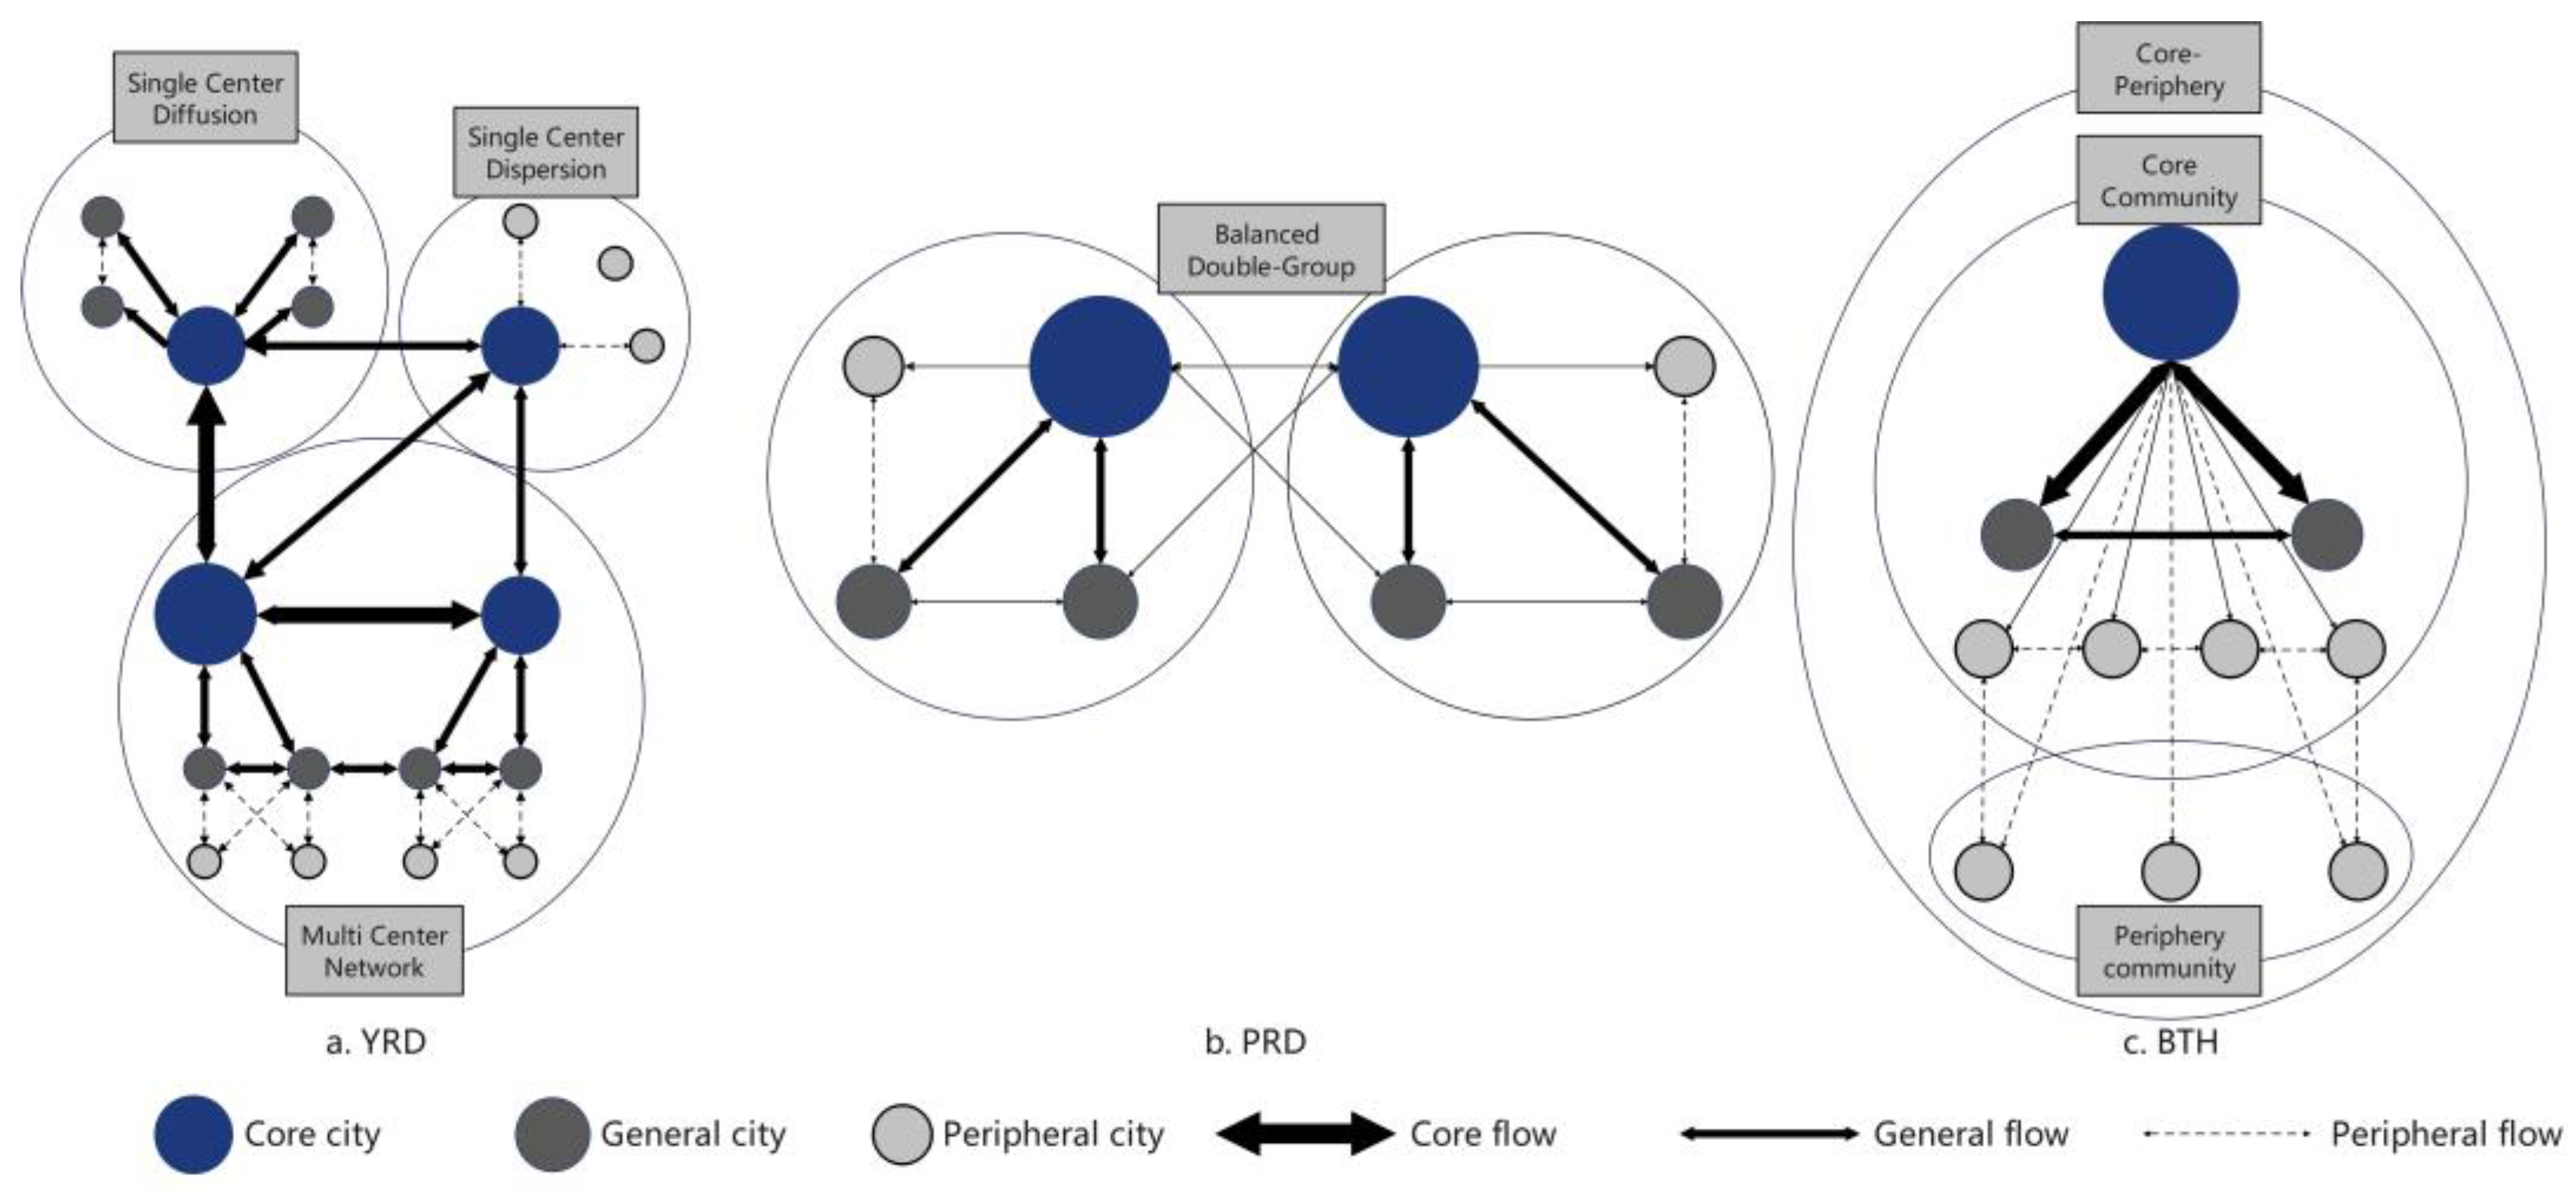
The spatial organization patterns of the check-in networks of three urban agglomerations are plotted (Figure 7) to analyze whether the spatial structures of the urban agglomerations maintain a vertical distribution structure or have shifted to a flattened distribution from a hybrid space perspective. In general, the check-in networks of the three urban agglomerations still maintain a vertical structure with a strong hierarchy but also show a tendency to evolve into a flattened structure. The YRD urban agglomeration has the strongest characteristics of a flat structure, the BTH urban agglomeration has the most significant vertical structure, and the PRD is in the middle of the two.
The YRD presents a composite spatial organization model with multi-level cores. As the first spillover core of YRD, Shanghai spreads the check-in flow to all cities in the YRD in a hierarchical manner, forming a composite spatial organization model of one main and many vice. Hangzhou, Suzhou, Nanjing, and Hefei are the major cities that carry the check-in flow from Shanghai, playing the role of the regional core hub of Zhejiang Province, Suzhou Province, and Anhui Province. Among them, Hangzhou, as the capital of Zhejiang Province, promotes the descending of the check-in flow inside the province, gathering the check-in flow and then passing it to normal node cities such as Huzhou, Jinhua, Shaoxing, and Jiaxing. Because the check-in flow among general nodes is small, Zhejiang Province constitutes a spatial organization pattern of monocentric diffusion. In contrast, Jiangsu Province presents a polycentric network structure since cities in the province are closely connected and have a balanced check-in flow intensity. In Anhui Province, Hefei is the core city, but it has a low card flow with the neighboring cities, and the peripheral nodes are less connected, which constitutes a monocentric discrete spatial organization pattern.
The PRD presents a balanced double-group model with a double-core structure. Guangzhou and Shenzhen, as the dual cores, coordinate the surrounding cities to form a relatively balanced double cluster model, namely the Pearl River west coast cluster with Guangzhou as the core and the East Coast Cluster with Shenzhen as the core. Foshan, Dongguan, and Huizhou carry the main check-in flow from the core cities because of their geographical proximity, while other cities such as Zhaoqing, Jiangmen, and Zhongshan are at the edge of the network due to their distance from the core nodes.
The BTH presents a core-periphery model with a single-center radial structure. Beijing, as the core of BTH, connects with other cities, which presents the single-center radial structure. The intensity of check-in flow decreases with the geographical distance from Beijing, forming the core and the periphery communities.
5. Conclusions
The widespread application of SMPs has changed the mobility between cities in hybrid spaces. This paper proposes a method and analysis system for the construction of urban punching flow networks from the perspective of hybrid space and conducts an empirical study on three major urban clusters in China using Jitterbug cross-city punching data. The hierarchical attributes, community scope, and node centrality are analyzed, and the vertical and flat distribution characteristics are examined. The results are as follows.
(1) The highest average weighted degree of the check-in network of the three urban agglomerations is the YRD, with BTH and the PRD in decreasing order. The most apparent vertical hierarchical feature of the network is BTH, with the PRD and YRD in decreasing order. In terms of space, the YRD check-in network presents a Z-shaped skeleton with Suzhou-Shanghai-Hangzhou as the core. The PRD check-in network presents an N-shaped structure with Guangzhou and Shenzhen as the dual-core. The BTH check-in network presents a Beijing single-point radial core skeleton.
(2) The three check-in networks show prominent small-world characteristics, but the community division needs to be further clarified and the flattening characteristics are still immature. The community division of the three major urban agglomerations shows a spatial structure with the regional high check-in flow cities as the core and the neighboring cities as the coordinator. Among them, the YRD forms three communities based on the provincial boundary effect, the PRD forms two communities on the east and west sides of the Pearl River Estuary, and BTH creates a core community and a peripheral community.
(3) Due to the enormous population scale, SMPs penetration rate, and many internet celebrity spaces, megacities such as Beijing, Shanghai, Guangzhou, and Shenzhen are the core nodes of each check-in network. Generally, they perform as an outward export type, sending many media resources outward and promoting the integration of urban agglomerations. Cities with geographical proximity to the core nodes or specific recreational resources, such as Dongguan, Foshan, and Chengde, have a stronger weighted indegree and present inward aggregation type. These cities have a solid hybrid spatial accessibility and act as network hubs to shape the formation of check-in networks by gathering media resource inputs from multiple cities.
The primary significance of this paper is as follows. (1) We introduce the hybrid space perspective to study urban agglomeration integration and respond to the increasing trend of mediatization. (2) We introduce the cross-city check-in data of TikTok and conduct a modeling method and framework for the check-in network, which provides new data and methods for inter-city association pattern research and communication geography. (3) The structure of check-in networks in three major Chinese urban agglomerations is studied in comparison, providing theoretical support for the integration of urban agglomerations.
In addition, suggestions can be made to optimize the check-in network and enhance the integration pattern of urban agglomerations at digital and geospatial levels. (1) On the one hand, by actively releasing short videos on the theme of cultural tourism, tourism resource-based cities can portray cities’ leisure and cultural labels to enhance the visibility and attractiveness of cities in the digital space. On the other hand, through short video content or short video recommendation mechanism, cities can strengthen the virtual connection of specific city combinations in the digital space and deepen the intention of co-location, thus promoting media users to travel between cities. (2) In the geographic space, on the one hand, the attractiveness of cities to media users is enhanced by creating high-quality recreational spaces, and the conversion mechanism of online enthusiasm-offline vitality is strengthened. On the other hand, the transportation infrastructure is optimized to improve inter-city accessibility, thus reducing the frictional effect of geographical distance and promoting the offline mobility of media users across cities.
This study also has some limitations that are worth exploring further. First, in terms of data, although TikTok is the SMPs with the largest share of users in China, there is other software such as RED and Kuaishou. The number of users in the software is also large, and there are differences in user characteristics. For example, female users dominate RED, and users in small cities and rural areas dominate Kuaishou. Therefore, using only a single software may miss certain media users, resulting in inaccurate study results. We will combine data from multiple SMPs for future analysis. Second, in terms of methods, the node centralities metrics used in this paper need to fully reveal the importance of each node in the check-in flow network. In the node centrality analysis, the metrics used in this paper mainly examine the importance of cities in terms of check-in flow. However, examining the nodes’ characteristics from the topological structure features is also essential. Other node centralities metrics in SNA can be used in the future to fully reveal the functions played by cities in the check-in network. For example, intermediary centrality can be used to analyze the hub role of nodes in the network, and proximity centrality can be used to analyze the topological accessibility of nodes in the network. Third, it should be clarified that check-in activity represents only one type of spatial activity and is more inclined to describe leisure and recreational activities. It cannot fully characterize the spatial activities of urban agglomerations. This type of data can be combined with other types of activity data for further study. In addition, this study has only described and summarized the network characteristics of check-in flow. It is hoped that methods such as ERGM can be introduced in future studies to analyze the mechanism further. In addition, this paper selects a specific time cross-section, which can be extended to multiple time cross-sections.
Author Contributions
Conceptualization, B.X. and G.X.; methodology, B.X. and R.C.; software, B.X. and R.C.; validation, G.X., B.X. and R.C.; formal analysis, B.X. and G.X.; resources, G.X.; data curation, B.X.; writing—original draft preparation, G.X., B.X. and R.C.; writing—review & editing, G.X., B.X. and R.C.; visualization, R.C.; supervision, G.X.; project administration, G.X.; funding acquisition, G.X. All authors have read and agreed to the published version of the manuscript.
Funding
This research was funded by Talent Fund of Beijing Jiaotong University, grant number 2021RCW122, China Postdoctoral Science Foundation, grant number 2022M720393, National Natural Science Youth Program, grant number 52108040, and the Beijing Social Science Foundation, grant number 22GLC071.
Institutional Review Board Statement
Not applicable.
Informed Consent Statement
Not applicable.
Data Availability Statement
The datasets used and/or analyzed during the current study are available from the corresponding author upon reasonable request.
Acknowledgments
The authors would like to thank all the anonymous reviewers and editors who contributed their time and knowledge to this study. The authors also thank Zhao, M. who provided insightful opinion the precious support for the previous survey.
Conflicts of Interest
The authors declare no conflict of interest.
References
- Castells, M. The Informational City: Information Technology, Economic Restructuring, and the Urban-Regional Process; Blackwell Oxford: Oxford, UK, 1989. [Google Scholar]
- Castells, M. The Rise of the Network Society; Wiley: Hoboken, NJ, USA, 2009. [Google Scholar]
- Derudder, B. Mapping Global Urban Networks: A Decade of Empirical World Cities Research. Geogr. Compass 2008, 2, 559–574. [Google Scholar] [CrossRef]
- Zhang, Y.; Wang, T.; Supriyadi, A.; Zhang, K.; Tang, Z. Evolution and Optimization of Urban Network Spatial Structure: A Case Study of Financial Enterprise Network in Yangtze River Delta, China. ISPRS Int. J. Geo-Inf. 2020, 9, 611. [Google Scholar] [CrossRef]
- Balland, P.-A.; Boschma, R.; Ravet, J. Network dynamics in collaborative research in the EU, 2003–2017. Eur. Plan. Stud. 2019, 27, 1811–1837. [Google Scholar] [CrossRef] [Green Version]
- Li, X.D. Spatial structure of the Yangtze river delta city network based on the pattern of listed companies network. Prog. Geogr. 2017, 33, 1587–1600. [Google Scholar] [CrossRef]
- Yeh, A.G.; Yang, F.F.; Wang, J. Producer service linkages and city connectivity in the mega-city region of China: A case study of the Pearl River Delta. Urban Stud. 2015, 52, 2458–2482. [Google Scholar] [CrossRef]
- Castells, M. Informationalism, networks, and the network society: A theoretical blueprint. Netw. Soc. Cross-Cult. Persxpect. 2004, 3–45. [Google Scholar] [CrossRef]
- Hall, P.G.; Pain, K. The Polycentric Metropolis: Learning from Mega-City Regions in Europe; Routledge: Oxford, UK, 2006. [Google Scholar]
- Taylor, P.J.; Hoyler, M.; Verbruggen, R. External Urban Relational Process: Introducing Central Flow Theory to Complement Central Place Theory. Urban Stud. 2010, 47, 2803–2818. [Google Scholar] [CrossRef] [Green Version]
- Wang, Q.; Cheng, Y. Characteristics and Performance of City Network from the Perspective of High-way Freight—The Case of Three Major Urban Agglomerations in China. Urban Plan. Forum. 2020, 10, 32–39. [Google Scholar] [CrossRef]
- Chen, W.; Liu, W.; Ke, W.; Wang, N. Understanding spatial structures and organizational patterns of city networks in China: A highway passenger flow perspective. J. Geogr. Sci. 2018, 28, 477–494. [Google Scholar] [CrossRef] [Green Version]
- Huang, Y.; Lu, S.; Yang, X.; Zhao, Z. Exploring Railway Network Dynamics in China from 2008 to 2017. ISPRS Int. J. Geo-Inform. 2018, 7, 320. [Google Scholar] [CrossRef]
- Xu, W.; Zhou, J.; Qiu, G. China’s high-speed rail network construction and planning over time: A network analysis. J. Transp. Geogr. 2018, 70, 40–54. [Google Scholar] [CrossRef]
- Wang, Y.; Niu, X.; Song, X. Spatial Organizational Characteristics of the Yangtze River Delta Urban Agglomeration Based on Intercity Trips. City Plan. Rev. 2021, 45, 43–53. [Google Scholar] [CrossRef]
- Teixeira, S.H.D.O.; Catelan, M.J. New Articulations of the Brazilian Cities Network: An Analysis of the Heterarchies by the Airflow System. Soc. Nat. 2019, 31, e42622. [Google Scholar] [CrossRef]
- Zhao, Y.; Zhang, G.; Zhao, H. Spatial Network Structures of Urban Agglomeration Based on the Improved Gravity Model: A Case Study in China’s Two Urban Agglomerations. Complexity 2021, 2021, 6651444. [Google Scholar] [CrossRef]
- Zhao, M.; Liu, X.; Derudder, B.; Zhong, Y.; Shen, W. Mapping producer services networks in mainland Chinese cities. Urban Stud. 2015, 52, 3018–3034. [Google Scholar] [CrossRef]
- Zhao, M.; Derudder, B.; Huang, J. Examining the transition processes in the Pearl River Delta polycentric mega-city region through the lens of corporate networks. Cities 2017, 60, 147–155. [Google Scholar] [CrossRef]
- Wang, Y.; Yin, S.; Fang, X.; Chen, W. Interaction of economic agglomeration, energy conservation and emission reduction: Evidence from three major urban agglomerations in China. Energy 2022, 241, 122519. [Google Scholar] [CrossRef]
- Cao, Z.; Dai, L.; Wu, K.; Peng, Z. Structural Features and Driving Factors of the Evolution of the Global Interurban Knowledge Collaboration Network. Geogr. Res. 2022, 41, 1072–1091. [Google Scholar] [CrossRef]
- Read, R. Knowledge counts: Influential actors in the education for all global monitoring report knowledge network. Int. J. Educ. Dev. 2019, 64, 96–105. [Google Scholar] [CrossRef]
- Tang, C.; Dou, J. Exploring the Polycentric Structure and Driving Mechanism of Urban Regions from the Perspective of Innovation Network. Front. Phys. 2022, 10, 855380. [Google Scholar] [CrossRef]
- Liu, L.; Luo, J.; Xiao, X.; Hu, B.; Qi, S.; Lin, H.; Zu, X. Spatio-Temporal Evolution of Urban Innovation Networks: A Case Study of the Urban Agglomeration in the Middle Reaches of the Yangtze River, China. Land 2022, 11, 597. [Google Scholar] [CrossRef]
- Yan, S.; Jin, C. Characteristics of Spatial Network Structure of Tourist Flow in Urban Area of Luoyang. Sci. Geogr. Sin. 2019, 39, 1602–1611. [Google Scholar] [CrossRef]
- Chen, H.; Wang, M.; Zheng, S. Research on the Spatial Network Effect of Urban Tourism Flows from Shanghai Disneyland. Sustainability 2022, 14, 13973. [Google Scholar] [CrossRef]
- Wei, T. Application of GIS in Spatial Characteristics of Tourist Flow Based on Online Booking Data: A Case Study of Yangtze River Delta. Iran. J. Sci. Technol. Trans. Civ. Eng. 2022, 22, 1–11. [Google Scholar] [CrossRef]
- Seok, H.; Barnett, G.A.; Nam, Y. A social network analysis of international tourism flow. Qual. Quant. 2021, 55, 419–439. [Google Scholar] [CrossRef]
- He, B.; Liu, K.; Xue, Z.; Liu, J.; Yuan, D.; Yin, J.; Wu, G. Spatial and Temporal Characteristics of Urban Tourism Travel by Taxi—A Case Study of Shenzhen. ISPRS Int. J. Geo-Inf. 2021, 10, 445. [Google Scholar] [CrossRef]
- Gan, C.; Voda, M.; Wang, K.; Chen, L.; Ye, J. Spatial network structure of the tourism economy in urban agglomeration: A social network analysis. J. Hosp. Tour. Manag. 2021, 47, 124–133. [Google Scholar] [CrossRef]
- Lin, Q.; Xiang, M.; Zhang, L.; Yao, J.; Wei, C.; Ye, S.; Shao, H. Research on Urban Spatial Connection and Network Structure of Urban Agglomeration in Yangtze River Delta—Based on the Perspective of Information Flow. Int. J. Environ. Res. Public Health 2021, 18, 10288. [Google Scholar] [CrossRef]
- Chu, N.; Wu, X.; Zhang, P.; Zhang, P. Urban Spatial Network Characteristics from the Perspectives of Reality and Virtual Flow in Northeast China. Econ. Geogr. 2022, 42, 66–74. [Google Scholar] [CrossRef]
- An, D.; Hu, Y.; Wan, Y. Urban Network Association and Spillover Effects of Economic growth in China: A Study Based on Big Data and Network Analysis. Geogr. Res. 2022, 41, 2465–2481. [Google Scholar] [CrossRef]
- Duan, D.; Du, D.; Chen, Y.; Zhai, Q. Spatial-temporal complexity and growth mechanism of city innovation network in china. Sci. Geogr. Sin. 2018, 38, 1759–1768. [Google Scholar] [CrossRef]
- Zhou, C.; Zeng, G.; Cao, X. Chinese inter-city innovation networks structure and city innovation capability. Geogr. Res. 2017, 36, 1297–1308. [Google Scholar] [CrossRef]
- Chen, H.; Wu, S. Comparison of the Development Level and Structural Characteristics of Urban Networks in the three Metropolitan Areas: An Empirical Study Based on Six Major Segments of the Producer Service Industry. Econ. Geogr. 2020, 40, 110–118. [Google Scholar] [CrossRef]
- Ren, H.; Ye, M.; Yu, Y. Spatial Structure and Evolution Characteristics of Financial Network in Three Major Urban Agglomerations of China: A Case Study of Beijing-Tianjin-Hebei, Yangtze River Delta and Pearl River Delta. Econ. Geogr. 2021, 41, 63–73. [Google Scholar] [CrossRef]
- Fang, Y.; Su, X.; Huang, Z.; Guo, B. Structural Characteristics and Resilience Evaluation of Tourism Flow Networks in Five Major Urban Agglomerations in Coastal China: From the Perspective of Evolutionary Resilience. Econ. Geogr. 2022, 42, 203–211. [Google Scholar] [CrossRef]
- Ash, J.; Kitchin, R.; Leszczynski, A. Digital turn, digital geographies? Prog. Hum. Geogr. 2018, 42, 25–43. [Google Scholar] [CrossRef] [Green Version]
- Silva, A.D.S.E. From Cyber to Hybrid: Mobile Technologies as Interfaces of Hybrid Spaces. Space Cult. 2006, 9, 261–278. [Google Scholar] [CrossRef] [Green Version]
- Soja, E.W. Thirdspace: Journeys to Los Angeles and other Real-and-Imagined Places. Cap. Cl. 1998, 22, 137–139. [Google Scholar] [CrossRef]
- Wang, W.; Zhang, M. Geomedia and thirdspace: The progress of research of geographies of media and communication in the West. Prog. Geogr. 2022, 41, 1082–1096. [Google Scholar] [CrossRef]
- Paldino, S.; Bojic, I.; Sobolevsky, S.; Ratti, C.; González, M.C. Urban magnetism through the lens of geo-tagged photography. EPJ Data Sci. 2015, 4, 5. [Google Scholar] [CrossRef]
- Sulis, P.; Manley, E.; Zhong, C.; Batty, M. Using mobility data as proxy for measuring urban vitality. J. Spat. Inf. Sci. 2018, 16, 137–162. [Google Scholar] [CrossRef]
- Long, Y.; Huang, C. Does block size matter? The impact of urban design on economic vitality for Chinese cities. Environ. Plan. B Urban Anal. City Sci. 2019, 46, 406–422. [Google Scholar] [CrossRef] [Green Version]
- Zhang, W.; Chong, Z.; Li, X.; Nie, G. Spatial patterns and determinant factors of population flow networks in China: Analysis on Tencent Location Big Data. Cities 2020, 99, 102640. [Google Scholar] [CrossRef]
- Jiang, H.; Luo, S.; Qin, J.; Liu, R.; Yi, D.; Liu, Y.; Zhang, J. Exploring the Inter-Monthly Dynamic Patterns of Chinese Urban Spatial Interaction Networks Based on Baidu Migration Data. ISPRS Int. J. Geo-Inf. 2022, 11, 486. [Google Scholar] [CrossRef]
- Liu, Y.; Liao, W. Spatial Characteristics of the Tourism Flows in China: A Study Based on the Baidu Index. ISPRS Int. J. Geo-Inf. 2021, 10, 378. [Google Scholar] [CrossRef]
- Deng, C.; Song, X.; Xie, B.; Li, M.; Zhong, X. City Network Link Analysis of Urban Agglomeration in the Middle Yangtze River Basin Based on the Baidu Post Bar Data. Geogr. Res. 2018, 37, 1181–1192. [Google Scholar] [CrossRef]
- Li, X.; Liu, H.; Tian, S.; Gong, Y. Network structure and influencing factors of urban human habitat activities in the three provinces of Northeast China: Based on Baidu Post Bar data. Prog. Geogr. 2019, 38, 1726–1734. [Google Scholar] [CrossRef] [Green Version]
- Li, Z.; Zhao, M. City Networks in Cyberspace: Using Douban-Event to Measure the Cross-City Activities in Urban Agglomeration of China. Hum. Geogr. 2016, 31, 102–108. [Google Scholar] [CrossRef]
- Wang, P.; Liu, K.; Wang, D.; Fu, Y. Measuring Urban Vibrancy of Residential Communities Using Big Crowdsourced Geotagged Data. Front. Big Data 2021, 34. [Google Scholar] [CrossRef]
- Zhao, M.; Xu, G.; De Jong, M.; Li, X.; Zhang, P. Examining the Density and Diversity of Human Activity in the Built Environment: The Case of the Pearl River Delta, China. Sustainability 2020, 12, 3700. [Google Scholar] [CrossRef]
- Zhang, Y.; Li, Y.; Zhang, E.; Long, Y. Revealing virtual visiting preference: Differentiating virtual and physical space with massive TikTok records in Beijing. Cities 2022, 130, 103983. [Google Scholar] [CrossRef]
- Ding, Z.; Ma, F.; Zhang, G. Spatial Differences and Influencing Factors of Urban Network Attention by Douyin Fans in China. Geogr. Res. 2022, 41, 2548–2567. [Google Scholar]
- Peng, H.; Lu, L.; Lu, X.; Ling, S.; Li, Z.; Deng, H. The network structure of cross-border tourism flow based on the social network method:A case of Lugu Lake Region. Sci. Geogr. Sin. 2014, 34, 1041–1050. [Google Scholar] [CrossRef]
- Wang, J.; Mo, H.; Wang, F.; Jin, F. Exploring the network structure and nodal centrality of China’s air transport network: A complex network approach. J. Transp. Geogr. 2011, 19, 712–721. [Google Scholar] [CrossRef]
- Duan, D.; Chen, Y.; Du, D. Regional Integration Process of China’s Three Major Urban Agglomerations from the Perspective of Technology Transfer. Sci. Geogr. Sin. 2019, 39, 1581–1591. [Google Scholar] [CrossRef]
- Lin, Z.; Chen, Y.; Liu, X.; Ma, Y. Spatio-temporal pattern and influencing factors of cooperation network of China’s inbound tourism cities. Acta Geogr. Sin. 2022, 77, 2034–2049. [Google Scholar]
- Forstall, R.L.; Greene, R.P.; Pick, J.B. Which Are the Largest? Why Lists of Major Urban Areas Vary so Greatly. Tijdschr. Voor Econ. En Soc. Geogr. 2009, 100, 277–297. [Google Scholar] [CrossRef]
- Fang, C.; Yu, D. Urban agglomeration: An evolving concept of an emerging phenomenon. Landsc. Urban Plan. 2017, 162, 126–136. [Google Scholar] [CrossRef]
Figure 1.
Location of three major urban agglomerations of China.
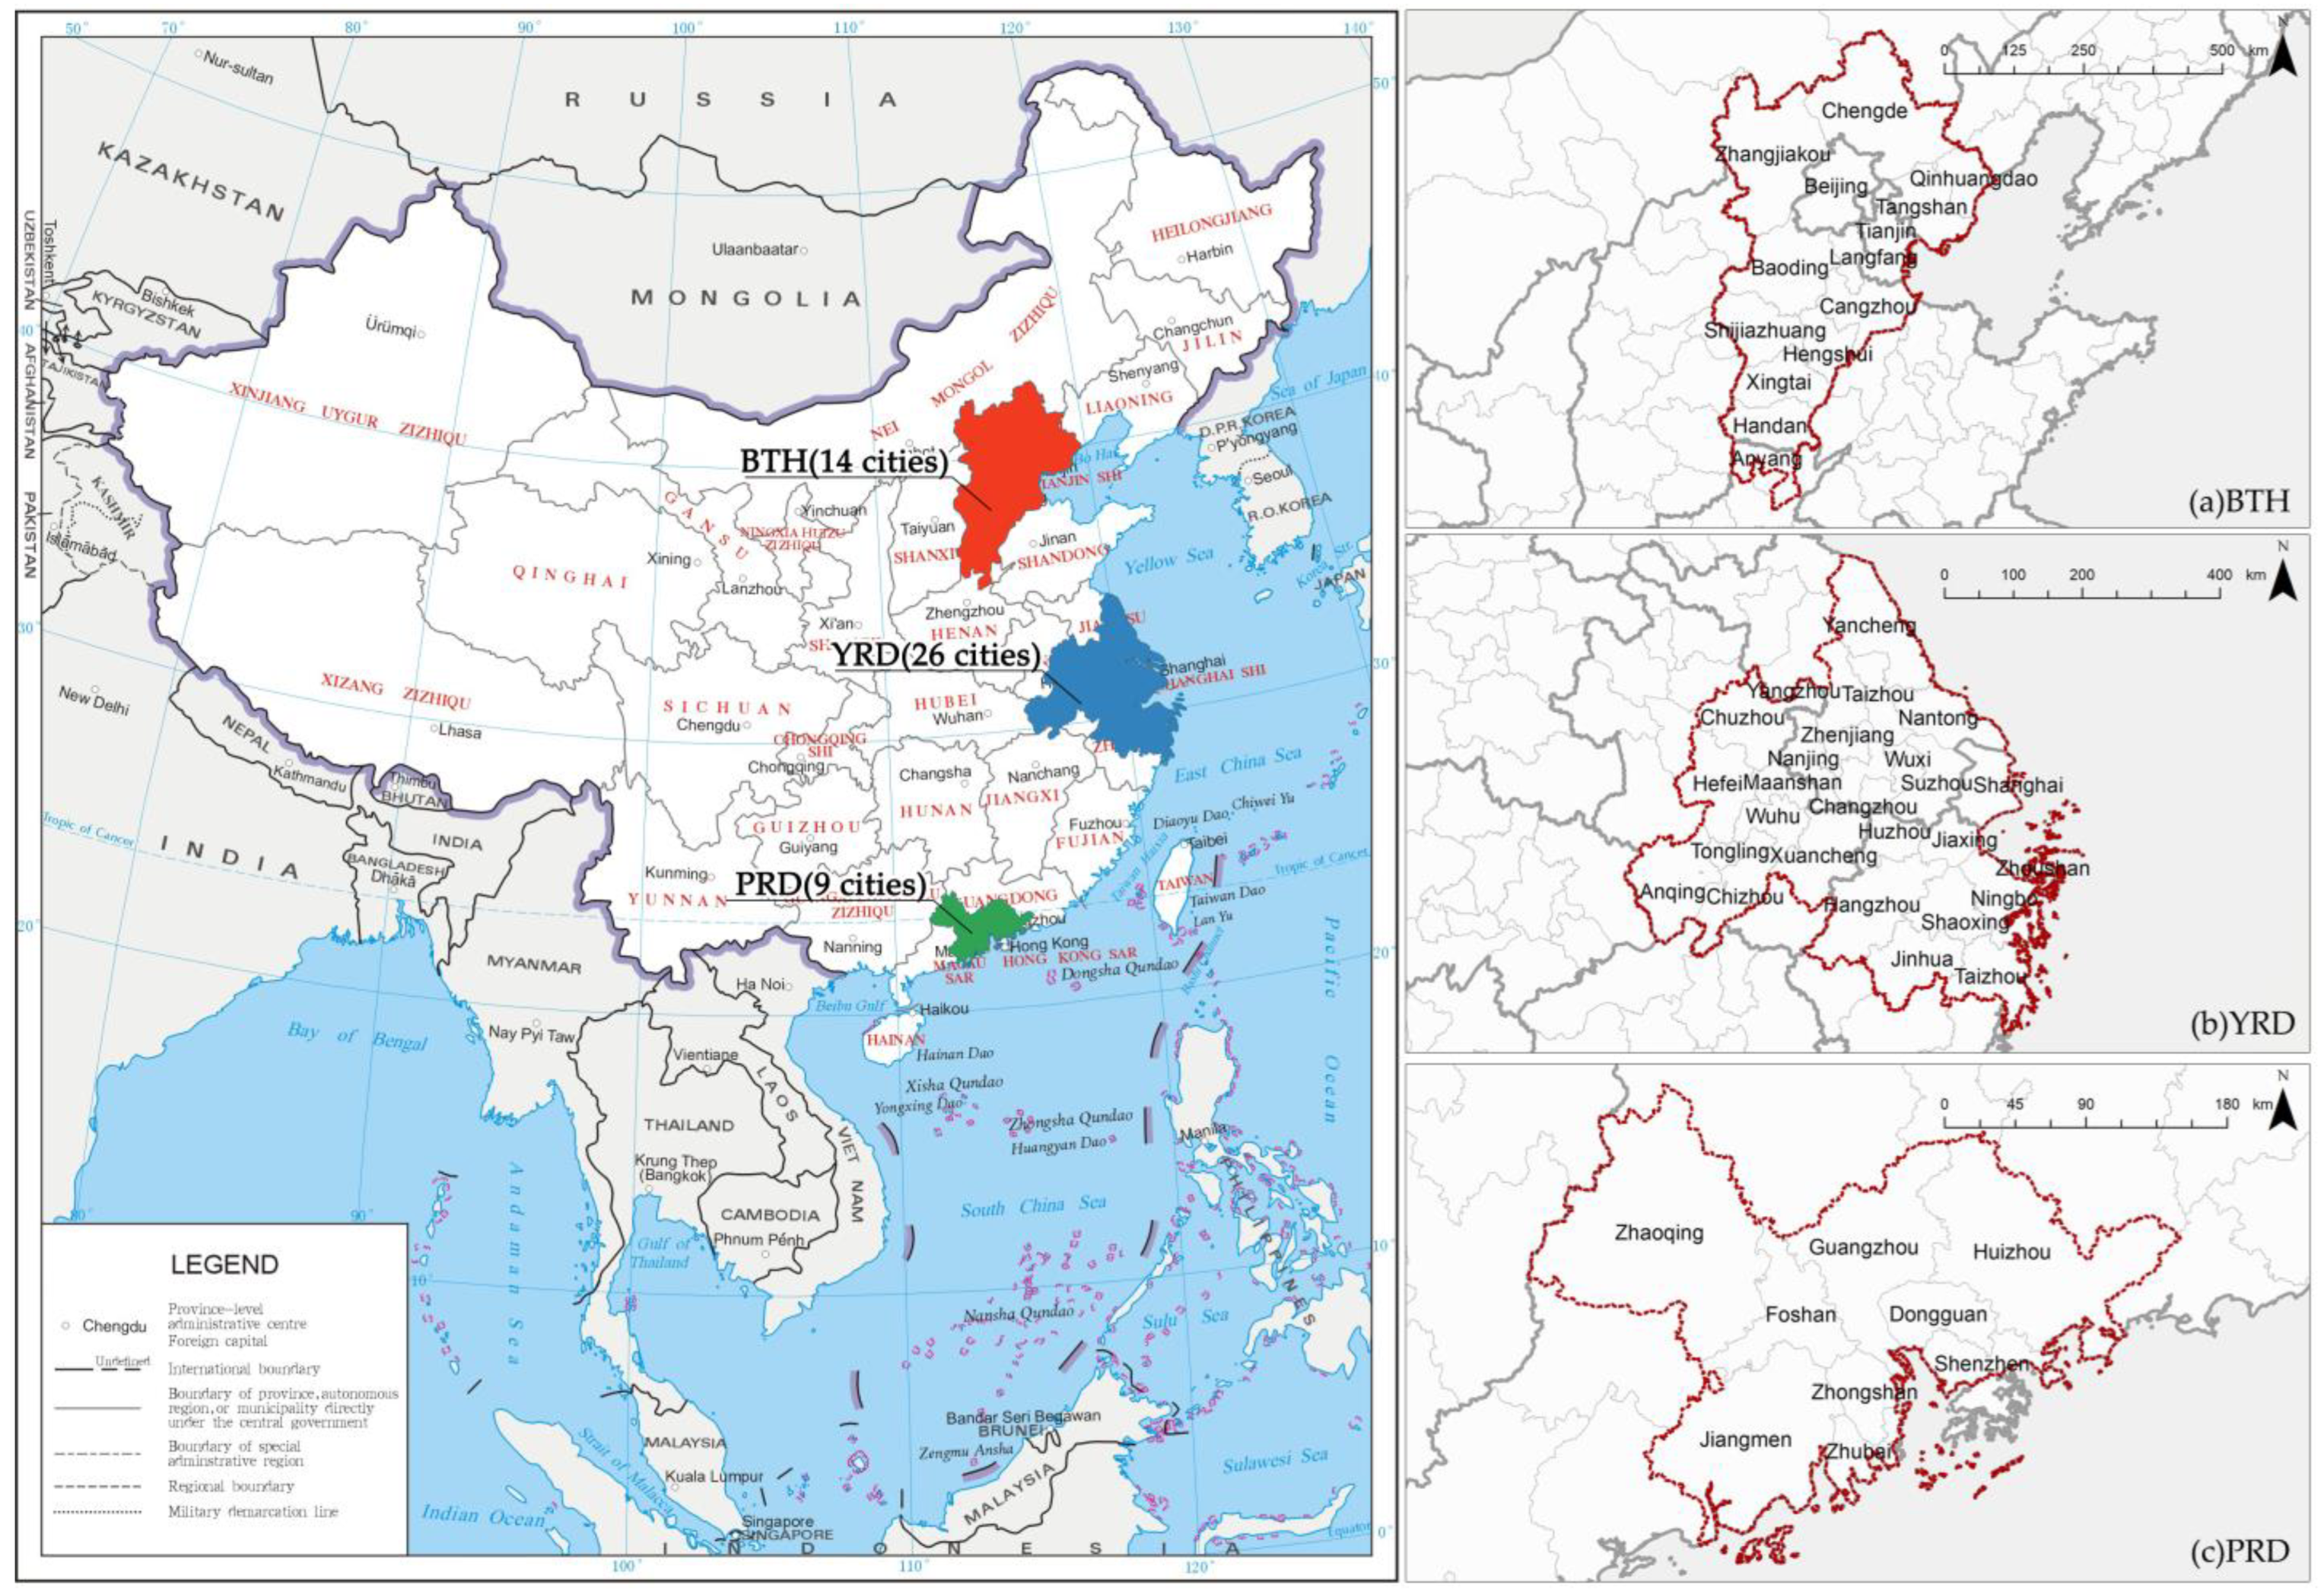
Figure 2.
Diagram of the check-in process.

Figure 3.
The technical route diagram.

Figure 4.
Fitting results of the weighted degree distribution of check flow network of three major urban agglomerations.
Figure 4.
Fitting results of the weighted degree distribution of check flow network of three major urban agglomerations.
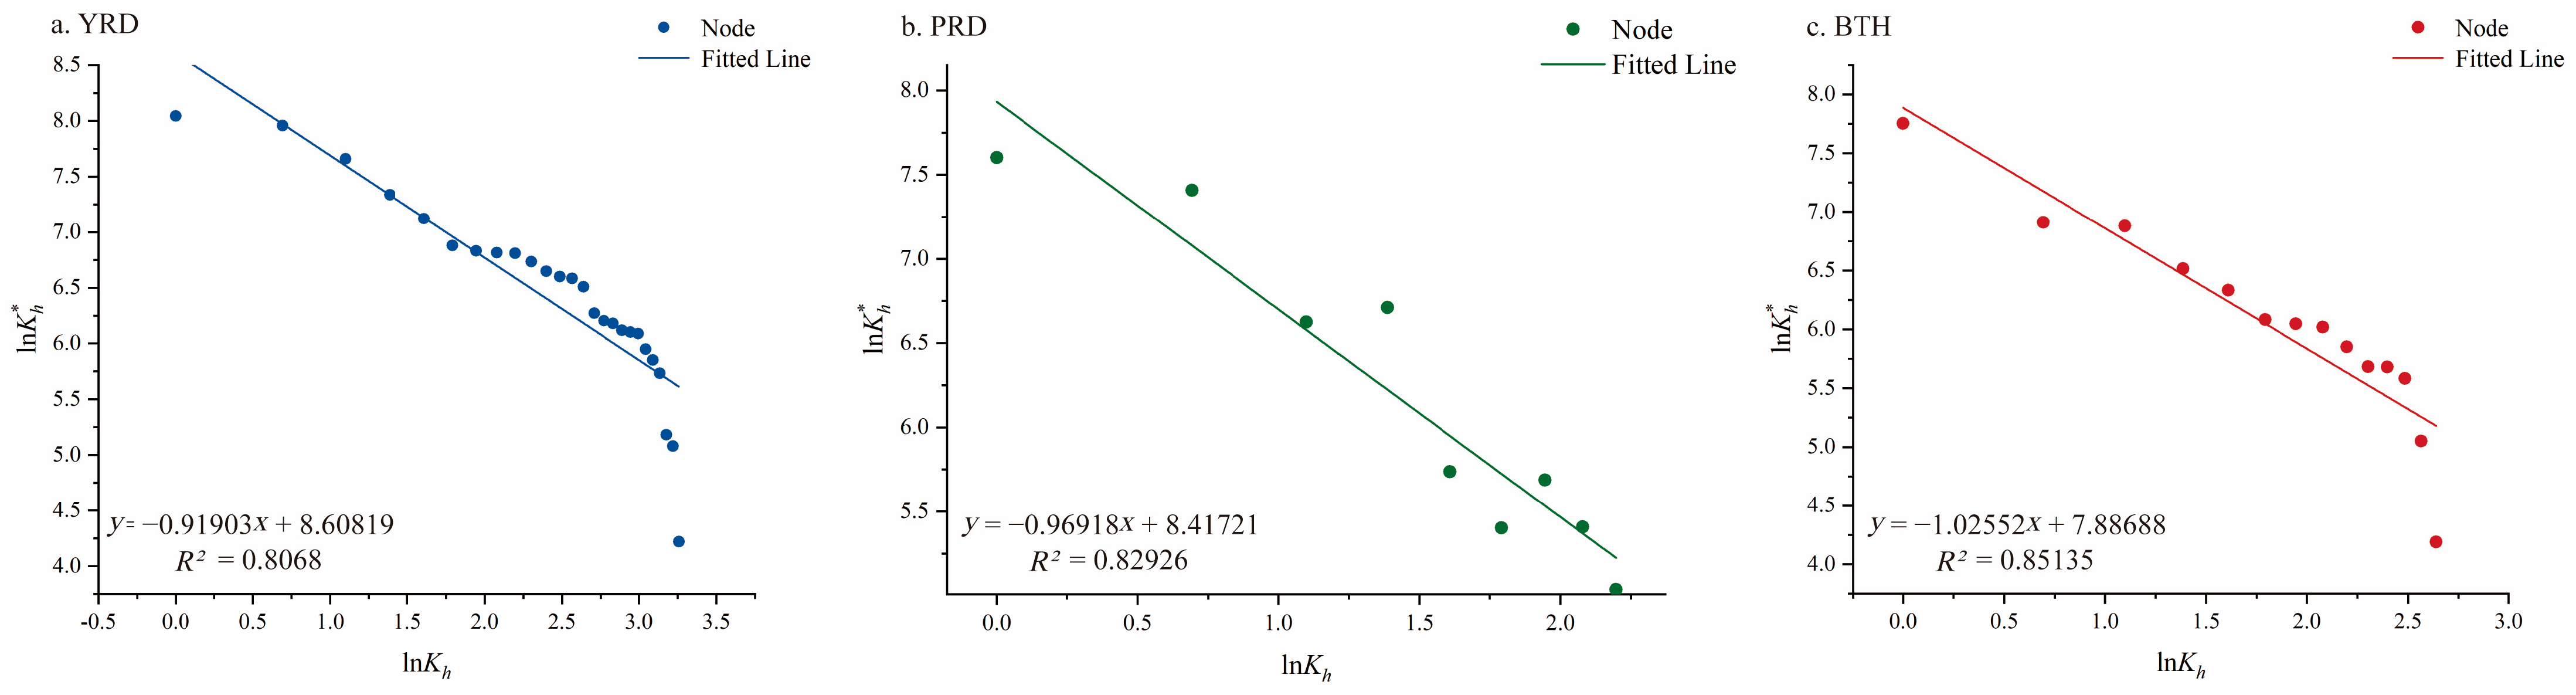
Figure 5.
Topology and spatial distribution of the check-in networks of three major urban agglomerations (a), YRD; (b), PRD; (c), BTH.
Figure 5.
Topology and spatial distribution of the check-in networks of three major urban agglomerations (a), YRD; (b), PRD; (c), BTH.

Figure 6.
Community distribution of three major urban agglomerations.
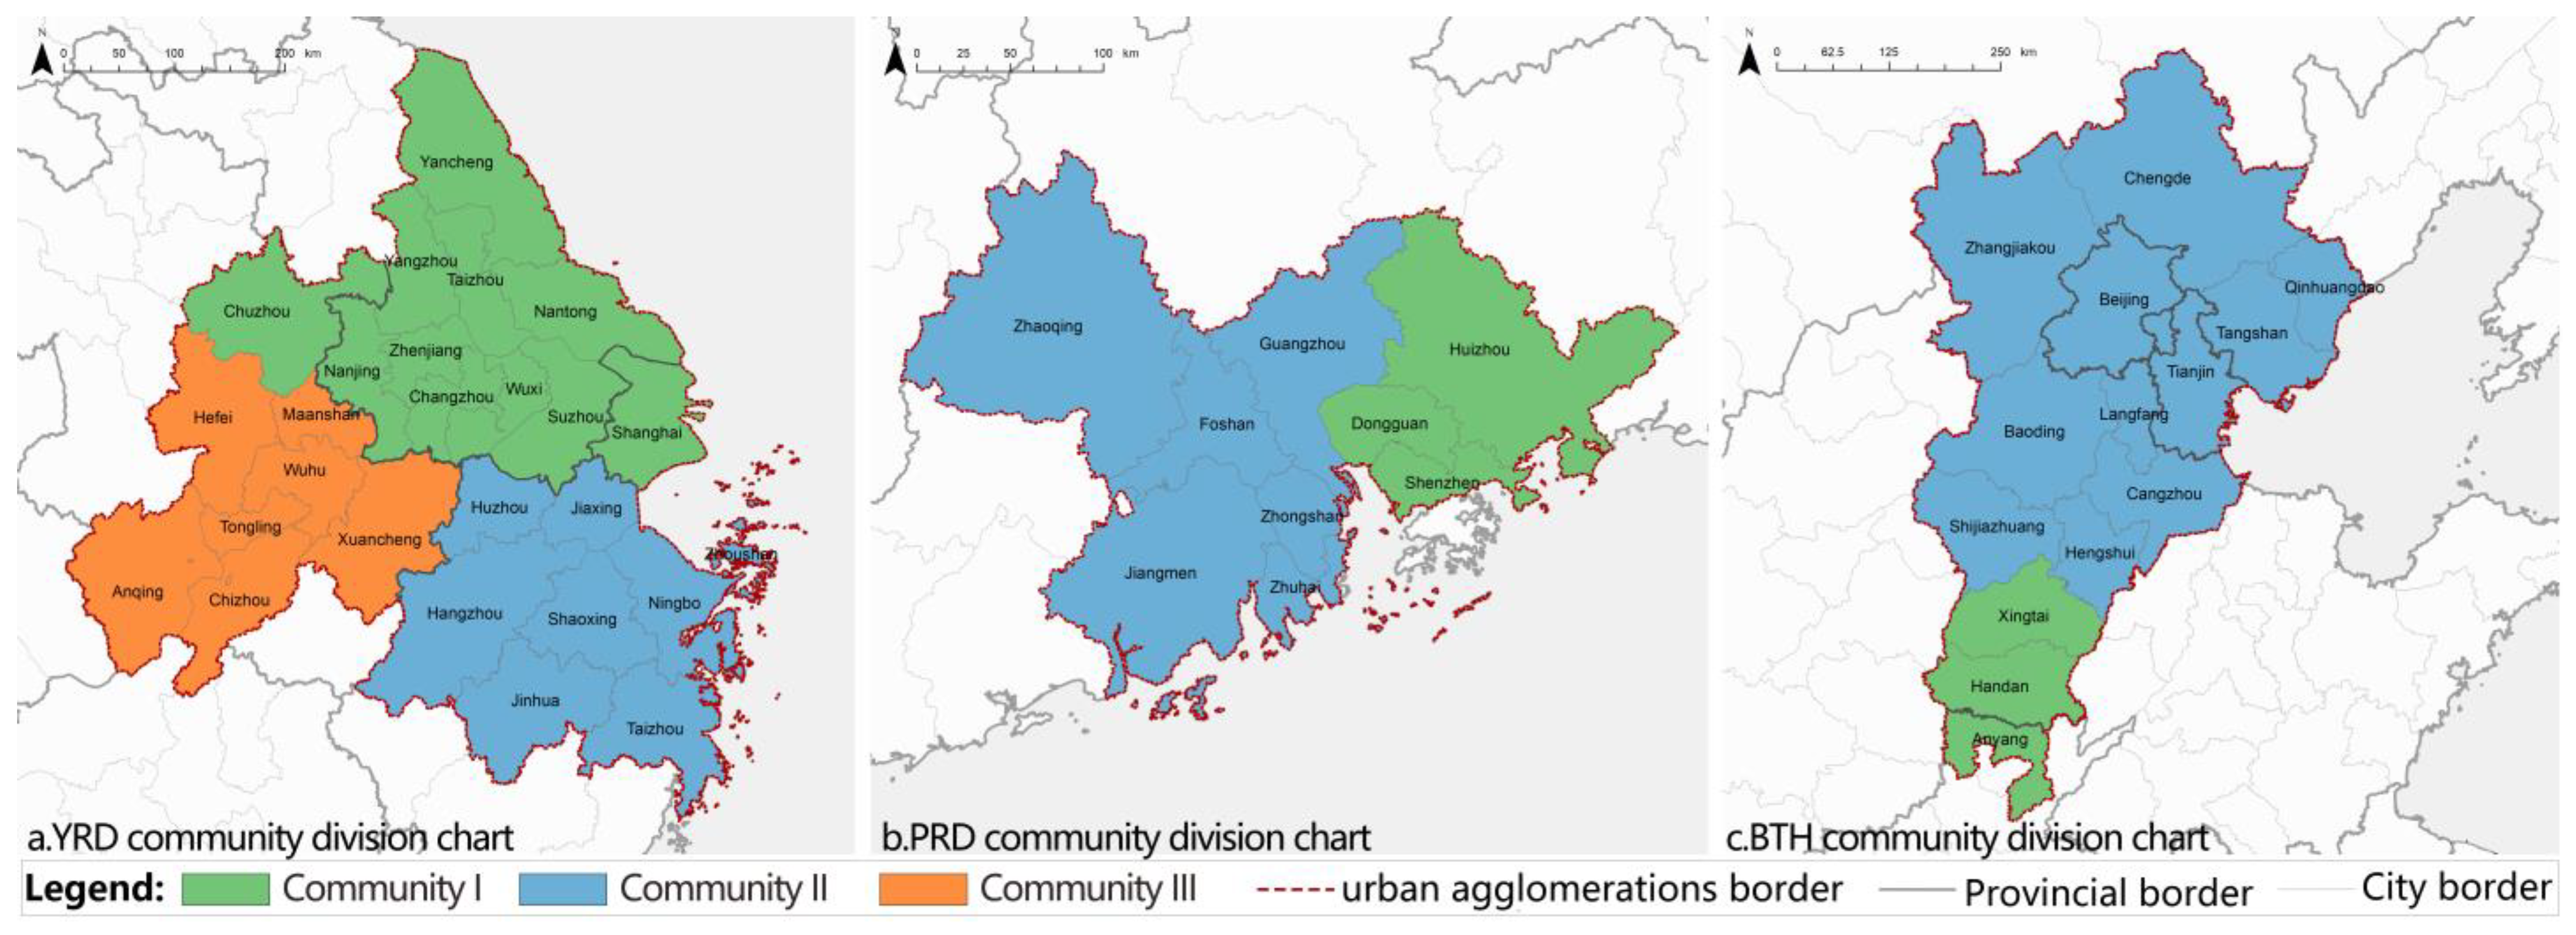
Figure 7.
Spatial organizational patterns of three major urban agglomerations.

Table 1.
Cross-city check-in data samples.
| Oid | Date | User_City | Check-In_City |
|---|---|---|---|
| 1 | 2022/8/1 | Zhaoqing | Zhuhai |
| 2 | 2022/8/1 | Foshan | Zhaoqing |
| 3 | 2022/8/1 | Jiangmen | Guangzhou |
| 4 | 2022/8/1 | Guangzhou | Shenzhen |
| 5 | 2022/8/1 | Shenzhen | Guangzhou |
| 6 | 2022/8/1 | Dongguan | Huizhou |
| 7 | 2022/8/1 | Foshan | Guangzhou |
| 8 | 2022/8/1 | Guangzhou | Foshan |
| 9 | 2022/8/1 | Zhongshan | Huizhou |
| 10 | 2022/8/1 | Guangzhou | Foshan |
Table 2.
Topological eigenvalues of check-in network of three major urban agglomerations.
| Eigenvalues | YRD | PRD | BTH |
|---|---|---|---|
| Number of nodes | 26 | 9 | 14 |
| Average degree | 10.077 | 5.111 | 6 |
| Average weighted degree | 433 | 264.556 | 293.357 |
| Fit coefficient (a) | −0.91903 | −0.96918 | −1.02552 |
Table 3.
Small-world of check flow network of three major urban agglomerations.
| Index | YRD | BTH | PRD |
|---|---|---|---|
| Average clustering coefficient | 0.658 (0.377) 1 | 0.626 (0.435) | 0.597 (0.586) |
| Average path length | 1.6 (1.623) | 1.556 (1.571) | 1.361 (1.375) |
1 The eigenvalues of the actual network and the eigenvalues of the zero model are shown in parentheses. The zero model is a random network with the same number of nodes and edges as the actual network, computed by Gephi.
Table 4.
Community statistics of three major urban agglomerations.
| Urban Agglomeration | Community Number | Number of Nodes | Density | Flow | Flow Ratio | Core City |
|---|---|---|---|---|---|---|
| YRD | 1 | 11 | 0.82 | 4519 | 39.96% | Shanghai, Suzhou, Nanjing |
| YRD | 2 | 8 | 0.75 | 2688 | 23.77% | Hangzhou |
| YRD | 3 | 7 | 0.355 | 522 | 4.62% | Hefei |
| PRD | 1 | 6 | 0.835 | 2569 | 39.95% | Guangzhou |
| PRD | 2 | 3 | 1 | 1728 | 26.87% | Shenzhou |
| BTH | 1 | 11 | 0.59 | 3421 | 83.01% | Beijing |
| BTH | 2 | 3 | 0.665 | 125 | 3.03% | —— |
Table 5.
Node attributes of check-in network of three major urban agglomerations.
| YRD 1 | PRD | ||||||||||
|---|---|---|---|---|---|---|---|---|---|---|---|
| City | WID 2 | WOD 2 | WD 2 | NSI | PR | City | WID | WOD | WD | NSI | PR |
| Shanghai | 904 | 2208 | 3112 | −0.42 | 0.091 | Guangzhou | 1243 | 2003 | 3246 | −0.234 | 0.214 |
| Hangzhou | 1271 | 1588 | 2859 | −0.11 | 0.109 | Foshan | 1254 | 754 | 2008 | 0.249 | 0.158 |
| Suzhou | 1116 | 1005 | 2121 | 0.052 | 0.082 | Dongguan | 1059 | 821 | 1880 | 0.126 | 0.14 |
| Naning | 641 | 894 | 1535 | −0.17 | 0.058 | Shenzhen | 777 | 1649 | 2426 | −0.359 | 0.136 |
| Wuxi | 654 | 585 | 1239 | 0.056 | 0.054 | Huizhou | 974 | 310 | 1284 | 0.517 | 0.112 |
| Yancheng | 389 | 584 | 973 | −0.2 | 0.032 | Zhongshan | 445 | 222 | 667 | 0.334 | 0.085 |
| Hefei | 430 | 497 | 927 | −0.07 | 0.036 | Jiangmen | 233 | 223 | 456 | 0.021 | 0.056 |
| Ningbo | 510 | 401 | 911 | 0.12 | 0.056 | Zhuhai | 221 | 154 | 375 | 0.178 | 0.049 |
| Jiaxing | 501 | 405 | 906 | 0.106 | 0.035 | Zhaoqing | 225 | 295 | 520 | −0.134 | 0.046 |
| Changzhou | 539 | 301 | 840 | 0.283 | 0.044 | Average value | 715 | 715 | 1429 | 0.077 | 0.111 |
| Jinhua | 408 | 363 | 771 | 0.058 | 0.037 | BTH | |||||
| Nantong | 506 | 229 | 735 | 0.377 | 0.035 | City | WID | WOD | WD | NSI | PR |
| Huzhou | 570 | 154 | 724 | 0.575 | 0.041 | Beijing | 664 | 1668 | 2332 | −0.43 | 0.223 |
| Shaoxing | 473 | 197 | 670 | 0.412 | 0.042 | Langfang | 539 | 464 | 1003 | 0.074 | 0.081 |
| Taizhou-J 3 | 246 | 284 | 530 | −0.07 | 0.024 | Baoding | 474 | 499 | 973 | −0.025 | 0.072 |
| Taizhou-Z 3 | 291 | 204 | 495 | 0.176 | 0.029 | Shijiazhuang | 318 | 358 | 676 | −0.059 | 0.063 |
| Zhoushan | 431 | 52 | 483 | 0.785 | 0.045 | Tianjin | 339 | 224 | 563 | 0.204 | 0.059 |
| Wuhu | 225 | 229 | 454 | −0.01 | 0.022 | Zhangjiakou | 386 | 52 | 438 | 0.762 | 0.065 |
| Chuzhou | 223 | 224 | 447 | −0 | 0.02 | Chengde | 346 | 77 | 423 | 0.635 | 0.155 |
| Yangzhou | 172 | 269 | 441 | −0.22 | 0.016 | Handan | 202 | 209 | 411 | −0.017 | 0.042 |
| Anqing | 161 | 222 | 383 | −0.16 | 0.017 | Xingtai | 206 | 142 | 348 | 0.183 | 0.039 |
| Xuancheng | 190 | 158 | 348 | 0.092 | 0.018 | Tangshan | 166 | 128 | 294 | 0.129 | 0.051 |
| Zhenjiang | 210 | 99 | 309 | 0.359 | 0.021 | Cangzhou | 141 | 152 | 293 | −0.037 | 0.029 |
| Maanshan | 77 | 101 | 178 | −0.14 | 0.013 | Qinhuangdao | 248 | 18 | 266 | 0.864 | 0.081 |
| Chizhou | 104 | 57 | 161 | 0.292 | 0.012 | Hengshui | 92 | 64 | 156 | 0.179 | 0.022 |
| Tongling | 68 | 0 | 68 | 1 | 0.01 | Anyang | 0 | 66 | 66 | −1 | 0.011 |
| Average value | 435 | 435 | 870 | 0.122 | 0.038 | Average value | 294 | 294 | 589 | 0.105 | 0.071 |
1 The weighted degree refers to the total weighted degree, which is the sum of the Weighted in-degree and Weighted out-degree. 2 WID refers to Weighted in-degree, WOD refers to Weighted out-degree, WD refers to Weighted degree. 3 Two cities in the YRD are called Taizhou. In order to distinguish, Taizhou in Zhejiang Province is named Taizhou-Z, and Taizhou in Jiangsu Province is named Taizhou-J in this paper.
Disclaimer/Publisher’s Note: The statements, opinions and data contained in all publications are solely those of the individual author(s) and contributor(s) and not of MDPI and/or the editor(s). MDPI and/or the editor(s) disclaim responsibility for any injury to people or property resulting from any ideas, methods, instructions or products referred to in the content. |
© 2022 by the authors. Licensee MDPI, Basel, Switzerland. This article is an open access article distributed under the terms and conditions of the Creative Commons Attribution (CC BY) license (https://creativecommons.org/licenses/by/4.0/).
Share and Cite
MDPI and ACS Style
Xiang, B.; Chen, R.; Xu, G. Uncovering Network Heterogeneity of China’s Three Major Urban Agglomerations from Hybrid Space Perspective-Based on TikTok Check-In Records. Land 2023, 12, 134. https://doi.org/10.3390/land12010134
AMA Style
Xiang B, Chen R, Xu G. Uncovering Network Heterogeneity of China’s Three Major Urban Agglomerations from Hybrid Space Perspective-Based on TikTok Check-In Records. Land. 2023; 12(1):134. https://doi.org/10.3390/land12010134
Chicago/Turabian StyleXiang, Bowen, Rushuang Chen, and Gaofeng Xu. 2023. "Uncovering Network Heterogeneity of China’s Three Major Urban Agglomerations from Hybrid Space Perspective-Based on TikTok Check-In Records" Land 12, no. 1: 134. https://doi.org/10.3390/land12010134
Note that from the first issue of 2016, this journal uses article numbers instead of page numbers. See further details here.