Article

The Role of Wastewater in Controlling Fluvial Erosion Processes on Clayey Bedrock

1
School of Science and Technology, Geology Division, University of Camerino, Via Gentile III da Varano 7, 62032 Camerino, Italy
2
Department of Earth and Marine Sciences, University of Palermo, Via Archirafi 22, 90123 Palermo, Italy
*
Author to whom correspondence should be addressed.
Land 2023, 12(1), 227; https://doi.org/10.3390/land12010227
Submission received: 17 December 2022 / Revised: 3 January 2023 / Accepted: 7 January 2023 / Published: 11 January 2023

Abstract

:
In recent decades, fluvial erosion processes in highly anthropized areas are mainly associated with in-stream gravel mining activities or with the presence of artificial reservoirs which have increased the erosive capacity of the river as a consequence of the reduced sediment transport or the modification of the longitudinal profile of the channel. On the other hand, the role of pollutants in the degradation processes of soils with a predominantly clayey component is little known. The present study, through chemical analyses of water and mineralogical–geotechnical analyses of clayey soil samples taken along some river channels in central Italy in correspondence with water treatment plants, highlights how “polluting” elements present in the water can modify the crystalline lattice and consequently, the resistance parameters of the soil itself, making it more susceptible to erosion processes. In particular, significant are the variations of the Plasticity Index, which tends to double in all the samples and the transformations of clayey minerals such as illite and kaolinite, toward montmorillonite and smectite, with consequent breaking of the ionic bonds and decrease of the material cohesion. Although in the cases studied this phenomenon was quantitatively less relevant than the “mechanical” processes described above, it could have a greater impact in the presence of landfills or large production settlements (agricultural or industrial) where the concentration of pollutants can be substantial.

1. Introduction

The evolution of a fluvial system is controlled by several factors including climate changes [1,2], eustatic sea-level changes [3,4], tectonic uplift [5,6] and human activities, the latter predominant in areas with a medium-high population density (e.g., [7,8,9,10,11,12,13,14,15,16,17,18,19,20,21,22]).
Among the activities with the greatest impact, in-stream mining works are recognized as the main cause of the activation of intense and showy linear erosion processes in almost all the European rivers in the second half of the 20th century [9,11,23,24,25,26,27,28,29]. Furthermore, damming works for the creation of artificial reservoirs have also triggered intense erosion processes, as the reservoirs themselves have functioned as sedimentary traps [30,31,32,33,34,35,36].
Among all human activities, the role of water chemistry and, particularly of wastewater as possible contributions to the intensity of erosive processes is little known [37,38,39]; the erosion process, however, must be considered in the most general sense of the term, i.e., as an alteration of the mechanical characteristics of the soil following the chemical action of polluted/treated waters [40].
The present work, through geomorphological surveys, chemical analyses of waters, and mineralogical and geotechnical analyses of clayey samples taken upstream and downstream of some wastewater treatment plants present along three river reaches of the central-southern Marche (central Italy), evidences that the treated wastewater alters the soil physical–mechanical characteristics, triggering anomalous deepening phenomena downstream.
Understanding these processes is essential to prevent and/or limit conditions that can strongly alter the continuity and the morphology of the river with sometimes irreparable consequences on the ecological status of the river itself; these actions, on the other hand, also fall within the framework of policies by the European Commission (Directives 2000/60/EC and 2007/60/EC) aimed at defining the basic principles of water sustainability (both surface and groundwaters), river basin management and flood risks assessment and management

2. Materials and Methods

2.1. Study Area

The study area, located in central-southern Marche (central Italy), includes six sample sites located along limited stretches of the Potenza, Chienti and Tenna rivers (Figure 1).
It belongs to a vast region located in the peri-Adriatic hilly belt, where Miocene, Pliocene, and Pleistocene marine sedimentary rocks overlying Messinian turbidites (clayey sediments with frequent intercalations of sands and conglomerates) outcrops. Starting from the early Pliocene this succession has been incised from west to east by consequent rivers following the regional topographic gradient [41]. The resulting valleys are strongly asymmetrical, with the northern side characterized by a staircase of alluvial terraces and the southern one usually steep and affected by numerous landslides [42]. Since the middle Pleistocene four orders of fluvial terraces were formed [42]. In the inner sectors of the river valleys, the genesis of terraces was connected to the Pleistocene climatic changes interacting with the river-cutting process induced by the regional uplift [43,44,45]. The most recent phase (Holocene), which reflects the dismantling of the more ancient deposits and the hillslope erosion induced by human impact [46], consists of sands and conglomerates with intercalations of silts and clays. Locally, and mostly in correspondence of anthropic works, the incision has cut the most recent terraces reaching the underlying clayey bedrock [42]. From a climatic point of view, this sector is characterized by a typical Mediterranean regime defined as Adriatic-sublittoral [47]. During the year, it experiences mean temperatures ranging between 12.5 and 15.5 °C; rapid spatial variations in temperature, however, are not rare and are caused by the orographic influence, which modifies the thermal conditions of the air masses that hit the region. Even precipitation follows a similar trend, ranging from 700 and 1200 mm/year [48,49,50].
All the valley bottoms evidence strong deepening processes of the riverbeds (Figure 2) usually associated with the concomitant action of several factors:
(i)
the intense agricultural activity on the slopes, which has triggered intense erosion phenomena and sometimes landslides by reducing the concentration time and consequently increasing the volumes and speed of running waters;
(ii)
the morphological modifications of the riverbeds (narrowing of the river sections, rectification of the riverbeds, creation of riverbank consolidation works) which have led to increases in the speed of the outflows and sudden deepening processes;
(iii)
the presence of “barriers” (check dams, groins, etc.) and hydraulic works built for irrigation and/or hydroelectric purposes, which have produced, sometimes in just over a decade, downcutting of the order of 10–15 m [51] sometimes compromising or even causing the collapse of the infrastructure itself.
Wastewater treatment plants, located along the main and secondary hydrographic network and in correspondence with the major inhabited areas, are numerous (Figure 1 and Figure 3). Detailed surveys carried out in correspondence with these plants have highlighted anomalous deepening phenomena, only partially attributable to one or more of the causes mentioned above (Figure 2). Six of these situations located along the thalwegs of the Chienti, Potenza, and Tenna rivers, as mentioned, were investigated through geomorphological investigations and chemical–mineralogical–geotechnical analyses of water and clayey bedrock samples taken upstream and downstream of the plants. It should be noted that these samplings were carried out taking care to take the material within the same substrate horizon to exclude any differences related to the genetic context.

2.2. Chemical Analyses

The chemical analyses, carried out at the Department of Chemical Sciences of the University of Camerino, were conducted on 12 water samples taken upstream and downstream of the wastewater treatment plants. Because of its high solvent power, water, in addition to various natural substances, also contains those produced by human activity. These substances are found, in ionic form, in a wide range of concentrations (from a few nanograms per liter—ng/L) to several hundred milligrams per liter—mg/L) depending on their abundance in nature, their solubility, and the chemical–physical processes to which they are subjected.
The main elements and/or compounds dissolved in water are the cations Ca++, Na+, Mg++, the anions HCO3, SO4=, Cl, and silica (SiO2). The content and percentage of the main ions certainly depend on the chemical composition of the rocks and soils present in the drainage basin. Concerning the “polluting” substances deriving from human activities the analyses have been focused on researching the following: acids and alkalis, various types of chlorides, ammonia (NH3 and ammonia salts), hydrogen sulfide, sulfates (SO4=), sulfites (SO3=), cyanides (CN), nitrites (NO2), nitrates (NO3) phosphates, and heavy metals.
The chemical and physical equilibrium of water is important not only for the direct effects on human health but also for the less evident effects on the natural system. An example is given by the aqueous solutions that interact with the adsorbent material, both organic and inorganic, which adsorbs a part of the solids in the solution, both dissociated and nondissociated. This adsorption is due to the physical attraction between two solid particles, but also the electrostatic attraction of two opposite electric charges (selective or chemical adsorption); in this last case the ions are not only adsorbed on the surface of the mineral, but some of them can enter the crystalline lattice through ion exchange processes.

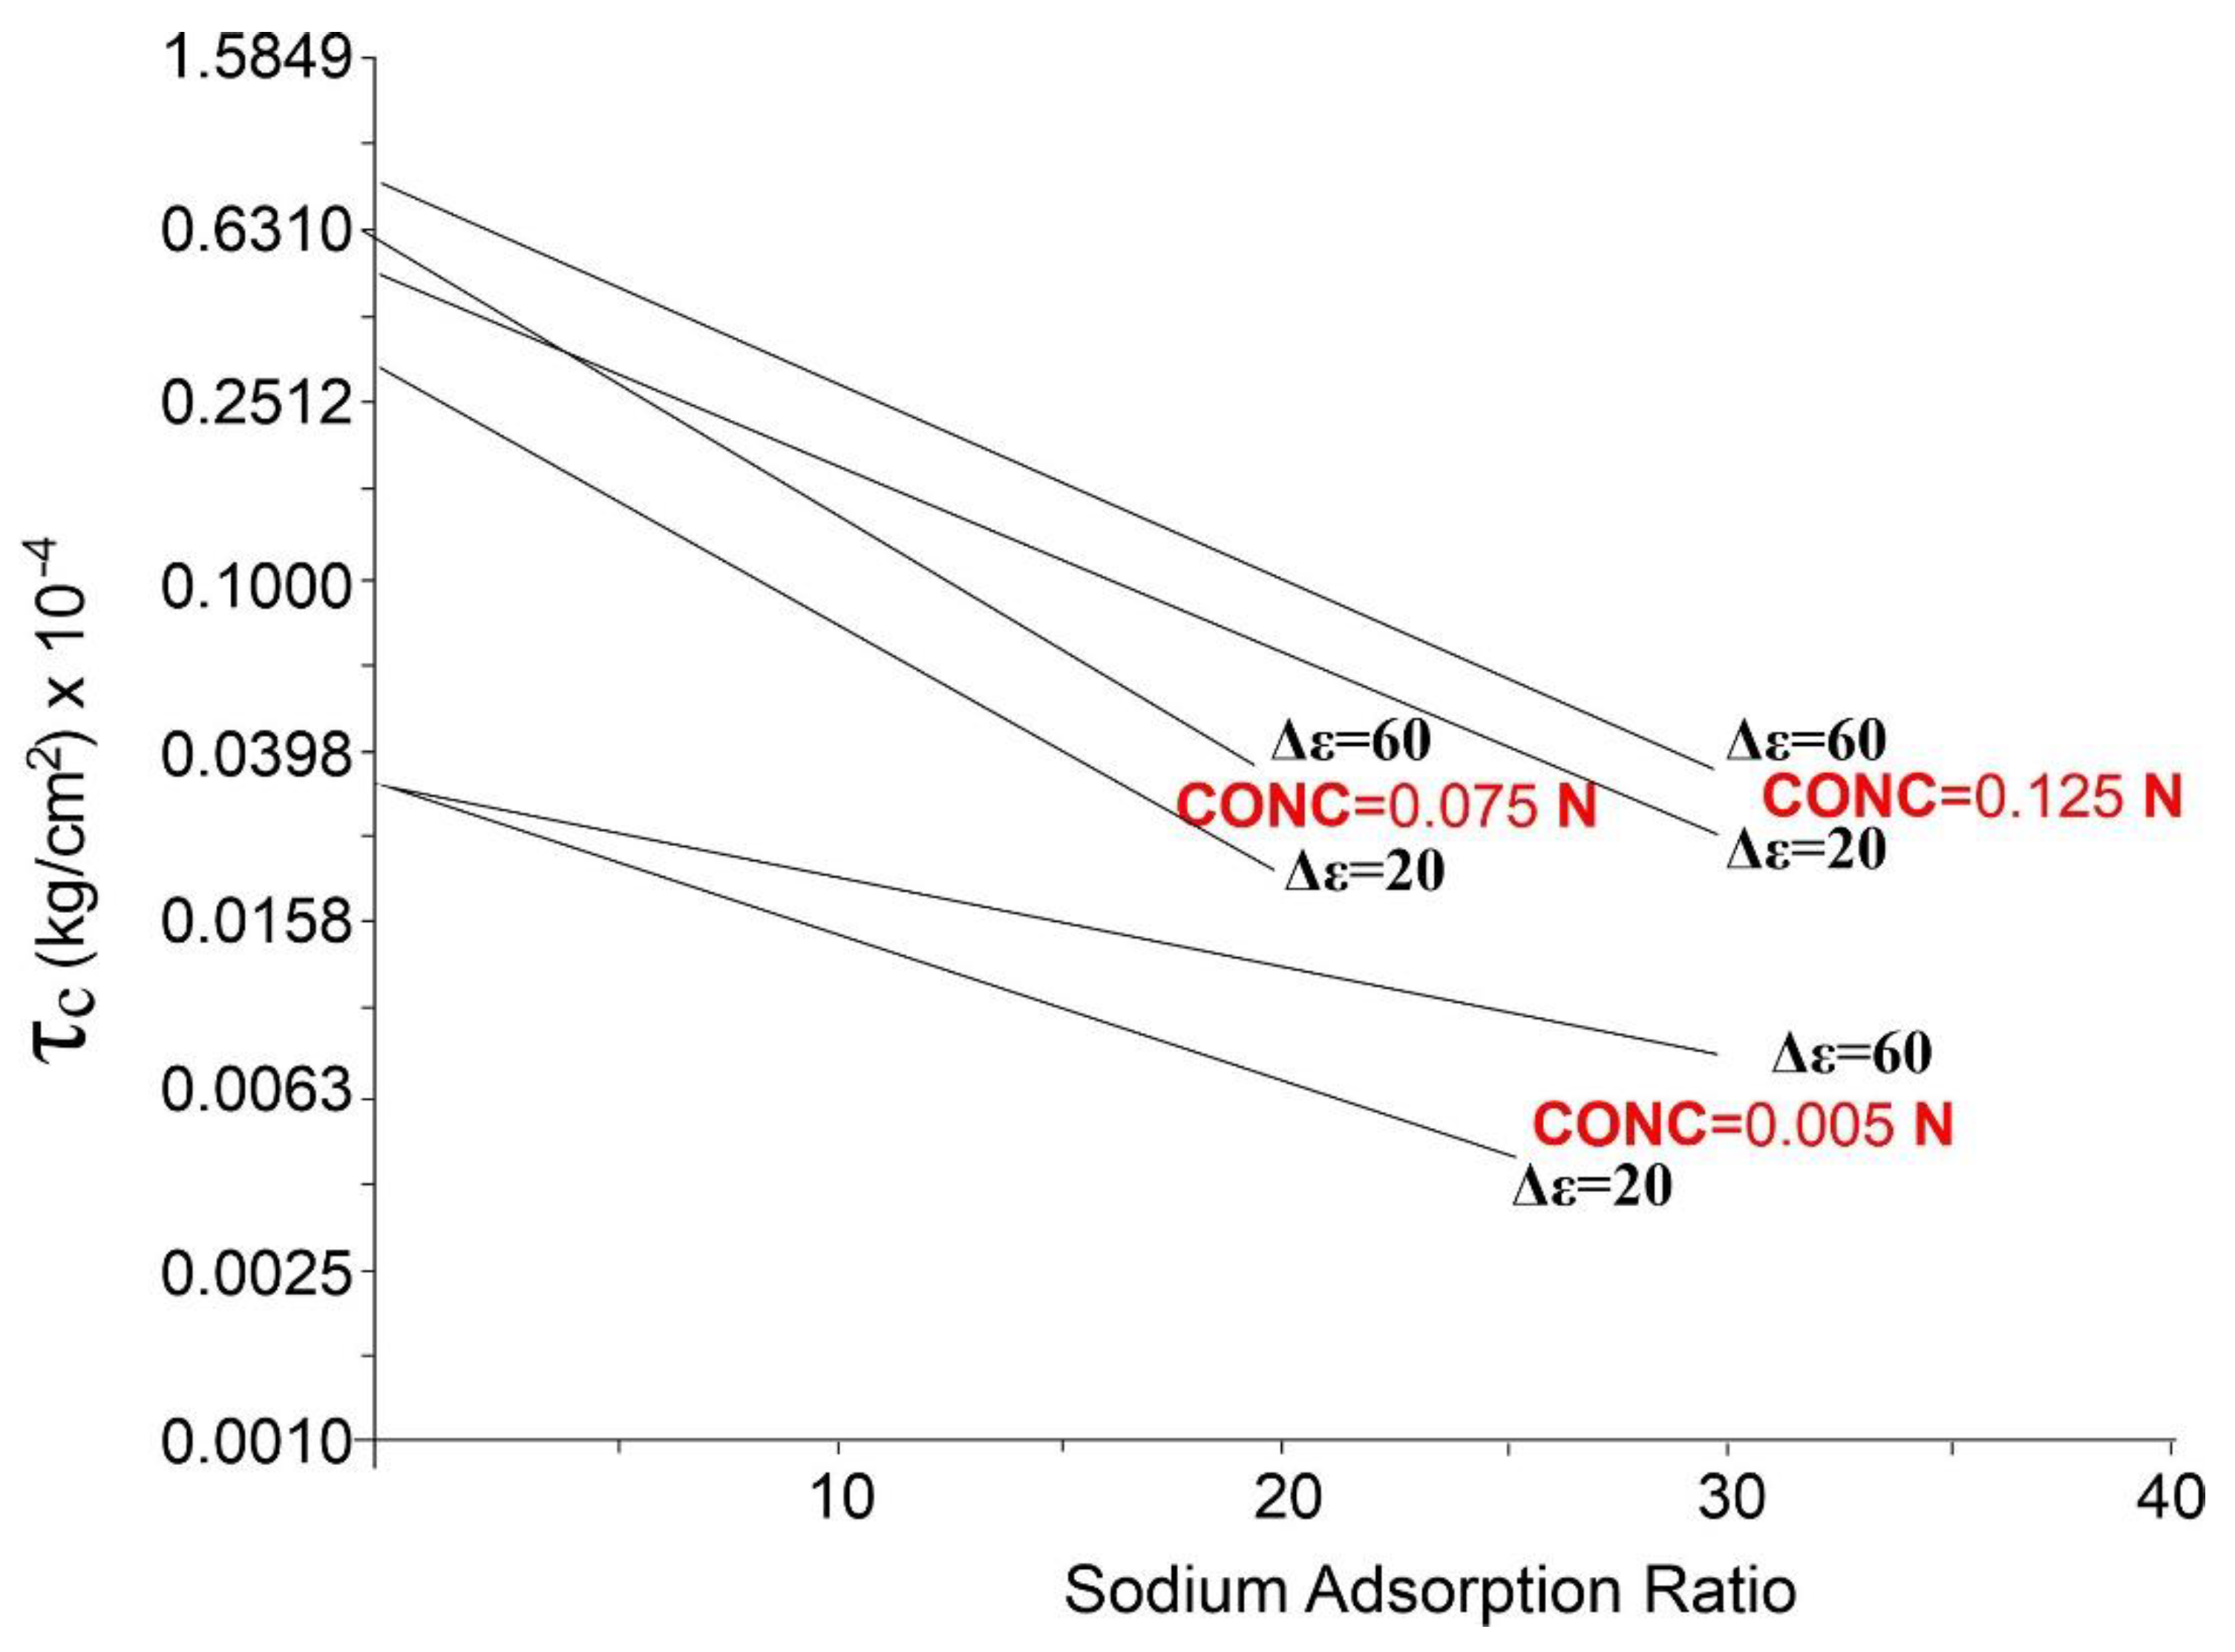
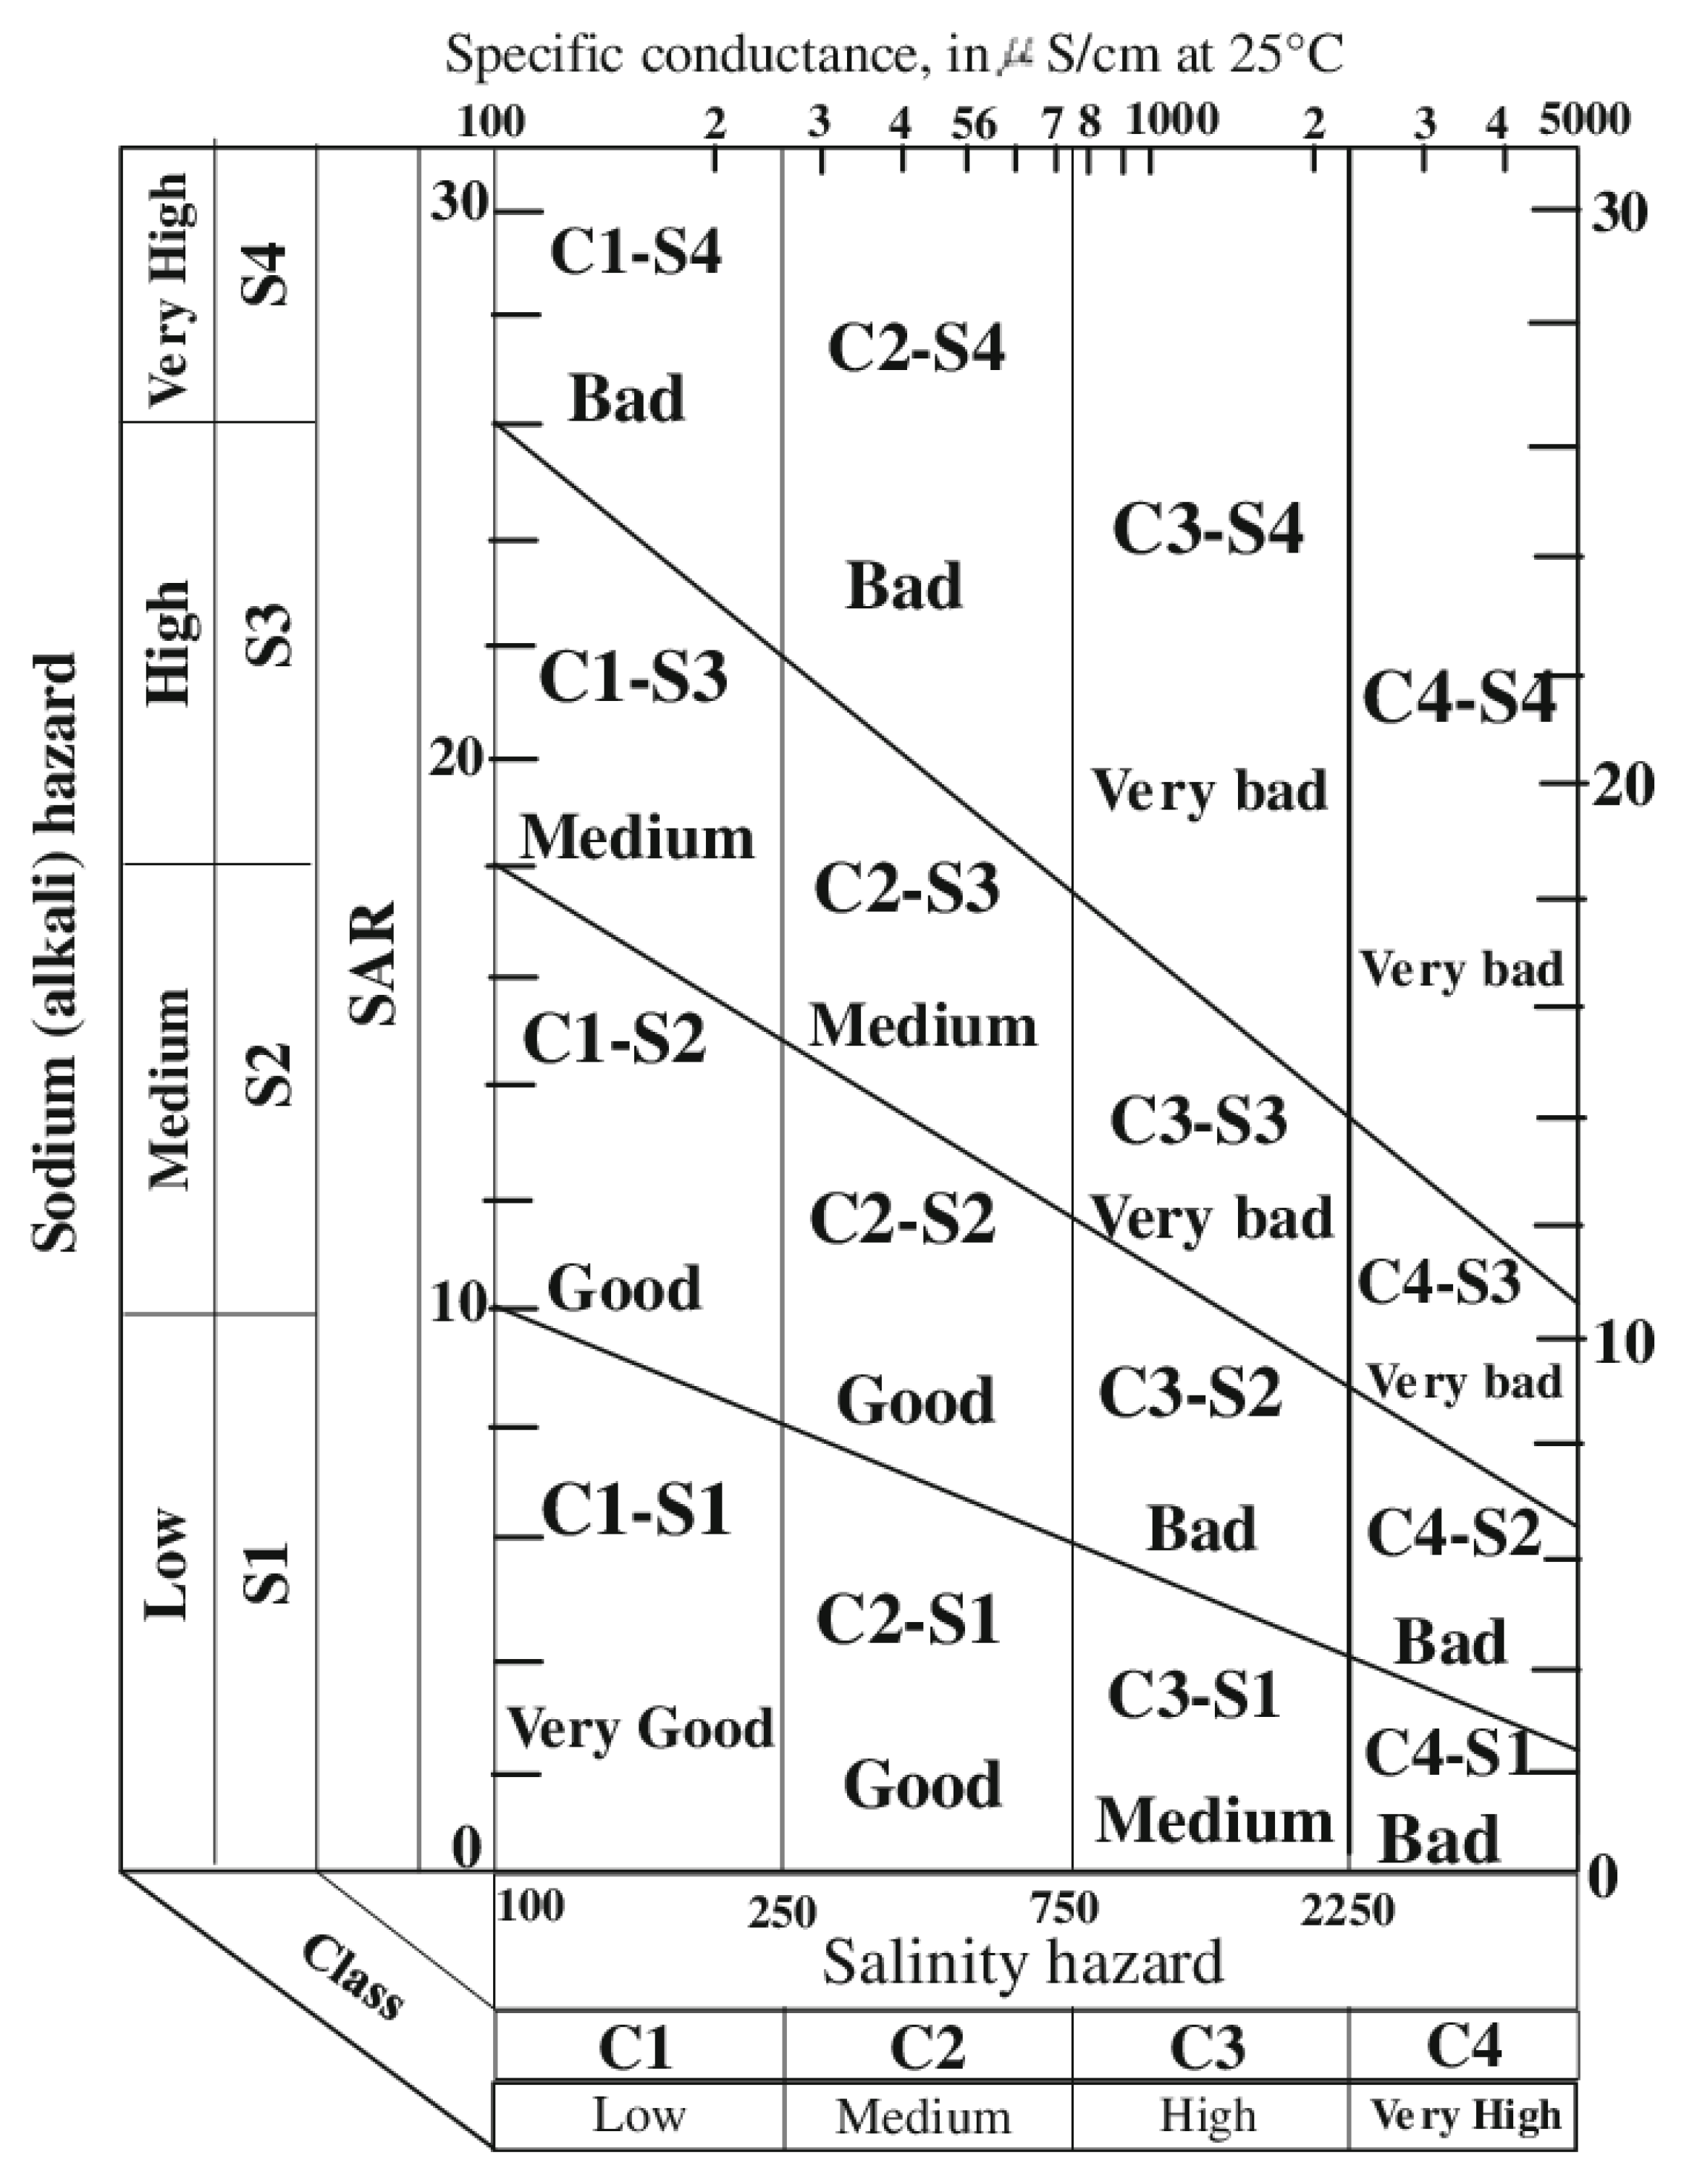
2.2.1. Sodium Absorption Ratio (SAR) and Soil Salt Concentration

For a given fluid shear stress, it has been demonstrated that the erosion rate depends largely on the physical and chemical characteristics of the soil, and the types and amounts of salts in the pore and eroding waters [52]. Increasing the clay content or decreasing sodium ions in the soil increases the shear resistance of the soil itself to erosion. On the other hand, reducing the clay content or the salt concentration in the eroding water decreases the soil’s shear resistance of the soil. Based on this it has been demonstrated that is possible to determine the critical shear stress τc for the undisturbed soil as a function of the Sodium Adsorption Ratio (SAR), the Soil Salt Concentration of water (often associated with the electrical conductivity) and, albeit to a lesser extent, by the Dielectric Dispersion Δε, defined as the range of variation of the dielectric constant of the soil measured between the frequencies of 1 and 100 MHz [38] (Figure 4).
The Sodium Adsorption Ratio is one of the most used parameters, especially in agriculture, for the definition of the degree of alkalization of the soil. It is calculated with the following formula:
S A R = N a + C a 2 + + M g 2 + 2 ,
where sodium, calcium, and magnesium concentrations are expressed in milliequivalents/liter.
The relationship between SAR and electrical conductivity, summarized in the Wilcox diagram (United States Salinity Laboratory, 1994), is mainly used to define water quality classes in relation to the possibility of use for irrigation purposes (Figure 5); however, as specified previously, the same relationship can be used to define waters that can affect the soil’s shear resistance to erosion.

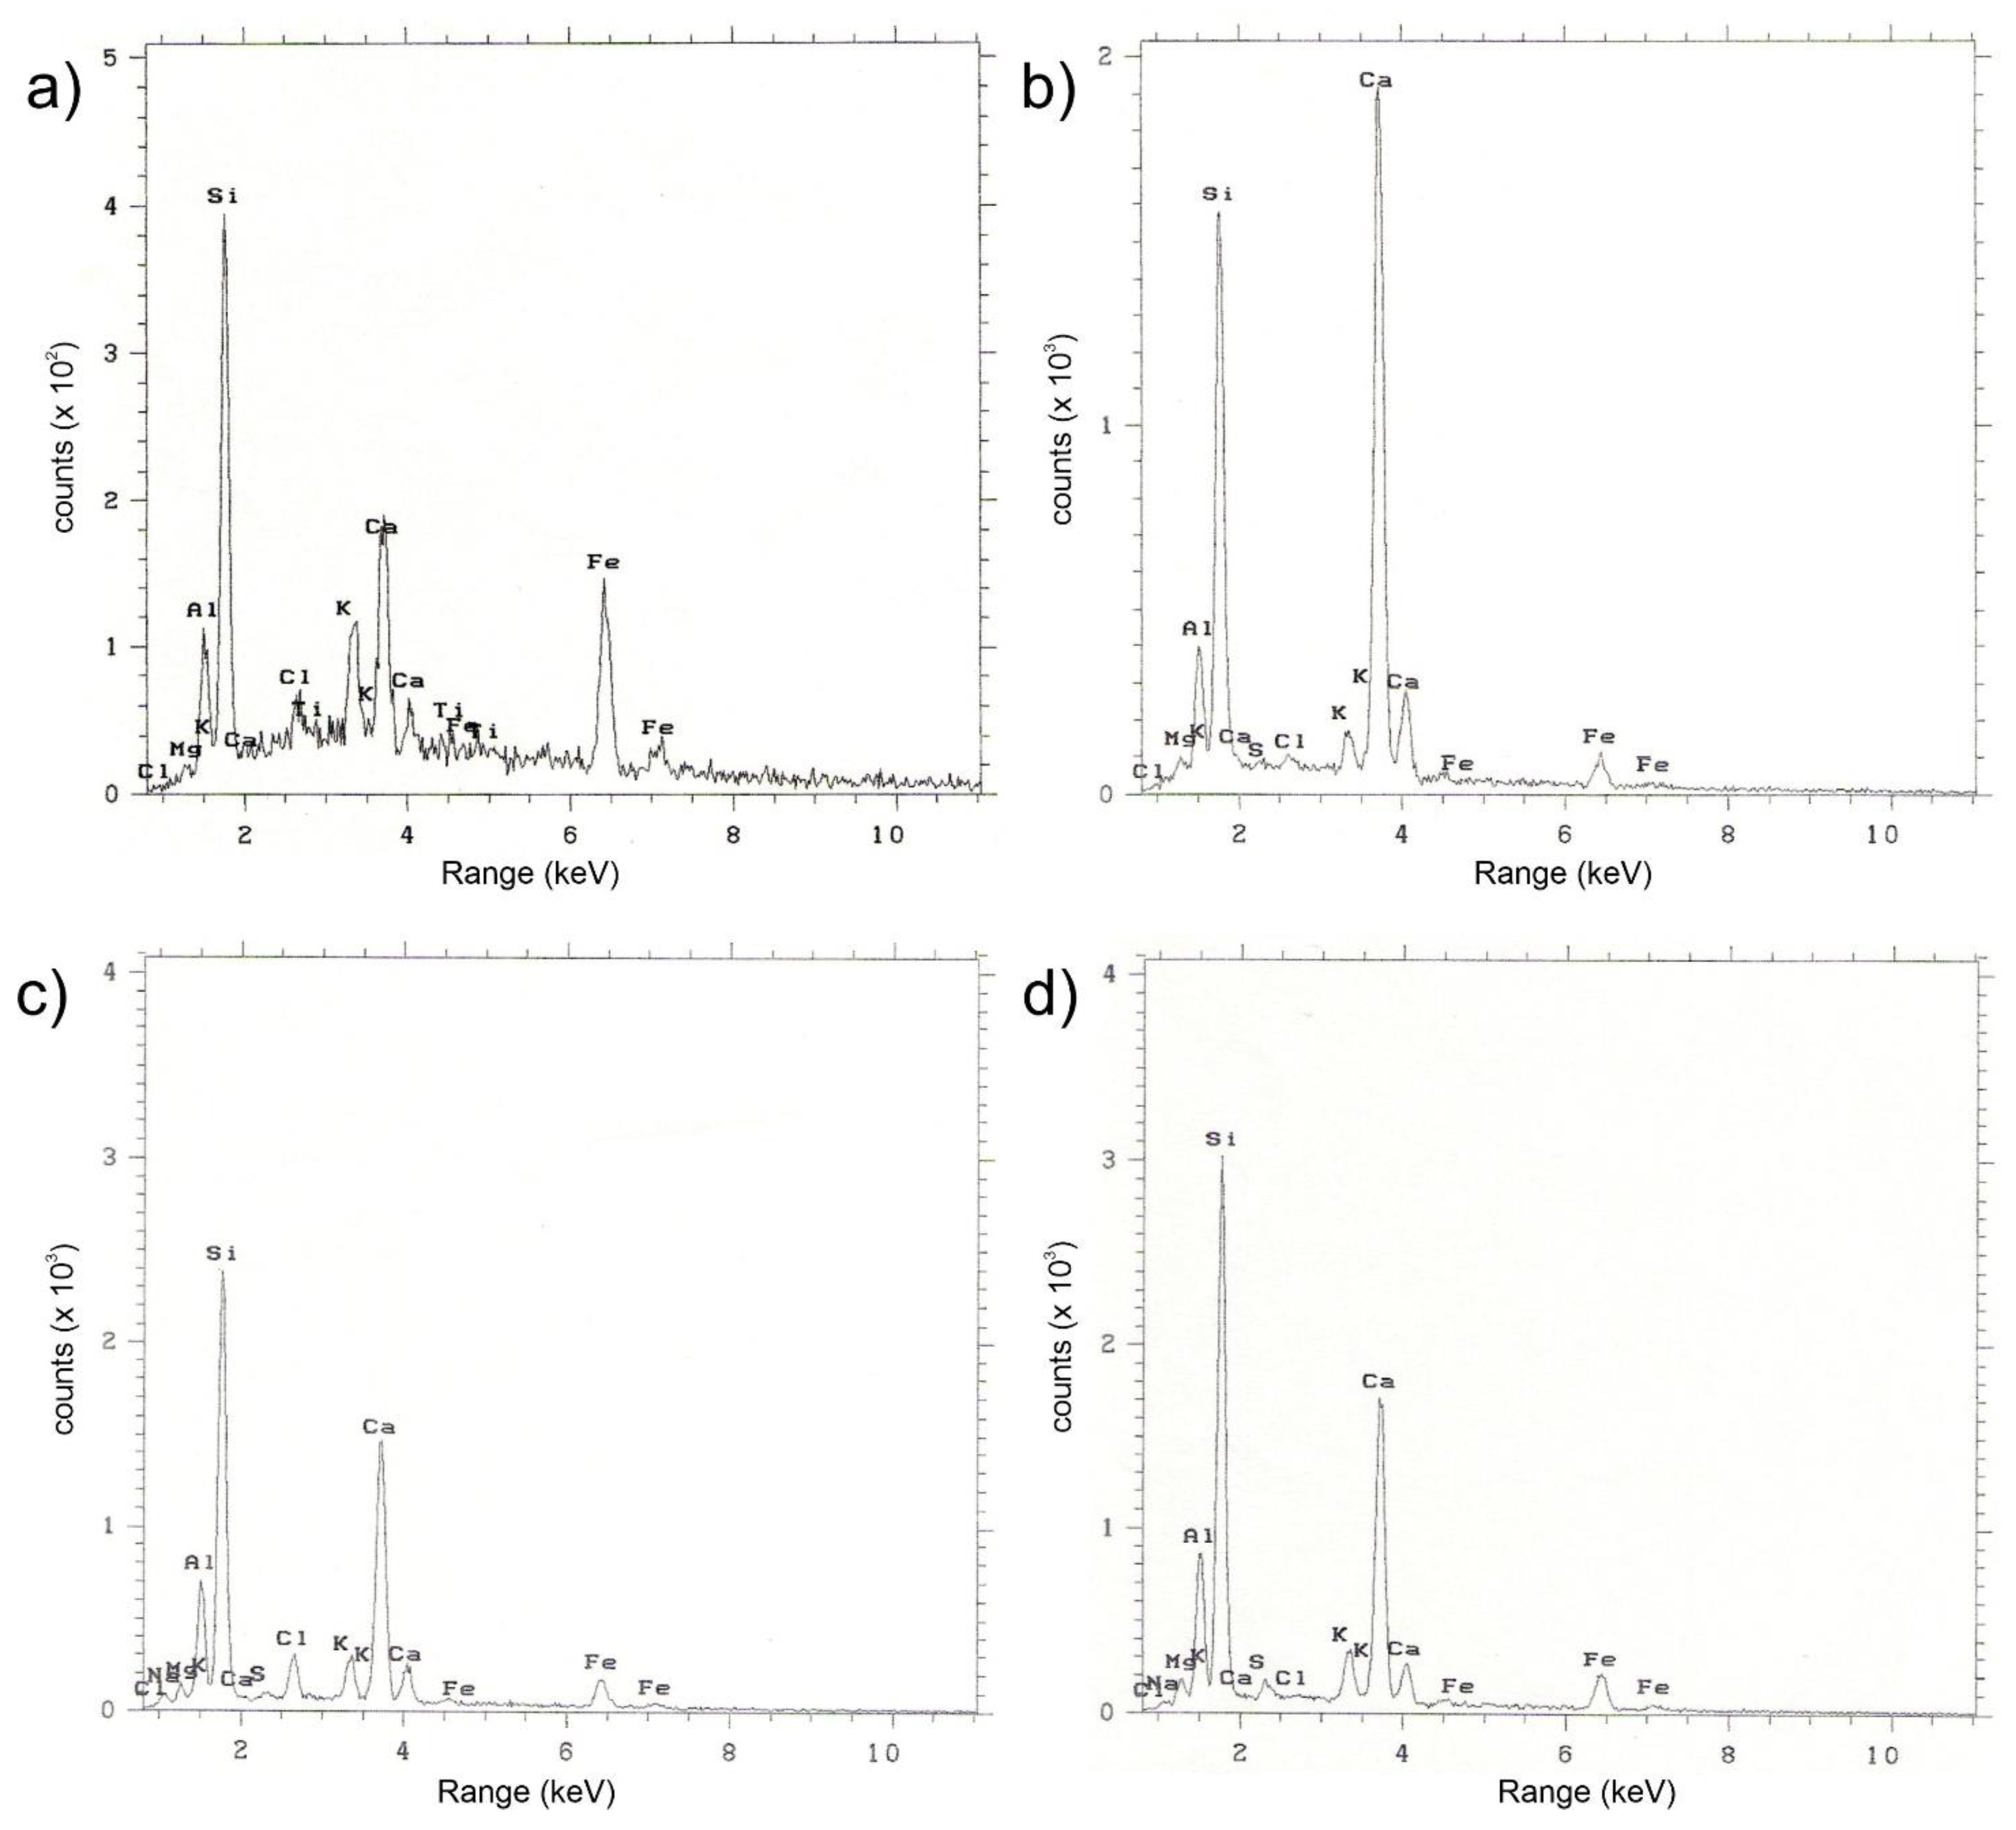
2.2.2. Scanning Electron Microscopy (SEM)

A Scanning Electron Microscope (SEM) is a type of electron microscope that produces images of a sample by scanning the surface with a focused beam of electrons. The electrons interact with atoms at various depths within the sample, producing various signals that contain information about the surface topography and composition of the sample itself. These signals include secondary electrons (electrons from the sample which have received sufficient energy from the incident beam to escape), backscattered electrons (electrons that return with attenuated energy to the signal detectors), X-rays (electromagnetic radiations which assume wavelength values λ generally between 0.1 and 100 Ǻ), photons emitted by cathodoluminescence (type of luminescence acquired by solids after the impact of electrons accelerated by an electric or magnetic field).
The signals collected are processed to obtain a 3D “topographic” image with a resolution of up to 25 Ǻ (2.5 μm). With a different elaboration, images with different average atomic numbers and therefore different chemical compositions can be obtained.
SEM analyses are usually carried out to detect any traces of polluting elements that cannot be detected with a typical diffractometric analysis and their possible crystalline aggregations in the samples; the limit of the analysis is the impossibility to ascertain the presence of organic molecules, often responsible for alterations in the structure of clay minerals; such evaluations can be carried out using infrared spectrography or transmission electron microscopes (TEM).
The study has been carried out on n.4 samples of material corresponding to the sites of Camerino (n.1 sample), Tolentino (n.2 samples), and Servigliano (n.1 samples).

2.2.3. Mineralogical Analyses

The mineralogical analyses were carried out on 12 samples of clayey bedrock taken upstream and downstream of the wastewater treatment plants. More specifically, X-ray diffraction analyses were performed on the clayey fraction passing through the ASTM 270 sieve (Ø 0.064 mm); in a first phase, slides were prepared on which a mixture of water and clay was decanted to obtain oriented samples (AON) and, consequently, a better resolution of the clay mineralogical component.
Following the instrumental setting used:
-
Wavelength: Kα of Copper (Cu)
-
2-theta angle: 2–60°
-
Angular velocity: 2°/min
-
Time constant = 2″
-
X-ray generator operating at 40 Kv × 20 mAR = 4 × 10²; from 2° to 35°)

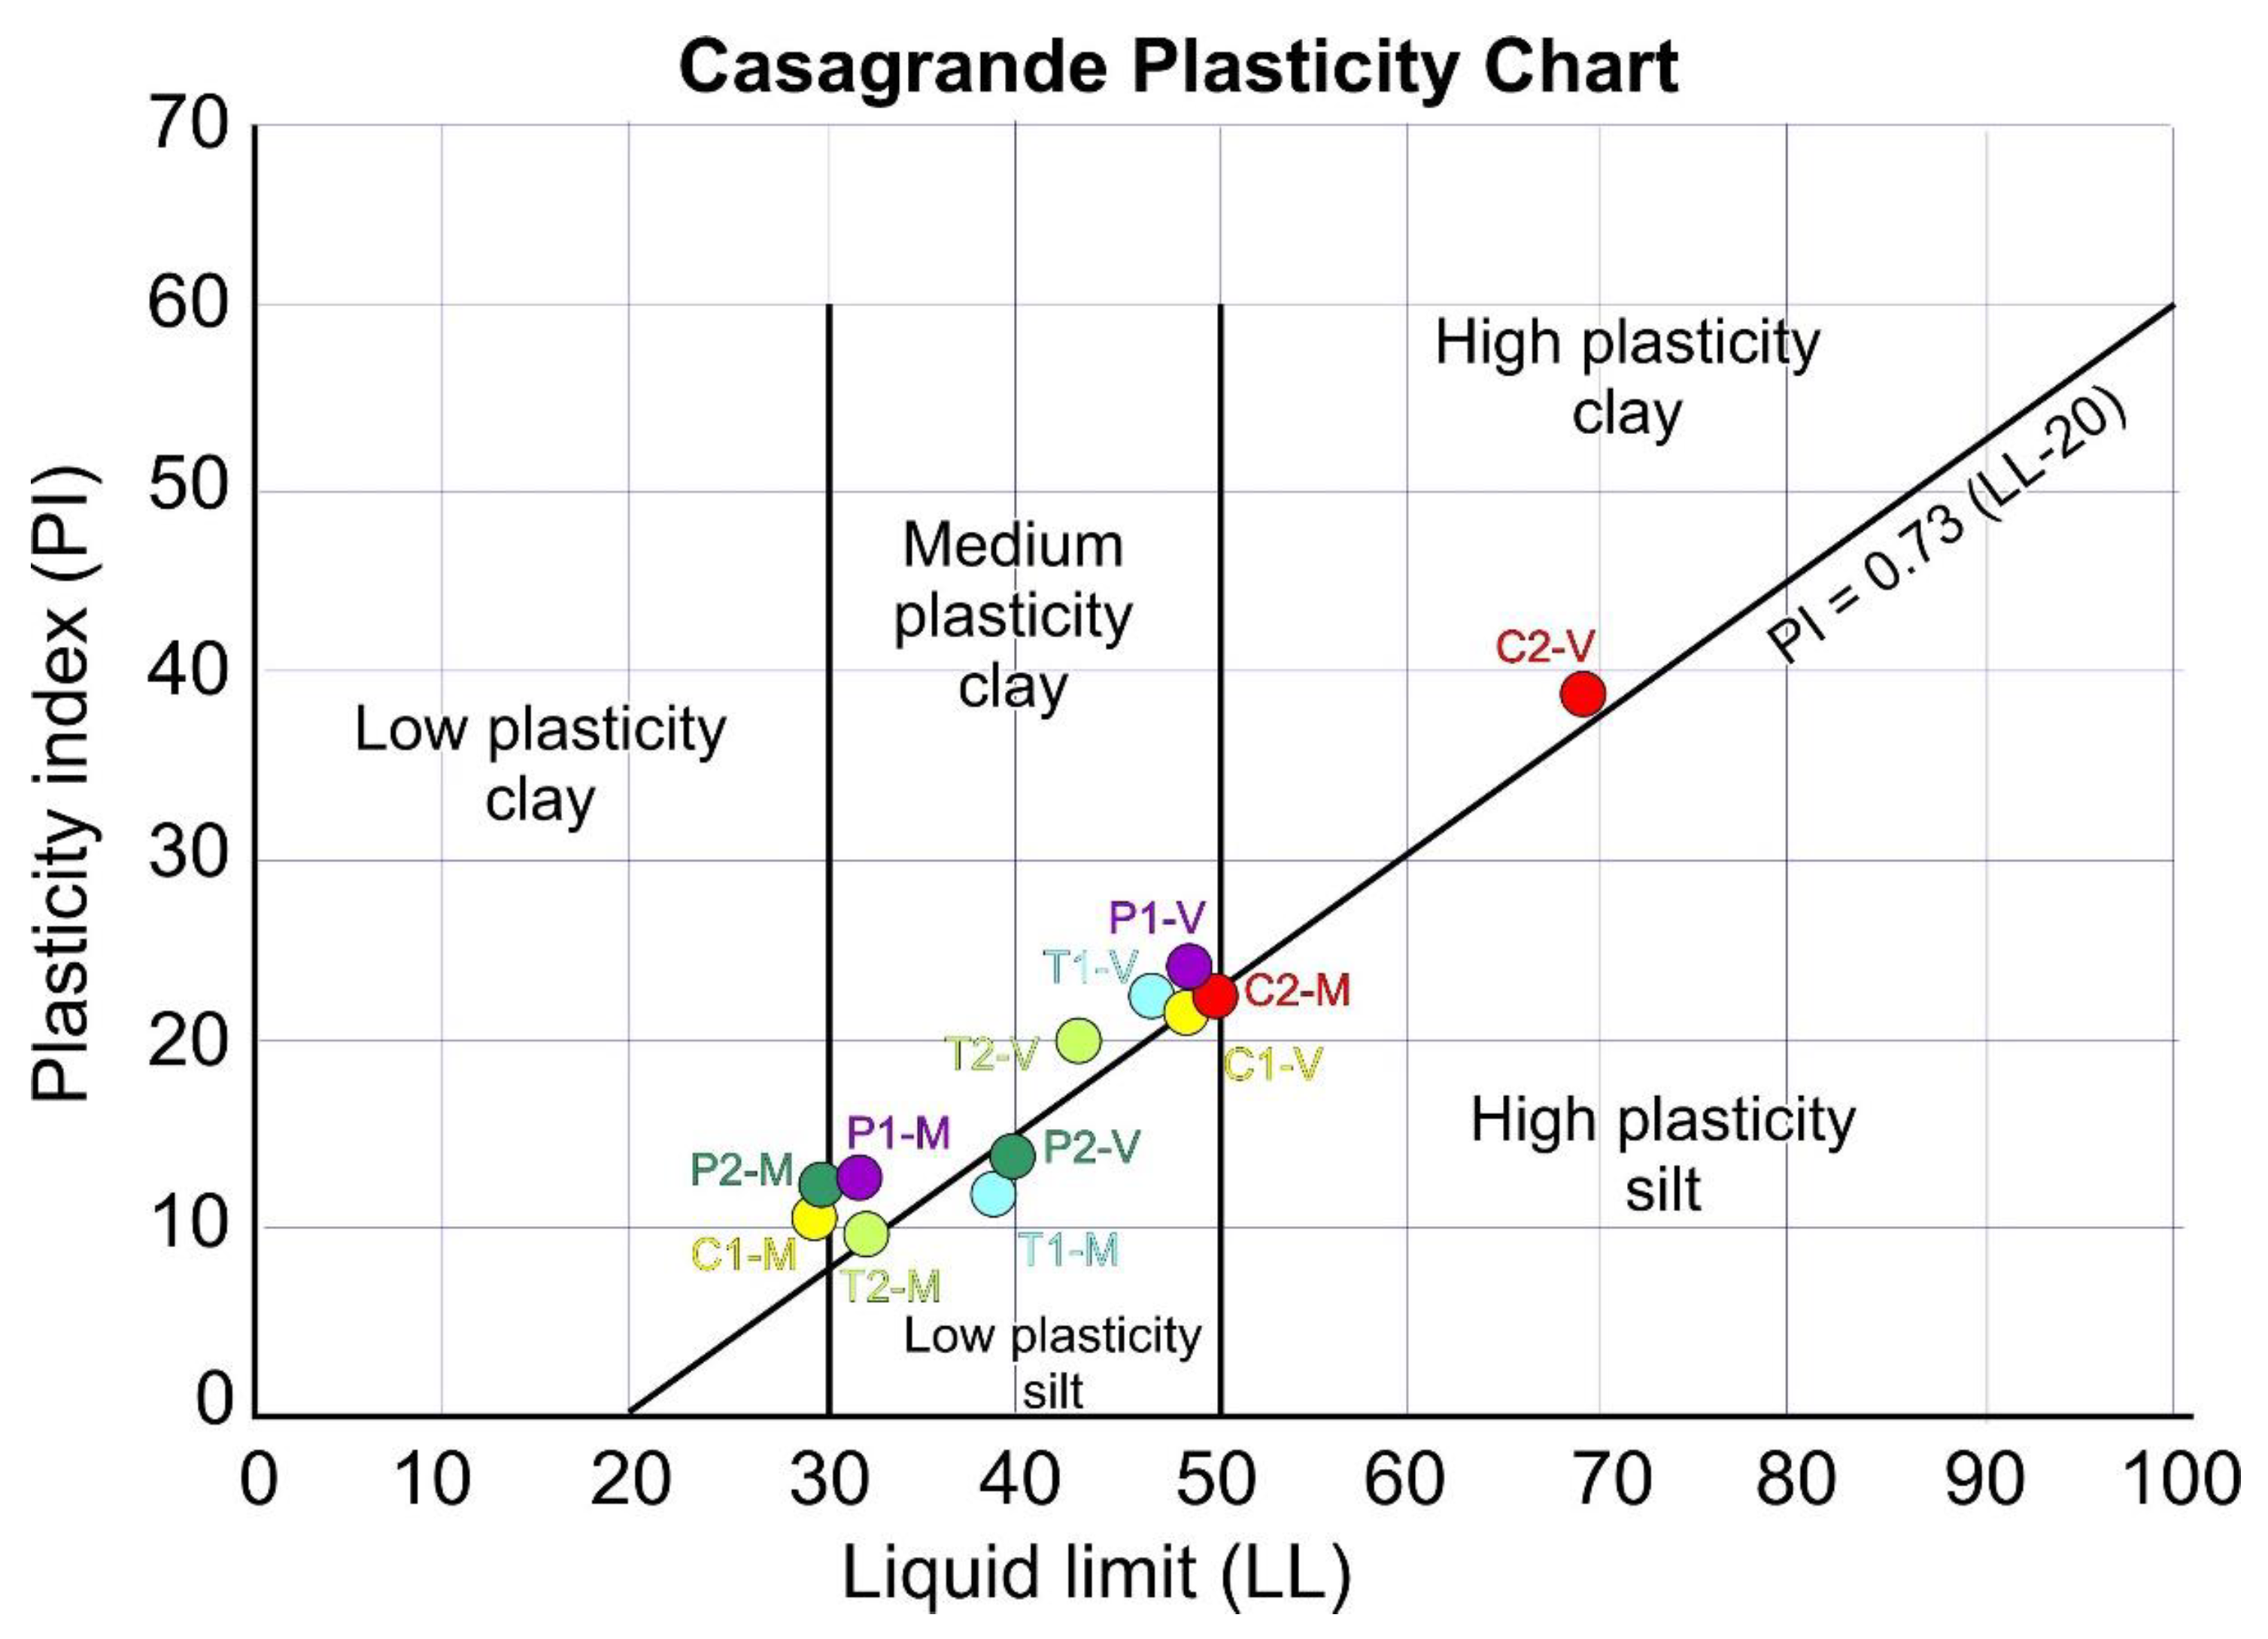
2.2.4. Geotechnical Analyses

A specific correlation between the index properties of clays—which link the water content of the soil with the consistency limits—and their shear strength [53,54] is well known in the literature. Among the consistency limits (or Atterberg Limits), which describe the critical passages of soil behavior, the following are usually considered:
-
the Liquid Limit (LL), defined as the water content at which the behavior of a clayey soil change from the plastic state to the liquid state;
-
the Plastic Limit (PL), which represents the minimum water content for which the soil can be plastically deformed without deformation;
-
the difference between the LL and the PL, called Plasticity Index (PI), which defines the size of the range of water contents where the soil exhibits plastic properties;
-
the Consistency Index (CI) calculated as CI = (LL − W)/(LL − PL) where W is the natural water content.
As in the previous cases, 12 samples taken from the Potenza, Chienti, and Tenna sample sites were subjected to geotechnical analysis by certified laboratories.

3. Results

3.1. Chemical Analyses and SAR Evaluation

The results of the chemical analyses are shown in Table 1. Concerning the water samples, they were classified with an initial code (i.e., P1) which identifies the water treatment plants in which the sample was taken (shown in Figure 1), followed by the letter M or V which characterizes the sample taken respectively upstream and downstream of the plant itself.
As can be seen from the table, all the samples identify predominantly bicarbonate-calcium waters with a variable sulfate content and a weakly alkaline pH; this composition is closely linked to the lithological characteristics of bedrock.
As far as the search for possible pollutants of anthropic origin is concerned, all the samples show medium-low levels of nitrates, probably associated with agricultural practices, while only some have highlighted the presence of nitrites, also probably linked to agriculture or the presence of industrial settlements. Other typical polluting elements such as cyanides and ammonia were found to be absent while minimal concentrations of phosphates were found in the samples of Tolentino (C2) both upstream and downstream of the water treatment plant.
As for the SAR (Sodium Adsorption Ratio) by examining the graph in Figure 6, it can be noted that almost all the samples analyzed fall within the C2S1 range, characterized by medium salinity water and low sodium content, except for the sample taken at the Amandola site (T2) which falls within the C3S1 field due to the higher value of the electrical conductivity.
The values obtained show a moderate degree of alkalization, remaining within a field that defines good quality waters for agricultural use; only the samples taken at site T2 are indicative of medium-quality water. In all samples, however, the increase in the SAR and the E.C. moving from upstream to downstream of the water treatment plant reflect the influence of the latter on the degree of alkalization of the water.

3.2. Mineralogical, Geotechnical and SEM Analyses

The results of the mineralogical analyses are shown in Figure 7; each graph displays, for every site, the diffractograms relating to the samples taken upstream and downstream of the plant. From the analysis of the diffractograms, it was possible to identify both the clay minerals and the inert elements present.
The above analyses allowed us to highlight a substantial mineralogical uniformity of the samples and to ascertain, in all of them, the presence of minerals of quartz, calcite, felspar (mostly plagioclase), and dolomite (the latter in quite variable proportion). Among the clay minerals, on the other hand, the percentages of illite, chlorite, smectite, and interstratified minerals (smectite-illite, chlorite-kaolinite, or illite-montmorillonite type) stand out.
From the comparison between the samples taken upstream and downstream of the plants, a clear decreasing tendency of feldspar and dolomite in the downstream sample emerges; the variation of quartz and calcite is generally less significant, although more evident variations are observed in samples P2 and C2.
More relevant are the changes in clay minerals, visible in all samples except for those of San Severino Marche (P2) and, to a lesser extent, Camerino (C1); in particular, in the downstream samples, a clear increase in the content of smectite and interstratified minerals (smectite-illite or illite-montmorillonite type at the expense of chlorite-kaolinite) can be noted; similarly, both the content of calcite and quartz seem to decrease significantly. These variations are evident in the Tolentino site (C2): here, not only do the terms of smectite increase considerably from upstream to downstream but a transformation of the term illite → interstratified → smectite can be observed.
Concerning the geotechnical analyses, the results are shown in Table 2. The differences between the samples taken upstream and downstream of the water treatment plants are quite evident. Firstly, in the downstream samples, it is possible to note an increase, albeit not marked, in the natural water content (except for site C2 where the value remains almost constant). The increases in the liquid limit (LL) and especially the plastic limit (PL) are much more evident and significant; the difference between these two indices constitutes the plasticity index (PI) which likewise tends to increase in the samples taken downstream of the plants.
The above results were also displayed, for better clarity, in the Casagrande Plasticity Chart (Figure 8) that relates the Plasticity index (PI) and Liquid limit (LL) for all the samples analyzed.
In this case, the tendency toward a greater degree of plasticity for all the samples placed downstream of the water treatment plants is evident (even notable in the case of the Tolentino—C2 site).
The SEM analyses, as mentioned, were carried out to detect any traces of polluting elements and their possible crystalline aggregations in the samples.
Two different types of analyses have been carried out; a “punctual” analysis to identify the minerals present in the sample and an “areal” analysis (conducted with a variable magnification between 25× and 30×) to define the type and relationship between the chemical elements present.
The results of the analyses, however, did not show differences between the samples taken upstream and downstream of the water treatment plants, although in almost all the samples significant quantities of chlorine, usually associated with the presence of pollutants of industrial origin, were also found (Figure 9).

4. Discussion

The chemical and physical equilibrium of the water environment is important not only for the direct effect on human health but also for the less evident impact on the natural system. The example of aqueous solutions that interact with the adsorbent material, both organic and inorganic, which adsorbs a part of the solids in solution is well known in the literature [55]. This adsorption is due not only to the physical attraction between two solid particles but also to the electrostatic attraction of two opposite electric charges (selective or chemical adsorption); in the second context the ions are not only adsorbed on the surface of the mineral, but some of them can enter the crystalline lattice, through the process of ion exchange.
The analyses carried out in the six sample sites provide important confirmations of these hypotheses. Clay minerals in the presence of “polluting” substances undergo a modification in the lamellar structures, reflecting a well-known phenomenon in literature [39]. In the latter case the “polluting” elements, whether they are simple ions, inorganic salts or organic acids, surfactant-type molecules, or aromatic molecules, can penetrate the lamellar structures and determine an increase in the basal spacing. In the sample sites analyzed, the breaking of the ionic bonds would be favored especially by the illite-montmorillonite-smectite transition at the expense of clayey minerals of the illite and chloritic-kaolinite type. The variation in the size of clayey minerals causes significant imbalances in the shape of the meniscus which is closely linked to the surface tension forces and therefore to the cohesion of the material. This aspect would be confirmed by the geotechnical analyses (direct connection with the Atterberg limits) and specifically in the general increase, in all the samples, of the Plasticity index (PI); a variation of the strength parameters and in particular a decrease of the critical shear stress τc (as described in the Section 2.2.1 and shown in Figure 4) would also be induced by the raise in the SAR index and, in general, by the increase in soil salt concentration.
The above-described phenomena would consequently allow easier and more effective aggression of the clayey bedrock by the fluvial erosive processes together with the greater propensity of these clayey minerals to cracking and degradation phenomena following the seasonal cycles of drying and humidification.
The results obtained, however, must be treated with care. In the first place, the number of sites analyzed, linked as mentioned to the difficulty encountered in sampling, represents, from a statistical point of view, an objective limit: the study, therefore, will only have a more significant value if analyses are conducted in the future on a higher number of sites in similar geomorphological–lithological conditions. Secondly the extent of the variations observed can justify the process but not the phenomenon as a whole; the deepening processes visible along the riverbeds, as mentioned, are largely a direct consequence of the human interventions that have taken place over the years. However, in particularly degraded environments, the role of pollution could assume a more significant weight.

5. Conclusions

The present study, carried out on some river reaches deepened on clayey bedrock and where water treatment plants are present, highlights the undoubted active role played by “polluting” substances in the modification of the crystalline lattice of clayey minerals and in general of the strength parameters of the bedrock itself. Although it is universally accepted that in industrialized countries the deepening processes along the riverbeds over the last decades are mainly linked to human interventions (in-stream gravel mining activities, artificial reservoirs, and dams that interrupt the continuity of solid transport, etc.) the role of soil chemical degradation processes is often underestimated.
The analyses carried out allowed to verify that the presence of “polluting” substances within treated waters that circulate inside clayey bedrocks can produce modifications of the crystalline lattice by increasing the basal spacing between the lamellar structures; this phenomenon favors the breaking of the ionic bonds and a general decrease of the strength parameters of the bedrock; from a geotechnical point of view, these mineralogical variations determine an increase in the limits of consistency and in particular in the Plasticity index (PI), making the clayey bedrock, eventually outcropping within a riverbed, more subject to deepening phenomena.
-
SAR analyses provided results in line with those geotechnical; although the variations observed are less consistent in absolute terms, they nonetheless show a positive trend proceeding from upstream to downstream in all the sites analyzed. This fact confirms that the increase in salt concentration can also affect the soil’s shear resistance to erosion.
-
The SEM analyses were found to be of little significance; carried out above all to detect any traces of polluting elements and their possible crystalline aggregations in the samples, however, they did not show particular variations except for the presence of significant quantities of chlorine, usually associated with the presence of pollutants of industrial origin.
Taking into account the relative impact of the single water treatment plant on the surrounding environment, these processes should be carefully evaluated in the presence of landfills or important production sites, where the quantities and concentration of pollutants can reach significant levels. Although tested in a “local” context, the study certainly has great potential and can be a guide for future research in any territorial context characterized by the presence of clayey bedrock.

Author Contributions

Conceptualization, M.B. and M.M.; methodology, M.B. and M.M.; software, M.M.; validation, D.A., F.B., P.F., G.P. and F.L.; formal analysis, M.M.; resources, M.B., P.F., M.G. and C.M.; data curation, M.M.; writing—original draft preparation, M.B. and M.M.; writing—review and editing, M.M. and M.B.; visualization, G.P. and M.G.; supervision, C.M., G.P., M.M. and M.B. All authors have read and agreed to the published version of the manuscript.

Funding

This research received no external funding.

Institutional Review Board Statement

Not applicable.

Informed Consent Statement

Not applicable.

Data Availability Statement

The data that support the findings of this study are available on request from the corresponding author. The data are not publicly available due to privacy or ethical restrictions. All data processing necessary to produce the maps was performed using ESRI-ArcGisPRO 2.8. The Figures in the document were created using CorelDraw Home&Student 2019.

Conflicts of Interest

The authors declare no conflict of interest.

References

  1. Preece, R.C.; Bridgland, D.R. Holywell Coombe, Folkestone: A 13,000 year history of an English Chalkland Valley. Quat. Sci. Rev. 1999, 18, 1075–1125. [Google Scholar] [CrossRef]
  2. Brocard, G.Y.; van der Beek, P.A.; Bourlès, D.L.; Siame, L.L.; Mugnier, J.L. Long-term fluvial incision rates and postglacial river relaxation time in the French Western Alps from 10Be dating of alluvial terraces with assessment of inheritance, soil development and wind ablation effects. Earth Planet. Sci. Lett. 2003, 209, 197–214. [Google Scholar] [CrossRef] [Green Version]
  3. Schumm, S.A. River response to baselevel change: Implications for sequence stratigraphy. J. Geol. 1993, 101, 279–294. [Google Scholar] [CrossRef]
  4. Holbrook, J.; Scott, R.W.; Oboh-Ikuenobe, F.E. Base-level buffers and buttresses: A model for upstream versus downstream control on fluvial geometry and architecture within sequences. J. Sediment. Res. 2006, 76, 162–174. [Google Scholar] [CrossRef] [Green Version]
  5. Merritts, D.J.; Vincent, K.R.; Wohl, E.E. Long river profiles, tectonism, and eustasy: A guide to interpreting fluvial terraces. J. Geophys. Res. 1994, 99, 14031–14050. [Google Scholar] [CrossRef]
  6. Schumm, S.A.; Dumont, J.F.; Holbrook, J.M. Active Tectonics and Alluvial Rivers; Cambridge University Press: Cambridge, UK, 2000; p. 276. [Google Scholar]
  7. Surian, N.; Rinaldi, M. Morphological response to river engineering and management in alluvial channels in Italy. Geomorphology 2003, 50, 307–326. [Google Scholar] [CrossRef]
  8. Buccolini, M.; Gentili, B.; Materazzi, M.; Aringoli, D.; Pambianchi, G.; Piacentini, T. Human impact and slope dynamics evolutionary trends in the monoclinal relief of Adriatic area of central Italy. Catena 2007, 71, 96–109. [Google Scholar] [CrossRef]
  9. Aringoli, D.; Buccolini, M.; Coco, L.; Dramis, F.; Farabollini, P.; Gentili, B.; Giacopetti, M.; Materazzi, M.; Pambianchi, G. The effects of in-stream gravel mining on river incision: An example from Central Adriatic Italy. Zeitschrift Geomorphol. 2015, 59, 95–107. [Google Scholar] [CrossRef]
  10. Collier, M.; Webb, R.H.; Schmidt, J.C. Dams and Rivers: A Primer on the Downstream Effects of Dams; US Department of the Interior: Washington, DC, USA, 1996. [Google Scholar]
  11. Petit, F.; Poinsart, D.; Bravard, J.P. Channel incision, gravel mining and bedload transport in the Rhône river upstream of Lyon, France (“canal de Miribel”). CATENA 1996, 26, 209–226. [Google Scholar] [CrossRef]
  12. Kondolf, G.M. Hungry water: Effects of dams and gravel mining on river channels. Environ. Manage. 1997, 21, 533–551. [Google Scholar] [CrossRef]
  13. García-Ruiz, J.M.; Valero-Garcés, B.L. Historical Geomorphic Processes and Human Activities in the Central Spanish Pyrenees. Mt. Res. Dev. 1998, 18, 309–320. [Google Scholar] [CrossRef]
  14. Hudson, P.F.; Kesel, R.H. Channel migration and meander-bend curvature in the lower Mississippi River prior to major human modification. Geology 2000, 28, 531–534. [Google Scholar] [CrossRef]
  15. Hudson, P.F.; Middelkoop, H.; Stouthamer, E. Flood management along the Lower Mississippi and Rhine Rivers (The Netherlands) and the continuum of geomorphic adjustment. Geomorphology 2008, 101, 209–236. [Google Scholar] [CrossRef]
  16. Leopold, L.B. River Channel Change with Time: An Example: Address as Retiring President of The Geological Society of America, Minneapolis, Minnesota, November 1972. GSA Bull. 1973, 84, 1845–1860. [Google Scholar] [CrossRef]
  17. Gregory, K.J.; Park, C. Adjustment of river channel capacity downstream from a reservoir. Water Resour. Res. 1974, 10, 870–873. [Google Scholar] [CrossRef]
  18. Williams, G.P. The Case of the Shrinking Channels: The North Platte and Platte Rivers in Nebraska; US Department of the Interior: Washington, DC, USA, 1978. [Google Scholar]
  19. Petts, G.E. Complex response of river channel morphology subsequent to reservoir construction. Prog. Phys. Geogr. Earth Environ. 1979, 3, 329–362. [Google Scholar] [CrossRef]
  20. Williams, G.P.; Wolman, M.G. Downstream Effects of Dams on Alluvial Rivers; US Government Printing Office: Washington, DC, USA, 1984. [Google Scholar]
  21. Andrews, E.D. Downstream effects of Flaming Gorge Reservoir on the Green River, Colorado and Utah. GSA Bull. 1986, 97, 1012–1023. [Google Scholar] [CrossRef]
  22. Knighton, A.D. Channel bed adjustment along mine-affected rivers of northeast Tasmania. Geomorphology 1991, 4, 205–219. [Google Scholar] [CrossRef]
  23. Buccolini, M.; Gentili, B.; Materazzi, M.; Piacentini, T. Late Quaternary geomorphological evolution and erosion rates in the clayey peri-Adriatic belt (central Italy). Geomorphology 2010, 116, 145–161. [Google Scholar] [CrossRef]
  24. Materazzi, M.; Gentili, B.; Aringoli, D.; Farabollini, P.; Pambianchi, G. Elements of slope and fluvial dynamics as evidence of late holocene climatic fluctuations in the central adriatic sector, Italy. Geogr. Fis. Din. Quat. 2010, 33, 193–204. [Google Scholar]
  25. Bravard, J.P.; Amoros, C.; Pautou, G.; Bornette, G.; Bournaud, M.; Creuze Des Chatelliers, M.; Gibert, J.; Peiry, G.L.; Perrin, O.; Tachet, H. River incision in south-east France morphological phenomena and ecological effects. Regul. Rivers Res. Manag. 1997, 13, 75–90. [Google Scholar] [CrossRef]
  26. Brown, A.V.; Lyttle, M.M.; Brown, K.B. Impacts of Gravel Mining on Gravel Bed Streams. Trans. Am. Fish. Soc. 1998, 127, 979–994. [Google Scholar] [CrossRef]
  27. Marchetti, M. Environmental changes in the central Po Plain (northern Italy) due to fluvial modifications and anthropogenic activities. Geomorphology 2002, 44, 361–373. [Google Scholar] [CrossRef]
  28. Simon, A.; Rinaldi, M. Disturbance, stream incision, and channel evolution: The roles of excess transport capacity and boundary materials in controlling channel response. Geomorphology 2006, 79, 361–383. [Google Scholar] [CrossRef]
  29. Mossa, J.; Marks, S.R. Pit Avulsions and Planform Change on a Mined River Floodplain: Tangipahoa River, Louisiana. Phys. Geogr. 2011, 32, 512–532. [Google Scholar] [CrossRef]
  30. Alighalehbabakhani, F.; Miller, C.J.; Selegean, J.P.; Barkach, J.; Sadatiyan Abkenar, S.M.; Dahl, T.; Baskaran, M. Estimates of sediment trapping rates for two reservoirs in the Lake Erie watershed: Past and present scenarios. J. Hydrol. 2017, 544, 147–155. [Google Scholar] [CrossRef]
  31. Mekonnen, M.; Keesstra, S.D.; Baartman, J.E.; Ritsema, C.J.; Melesse, A.M. Evaluating sediment storage dams: Structural off-site sediment trapping measures in northwest ethiopia. Cuad. Investig. Geográfica 2015, 41, 7–22. [Google Scholar] [CrossRef] [Green Version]
  32. Issa, I.E.; Al-ansari, N.; Knutsson, S.; Sherwany, G. Monitoring and Evaluating the Sedimentation Process in Mosul Dam Reservoir Using Trap Efficiency Approaches. Engineering 2015, 7, 190–202. [Google Scholar] [CrossRef] [Green Version]
  33. Kummu, M.; Lu, X.X.; Wang, J.J.; Varis, O. Geomorphology Basin-wide sediment trapping ef fi ciency of emerging reservoirs along the Mekong. Geomorphology 2010, 119, 181–197. [Google Scholar] [CrossRef]
  34. Mulu, A.; Dwarakish, G.S. Different Approach for Using Trap Efficiency for Estimation of Reservoir Sedimentation. An Overview. Aquat. Procedia 2015, 4, 847–852. [Google Scholar] [CrossRef]
  35. Yang, X.; Lu, X.X. Geomorphology Estimate of cumulative sediment trapping by multiple reservoirs in large river basins: An example of the Yangtze River basin. Geomorphology 2014, 227, 49–59. [Google Scholar] [CrossRef]
  36. Conoscenti, C.; Martinello, C.; Alfonso-Torreño, A.; Gómez-Gutiérrez, Á. Predicting sediment deposition rate in check-dams using machine learning techniques and high-resolution DEMs. Environ. Earth Sci. 2021, 80, 380. [Google Scholar] [CrossRef]
  37. Arulanandan, K.; Sargunam, A.; Loganathan, P.; Krone, R. Application of Chemical and Electrical parameters to prediction of erodibility. In Soil Erosion: Causes and Mechanisms; Prevention and Control, Special Rep. 135; Highway Research Board: Washington, DC, USA, 1973; pp. 42–51. [Google Scholar]
  38. Osman, A.M.; Thorne, C.R. Riverbank Stability Analysis. I: Theory. J. Hydraul. Eng. 1988, 114, 134–150. [Google Scholar] [CrossRef]
  39. Esposito, L.; Diogene, G. Effetti dell’inquinamento sul comportamento meccanico dei terreni. Quad. dtai Geol. Appl. 2002, 9, 9–20. [Google Scholar]
  40. Farabollini, P.; Aringoli, D.; Gentili, B.; Materazzi, M.; Pambianchi, G. Processi di approfondimento dell’erosione in alveo ed effetti dell’inquinamento nei fiumi delle Marche centro-meridionali (Italia centrale). Alp. Mediterr. Quat. 2008, 21, 317–330. [Google Scholar]
  41. Dramis, F.; Pambianchi, G.; Nesci, O.; Consoli, M. Il ruolo di elementi strutturali transversali nell’evoluzione tettonico-sedimentaria e geomorfologica della regione marchigiana. Stud. Geol. Camerti 1991, 11, 287–293. [Google Scholar]
  42. Coltorti, M.; Consoli, M.; Dramis, F.; Gentili, B.; Pambianchi, G. Evoluzione geomorfologica delle piane alluvionali delle Marche Centro-Meridionali. Geogr. Fis. Dinam. Quat. 1991, 14, 87–100. [Google Scholar]
  43. Ciccacci, S.; D’Alessandro, L.; Dramis, F.; Fredi, P.; Pambianchi, G. Geomorphological and neotectonic evolution of the Umbria-Marche ridge, northern sector. Stud. Geol. Camerti 1985, 10, 7–15. [Google Scholar]
  44. Dramis, F. Il ruolo dei sollevamenti tettonici a largo raggio nella genesi del rilievo appenninico. Stud. Geol. Camerti 1992, 1, 9–15. [Google Scholar]
  45. Bartolini, G.; Pisano, A.; Punta, E.; Usai, E. A survey of applications of second-order sliding mode control to mechanical systems. Int. J. Control 2003, 76, 875–892. [Google Scholar] [CrossRef]
  46. Gentili, B.; Pambianchi, G. Erosione e sedimentazione negli alti bacini fluviali delle Marche centro-meridionali. Atti Convegno: I corsi d’acqua minori dell’Italia appenninica, Boll. Mus.St. Nat. Lunigiana (Aulla) 1988, 35–40. [Google Scholar]
  47. Amici, M.; Spina, R. Campo Medio della Precipitazione Annuale e Stagionale Sulle Marche per il Periodo 1950–2000; Centro di Ecologia e Climatologia—Osservatorio Geofisico Sperimentale: Macerata, Italy, 2002; Volume 103. [Google Scholar]
  48. Gentilucci, M.; Bufalini, M.; D’aprile, F.; Materazzi, M.; Pambianchi, G. Comparison of data from rain gauges and the IMERG product to analyse precipitation in mountain areas of central Italy. ISPRS Int. J. Geo-Inf. 2021, 10, 795. [Google Scholar] [CrossRef]
  49. Gentilucci, M.; Materazzi, M.; Pambianchi, G.; Burt, P.; Guerriero, G. Temperature variations in Central Italy (Marche region) and effects on wine grape production. Theor. Appl. Climatol. 2020, 140, 303–312. [Google Scholar] [CrossRef]
  50. Materazzi, M.; Bufalini, M.; Gentilucci, M.; Pambianchi, G.; Aringoli, D.; Farabollini, P. Landslide hazard assessment in a monoclinal setting (Central italy): Numerical vs. geomorphological approach. Land 2021, 10, 624. [Google Scholar] [CrossRef]
  51. Brunelli, M.; Farabollini, P. Fenomeni di erosione e dinamica fluviale in alcuni fiumi delle Marche centro-meridionali. In Dinamica Fluviale; Brunelli &Farabollini, Ed.; Ordine dei Geologi delle Marche: Ancona, Italy, 2005; pp. 31–64. [Google Scholar]
  52. Arulanandan, K.; Gillogley, E.; Tully, R. Development of a Quantitative Method to Predict Critical Shear Stress and Rate of Erosion of Natural Undisturbed Cohesive Soils; California Univ. Davis Dept. of Civil Engineering: Davis, CA, USA, 1980. [Google Scholar]
  53. Casagrande, A. Notes on the design of the liquid limit device. Geotechnique 1932, 8, 84–91. [Google Scholar] [CrossRef]
  54. Schofield, A.; Wroth, P. Critical State Soil Mechanics; Cambridge University: Cambridge, UK, 1988. [Google Scholar]
  55. Chiesa, G. Inquinamento delle Acque Sotterranee. Metodi di Indagine e di Studio per la Bonifica e la Gestione delle Acque Inquinate; Hoelpi Editore: Milano, Italy, 1994. [Google Scholar]
Figure 1. Schematic geological map of the study sector with the location of the main wastewater treatment plants (in blue those considered in the present study). P1: Castelraimondo; P2: S. Severino Marche; C1: Camerino; C2: Tolentino; T1: Amandola; T2: Servigliano.
Land 12 00227 g001
Figure 2. Deepening phenomena observed along some river reaches of the study area: (a,b) recent thalweg erosion along the Chienti River (in the second image, three pipelines have been exposed by erosion); (c,d) deepening phenomena occurred in correspondence of two check dams (Tenna and Potenza River respectively) during the last 20 years; (e,f) river incision occurred in just over 20 years in correspondence of the wastewater treatment plant of Tolentino (C2—Chienti River).
Land 12 00227 g002
Figure 3. (ac) the wastewater treatment plants of Tolentino, Camerino and Servigliano, respectively; (d) typical waste collector present along the riverbeds in correspondence of the main plants.
Land 12 00227 g003
Figure 4. Critical Shear Stress τc versus SAR for Different Soil Salt Concentrations and different Dielectric Dispersion Values Δε (modified after [52]).
Land 12 00227 g004
Figure 5. Wilcox diagram for classification of irrigation waters (modified after United States Salinity Laboratory Staff, 1954).
Land 12 00227 g005
Figure 6. Relationship between S.A.R. index and Electrical conductivity for the 12 samples analyzed and positioning of the graph within the more general Wilcox diagram (on the right).
Land 12 00227 g006
Figure 7. Results of the diffractometric analyses conducted in the 6 sample sites with highlighting of the main clay elements and minerals found: Sm = smectite, I = illite, Chl = chlorite, Qz = quartz, Ca = calcium, Fd = feldspar, Do = dolomite. The green line in site C2 refers to a second sample taken downstream of the water treatment plant of Tolentino.
Land 12 00227 g007
Figure 8. The Casagrande Plasticity Chart (adapted from the original) shows the ratio between the Plasticity index (PI) and Liquid limit (LL) for all the samples analyzed; the trend of the downstream samples toward a greater degree of plasticity is evident.
Land 12 00227 g008
Figure 9. SEM analysis results. (a,b) C2-M and T2-V samples, respectively, with evident traces of chlorine; (c) C1-M and (d) C2-V with evident traces of sulfur.
Land 12 00227 g009
Table 1. Results of the chemical analyses carried out on the 12 samples of water taken in correspondence with the sample sites.
Samples
Chemical
Parameters
T1-M Tenna r.T1-V Tenna r.T2-M Tenna r.T2-V Tenna r.C1-M Chienti r.C1-V Chienti r.C2-M Chienti r.C2-V Chienti r.P1-M
Potenza r.
P1-V
Potenza r.
P2-M
Potenza r.
P2-V
Potenza r.
pH7.57.57.97.87.67.67.37.37.57.57.77.6
Calcium Ca (mg/L)107.7108.880.482.9109.2110.681.683.9102.3104.680.586.2
Magnesium Mg (mg/L)20.122.15.55.317.48.65.75.47.18.14.74.2
Sodium Na (mg/L)25.428.615.517.112.515.212.61411.313.612.715.8
Potassium K (mg/L)8.78.96.56.65.66.76.87.15.96.47.27.7
Bicarbonates HCO3 (mg/L)318322244260330338258264311315275280
Chlorides Cl (mg/L)55.958.825.129.120.622.419.323.49.5113.415.517.1
Sulphates SO4 (mg/L)86.186.226.124.236.741.323.322.627.527.417.823.2
Nitrites NO2 (mg/L)absentabsentabsentabsent0.050.040.110.110.270.28absentabsent
Nitrates NO3 (mg/L)22.322.61.731.792.62.625.125.21.11.23.23.3
Cyanides CN (mg/L)absentabsentabsentabsentabsentabsentabsentabsentabsentabsentabsentabsent
Ammonia NH3 (mg/L)absentabsentabsentabsentabsentabsentabsentabsentabsentabsentabsentabsent
Phosphates PO4 (mg/L)absentabsentabsentabsentabsentabsent0.190.21absentabsentabsentabsent
Electrical conductivity (μS/cm)911930482495578582463475440457413423
Sodium
Adsorption Ratio SAR
0.590.650.450.490.310.370.360.400.290.340.370.45
Table 2. Results of the geotechnical analyses carried out on the 12 samples of water taken in correspondence with the sample sites.
Samples
Geotechnical ParametersT1-M
Tenna r.
T1-V
Tenna r.
T2-M
Tenna r.
T2-V
Tenna r.
C1-M
Chienti r.
C1-V
Chienti r.
C2-M
Chienti r.
C2-V
Chienti r.
P1-M
Potenza r.
P1-V
Potenza r.
P2-M
Potenza r.
P2-V
Potenza r.
Water content17.1019.2024.4025.9025.4029.3015.3014.9014.3017.7022.5025.30
Specific weight (g/cm3)1.881.861.962.011.921.872.232.301.731.771.821.82
ATTERBERG LIMITSLiquid Limit—LL38.1146.5731.2742.3929.5447.9749.1168.3731.2548.9831.2539.11
Plastic Limit—PL26.1523.6921.4422.3617.7324.8726.7729.4118.2626.6418.3125.23
Consistency Index—CI1.761.200.700.820.350.811.511.371.301.400.680.99
Plasticity Index—PI11.9622.889.8320.0311.8123.1022.3438.9612.9922.3412.9413.88
Disclaimer/Publisher’s Note: The statements, opinions and data contained in all publications are solely those of the individual author(s) and contributor(s) and not of MDPI and/or the editor(s). MDPI and/or the editor(s) disclaim responsibility for any injury to people or property resulting from any ideas, methods, instructions or products referred to in the content.

