
Spatial and Temporal Patterns of Carbon and Water Use Efficiency on the Loess Plateau and Their Influencing Factors
by
Qi Zhang
1,†, 
Jinxin Lu
1,†,
Xuexuan Xu
2,*,
Xiuzi Ren
1,
Junfeng Wang
1,
Xiaohong Chai
1 and
Weiwei Wang
1 1
College of Grassland Agriculture, Northwest A&F University, Yangling 712100, China
2
Institute of Soil and Water Conservation, Chinese Academy of Sciences & Ministry of Water Resources, Yangling 712100, China
*
Author to whom correspondence should be addressed.
†
These authors contributed equally to this work.
Land 2023, 12(1), 77; https://doi.org/10.3390/land12010077
Submission received: 25 November 2022
/
Revised: 22 December 2022
/
Accepted: 23 December 2022
/
Published: 26 December 2022
Abstract
:Quantitative assessment of the dynamics of carbon and water use efficiency on the Loess Plateau in the context of complex climate change and its driving mechanisms is important for the improvement of the regional ecological environment and the enhancement of ecological service functions. In order to assess the impact of climate change and human activities on the carbon and water use efficiency of the Loess Plateau, this study investigates the spatial and temporal rates of change in CUE, WUE, and meteorological factors at the image metric scale using one-dimensional linear fit regression, investigates the spatial correlation between CUE and meteorological factors using partial correlation analysis, and quantifies the relative contributions of human activities to CUE and WUE using residual analysis. The following are the study’s conclusions: (1) The CUE and WUE of the Loess Plateau decreased geographically from 2000 to 2020, and both the CUE and WUE of the Loess Plateau exhibited a non-significant declining trend (p > 0.05), with the CUE falling at a rate of 0.001/10a (a: year) and the WUE decreasing at a rate of 0.047/10a (a: year). (2) From 2000 to 2020, the mean values of the CUE and WUE of the Loess Plateau were 0.60 and 1.75, respectively, with a clear spatial difference. (3) CUE was favorably linked with precipitation in 56.51% of the Loess Plateau, dispersed throughout the south-central portion of the Loess Plateau and Inner Mongolia, whereas the biased association with temperature was not statistically significant and often negative. (4) An examination of residuals revealed that human activities affected the trend of CUE and WUE to some degree. Only the WUE residuals of evergreen broadleaf forests exhibited a strong upward trend that was considerably influenced by people. In conclusion, this study used remote sensing image data and meteorological data to systematically analyze the spatial and temporal dynamic patterns of carbon use efficiency and water use efficiency on the Loess Plateau over the past 21 years, as well as the characteristics of their responses to climate change and human activities, thereby providing theoretical guidance for the study of carbon and water cycles in terrestrial ecosystems on the Loess Plateau.
1. Introduction
According to the Sixth Assessment Report of the Intergovernmental Panel on Climate Change (IPCC), the impacts of climate change on terrestrial, freshwater, coastal, and pelagic marine ecosystems are already large and growing irreversibly [1]. It is essential to investigate the driving processes between terrestrial ecosystems and climate change in light of global warming and the growing frequency of extreme weather events. As a key indicator of the response of terrestrial ecosystems to climate change, vegetation carbon and water use efficiency have been popular areas of study in climate change research [2,3,4,5]. Vegetation carbon use efficiency (CUE) is frequently described as the ratio of the net primary productivity (NPP) of vegetation to gross primary production (GPP) and represents the potential of ecosystems to assimilate and store carbon [6]. Vegetation water use efficiency (WUE) refers to the proportion of water lost by vegetation in fixing carbon per unit area, expressed as the ratio of vegetation productivity (NPP or GPP) to evapotranspiration (ET), and is a measure of the amount of carbon sequestered per ecosystem of water lost, characterizing ecosystems’ response to changes in water resources [7]. As global warming continues to intensify, the potential of vegetation to sequester carbon and the evaporation of ecosystems’ available water supplies will accelerate. Under the influence of global climate change, the carbon and water cycles of terrestrial ecosystems are systematically altered, posing a substantial threat to the stability and sustainability of ecosystems. Studying the drivers of carbon and water cycles and their interactions with the environment is crucial for resolving pressing ecological and environmental issues, maintaining ecosystem balance, and minimizing the greenhouse impact [8].
In recent years, many researchers have performed multiple studies on the variation patterns and driving mechanisms of vegetation carbon and water use efficiency at diverse spatial and temporal scales [2,9,10,11,12]. Observations and studies of vegetation carbon and water usage efficiency at small scales in the past have primarily employed vorticity correlation and thermal dispersion approaches. With the rapid advancement of remote sensing technology and related data outputs, numerous researchers have combined model simulations and remote sensing data to examine the carbon and water use efficiency of plants at broad scales. When Gong et al. investigated the characteristics of the carbon and water use efficiency of terrestrial ecosystems in Ningxia [13], they discovered that while ecological restoration increased vegetation productivity, it also increased regional water consumption, resulting in a decline in the overall water use efficiency of terrestrial ecosystems. Liu et al. discovered that precipitation was a significant factor influencing the change in land cover carbon and water use efficiency in the basin of Poyang Lake [14]. However, current research focuses primarily on the spatial and temporal variation in single indicators of CUE or WUE at a regional scale and the influence of climatic factors; few studies synthesize and compare the spatial and temporal variation of CUE and WUE in the different vegetation ecosystems within the same region.
The Loess Plateau is located in the coastal–inland, plains–plateau transition zone, from south to north through both the mild temperate zone and two heat zones, and from east to west over semi-humid, semi-arid to dry and wet regions. The eastern and southern portions of the plateau belong to the warm temperate semi-humid zone, while the central and western portions belong to the warm temperate semi-arid zone and the middle temperate semi-arid zone, respectively [15]. The climate of the Loess Plateau is influenced by both longitude and latitude and is confined by topography; it is a typical continental monsoon environment. Current research on the Loess Plateau’s climatic factors, hydrological processes, vegetation cover, and productivity variations is relatively thorough [16,17]. On the Loess Plateau, however, there is less research on the carbon and water usage efficiency of various land use regimes. Since the 1990s, the ecological environment of the Loess Plateau has been significantly improved due to ecological restoration projects, such as the Grain for Green Project. Nevertheless, large-scale ecological projects have significantly altered the regional ecohydrological processes, and the enhanced carbon sequestration capacity of terrestrial ecosystems on the Loess Plateau has led to a dramatic increase in evapotranspiration, which has had a significant impact on the carbon and water cycle processes in the region. Therefore, studying the characteristics and driving factors of CUE and WUE changes in various vegetation ecosystems can help to comprehend the carbon and water cycle mechanisms of terrestrial ecosystems on the Loess Plateau in the context of global climate change, so that effective measures can be taken to improve the carbon and water use efficiency of ecosystems and achieve the sustainable development of ecological restoration vegetation. Considering the anomalous nature of climate change and the increasing negative human activities in the Loess Plateau region in recent years, the vegetation response to climate and human activities is more sensitive. This study takes the Loess Plateau as the research object, obtains the vegetation types and distribution area of the Loess Plateau based on ESA CCI-LC land use types, and uses CRU meteorological data, MODIS vegetation remote sensing data, elevation data, etc., supplemented by trend analysis. The spatial and temporal dynamics of the CUE and WUE of vegetation on the Loess Plateau from 2000 to 2020 were systematically analyzed on an annual scale. Based on the meteorological and land use type data, we analyzed the spatial and temporal trends of the CUE and WUE of different vegetation types and their relationships with temperature and precipitation and investigated the mechanisms of the responses of vegetation CUE and WUE to climatic factors on the Loess Plateau. Based on the residual analysis, we qualitatively assessed the relative impacts and contributions of human activities on CUE and WUE on the Loess Plateau. By studying the response mechanisms of vegetation CUE and WUE to climate change and human activities on the Loess Plateau in the past 21 years, this study provides scientific guidance for the formulation of ecological restoration policies and the sustainable use of restored vegetation resources on the Loess Plateau.
2. Materials and Methods
2.1. Study Area
The Loess Plateau (100°52′–114°33′ E, 33°41′–41°16′ N) is located in the Yellow River basin’s middle reaches, covering more than 1000 km from east to west and 750 km from north to south, with a total area of 640,000 km2 (Figure 1). The Loess Plateau region is in a zone of gradual change from arid to humid areas, influenced by the Asian monsoon, with hot summers with low precipitation, dry and cold winters, annual average temperatures between 3.6 and 14.3 °C, large spatial variability in precipitation, annual average precipitation of 100–800 mm, and a semi-arid continental monsoon climate, with the predominant vegetation being sand dunes [18]. The principal vegetation types include crop, shrub, grassland, forest, and mosaic-type vegetation (mosaic grass, mosaic forest).
2.2. Data
The gross primary production (GPP) data, net primary production (NPP) data, and evapotranspiration (ET) data required for the study were obtained from the National Aeronautics and Space Administration (NASA) website (http//modis.gsfc.nasa.gov/data, accessed on 17 November 2022). NASA launched the TERRA polar-orbiting environmental satellite equipped with the Moderate Resolution Imaging Spectroradiometer (MODIS) in 1999, and its remote sensing data have been widely utilized in the fields of land cover change, biological productivity, and ecological monitoring [19,20]. MODIS offers annual GPP and NPP products with a 500m resolution from 2000 to 2020 (MOD17). These data are derived from a light energy utilization model in order to estimate daily GPP and NPP values, as well as annual GPP and NPP values. This information has been validated and is widely used in Loess Plateau studies of vegetation biomass estimation, the carbon cycle, and ecohydrological processes [21]. The NASA MODIS global evapotranspiration product MOD16 provides a high spatial and temporal resolution land surface evapotranspiration dataset. Numerous researchers have used the MOD16 product to assess the evolution of spatial and temporal patterns of evapotranspiration in the Loess Plateau region [22,23], validating the accuracy and reliability of the data in the Loess Plateau region. The MODIS Reprojection Tool (MRT) was used for batch stitching, projection conversion, and format conversion for vegetation CUE and WUE calculations for a total of 21 years of data from 2000 to 2020 in the study area. The specific information about remote sensing data is shown in Table 1.
With a geographical resolution of 300 meters, land cover classes were extracted from ESA CCI-LC photos in the context of climate change. Crop, mosaic grass (herbaceous > 50%), shrub, grassland, mosaic tree (tree > 50%), evergreen broadleaf forest, deciduous broadleaf forest, evergreen needleleaf forest, deciduous needleleaf forest, and others are the types of vegetation cover in the Loess Plateau region. The original classification data for the years 2000 and 2015 were used to identify a total of 10 categories of vegetation cover.
Precipitation and temperature data were obtained from the Loess Plateau Sub Center, National Earth System Science Data Center, National Science and Technology Infrastructure of China (http://loess.geodata.cn, accessed on 17 November 2022). Based on the global 0.5° climate data published by CRU and the global high-resolution climate data supplied by World Climate, the Delta spatial downscaling scheme was used to generate the data in the Chinese region. The data were also evaluated using 496 independent meteorological observation stations, and the credibility of the results was confirmed. Temperature and precipitation data with a 1 km resolution were used for the examination of factors impacting the carbon and water use efficiency of vegetation.
2.3. Methods
Calculation of CUE and WUE
In this paper, CUE is expressed as the ratio of net primary productivity (NPP) to total primary productivity (GPP); WUE is expressed as the ratio of net primary productivity (NPP) to evapotranspiration (ET). The formulae are as follows:
where CUE and WUE are the carbon use efficiency and water use efficiency of plants, respectively. CUE is dimensionless and WUE is measured in g C⋅mm−1⋅m−2. ET is the ecosystem’s evapotranspiration in millimeters. NPP (g C/m2), GPP (g C/m2), and ET (mm) were obtained from MODIS data products.
Trends analysis
To evaluate the trends of the carbon and water use efficiency of vegetation and climatic parameters, such as precipitation and temperature on the Loess Plateau, a one-dimensional linear regression was selected for this study, and its significance was determined using an F-test. The slope of the regression equation (k) represents the trend of the various variables over the time of the investigation. Specifically, the formula is as follows:
where K denotes the slope of the trend line; n denotes the cumulative number of years in the study time series; Xi denotes the value in year i, The p-value of significance was calculated using the slope and F-test, and the trends of different elements were classified into four categories: k > 0, p < 0.05 indicates a significant increase (sig increase), k > 0, p > 0.05 indicates no significant increase (no-sig increase), k < 0, p < 0.05 indicates a significant decrease (sig decrease) and k < 0, p > 0.05 indicates no significant decrease (no-sig decrease).
Biased correlation analysis
Biased correlation analysis was used to calculate the response of CUE and WUE to the dynamics of climate elements, such as precipitation and temperature. When a variable is correlated with two variables at the same time, partial correlation analysis can remove the influence of the other variable on it. The correlation coefficients between the two variables are first calculated, on the basis of which the partial correlation coefficients are further calculated. The correlation coefficients of CUE and WUE with precipitation and temperature were calculated as follows:
where Rxy represents the correlation coefficient between variables x and y; xi and yi represent the values for the corresponding year; x represents the mean and y the cumulative across the corresponding time period; and n represents the length of the study period.
Residual analysis
Analysis of residuals is used to calculate the anthropogenic impact on CUE and WUE. This method has been used by a large number of scholars to distinguish between climate change and anthropogenic effects. The correlations between CUE and WUE and precipitation and temperature are calculated separately, and regressions are established. The difference between the time series CUE and WUE values and the predicted CUE and WUE values based on the regression relationship is called the CUE or WUE residual. This is calculated using the following formulae:
where CUE’ and WUE’ are predicted values based on regression models, CUEr and WUEr are calculated values based on remote sensing data; a, b and c are model parameters; p and t are the annual cumulative precipitation and annual mean temperature in mm and °C, respectively; and δ is the residual. If the change in residuals is significant, the change in CUE and WUE is considered to be non-climatic; if the change is not significant, the change in CUE and WUE is considered to be dominated by climatic factors.
3. Results
3.1. Spatial and Temporal Characteristics of Vegetation Carbon Use Efficiency and Water Use Efficiency
From 2000 to 2020, the CUE and WUE of the Loess Plateau showed a non-significant decline (p > 0.05), with a rate of decline of 0.001/10a for CUE and 0.047/10a for WUE, indicating that the interannual trends of CUE and WUE were relatively stable over the study period, which was determined by a combination of significant increases in GPP, NPP, and ET during the study period (Figure 2). The lowest value of CUE occurred in 2016, and the highest occurred in 2014; the highest and lowest values of WUE occurred in 2004 and 2010, respectively. The spatial change rate of CUE in the studied area ranged between −0.45 and 0.21, indicating a greater degree of spatial heterogeneity (Figure 3a). Although only 4.79% of the area passed the significance test (p < 0.05), 43.69% of the vegetation cover in the studied area showed a rising tendency, primarily in the lower elevation regions of the southern Loess Plateau and southern Shaanxi Province (Figure 3b). The geographic variation rate of WUE on the Loess Plateau ranged from −0.24 to 1.01 between 2000 and 2020, with the increase and reduction in WUE accounting for 35.6% and 64.4% of the vegetation cover on the Loess Plateau, respectively (Figure 3c). However, only 20.75% of the area passed the significance test (p < 0.05), with 16.62% showing a significant decline, primarily in the western and southeastern portions of the Loess Plateau, and 4.13% showing a significant rise, primarily at the southern edge of the Loess Plateau (Figure 3d).
3.2. Spatial Distribution Characteristics of the Carbon and Water Use Efficiency of Vegetation on the Loess Plateau
The CUE of the Loess Plateau varied from 0.01 to 0.98, with a mean value of 0.60 (Figure 4a). Low values were patchily scattered around the southeast and northwest edges of the Loess Plateau. High values were primarily dispersed in Gansu and Qinghai. Grassland CUE had the highest value of 0.62, and deciduous broadleaf forest had the lowest value of 0.51; the other values were 0.63 for shrub, 0.62 for crop, 0.61 for mosaic forest, 0.60 for mosaic grassland, 0.54 for evergreen needleleaf forest, 0.53 for deciduous needleleaf forest, and 0.52 for evergreen broadleaf forest, in that order. Figure 4b depicts a progressive increase in WUE from northwest to southeast on the Loess Plateau, with a banded distribution of values ranging from 0.2 to 4.9 and a multi-year average of 1.75. The order was as follows: evergreen broadleaf forest > evergreen needleleaf forest > deciduous broadleaf forest > deciduous needleleaf forest > crop > mosaic forest > mosaic grassland > grassland > shrub.
The CUE of various vegetation types failed the significance test (p < 0.05), with increasing trends in evergreen broadleaf forest, deciduous needleleaf forest, deciduous broadleaf forest, shrub, and evergreen needleleaf forest, and decreasing trends in grassland, crop, mosaic forest, and mosaic grassland (Figure 5a). For the WUE of the different vegetation types, only mosaic grassland (declining trend) and evergreen broadleaf forest (increasing trend) passed the significance test (p < 0.05). Shrub and evergreen needleleaf forest exhibited a rising trend, whereas all other land use groups exhibited a decreasing trend (Figure 5b).
3.3. Spatial Patterns of Precipitation and Temperature Variation on the Loess Plateau
Figure 6 depicts the regional distribution and significance of precipitation and temperature trends on the Loess Plateau from 2000 to 2020. The rate of precipitation change on the Loess Plateau ranged from−1.77 to 7.49 over the course of the 21 years, with 95.62% of the area exhibiting minor precipitation trends and 4.38% of the overall study area exhibiting significant precipitation changes. Further, 4.38% of the entire area of the Loess Plateau was affected by a rise in precipitation, primarily in Qinghai, Gansu, and Shanxi. Only 0.44% of the entire area of the Loess Plateau was impacted by a non-significant decline in precipitation.
As depicted in Figure 6c, the distribution of the rate of change in temperature on the Loess Plateau spanned from −0.30 to 0.10, with the majority of locations exhibiting a temperature increase. The significance test results indicate (Figure 6d) that 78.77% of the total grassland area showed an increase in temperature, with the proportion of significant and non-significant increases being 2.64 and 76.13%, respectively, with the significant increase being the larger of the two proportions. The eastern portion of the Loess Plateau was home to the majority of the regions with significant population growth. In addition, 21.23% of the overall area of the Loess Plateau had a fall in temperature, with significant and non-significant decreases of 0.18% and 21.05%, respectively, occurring predominantly in the southern portion of the central Loess Plateau.
3.4. Carbon and Water Use Efficiency of Vegetation in Response to Changes in Precipitation and Temperature
In 56.51% of the regions (with a significant positive correlation of 6.95%), CUE was significantly correlated with precipitation, primarily in the southern portion of the Loess Plateau and sections of Inner Mongolia (Figure 7a). Further, 43.49% of the areas had a negative correlation between CUE and precipitation (with a significant negative correlation of 5.19%), primarily in areas of Gansu. In contrast to precipitation, the correlation between CUE and temperature was predominantly negative, accounting for 69.71% of the study area, showing that the overall increase in temperature in the study area was detrimental to the growth in CUE (Figure 7b). A significant positive relationship between CUE and temperature was identified in 30.29% of the study area, primarily along the northwestern border of the study area and in the southern Shaanxi Province, indicating that the increase in temperature in this portion of the study region was conducive to the growth in CUE.
In the majority of regions (70.86%), WUE was inversely linked with precipitation, with 10.5% of regions passing the significance test, primarily in the south-central region of the research area (Figure 7c). In the southwestern portion of Inner Mongolia, southern Ningxia, and northern Qinghai, 29.14% of the regions with a positive correlation between WUE and precipitation were patchily dispersed. The increase in precipitation in the aforementioned regions resulted in an increase in vegetation water use efficiency (WUE), and WUE was positively correlated with temperature in the majority of regions (59.34%) and negatively correlated in 40.66% of the regions (2.8% passing the significance test), primarily in regions such as the western portion of the Loess Plateau (Figure 7d).
The correlation between CUE and temperature was comparable to the correlation between CUE and precipitation, with the exception of two types of needleleaf forests, which also showed a negative correlation with other land types, but mosaic grassland CUE showed a significant negative correlation with temperature, with a correlation coefficient of −0.11 (p < 0.05) (Figure 8). In contrast to CUE, WUE and precipitation were positively correlated with all vegetation types other than mosaic grass and grassland, with crop, mosaic forest, and deciduous broadleaf forest exhibiting significant positive correlations, with correlation coefficients of 0.1 (p < 0.05), 0.03 (p < 0.05), and 0.4 (p < 0.05), respectively. While the link between WUE and temperature was identical to that between CUE and precipitation, it was inversely connected with all other vegetation types, with the exception of shrub and others. This demonstrates that precipitation has a substantially stronger correlation with WUE variance in different vegetation types on the Loess Plateau than air temperature.
3.5. Impact of Human Activities on Vegetation Carbon and Water Use Efficiency
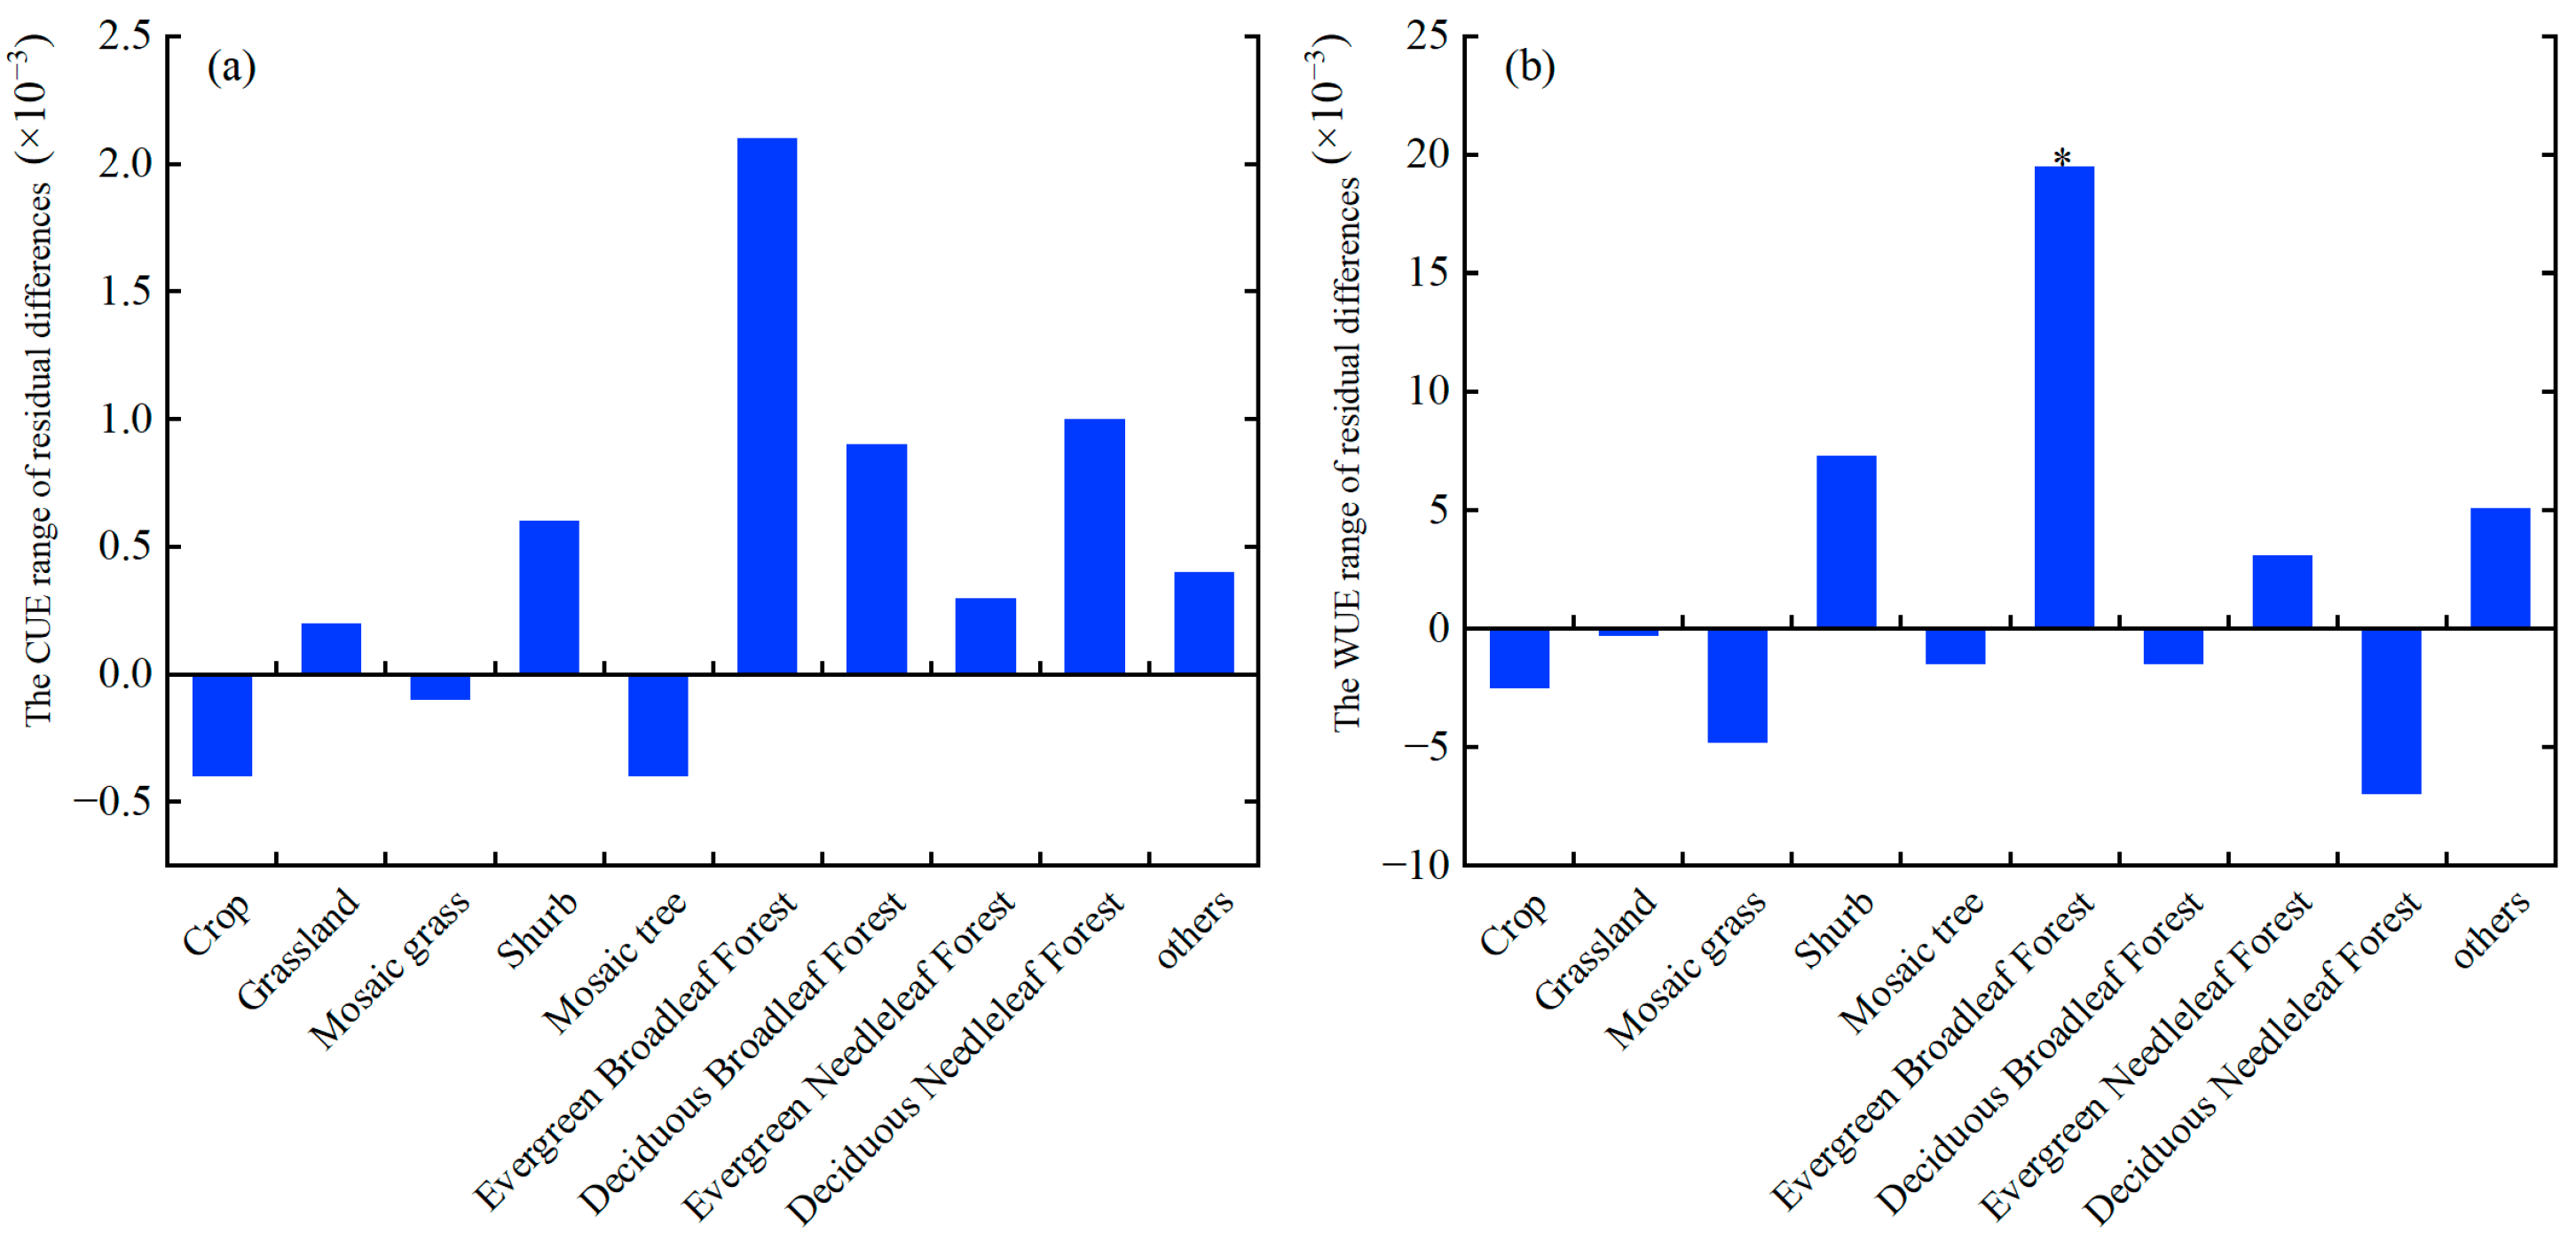
The carbon and water use efficiency of vegetation on the Loess Plateau are altered not just by climate change, but also by human disturbances, such as grazing, mining, afforestation, and the construction of nature reserves. According to the results of the residual analysis (Figure 9), 44.49% of the Loess Plateau CUE residuals exhibited an increasing trend from 2000 to 2020, with only 4.77% of the areas exhibiting a significant increase, primarily in southern Inner Mongolia, south-central Shaanxi, and eastern Ningxia. The residual trend of WUE was comparable to that of CUE, with 39.32% of the region exhibiting an increasing tendency and only 4.21% exhibiting a considerable increase, primarily in Inner Mongolia and the southern edge of the Loess Plateau. On the southeastern and western edges of the Loess Plateau, 60.68% of the land was in decline. During the research period, only the evergreen broadleaf forest WUE residuals displayed a substantial upward trend that was considerably influenced by humans (Figure 10).
4. Discussion
Based on meteorological and remote sensing data, this study analyzed the carbon and water use efficiency of the Loess Plateau from 2000 to 2020 and found that the mean value of CUE on the Loess Plateau was 0.60 for the 21-year period. Chen et al. discovered that the overall vegetation CUE in Chinese terrestrial ecosystems ranged between 0.44 and 0.53, but the mean value remained relatively constant at 0.5 [24]; findings by Liu et al. on vegetation CUE in China revealed that the mean value of vegetation CUE in grassland ecosystems was much greater than in other types of vegetation [25]. The above studies are in general agreement with the results obtained in this paper. In this study, both CUE and WUE showed a general downward trend, while the growth rates of GPP and ET were much larger than those of NPP, resulting in a decline in the multi-year mean values of CUE and WUE in the Loess Plateau from 2000 to 2020. Zhang et al. demonstrated a modest reduction in the worldwide terrestrial ecosystem CUE between 2000 and 2009 [26], while Xia et al. demonstrated a non-significant decline in the global terrestrial ecosystem WUE between 2000 and 2012 [27]. Nonetheless, some researchers have concluded that CUE and WUE in the studied regions exhibited an increasing trend during the study period, such as Chen et al., who concluded that forest CUE in northeast China exhibited a significant increasing trend during 2000–2015 [28], and Liu et al., who demonstrated that vegetation WUE in the Loess Plateau exhibited an increasing trend during 2000–2014 [29]. This demonstrates that the patterns of CUE and WUE in terrestrial ecosystems vary geographically according to the study region and time period.
The highest multi-year mean CUE values are predominantly distributed in regions with complex and diverse landscapes (grasslands and shrubs), such as Qinghai and Gansu, where, due to the relatively high altitude and more humid and cold areas, the ecosystems consume less energy through autotrophic respiration and the vegetation is more efficient in carbon sequestration and transfer [30,31]. Low CUE values are most prevalent in the southern portion of the Loess Plateau and the northwestern boundary of the region, among other locations. According to the elevation map, the landscape consists primarily of basins and plains at lower elevations, where precipitation is quite abundant, and heat is the primary factor restricting the growth of plants. With an increase in precipitation and warmth, the respiration rate of plants grows exponentially, whilst the photosynthesis rate remains essentially constant, resulting in a drop in CUE [24,32,33,34]. The increase in GPP exceeds the increase in NPP, which indirectly results in a decline in vegetation CUE. An increase in CUE was observed in 43.69% of the Loess Plateau (only 4.79% passed the significance test), primarily in Shaanxi, Ningxia, and Inner Mongolia, which is significantly related to the ecological restoration policies, such as the return of farmland to forests and grassland, and the enhancement of ecological restoration effects in these areas.
By altering photosynthesis and respiration, both temperature and precipitation can impact the carbon usage efficiency of plants [35,36,37,38]. When temperature and precipitation conditions are optimal, vegetation flourishes and utilizes more autotrophic respiration, resulting in a lower vegetation CUE. When both temperature and precipitation increase by the same amount, the increase in GPP exceeds the increase in NPP, which leads indirectly to a decrease in vegetation CUE. Partial correlation analysis revealed that the spatial distribution of CUE and precipitation on the Loess Plateau was substantially diverse, with 56.51% of the CUE in the research area exhibiting a positive association with precipitation. This was primarily found in the middle and southern portions of the Loess Plateau as well as portions of Inner Mongolia. This suggests that increased precipitation is the primary meteorological factor that increases the CUE of vegetation ecosystems on the Loess Plateau, and that increased precipitation can reduce the average ratio of the dark respiration rate to the photosynthetic rate in vegetation while simultaneously increasing photosynthesis, resulting in an increase in vegetation CUE [39,40,41,42,43]. In contrast to precipitation, the correlation between CUE and temperature was predominantly negative, accounting for 69.71% of the study area, showing that the overall increase in temperature in the study area was detrimental to the growth in CUE.
The CUE values of different vegetation types are highly variable, with grassland CUE values being higher than those of other vegetation types. This is likely because forest ecosystems are more complex than grassland ecosystems, where photosynthesis fixes more solar energy and respiration consumes more energy for plant growth and reproduction [44,45,46]. CUE values for various land use types failed the significance test (p < 0.05), with increasing trends for evergreen broadleaf forest, deciduous needleleaf forest, deciduous broadleaf forest, shrub, and evergreen needleleaf forest, and decreasing trends for grassland, crop, mosaic forest, and mosaic grass. In addition to temperature and precipitation, vegetation CUE is also affected by plant cover and vegetation autotrophic respiration. Irrigation and fertilization of agricultural soil can reduce root respiration, while a small vegetation cover leads to less above-ground respiration and a larger CUE [47,48,49,50].
In addition, Zou et al. discovered that the water use efficiency of ecosystems in central Asia and Xinjiang exhibited a slow increase over the past 15 years [51], whereas this study concluded that the interannual-scale WUE in the Loess Plateau region slowly decreased due to the rapid increase in ET of the region’s vegetation. Consistent with the findings of others, the spatial distribution of WUE on the Loess Plateau has a distinct zonal pattern, i.e., a steady decrease from southeast to northwest (Figure 4a). In the southeast of the Loess Plateau, which is next to the Taihang Mountains and has more complicated geomorphological characteristics and less evapotranspiration, WUE values are the highest. In addition, the shadowing impact of more vegetation cover on the soil might reduce ET, resulting in a higher WUE. In arid regions, precipitation is low, vegetation is sparse, and soil evapotranspiration is high, making it difficult for water to permeate the soil and promote plant development [52]; therefore, the northwestern Loess Plateau has a lower WUE. In contrast to CUE, the WUE values of evergreen broadleaf forest were generally greater than those of other vegetation types, in descending order: evergreen broadleaf forest > evergreen needleleaf forest > deciduous broadleaf forest > deciduous needleleaf forest > crop > mosaic forest > mosaic grass > grassland > shrub > other. The WUE of forest ecosystems is much greater than that of grassland ecosystems, primarily because forests are dominated by tall tree vegetation with a high leaf area index, canopy cover, and strong leaf photosynthesis. The grassland ecosystem has less vegetation cover, less production, and increased evaporation at the surface [53].
The study by T.C. indicated that water conditions were the primary predictor of plant water use efficiency [54], but the study by Jr R [55] stated that light and water were the primary factors influencing plant water use efficiency. In this study, WUE and precipitation were negatively associated (in an encompassing pattern) in the majority of locations (70.86%). In the study area, 29.14% of the regions with a positive association between WUE and precipitation were scattered in a patchy fashion, including southwest Inner Mongolia, southern Ningxia, and northern Qinghai. Due to the climatic conditions of the Loess Plateau, precipitation is not the primary limiting factor for WUE on the Loess Plateau. The Loess Plateau is situated in the coastal–inland, plain–plateau transition zone. From south to north, it straddles two heat zones: the warm temperate zone and the medium temperate zone. The eastern and southern portions of the plateau belong to the warm temperate semi-humid zone, the central portion belongs to the warm temperate semi-arid zone, and the western and northern portions belong to the mid-temperate semi-arid zone. Wu et al. also demonstrated that the regional wet and dry conditions govern the variation in vegetation WUE [56]. As temperature can affect plant photosynthesis and transpiration by changing leaf stomatal conductance, the association between WUE and temperature was positive in most regions (59.34%) but not significant. It has been demonstrated that precipitation and temperature have a threshold influence on the responsiveness of WUE [57,58,59,60], with excessive precipitation and temperature having a negative effect on vegetation WUE. WUE and precipitation were positively connected with all land use types, with the exception of mosaic grassland and grassland, with farmland, mosaic woodland, and deciduous broadleaf forest exhibiting substantial positive correlations with coefficients of 0.10, 0.03, and 0.40, respectively. Under identical conditions of water supply, woods and agriculture can generate and store more biomass and organic matter than grassland. In prior studies, Santiago et al. demonstrated that the water use efficiency of trees, shrubs, herbs, and vines varied, with vines having the highest water use efficiency, followed by trees and shrubs, which were all greater than herbs [61].
Additionally, some Loess Plateau vegetation restoration initiatives have been effective and have had a good impact on the growth of vegetation [62,63]. After the year 2000, the implementation of different ecological restoration programs, such as returning farms to grassland, fencing, and limiting overgrazing, contributed greatly to the increase in vegetation productivity on the Loess Plateau. The residual values of CUE rose in 44.49% of the Loess Plateau and rose significantly in 4.77% of the areas, primarily in southern Inner Mongolia, south-central Shaanxi, and eastern Ningxia. Although CUE was favorably connected with precipitation and negatively correlated with temperature in these places, its correlation with climatic parameters was not statistically significant, suggesting that human activities, such as grazing, are the primary factors controlling CUE in these regions.
By systematically analyzing the spatial and temporal evolution of carbon and water use efficiency on the Loess Plateau from 2000 to 2020, and by discussing the potential influencing factors on carbon and water use efficiency, this study provides important guidance values for the formulation and implementation of vegetation conservation policies by supervisory and management agencies on the Loess Plateau. However, precipitation and temperature are not the only climatic factors influencing vegetation water use efficiency; the influence of several climatic parameters on the carbon water use efficiency of the Loess Plateau will be thoroughly examined in a forthcoming study.
5. Conclusions
This paper analyzed the evolution of the geographical and temporal patterns of vegetation carbon and water use efficiency and their probable drivers by analyzing the Loess Plateau’s carbon and water use efficiency based on remote sensing data. The CUE and WUE of the Loess Plateau decreased at a rate of 0.001/10a and 0.047/10a, respectively, from 2000 to 2020. However, this trend was not statistically significant (p > 0.05). From 2000 to 2020, the mean values of CUE and WUE on the Loess Plateau were 0.60 and 1.75, with noticeable geographic divergence characteristics (“U” form). The geographical correlation between CUE and precipitation on the Loess Plateau was predominantly positive and dispersed throughout the middle and southern portions of the Loess Plateau and Inner Mongolia; the biased association with temperature was not statistically significant and often negative. In most places, WUE was negatively connected with precipitation (in an enclosed form), but positively correlated with temperature. On the Loess Plateau, the correlation between CUE and precipitation and temperature for different vegetation types was predominantly negative, whereas the correlation between WUE and precipitation was positive for all vegetation types except for mosaic grassland and grassland, while the correlation between WUE and temperature was comparable to that of CUE. The examination of residuals indicated that human activities influenced the CUE and WUE to some degree, the CUE residuals increased significantly in 4.77% of the Loess Plateau, primarily in southern Inner Mongolia, south-central Shaanxi, and eastern Ningxia, etc. The WUE residuals increased significantly in 4.21% of the Loess Plateau, primarily in Inner Mongolia and the southern edge of the Loess Plateau, etc. Only the WUE residuals of evergreen broadleaf forest exhibited a strong upward trend that was considerably influenced by people.
Author Contributions
Conceptualization, Q.Z., J.L., X.R., J.W., X.C. and W.W.; methodology, Q.Z. and J.L.; software, Q.Z. and J.L.; validation, Q.Z. and J.L.; formal analysis, Q.Z. and J.L.; investigation, Q.Z. and J.L.; resources, Q.Z. and X.X.; data curation, Q.Z. and J.L.; writing—original draft preparation, Q.Z. and J.L.; writing—review and editing, X.X.; visualization, Q.Z. and J.L.; supervision, X.X.; project administration, X.X.; funding acquisition, X.X. All authors have read and agreed to the published version of the manuscript.
Funding
This research was supported by the National Natural Science Foundation of China (Grant No. 41977426).
Conflicts of Interest
The authors declare no conflict of interest.
References
- Livingston, J.E.; Rummukainen, M. Taking science by surprise: The knowledge politics of the IPCC Special Report on 1.5 degrees. Environ. Sci. Policy 2020, 112, 10–16. [Google Scholar] [CrossRef]
- Medlyn, B.E.; De Kauwe, M.G.; Lin, Y.S.; Knauer, J.; Duursma, R.A.; Williams, C.A.; Arneth, A.; Clement, R.; Isaac, P.; Limousin, J.M.; et al. How do leaf and ecosystem measures of water-use efficiency compare? New Phytol. 2017, 216, 758–770. [Google Scholar] [CrossRef] [Green Version]
- Gang, C.; Yi, Z.; Liang, G.; Gao, X.; Wen, Z. Drought-Induced Carbon and Water Use Efficiency Responses in Dryland Vegetation of Northern China. Front. Plant Sci. 2019, 10, 224. [Google Scholar] [CrossRef] [PubMed] [Green Version]
- Houborg, R.; Anderson, M.C.; Daughtry, C.S.T.; Kustas, W.P.; Rodell, M. Using leaf chlorophyll to parameterize light-use-efficiency within a thermal-based carbon, water and energy exchange model. Remote Sens. Environ. 2011, 115, 1694–1705. [Google Scholar] [CrossRef]
- Zheng, H.; Lin, H.; Zhu, X.J.; Jin, Z.; Bao, H. Divergent spatial responses of plant and ecosystem water-use efficiency to climate and vegetation gradients in the Chinese Loess Plateau. Glob. Planet. Change 2019, 181, 102995. [Google Scholar] [CrossRef]
- Kwon, Y.; Larsen, C. Effects of forest type and environmental factors on forest carbon use efficiency (CUE) using MODIS and FIA data across the eastern USA. In Proceedings of the AGU Fall Meeting, San Francisco, CA, USA, 3–7 December 2012. [Google Scholar]
- Zheng, H.; Lin, H.; Zhou, W.; Bao, H.; Zhu, X.; Jin, Z.; Song, Y.; Wang, Y.; Liu, W.; Tang, Y. Revegetation has increased ecosystem water-use efficiency during 2000–2014 in the Chinese Loess Plateau: Evidence from satellite data. Ecol. Indic. 2019, 102, 507–518. [Google Scholar] [CrossRef]
- Sun, S.; Song, Z.; Wu, X.; Wang, T.; Wu, Y.; Du, W.; Che, T.; Huang, C.; Zhang, X.; Ping, B. Spatio-temporal variations in water use efficiency and its drivers in China over the last three decades. Ecol. Indic. 2018, 94, 292–304. [Google Scholar] [CrossRef]
- Ogutu, B.O.; D’Adamo, F.; Dash, J. Impact of vegetation greening on carbon and water cycle in the African Sahel-Sudano-Guinean region. Glob. Planet. Change 2021, 202, 103524. [Google Scholar] [CrossRef]
- Budny, M.L. The Impact of Willow Encroachment on Water and Carbon Exchange in the Vegetation of a Subtropical Wetland. Master’s Thesis, Florida Atlantic University, Boca Raton, FL, USA, 2015. [Google Scholar]
- Chen, Y.; Wei, T.; Ren, K.; Sha, G.; Guo, X.; Fu, Y.; Yu, H. The coupling interaction of soil organic carbon stock and water storage after vegetation restoration on the Loess Plateau, China. J. Environ. Manag. 2022, 306, 114481. [Google Scholar] [CrossRef]
- Wang, G.H. Can the restoration of natural vegetation be accelerated on the Chinese Loess Plateau? A study of the response of the leaf carbon isotope ratio of dominant species to changing soil carbon and nitrogen levels. Ecol. Res. 2006, 21, 188–196. [Google Scholar] [CrossRef]
- Gong, F.; Du, L.; Meng, C.; Dan, Y.; Wang, L.; Zheng, Q.; Ma, L. Characteristics of water use efficiency in terrestrial ecosystems and its influence factors in Ningxia Province. Acta Ecol. Sin. 2019, 39, 9068–9078. [Google Scholar]
- Liu, F.; Ye, X.; Guo, Q.; Li, X.; Liu, J. Spatio-temporal variation of carbon and water use efficiency of different land cover in the Poyang Lake Basin and their correlations with climate factors. Acta Ecol. Sin. 2021, 41, 694–706. [Google Scholar] [CrossRef]
- Qiu, Y.; Fu, B.; Wang, J.; Chen, L. Soil moisture variation in relation to topography and land use in a hillslope catchment of the Loess Plateau, China. J. Hydrol. 2001, 240, 243–263. [Google Scholar] [CrossRef]
- Li, J.; Ren, Z. Effects of land use change on values of NPP ecosystem services of Loess Plateau in northern Shaanxi. Chin. J. Ecol. 2005, 24, 1029–1032. [Google Scholar]
- Liu, Y.; Wang, Q.; Yang, Y.; Gang, C.; Li, J. Spatial-temporal dynamics of grassland NPP and its driving factors in the Loess Plateau, China. J. Appl. Ecol. 2019, 30, 2309–2319. [Google Scholar]
- Zhou, H.; Van Rompaey, A.; Wang, J.A. Detecting the impact of the ‘Grain for Green’ program on the mean annual vegetation cover in the Shaanxi province, China using SPOT-VGT NDVI data. Land Use Policy 2009, 26, 954–960. [Google Scholar] [CrossRef]
- Huete, A.; Didan, K.; Miura, T.; Rodriguez, E.P.; Gao, X.; Ferreira, L.G. Overview of the radiometric and biophysical performance of the MODIS vegetation indices. Remote Sens. Environ. Interdiscip. J. 2002, 83, 195–213. [Google Scholar] [CrossRef]
- Zhao, M.; Heinsch, F.A.; Nemani, R.R.; Running, S.W. Improvements of the MODIS terrestrial gross and net primary production global data set. Remote Sens. Environ. Interdiscip. J. 2005, 95, 164–176. [Google Scholar] [CrossRef]
- Lan, X.; Liu, Z.; Chen, X.; Lin, K.; Cheng, L. Trade-off between carbon sequestration and water loss for vegetation greening in China. Agric. Ecosyst. Environ. 2021, 319, 107522. [Google Scholar] [CrossRef]
- Xiong, Y.; Qiu, G. Using MODIS land products to estimate regional evapotranspiration. In Proceedings of the 2010 IEEE International Geoscience and Remote Sensing Symposium, Honolulu, HI, USA, 25–30 July 2010; pp. 3882–3885. [Google Scholar]
- Liu, Y.; Hiyama, T.; Yamaguchi, Y. Scaling of land surface temperature using satellite data: A case examination on ASTER and MODIS products over a heterogeneous terrain area. Remote Sens. Environ. Interdiscip. J. 2006, 105, 115–128. [Google Scholar] [CrossRef]
- Chen, Z.; Yu, G.; Wang, Q. Ecosystem carbon use efficiency in China: Variation and influence factors. Ecol. Indic. Integr. Monit. Assess. Manag. 2018, 90, 316–323. [Google Scholar] [CrossRef]
- Liu, Y.; Wang, Q.; Yang, Y.; Tong, L.; Li, J.; Zhang, Z.; Wang, Z. Spatiotemporal Dynamic of Vegetation Carbon Use Efficiency and Its Relationship with Climate Factors in China During the Period 2000–2013. Res. Soil Water Conserv. 2019, 26, 278–286. [Google Scholar]
- Zhang, Y.; Yu, G.; Yang, J.; Wimberly, M.C.; Zhang, X.; Tao, J.; Jiang, Y.; Zhu, J. Climate-driven global changes in carbon use efficiency. Glob. Ecol. Biogeogr. 2014, 23, 144–155. [Google Scholar] [CrossRef]
- Xia, L.; Wang, F.; Mu, X.; Jin, K.; Sun, W.; Gao, P.; Zhao, G. Water use efficiency of net primary production in global terrestrial ecosystems. J. Earth Syst. Sci. 2015, 124, 921–931. [Google Scholar] [CrossRef]
- Zhi, C. Spatiotemporal variation of productivity and carbon use efficiency of forests in Northeast China from 2000 to 2015. Chin. J. Appl. Ecol. 2019, 30, 206–213. [Google Scholar]
- Liu, X.; Hu, B.; Ren, Z. Spatiotemporal Variation of Water Use Efficiency and Its Driving Forces on the Loess Plateau during 2000–2014. Sci. Agric. Sin. 2018, 51, 302–314. [Google Scholar]
- Fu, G.; Zhou, Y.T.; Shen, Z.X.; Zhang, X.Z.; Shi, P.L.; He, Y.T.; Wu, J.S. Relationships between ecosystem respiration and environmental factors of alpine grazing meadows along an altitudinal gradient (4300–4700 m). Ecol. Environ. 2010, 19, 2789–2794. [Google Scholar]
- Niu, X.; Sun, P.; Liu, X.; Luan, J.; Liu, S. Net ecosystem carbon dioxide exchange in an oak (Quercus aliena) forest at transitional zone from subtropics to warm temperate, China. Acta Ecol. Sin. 2020, 40, 5980–5991. [Google Scholar]
- Kunchala, R.K.; Patra, P.K.; Kumar, K.N.; Chandra, N.; Attada, R.; Karumuri, R.K. Spatio-temporal variability of XCO2 over Indian region inferred from Orbiting Carbon Observatory (OCO-2) satellite and Chemistry Transport Model. Atmos. Res. 2022, 269, 106044. [Google Scholar] [CrossRef]
- Sawamoto, T.; Hatano, R.; Yajima, T.; Takahashi, K.; Isaev, A.P. Soil respiration in Siberian Taiga ecosystems with different histories of forest fire. Soil Sci. Plant Nutr. 2000, 46, 31–42. [Google Scholar] [CrossRef]
- Zhuang, Q.; He, J.; Lu, Y.; Ji, L.; Xiao, J.; Luo, T. Carbon dynamics of terrestrial ecosystems on the Tibetan Plateau during the 20th century: An analysis with a process-based biogeochemical model. Glob. Ecol. Biogeogr. 2010, 19, 649–662. [Google Scholar] [CrossRef]
- Chen, H.; Ren, Z.Y. Response of Vegetation Coverage to Changes of Precipitation and Temperature in Chinese Mainland. Bull. Soil Water Conserv. 2013, 2, 18. [Google Scholar]
- Chuai, X.; Guo, X.; Zhang, M.; Yuan, Y.; Li, J. Vegetation and climate zones based carbon use efficiency variation and the main determinants analysis in China. Ecol. Indic. 2020, 111, 105967. [Google Scholar] [CrossRef]
- Gebregergis, Z. Effect of Elevated Carbon Dioxide, CO2 and Temperature on Crop Production: A Review. J. Natl. Sci. Res. 2016, 6, 42–46. [Google Scholar]
- Mu, S.J.; Zhou, K.X.; Qi, Y.; Chen, Y.Z.; Fang, Y.; Zhu, C. Spatio-temporal patterns of precipitation-use efficiency of vegetation and their controlling factors in Inner Mongolia. Chin. J. Plant Ecol. 2014, 38, 1–16. [Google Scholar]
- Bachman, S.; Heisler-White, J.L.; Pendall, E.; Williams, D.G.; Newcomb, M.J. Elevated carbon dioxide alters impacts of precipitation pulses on ecosystem photosynthesis and respiration in a semi-arid grassland. Oecologia 2010, 162, 791–802. [Google Scholar] [CrossRef]
- Gosselin, N. Assessing Climate Change Effects on Soil and Vegetation Carbon Dynamics Using a Temperature and Precipitation Bias Correction Technique. In Proceedings of the 28th Conference on Hydrology, Atlanta, GA, USA, 4 February 2014. [Google Scholar]
- Groenendijk, M.; Dolman, A.J.; Molen, M.; Leuning, R.; Arneth, A.; Delpierre, N.; Gash, J.; Lindroth, A.; Richardson, A.D.; Verbeeck, H. Assessing parameter variability in a photosynthesis model within and between plant functional types using global Fluxnet eddy covariance data. Agric. For. Meteorol. 2011, 151, 22–38. [Google Scholar] [CrossRef]
- Heskel, M.A.; Bitterman, D.; Atkin, O.; Turnbull, M.; Griffin, K.L. Seasonal dynamics of photosynthesis and respiration in Arctic tundra species under warming. In Proceedings of the 97th ESA Annual Convention 2012, Portland, OR, USA, 5–10 August 2012. [Google Scholar]
- Luus, K.A.; Lin, J.C. The Polar Vegetation Photosynthesis and Respiration Model (PolarVPRM): A parsimonious, satellite data-driven model of high-latitude CO2 exchange. Geosci. Model Dev. Discuss. 2015, 8, 979–1027. [Google Scholar]
- Henderson, B.A.; Trivedi, T.; Collins, N. Annual cycle of energy allocation to growth and reproduction of yellow perch. J. Fish Biol. 2010, 57, 122–133. [Google Scholar] [CrossRef]
- Kesarcodi-Watson, A.; Klumpp, D.W.; Lucas, J.S. Comparative feeding and physiological energetics in diploid and triploid Sydney rock oysters (Saccostrea commercialis): II. Influences of food concentration and tissue energy distribution. Aquaculture 2001, 203, 195–216. [Google Scholar] [CrossRef]
- Way, C.M. Seasonal allocation of energy to respiration, growth and reproduction in the freshwater clams, Pisidium variabile and P. compressum (Bivalvia: Pisidiidae). Freshw. Biol. 2010, 19, 321–332. [Google Scholar] [CrossRef]
- Astover, A.; Roostalu, H.; Motte, M.; Tamm, I.; Vasiliev, N.; Lemetti, I. Decision support system for agricultural land use and fertilisation optimisation: A case study on barley production in Estonia. MTT Agrifood Res. Finl. 2006, 15, 77–88. [Google Scholar] [CrossRef]
- Sušin, J.; Kmecl, V.; ŽnidaršičPongrac, V.; Briški, L. Fertilisation of agricultural land in the ground water sources areas in the Ljubljana community. Diabetologia 2000, 51, 328–335. [Google Scholar]
- Carbonell-Bojollo, R.M.; Veroz-González, Ó.; González-Sánchez, E.J.; Ordóñez-Fernández, R.; Moreno-García, M.; De Torres, M.A.R.-R. Soil Management, Irrigation and Fertilisation Strategies for N2O Emissions Mitigation in Mediterranean Agricultural Systems. Agronomy 2022, 12, 1349. [Google Scholar] [CrossRef]
- Xiao, H.J.; Ding, G.D.; Jia, R.Y.; Ma, S.-L. Changes of vegetation and soil environment of wasteland in the early period of eco-restoration in Beijing suburb—A case study of Yanqing. Agric. Res. Arid Areas 2005, 23, 202–206. [Google Scholar]
- Zou, J.; Ding, J.; Yang, S. Spatial and temporal variation analysis of ecosystem water use efficiency in Central Asia and Xinjiang in recent 15 years. Geogr. Res. 2017, 36, 1742–1745. [Google Scholar]
- Suzuki, J.; Nakayama, K. Soil Moisture Condition and Evapotranspiration in a Maize Field under the Summer Condition of High Temperature and Low Rainfall. J. Agric. Meteorol. 2010, 52, 233–240. [Google Scholar] [CrossRef]
- Griffin, A. Using LiDAR and normalized difference vegetation index to remotely determine LAI and percent canopy cover at varying scales. In Proceedings of the SilviLaser 2008, 8th International Conference on LiDAR Applications in Forest Assessment and Inventory, Edinburgh, UK, 17–19 September 2008. [Google Scholar]
- Hsiao, T.C. Interactive Effects of Elevated CO{sub 2}, Drought and High Temperature on Plant Water Use Efficiency; Office of Scientific & Technical Information Technical Reports; USDOE Oakland Operations Office: Oakland, CA, USA, 1998.
- Beeson, R.C. Response of Evapotranspiration of Viburnum odoratissimum to Canopy Closure and the Implications for Water Conservation during Production and in Landscapes. Hortsci. A Publ. Am. Soc. Hortic. Sci. 2010, 45, 359–364. [Google Scholar] [CrossRef] [Green Version]
- Wu, Y.; Wang, W.; Li, W.; Zhao, S.; Wang, S.; Liu, T. Assessment of the spatiotemporal characteristics of vegetation water use efficiency in response to drought in Inner Mongolia, China. Environ. Sci. Pollut. Res. 2022. [Google Scholar] [CrossRef]
- Dai, J. Response of Robinia Pseudoacacia First Leaf Date to temperature and Precipitation Change in China in the Past 50 Years. In Proceedings of the International Congress of Biometeorology, Cleveland, OH, USA, 30 September 2014. [Google Scholar]
- Pei, T.; Li, X.; Wu, H.; Wu, X.; Chen, Y.; Xie, B. Sensitivity of vegetation water use efficiency to climate and vegetation index in Loess Plateau, China. Trans. Chin. Soc. Agric. Eng. 2019, 35, 119–125. [Google Scholar]
- Zhan, Z.Y.; Yu, Y.M.; Chen, T.T.; Xu, L.J.; Ou, C.Q. Effects of hourly precipitation and temperature on ambulance response time. Environ. Res. 2019, 181, 108946. [Google Scholar] [CrossRef] [PubMed]
- Liu, Z.; Ye, J.P.; Ouyang, L.; Sheng, F.; Liu, S.Y. Hydrological effects of vegetation restoration and the threshold for its response to annual precipitation in Pengchongjian small watershed, Jiangxi, China. J. Appl. Ecol. 2018, 29, 3705–3711. [Google Scholar]
- Santiago, L.S.; Silvera, K.; Andrade, J.L.; Dawson, T.E. Functional strategies of tropical dry forest plants in relation to growth form and isotopic composition. Environ. Res. Lett. 2017, 12, 115006. [Google Scholar] [CrossRef] [Green Version]
- Xu, M.; Li, W.; Wang, J.; Zhu, Y.; Feng, Y.; Yang, G.; Zhang, W.; Han, X. Soil ecoenzymatic stoichiometry reveals microbial phosphorus limitation after vegetation restoration on the Loess Plateau, China. Sci. Total Environ. 2022, 815, 152918. [Google Scholar] [CrossRef] [PubMed]
- Zhang, L.; Lv, J. Linkages between soil respiration and soil eukaryotic microalgae following vegetation restoration in the Loess Plateau, China. Land Degrad. Dev. 2022, 33, 881–891. [Google Scholar] [CrossRef]
Figure 1.
Vegetation types and elevation maps of the Loess Plateau. 1. Crop, 2. mosaic grass, 3. shrub, 4. grassland, 5. mosiac tree, 6. evergreen broadleaf forest, 7. deciduous broadleaf forest, 8. evergreen needleleaf forest, 9. evergreen broadleaf forest, 10. others.
Figure 1.
Vegetation types and elevation maps of the Loess Plateau. 1. Crop, 2. mosaic grass, 3. shrub, 4. grassland, 5. mosiac tree, 6. evergreen broadleaf forest, 7. deciduous broadleaf forest, 8. evergreen needleleaf forest, 9. evergreen broadleaf forest, 10. others.

Figure 2.
Variation in (a) CUE and WUE from 2000 to 2020 in the Loess Plateau. (b) NPP, GPP and ET from 2000 to 2020 in the Loess Plateau.
Figure 2.
Variation in (a) CUE and WUE from 2000 to 2020 in the Loess Plateau. (b) NPP, GPP and ET from 2000 to 2020 in the Loess Plateau.

Figure 3.
Spatial variation rate and its significance test of CUE (a,b) and WUE (c,d) from 2000 to 2020 in the Loess Plateau.
Figure 3.
Spatial variation rate and its significance test of CUE (a,b) and WUE (c,d) from 2000 to 2020 in the Loess Plateau.
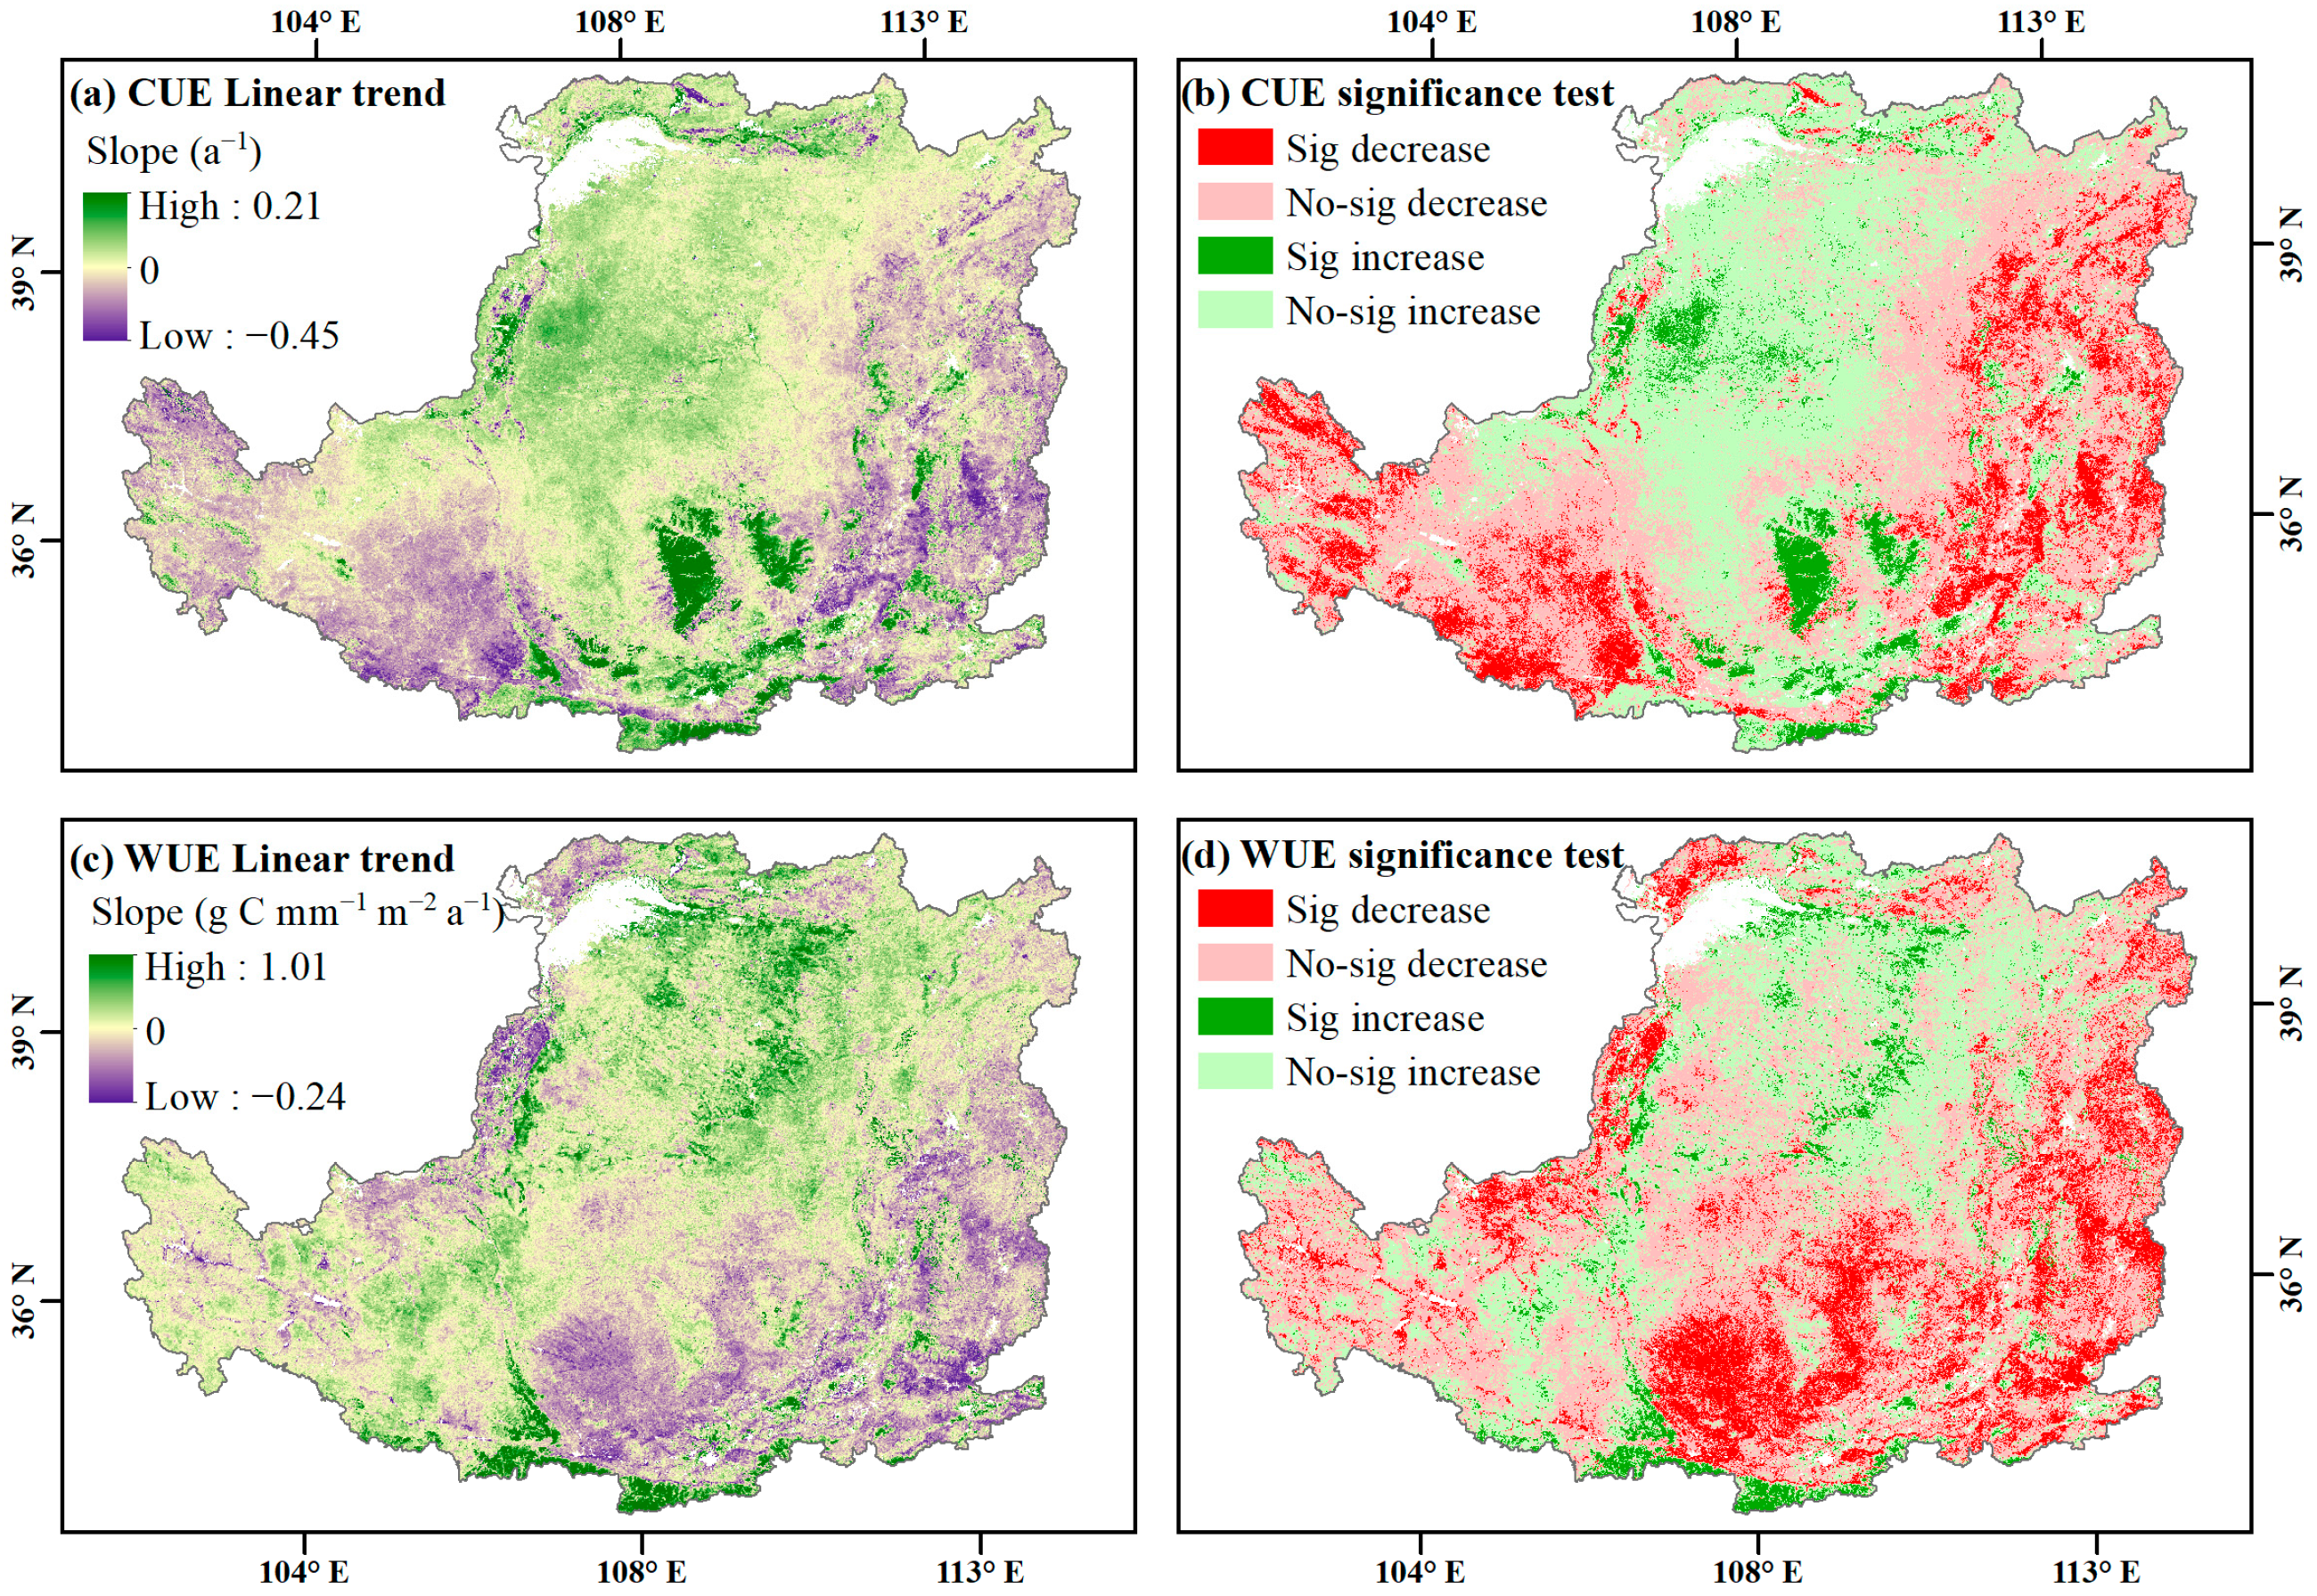
Figure 4.
Characteristics of the spatial distribution of CUE (a) and WUE (b) in the Loess Plateau.
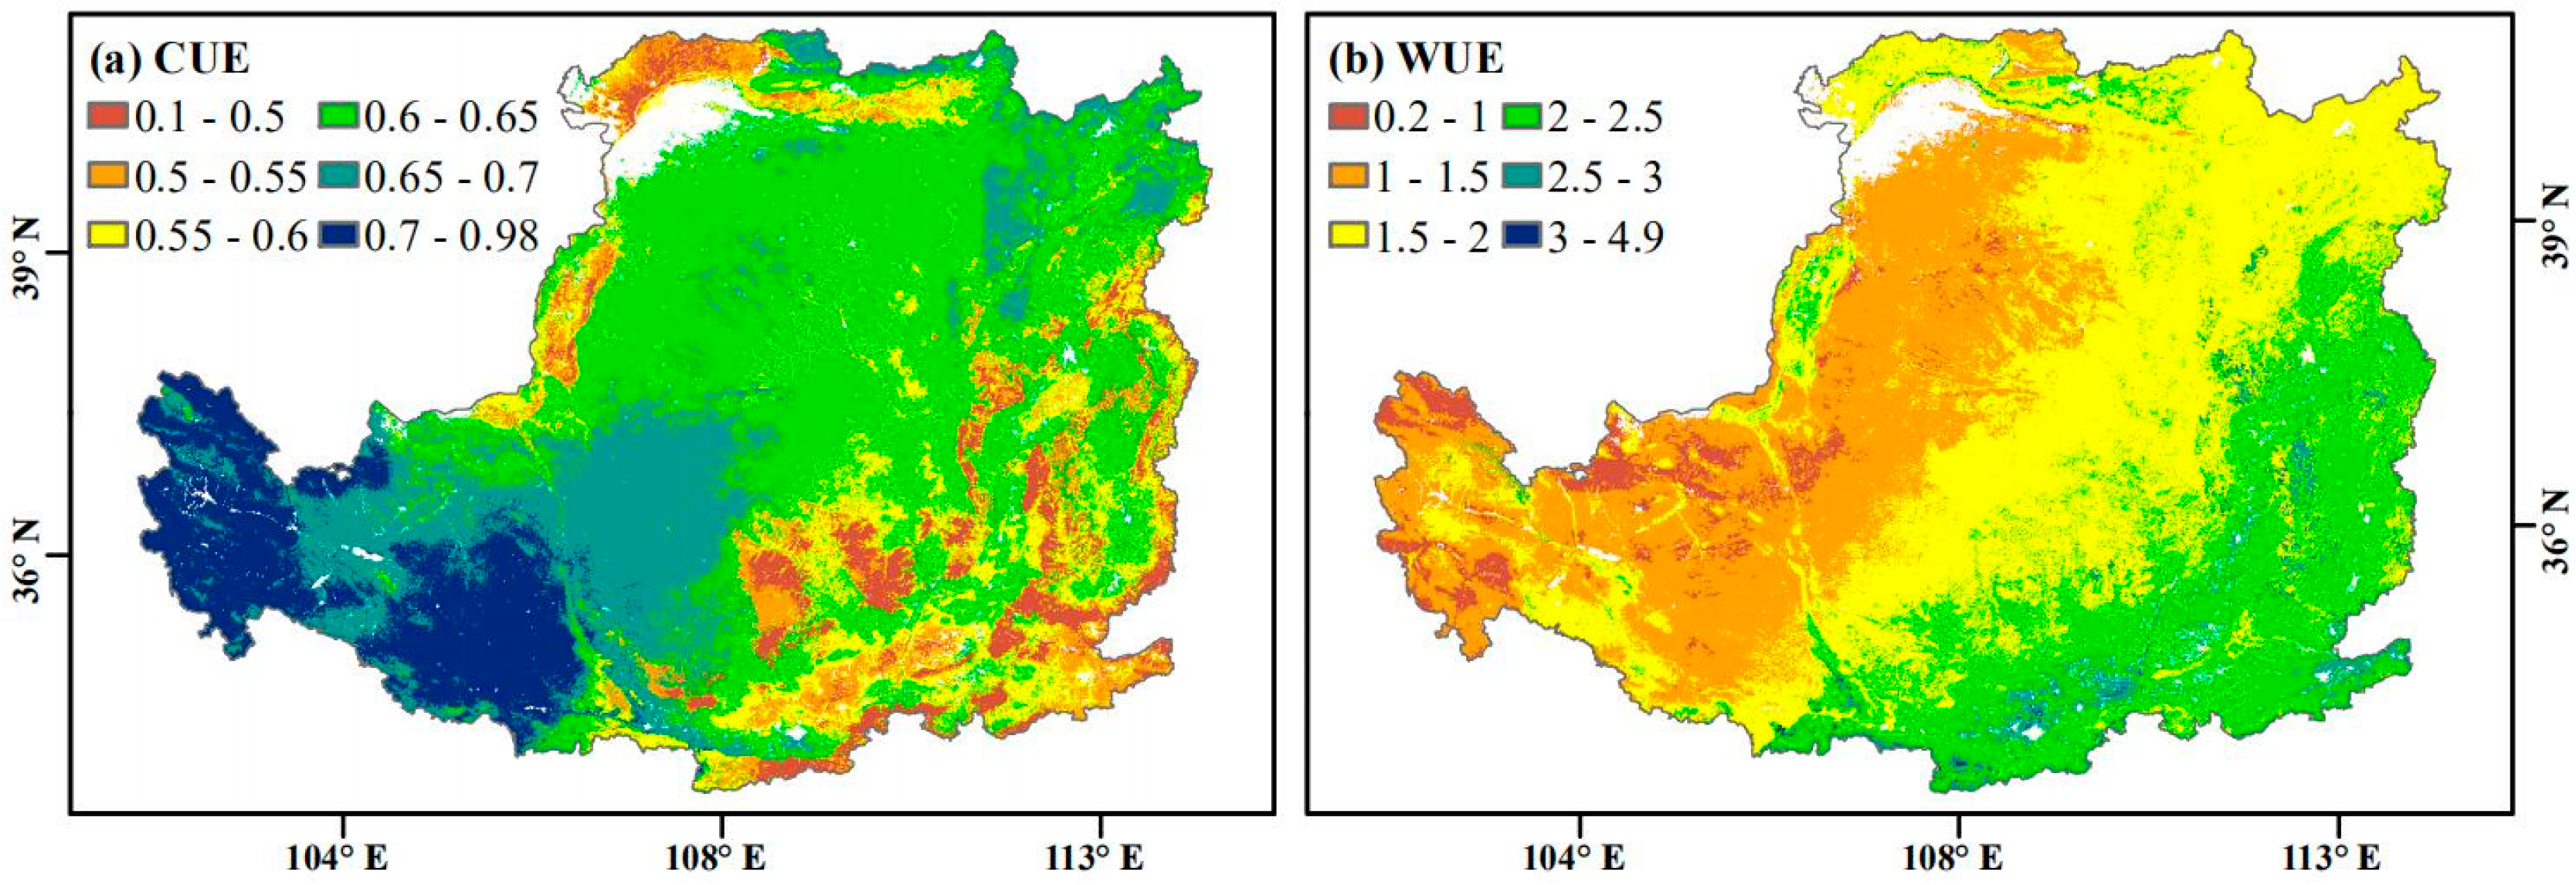
Figure 5.
CUE and WUE for various types of vegetation and trend on the Loess Plateau between 2000 and 2020.
Figure 5.
CUE and WUE for various types of vegetation and trend on the Loess Plateau between 2000 and 2020.

Figure 6.
Trends in precipitation (a) and temperature (b) on the Loess Plateau and their spatial distribution of significance (c,d).
Figure 6.
Trends in precipitation (a) and temperature (b) on the Loess Plateau and their spatial distribution of significance (c,d).
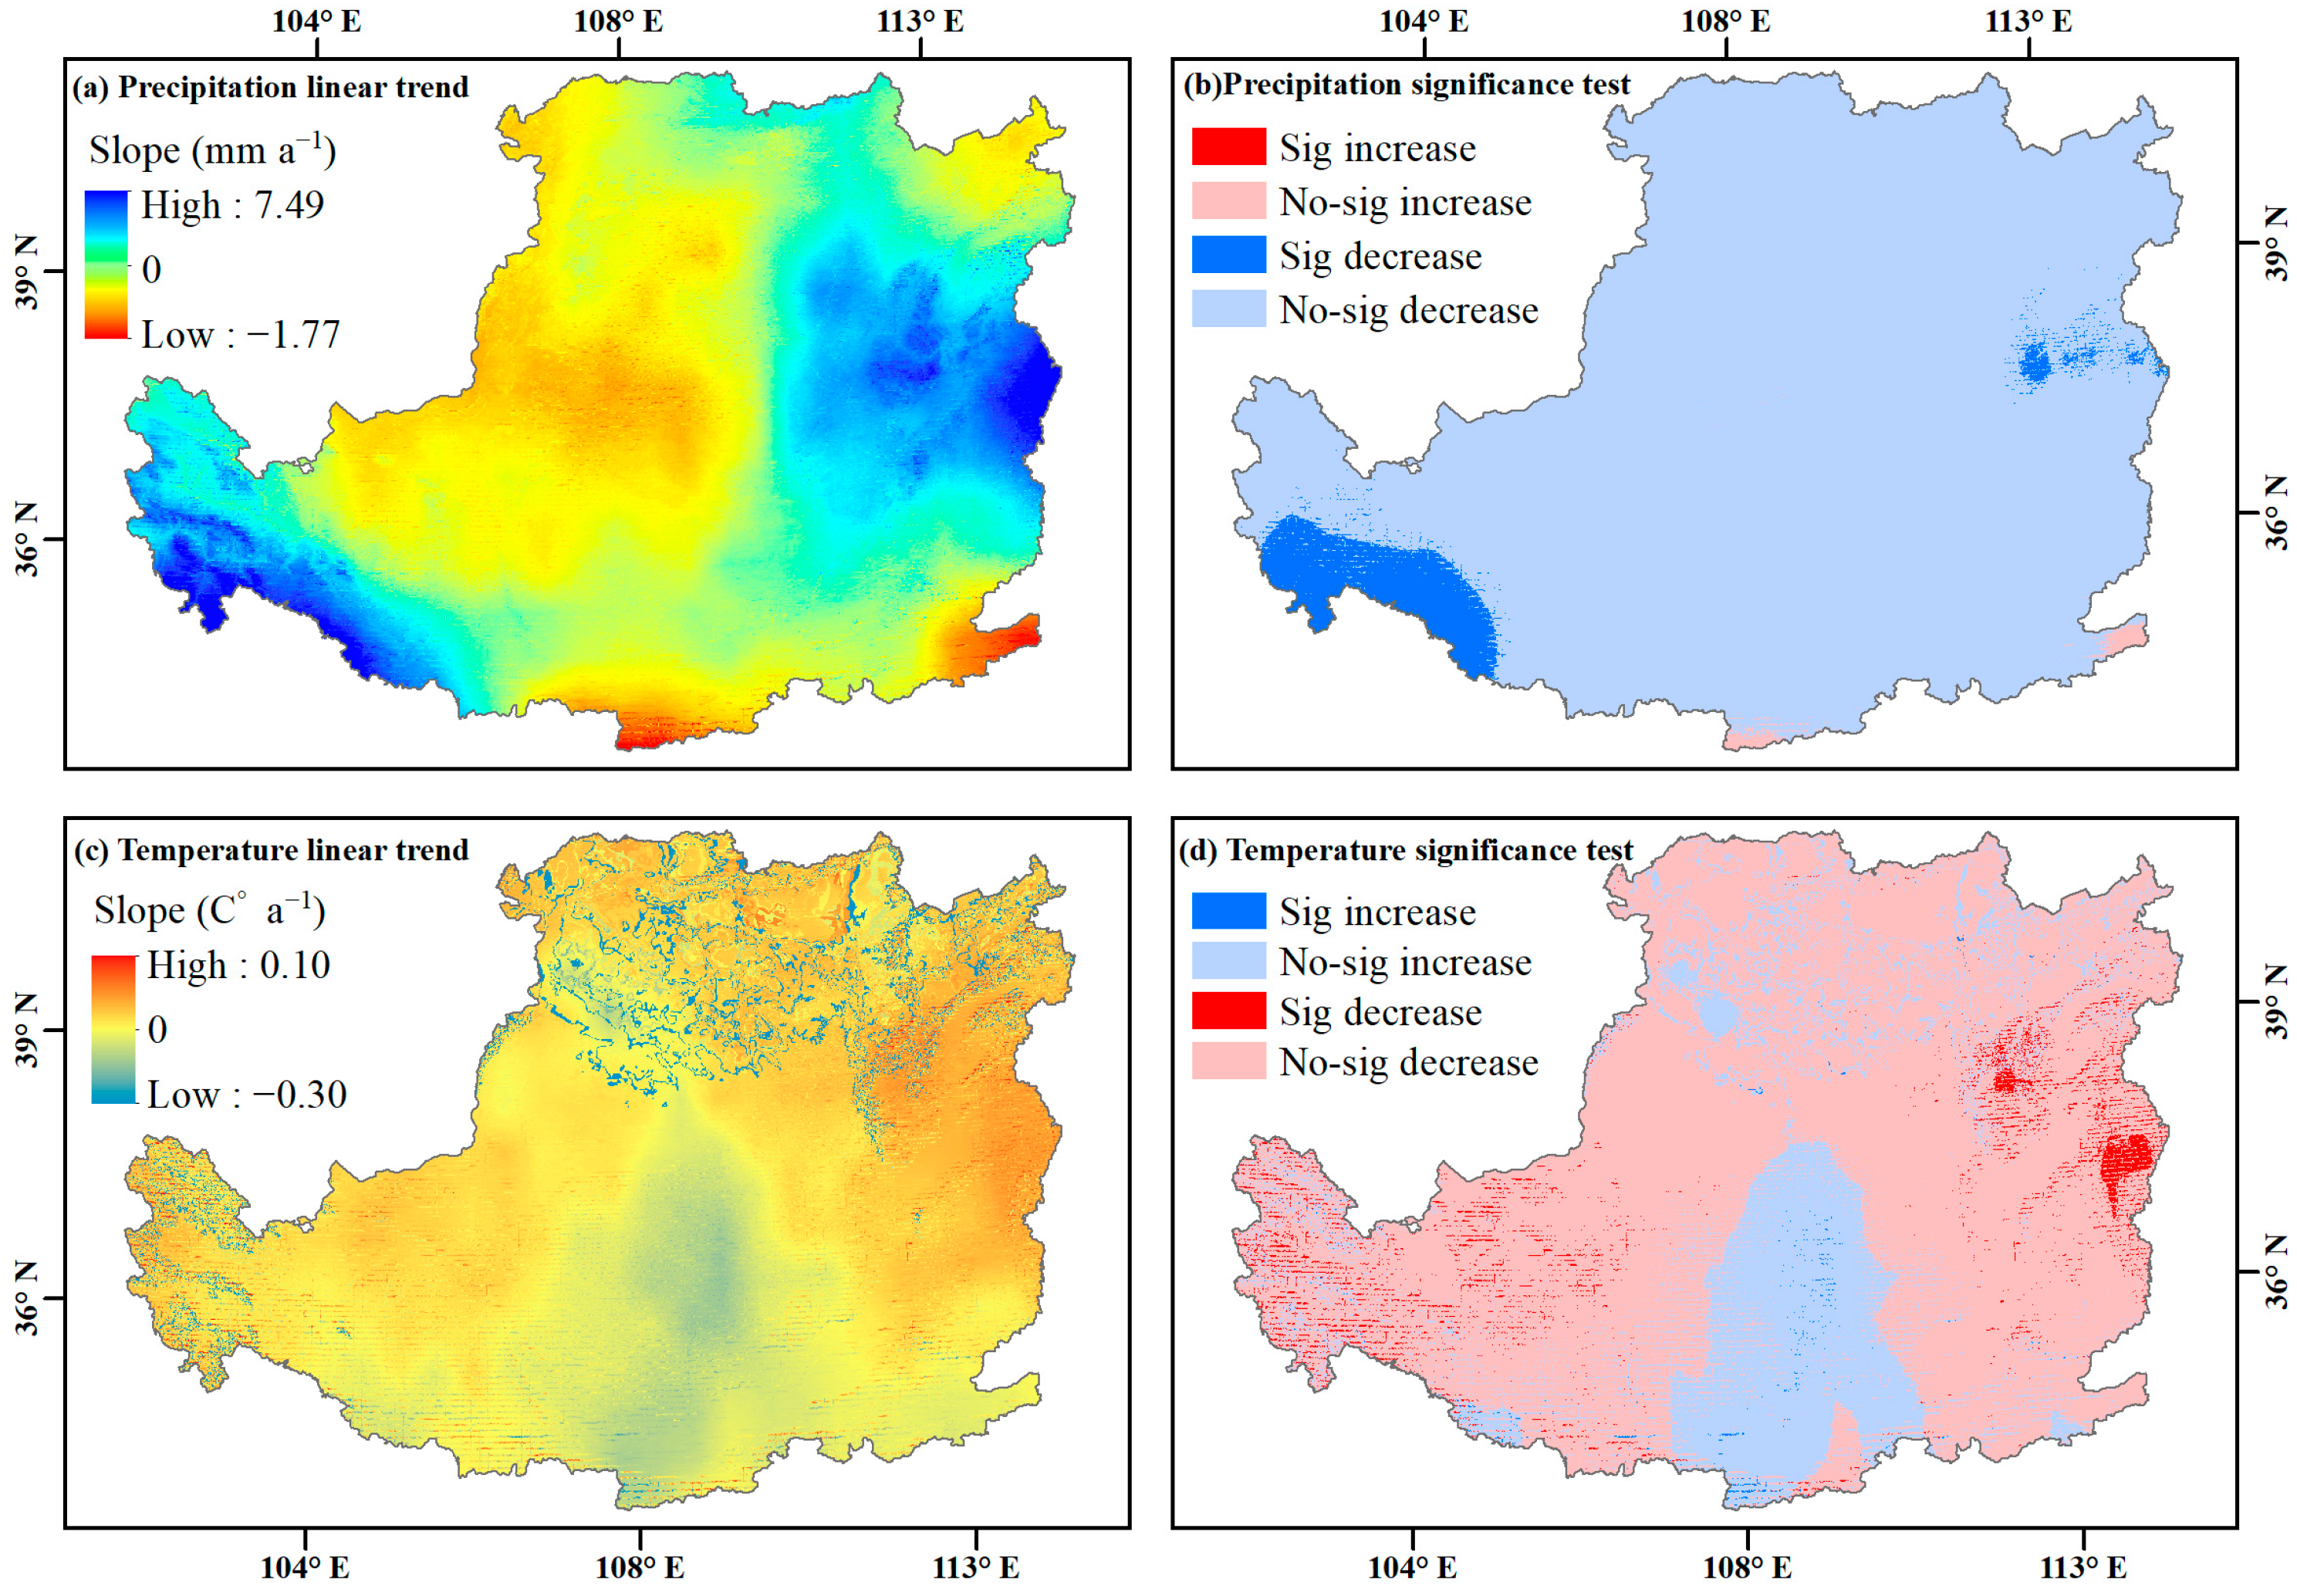
Figure 7.
Significant correlations of CUE and WUE with precipitation (a,b) and temperature (c,d) in the Loess Plateau from 2000 to 2020.
Figure 7.
Significant correlations of CUE and WUE with precipitation (a,b) and temperature (c,d) in the Loess Plateau from 2000 to 2020.
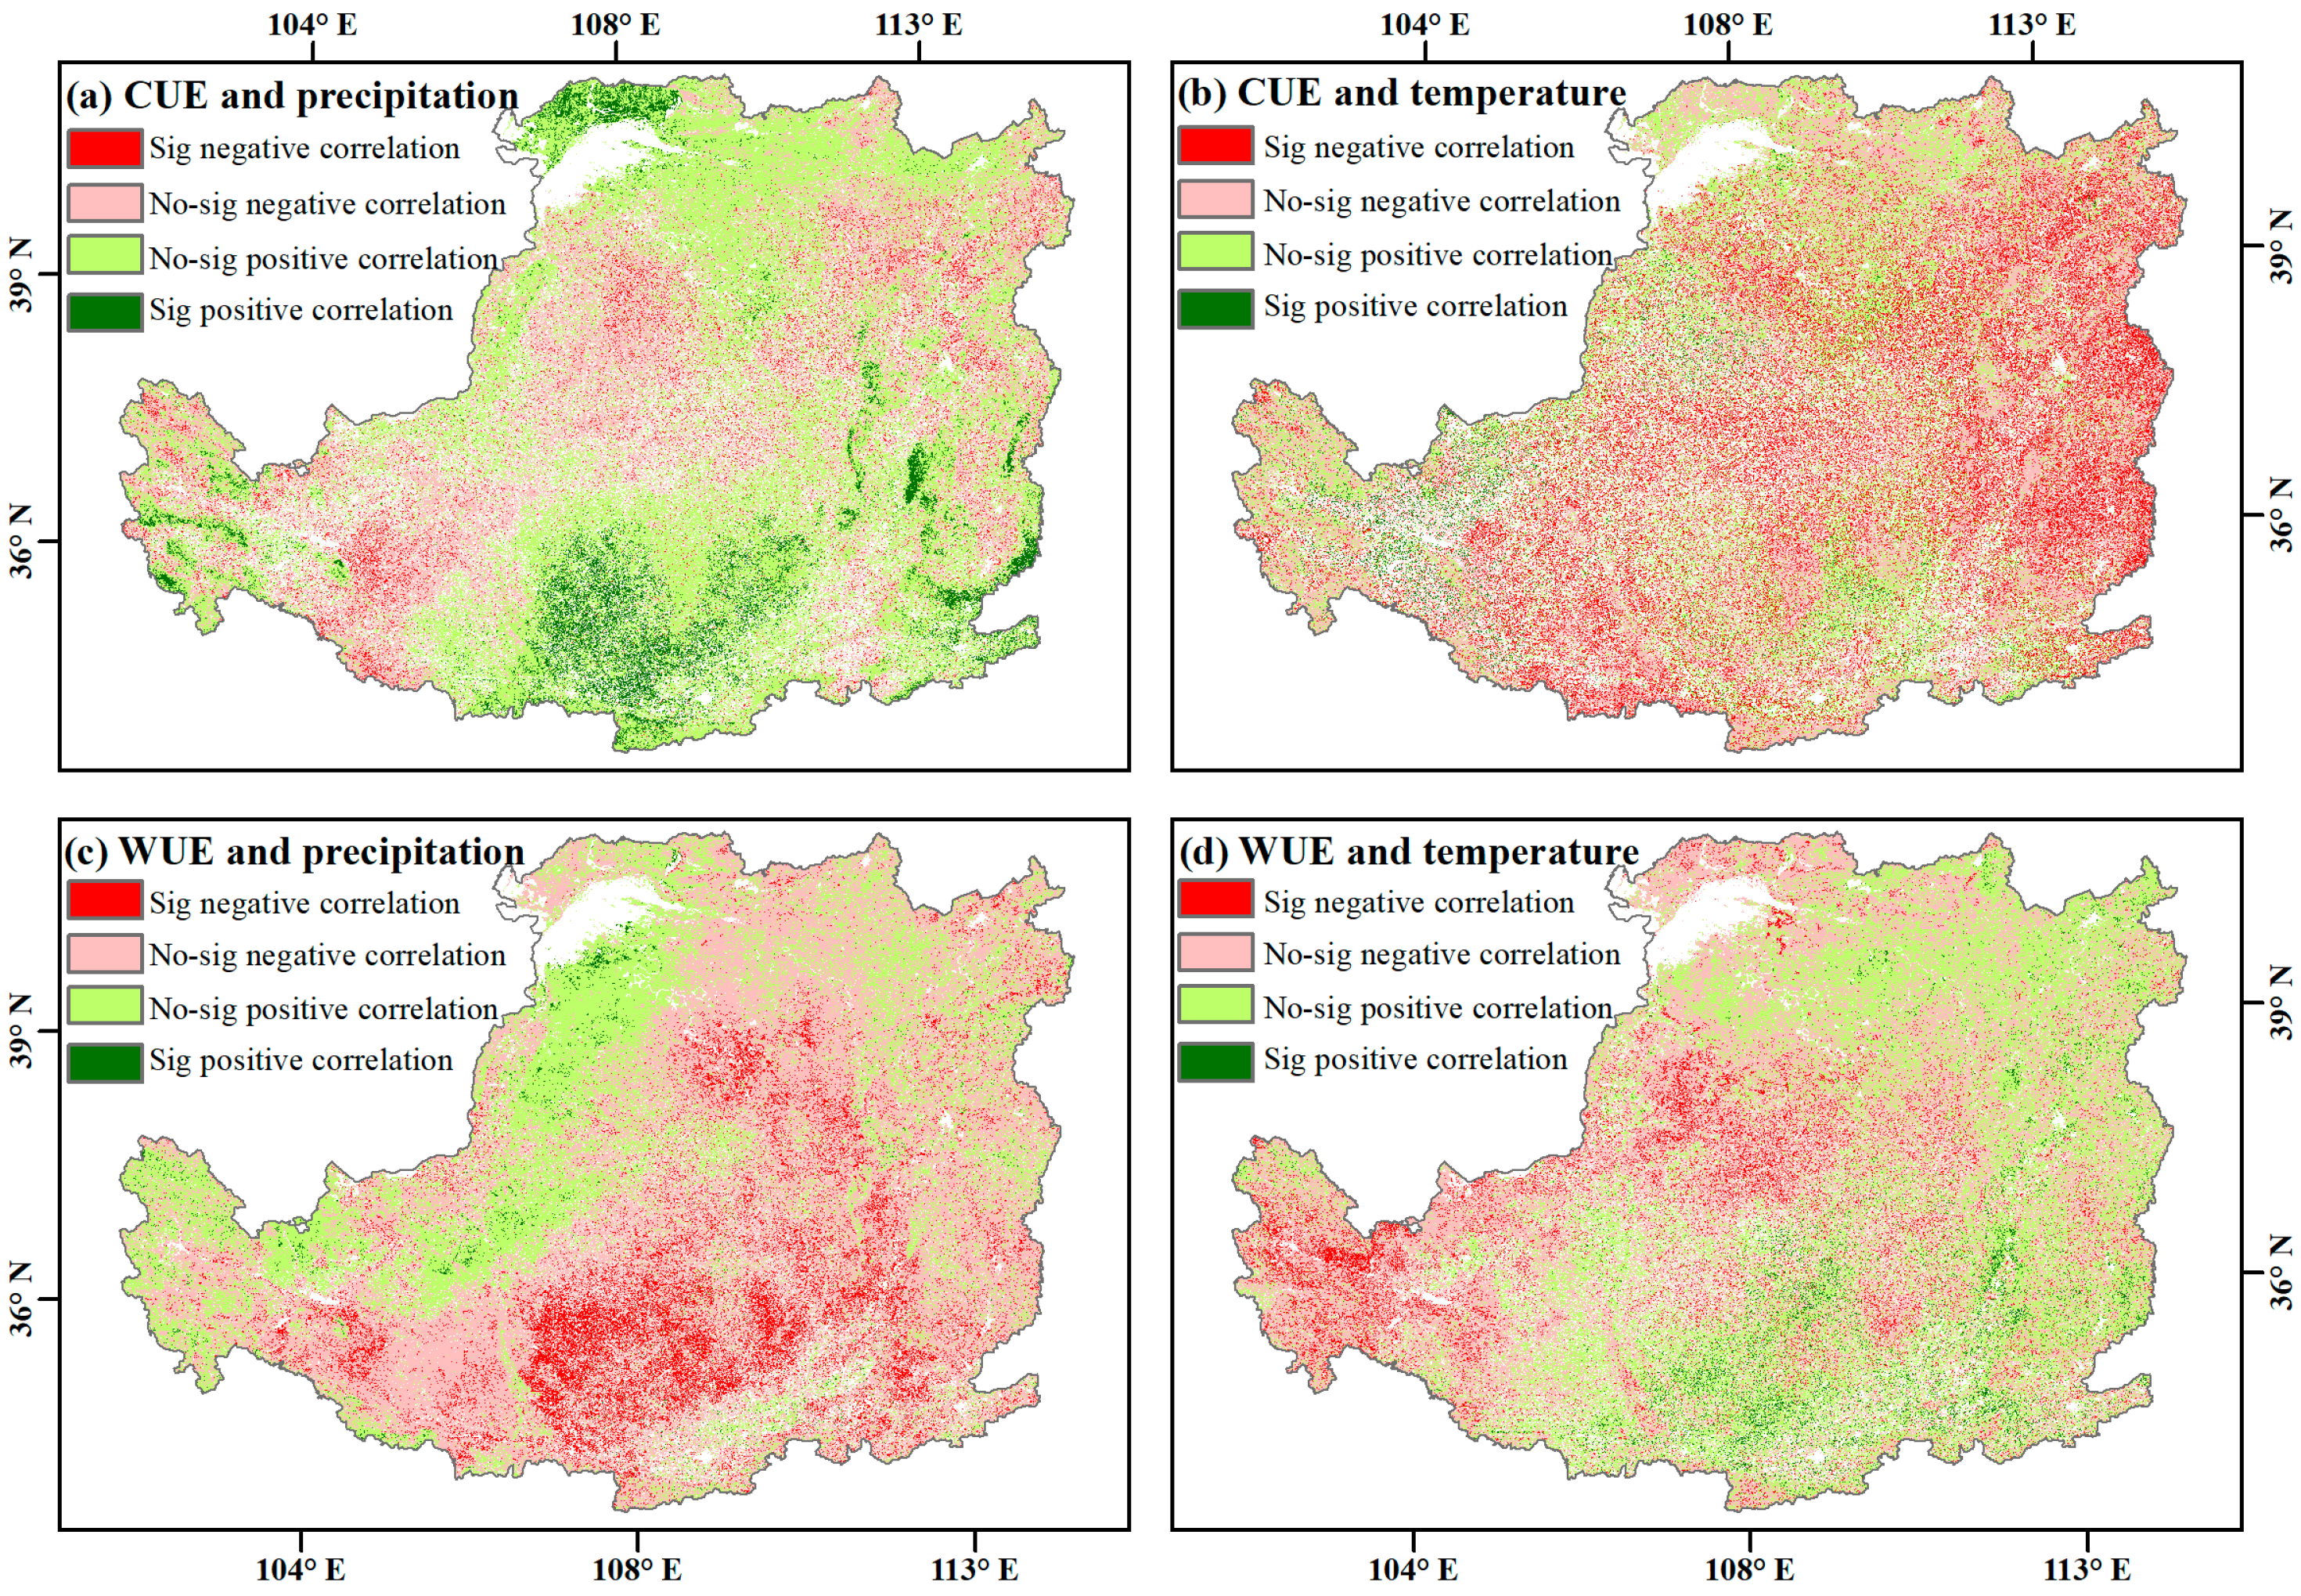
Figure 8.
Correlation coefficients of CUE (a) and WUE (b) with temperature and precipitation for various Loess Plateau vegetation types (∗: p < 0.05; ∗∗: p < 0.01).
Figure 8.
Correlation coefficients of CUE (a) and WUE (b) with temperature and precipitation for various Loess Plateau vegetation types (∗: p < 0.05; ∗∗: p < 0.01).
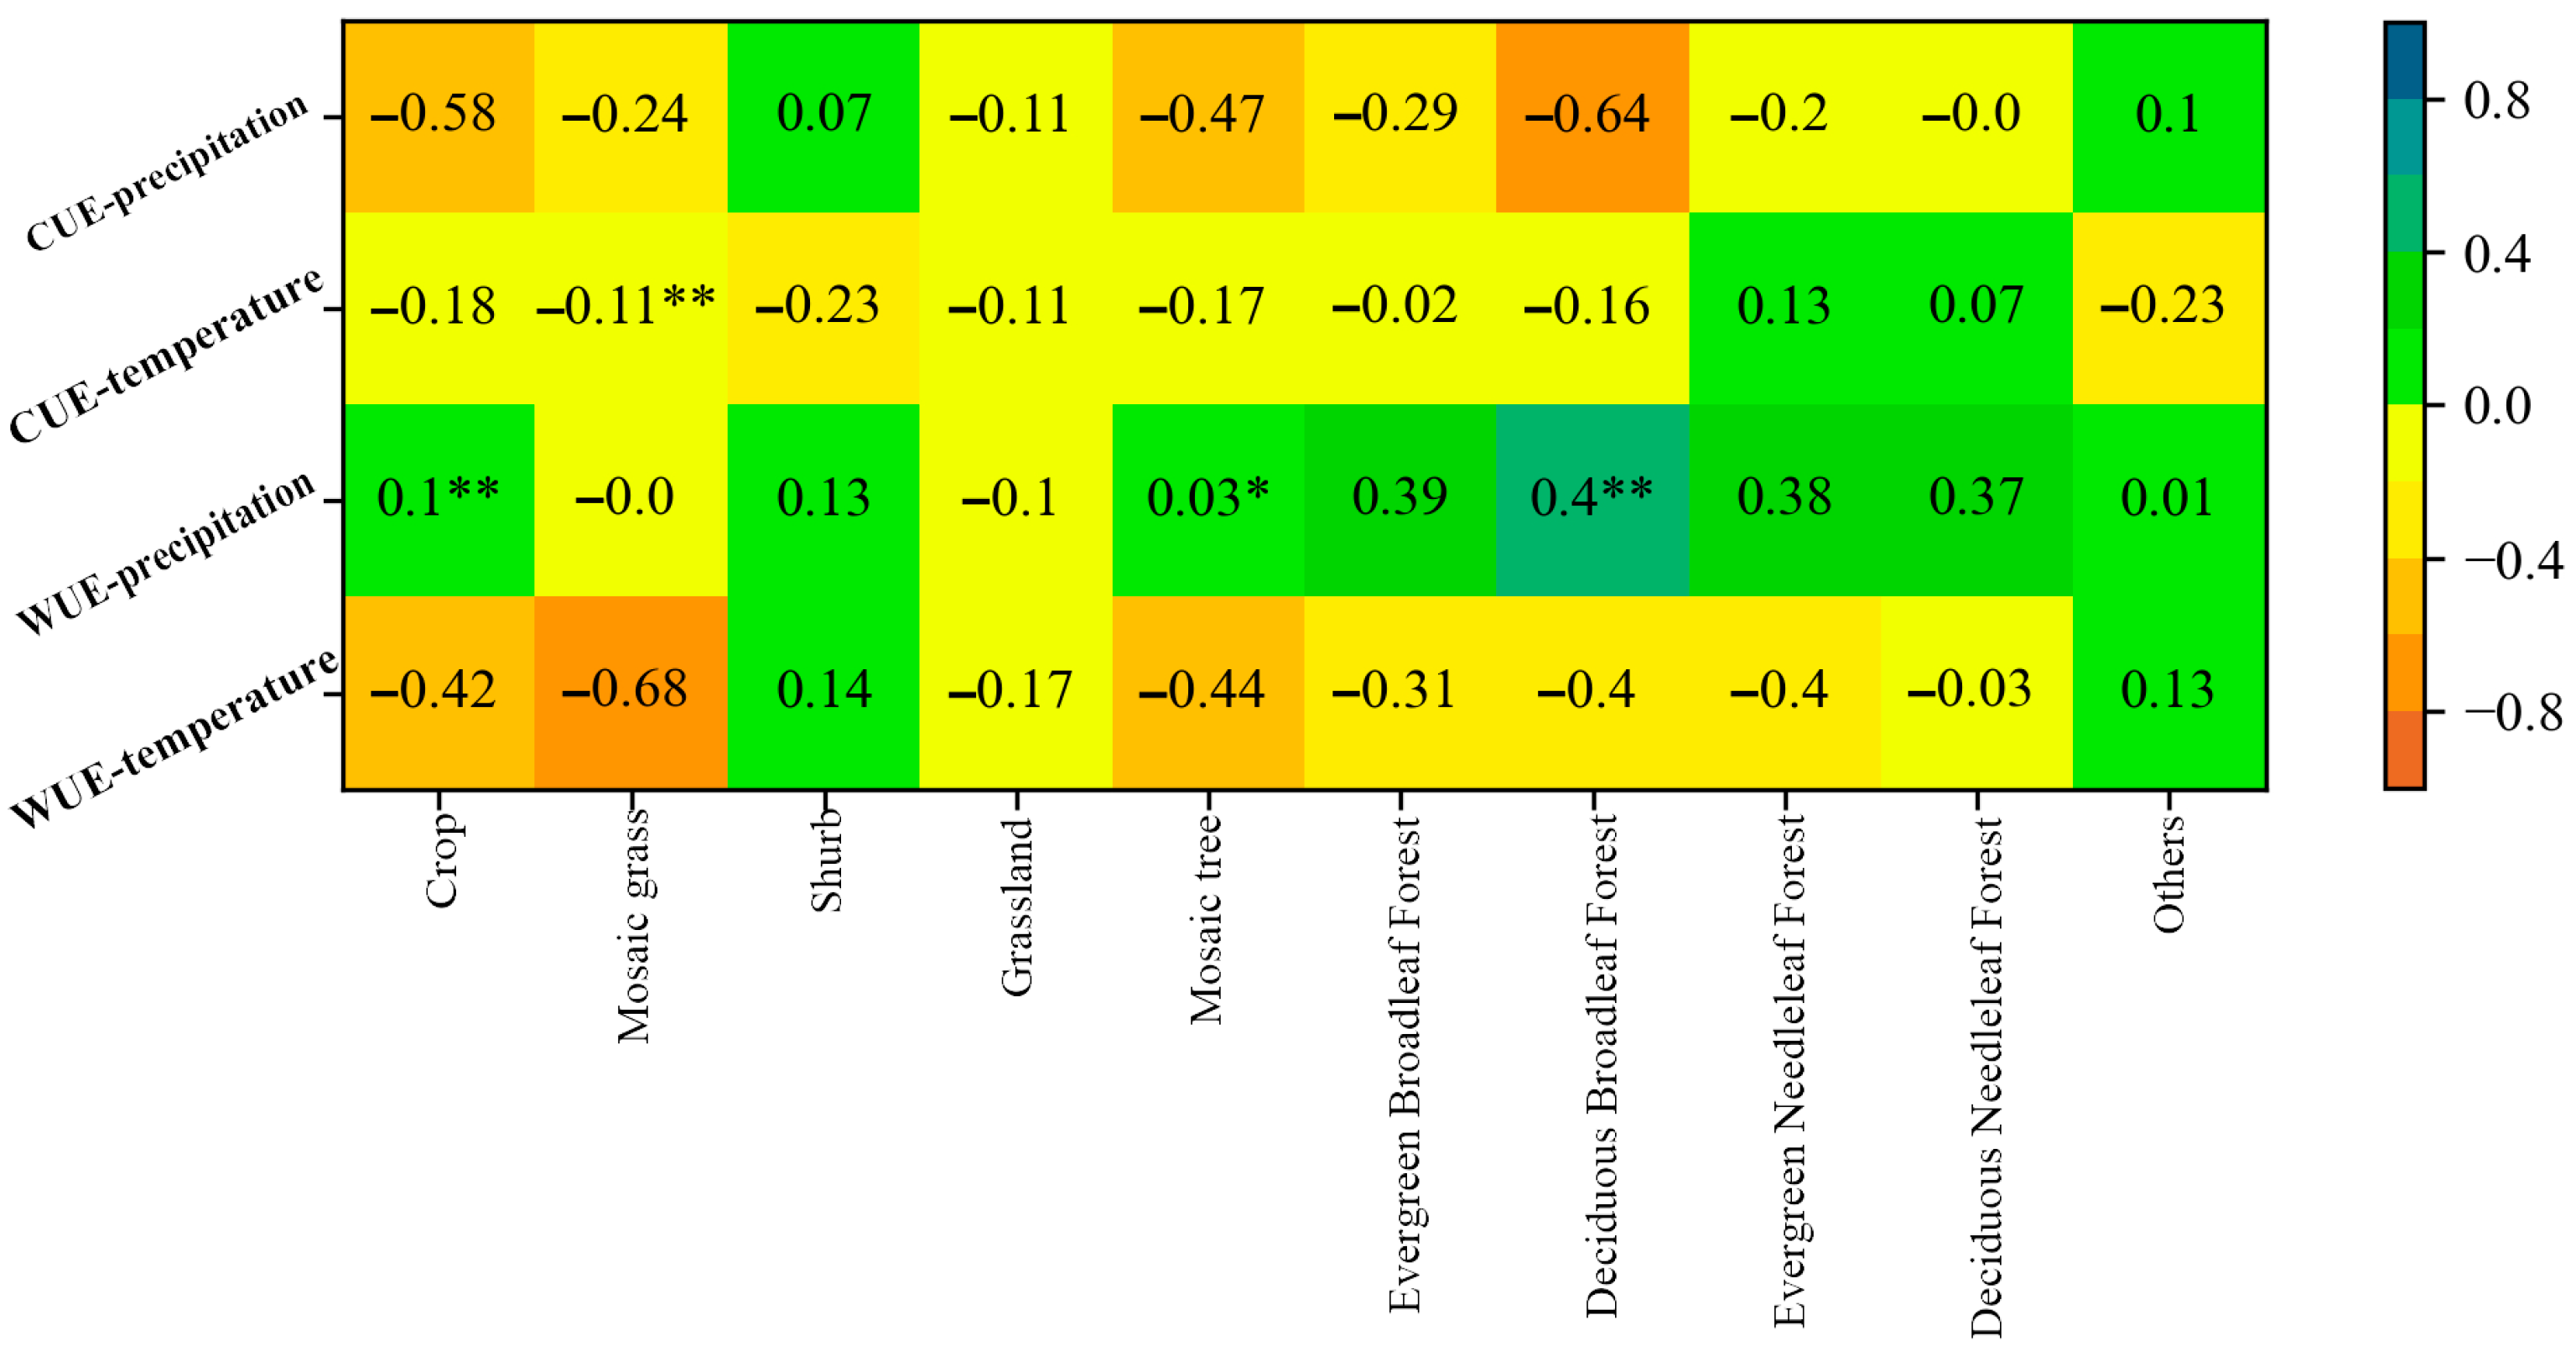
Figure 9.
Residual rate of change in carbon and water use efficiency of vegetation on the Loess Plateau (a) and its significance (b).
Figure 9.
Residual rate of change in carbon and water use efficiency of vegetation on the Loess Plateau (a) and its significance (b).

Figure 10.
Trends of residuals of CUE (a) and WUE (b) for different land use types on the Loess Plateau.
Figure 10.
Trends of residuals of CUE (a) and WUE (b) for different land use types on the Loess Plateau.

Table 1.
MODIS data details.
| Data | Acronym | Data ID | Resolution | Data Format |
|---|---|---|---|---|
| Gross Primary Production | GPP | MOD17A2Hv006 | 500 m·8 d−1 | HDF |
| Net Primary Production | NPP | MOD17A3HGFv-006 | 500 m·a−1 | HDF |
| Evapotranspiration | ET | MOD16A2v006 | 500 m·8 d−1 | HDF |
Disclaimer/Publisher’s Note: The statements, opinions and data contained in all publications are solely those of the individual author(s) and contributor(s) and not of MDPI and/or the editor(s). MDPI and/or the editor(s) disclaim responsibility for any injury to people or property resulting from any ideas, methods, instructions or products referred to in the content. |
© 2022 by the authors. Licensee MDPI, Basel, Switzerland. This article is an open access article distributed under the terms and conditions of the Creative Commons Attribution (CC BY) license (https://creativecommons.org/licenses/by/4.0/).
Share and Cite
MDPI and ACS Style
Zhang, Q.; Lu, J.; Xu, X.; Ren, X.; Wang, J.; Chai, X.; Wang, W. Spatial and Temporal Patterns of Carbon and Water Use Efficiency on the Loess Plateau and Their Influencing Factors. Land 2023, 12, 77. https://doi.org/10.3390/land12010077
AMA Style
Zhang Q, Lu J, Xu X, Ren X, Wang J, Chai X, Wang W. Spatial and Temporal Patterns of Carbon and Water Use Efficiency on the Loess Plateau and Their Influencing Factors. Land. 2023; 12(1):77. https://doi.org/10.3390/land12010077
Chicago/Turabian StyleZhang, Qi, Jinxin Lu, Xuexuan Xu, Xiuzi Ren, Junfeng Wang, Xiaohong Chai, and Weiwei Wang. 2023. "Spatial and Temporal Patterns of Carbon and Water Use Efficiency on the Loess Plateau and Their Influencing Factors" Land 12, no. 1: 77. https://doi.org/10.3390/land12010077
Note that from the first issue of 2016, this journal uses article numbers instead of page numbers. See further details here.