Article

Analysis and Prediction of Spatial and Temporal Evolution of Ecosystem Service Value on the Northern Slopes of the Kunlun Mountains Based on Land Use

College of Grassland Science, Xinjiang Agricultural University, Urumqi 830052, China
*
Author to whom correspondence should be addressed.
Land 2023, 12(12), 2123; https://doi.org/10.3390/land12122123
Submission received: 17 September 2023 / Revised: 16 November 2023 / Accepted: 28 November 2023 / Published: 30 November 2023

Abstract

:
The ecological environment in the mountainous areas of southern Xinjiang is very sensitive and fragile, and identifying the ecological asset retention within the mountainous areas is a top priority at the current stage in the context of comprehensive environmental management in arid zones. This study examines the conversion and ecosystem service values between different land types within the mountainous areas based on a time series of land-use data from 1990 to 2020, and the results show that: (1) The value of ecosystem services on the northern slopes of the Kunlun Mountains shows an overall increasing trend. It increased from CNY 308.645 billion in 1990 to CNY 326.550 billion in 2020. Among them, the value of ecosystem services increased significantly between 2000 and 2010, with an increase of CNY 39.857 billion. Regulatory services accounted for more than 66% of the value of each ecosystem service. (2) Land use on the northern slopes of the Kunlun Mountains has changed significantly since 1990. The areas of cropland, forest land, grassland, watershed, and construction land have all shown an upward trend, with the greatest increase in construction land. The area of unutilized land, on the other hand, has slightly decreased. (3) The value of ecosystem services within the northern slopes of the Kunlun Mountains was spatially high in the south, low in the north, and higher in the west than in the east. The study also found a significant positive spatial correlation between ecosystem service values. In the spatial distribution, the increasing areas were mainly distributed in the southeast, and the decreasing areas were in the north. Changes in land types are expected to include an increase in the area of grassland and woodland, a decrease in unutilized land and cropland, and an overall improvement in the ecological environment of the northern slopes of the Kunlun Mountains in the next decade. This study also provides lessons and references for sustainable development and ecological protection in ecologically fragile regions.

1. Introduction

Ecosystem services are service functions that humans derive directly or indirectly from the structure, function, and construction of ecosystems that benefit human development and productive life [1]. They include service functions that can be commercialized, i.e., direct values such as provisioning services (food, water, production of raw materials, etc.) and cultural services (recreation, cultural benefits, etc.), and service functions that are difficult to commercialize, i.e., indirect values such as regulating services (flooding, climate regulation, etc.) and supporting services (carbon dioxide fixation, etc.). Commercialized service functions are usually derived from services that are difficult to commercialize [2].
Ecosystem services are also the most important bridge for humans to connect with nature. Following the development of a global ecosystem service value (ESV) paradigm by Daily and Costanza et al. [1,3] in the 1990s, ecosystem service research has made enormous progress. In 1999, Chinese scholar Ouyang et al. [4] clarified the basic concept of ecosystem services in China, proposing that the value of terrestrial ecosystem services can be applied to the process of valuation developed by Chinese scholars Xie et al. [5]. Based on the Costanza assessment model, this approach adjusts ESV coefficients according to the actual situation of Chinese ecosystems. It also establishes a set of ESV coefficients that can be widely used to assess the value of ecosystems in Chinese provinces and cities [6], lakes [7], and plateaus [8], providing Chinese scholars with verified calculation methods when conducting regional ecosystem research. This approach is now widely used in China.
Currently, there are two types of methods for valuing the value of ecosystem services. One is the functional value method, which is based on the functional price per unit of service, and the other is the equivalent factor method, which is based on the equivalent factor of value per unit of area [9,10,11]. The functional value method requires more input parameters and a cumbersome calculation process and has no way to standardize the evaluation methods and parameters of different service values, which estimates different types of service values prone to error [12]. On the contrary, the equivalent factor approach not only requires less data, but is also more intuitive and convenient and is more suitable for valuing the value of ecosystem services on a regional or global scale. Compared with the functional value approach, the equivalent factor approach has the advantages of fewer data requirements, more objective results, and comprehensive assessment types, so it is commonly used in the study of valuing the value of ecosystem services in China [13].
Land is a prerequisite for human agricultural production activities and regional socio-economic progress [14]. Land-use datasets are the most fundamental manifestation of the interaction between humans and the terrestrial natural environment. Land-use datasets are also a major driver of environmental change in the biosphere [15]. The transformation of land-use types leads to changes in ecosystem service functions and structures, and these changes affect ESV [16,17]. Currently, in the context of intensified modernization and excessive human intervention in ecosystems, the harmful use of land has accelerated the degree of convergence between land-use types, leading to serious damage to ecosystems, intensified changes in the value of ecosystem services, and deterioration of the ecological environment [18].
The Kunlun Mountains are located at the northern edge of the Qinghai-Tibet Plateau [19], which is an extremely fragile ecological area in the arid zone of northwest China. As such, it is highly sensitive to climate change. The northern slopes of these mountains provide the source for many of the rivers and streams flowing into the Tarim River. However, in the context of global warming and the acceleration of the water cycle [20,21], the excessive expansion of human activities and the unreasonable deployment of environmental resources in recent years have caused the ecology of the Kunlun Mountains to be seriously affected. This has resulted in several major ecological problems, such as the degradation of natural grasslands, the decrease in glacier area, the unsustainable use of water resources, and the intensification of desertification [22,23,24,25,26], causing the already fragile ecological environment of the Kunlun Mountains to become even more fragile [27,28]. At present, other scholars’ studies on the value of ecosystem services in southern Xinjiang have focused on the Tarim River Basin [29], the Aksu River [30], the Kaidu River [31], etc., and there are fewer long-term time-series studies on the value of ecosystem services on the northern slopes of the Kunlun Mountains, and this study fills in the blank period of ecological monitoring of the northern slopes of the Kunlun Mountains, and provides scientific basis for the construction of the northern slopes of the Kunlun Mountains ecological environment.
In view of the above, the present paper assesses the value of ecosystem services on the northern slopes of the Kunlun Mountains based on long-term remote sensing data. It also uses an exploratory spatial analysis method to quantitatively analyze the spatial and temporal trends of ESV in the study area and to explore the root causes of the region’s ecosystem problems. This work will provide a scientific basis for the sustainable utilization of resources and ecological and environmental management in the mountainous areas of the Kunlun Mountains.

2. Data and Materials

2.1. Study Area

The northern slopes of the Kunlun Mountains are in the arid center of Asia and Europe at 74°80′–93°02′ E and 34°83′–40°55′ N (Figure 1), covering an area of up to 4.34 × 10⁵ km2. To the north, it includes the Tarim Basin. The southern portion of the study area is connected to the Qinghai-Tibet Plateau, creating an overall gradual rise in elevation from east to west. The northern slopes of the Kunlun Mountains constitute five main parts, namely the Kumkuri Basin, the Qarqan River Basin, the Keriya Valley, the Hotan River Basin, and the Yarkant River Basin. All these areas are important sources of external water recharge for the oases on the southern edge of the Tarim River Basin.
The study area is part of the Mongolian-Siberian dry anticyclone control range and features a continental climate characterized by strong aridity and little precipitation. The arid climate combines with the high altitude and low temperatures to result in an ecological environment dominated by grasslands and little species variety, along with oases that are mainly distributed at 1360–1500 m above sea level. Elevation (DEM) is an important factor affecting the distribution of plants and animals in the study area, and the Gobi, where plants and animals are scarce, is mainly distributed in the range of 1500–1950 m above sea level. As DEM increases, vegetation types such as mountain desert grassland, mountain typical grassland, and alpine grassland appear. Similar to other parts of the study area, precipitation in the oases and Gobi is scarce, with an average annual precipitation of only 34.8 mm.

2.2. Data Sources

The current land-use data were obtained from the annual China Land Cover Dataset published by Wuhan University [32]. These data cover the northern slopes of the Kunlun Mountains from 1990 to 2020, with a spatial resolution of 30 m and an overall classification accuracy of more than 80%. The classification of land types was selected from the unified land-use classification of the Chinese Academy of Sciences, and the dataset was reclassified into six land-use types: cropland, woodland, grassland, water, construction land, and barren land (Table 1). Around 80~110 sample points were randomly selected for each land type. The accuracy of interpretation was verified with the help of Google Earth images (Kappa > 0.78), and the results met the requirements of the study.
Temperature and precipitation data were obtained from the National Heating Data Center, which is part of the National Oceanic and Atmospheric Administration, with a spatial resolution of 1km. Differences in the stations included in the study area were processed using the spatial interpolation module of ArcGIS 10.2 software in accordance with the needs of the study. Topographic and slope data were taken from the SRTM DEM data in the Geospatial Data Cloud (http://www.gscloud.cn (accessed on 8 March 2023)) with a spatial resolution of 30 m.
Socio-economic data mainly include population density data and GDP (Gross Domestic Product) data, which were obtained from the Center for Resource and Environmental Science and Data (http://www.resdc.cn(accessed on 16 March 2023)) with a spatial resolution of 1 km. Some other data come from the Xinjiang Statistical Yearbook, Xinjiang Production and Construction Corps Statistical Yearbook, and the website of the Xinjiang Uygur Autonomous Region Bureau of Statistics (http://www.xjtj.gov.cn/ (accessed on 16 March 2023)) for the period 1990–2020.

2.3. Single Land-Use Dynamic Attitude

Based on the dynamic attitude, it is possible to understand and analyze the transformation rates between various land types on the northern slopes of the Kunlun Mountains for different time periods. Additionally, it is possible to estimate and predict change trends in land type [33] using land-use data in the study area for 1990, 2000, 2010, and 2020, as follows:
K = M a M b M b × 1 T × 100 %
where Ma and Mb are the areas of one type of land use in the designated area at the beginning and end of the study, T is the length of the study time, and K is the annual rate of change in one land-use type during the study period.

2.4. Calculation of the Value of Ecosystem Services

In this study, the improved Costanza evaluation model, which was modified by Xie et al. [34], was used to derive the Chinese ESV equivalents (Table 2). The model was modified again to fit the actual situation of the northern slopes of the Kunlun Mountains [35]. Please note that construction land only has the ESV of cultural recreation [36]. With the help of the ArcGIS 10.2 software fishnet tool, the study area was divided into 11,309 grids measuring 8 km × 8 km [37]. The area of each category within the grids was calculated separately using the natural breakpoint method to spatialize ESV and its gains and losses, which are calculated as follows:
E S V = A a × V C a E S V b = A a × V C b a
where ESV is ecosystem service value, ESVb is the value of ecosystem services in item b, Aa is the area of land-use type a in the study area, and VCa is the coefficient of ecological service value of land-use type a. VCba represents the value of the b ecosystem services of land-use type a.

2.5. Ecosystem Service Change Index

Changes in the value of ecosystem services are determined by the value of the ecosystem services Change Index (ESCI) [38], with the “±” in ESCI indicating the relative gain or loss of each ecosystem service. It is calculated by the formula
E S C I x = E S C U R x E S H I S s E S H I S s
where ESCIx denotes the single ecosystem service change index, and ESHISs and ESCURx correspond to the value of ecosystem services in the initial and final states during the study period, respectively. ESCI > 0 indicates a gain, ESCI < 0 indicates a loss, and ESCI = 0 indicates no change.

2.6. Spatial Autocorrelation Analysis

In this study, the Global Moran’s I and Univariate Local Moran’s I of the GeoDa model were used to explore clustering and anomalies in the ESV spatial distribution pattern [39]. The LISA (Local Indicators of Spatial Association) model is a statistical model used to analyze geospatial data. It is mainly used to study the degree of spatial aggregation and spatial correlation of geographic phenomena [40]. The core idea of the LISA model is based on the concept of spatial autocorrelation. In this paper, we use Moran’s I Index to analyze and determine the spatial distribution pattern of geographic phenomena and finally obtain the LISA clustering map. The output of the LISA model is usually a LISA clustering map, which is used to visualize the spatial distribution pattern of geographic phenomena. The LISA clustering map divides the geographic units into four quadrants: High–High (H–H), Low–Low (L–L), High–Low (H–L), and Low–High (L–H). The H–H quadrant indicates that high-value geographic units are surrounded by clusters of high-value geographic units, the L–L quadrant indicates that low-value geographic units are surrounded by clusters of low-value geographic units, the H–L quadrant indicates that high-value geographic units are surrounded by discrete areas of low-value geographic units, and the L–H quadrant indicates that low-value geographic units are surrounded by discrete areas of high-value geographic units. LISA can show the spatial heterogeneity of ecosystem service values on the northern slopes of the Kunlun Mountains and provide a reference for trade-offs and synergies among ecosystem service values on the northern slopes of the Kunlun Mountains. Furthermore, Gi* was used to explore special values of spatial variations of ESV clustering distribution characteristics, i.e., high-value clustering (hot spots) and low-value clustering (cold spots). The equations are, respectively:
I i = x i X ¯ S i 2 j = 1 , j i n w i j ( x j X ¯ )
S i 2 = j = 1 , j i n ( x j X ¯ ) 2 n 1
where xi is the value of factor i, x ¯ is the average of the factor values, wij is the spatial weight matrix between factors i and j, n is the total number of factors, and s is the standard deviation of all factors from 1 to n.
G i * = j = 1 n w i j x j X i = 1 n w i j [ n j = 1 n w i j 2 j = 1 n w i j 2 ] / ( n 1 ) s
X = 1 n i = 1 n x i , S = 1 n i = 1 n x i 2 X 2
where xj is the original attribute value of factor j, wij is the weight representation between factor i and factor j (adjacent weight value is 1; non-adjacent weight value is 0), and n is the total number of all sampled points. X is the mean of all factors from 1 to n, and S is the standard deviation of all factors from 1 to n.

2.7. CA–Markov Model

In this study, the CA–Markov model was used to simulate future land use on the northern slopes of the Kunlun Mountains. Markov modeling is a prediction method based on Markov chains that predicts the changing conditions of events at various moments in the future based on their current conditions [41]. The Markov prediction method is one of the important prediction methods in geographic prediction research. Land use is consistent with the Markov prediction process [42]. The formula is:
S ( t + 1 ) = P i j × S t
P i j = P 11 P 1 n P n 1 P n n
[ 0 P i j < 1   a n d j = 1 n P i j = 1 i . j = 1,2 n ]
where S(t+1) is the system state at period t + 1 and Pij is the state transfer probability matrix.
In this study, in order to test the accuracy and feasibility of the CA–Markov model for future land-use analysis, we first simulated the land-use data in 2010 with the CA–Markov model in Idrisi 17.0 prediction software and then compared the simulated land-use data in 2010 with the real values, which verified the model’s reliability is more, and it meets the research requirements. The real land-use value in 2010 was used as the starting year to simulate the land-use changes in the study area in 2030, and all the images processed in Idrisi software were raster data. The land raster size used in this paper is 30 m × 30 m, and the spatial data processing is carried out in ArcGIS 10.2 software.

3. Results and Analysis

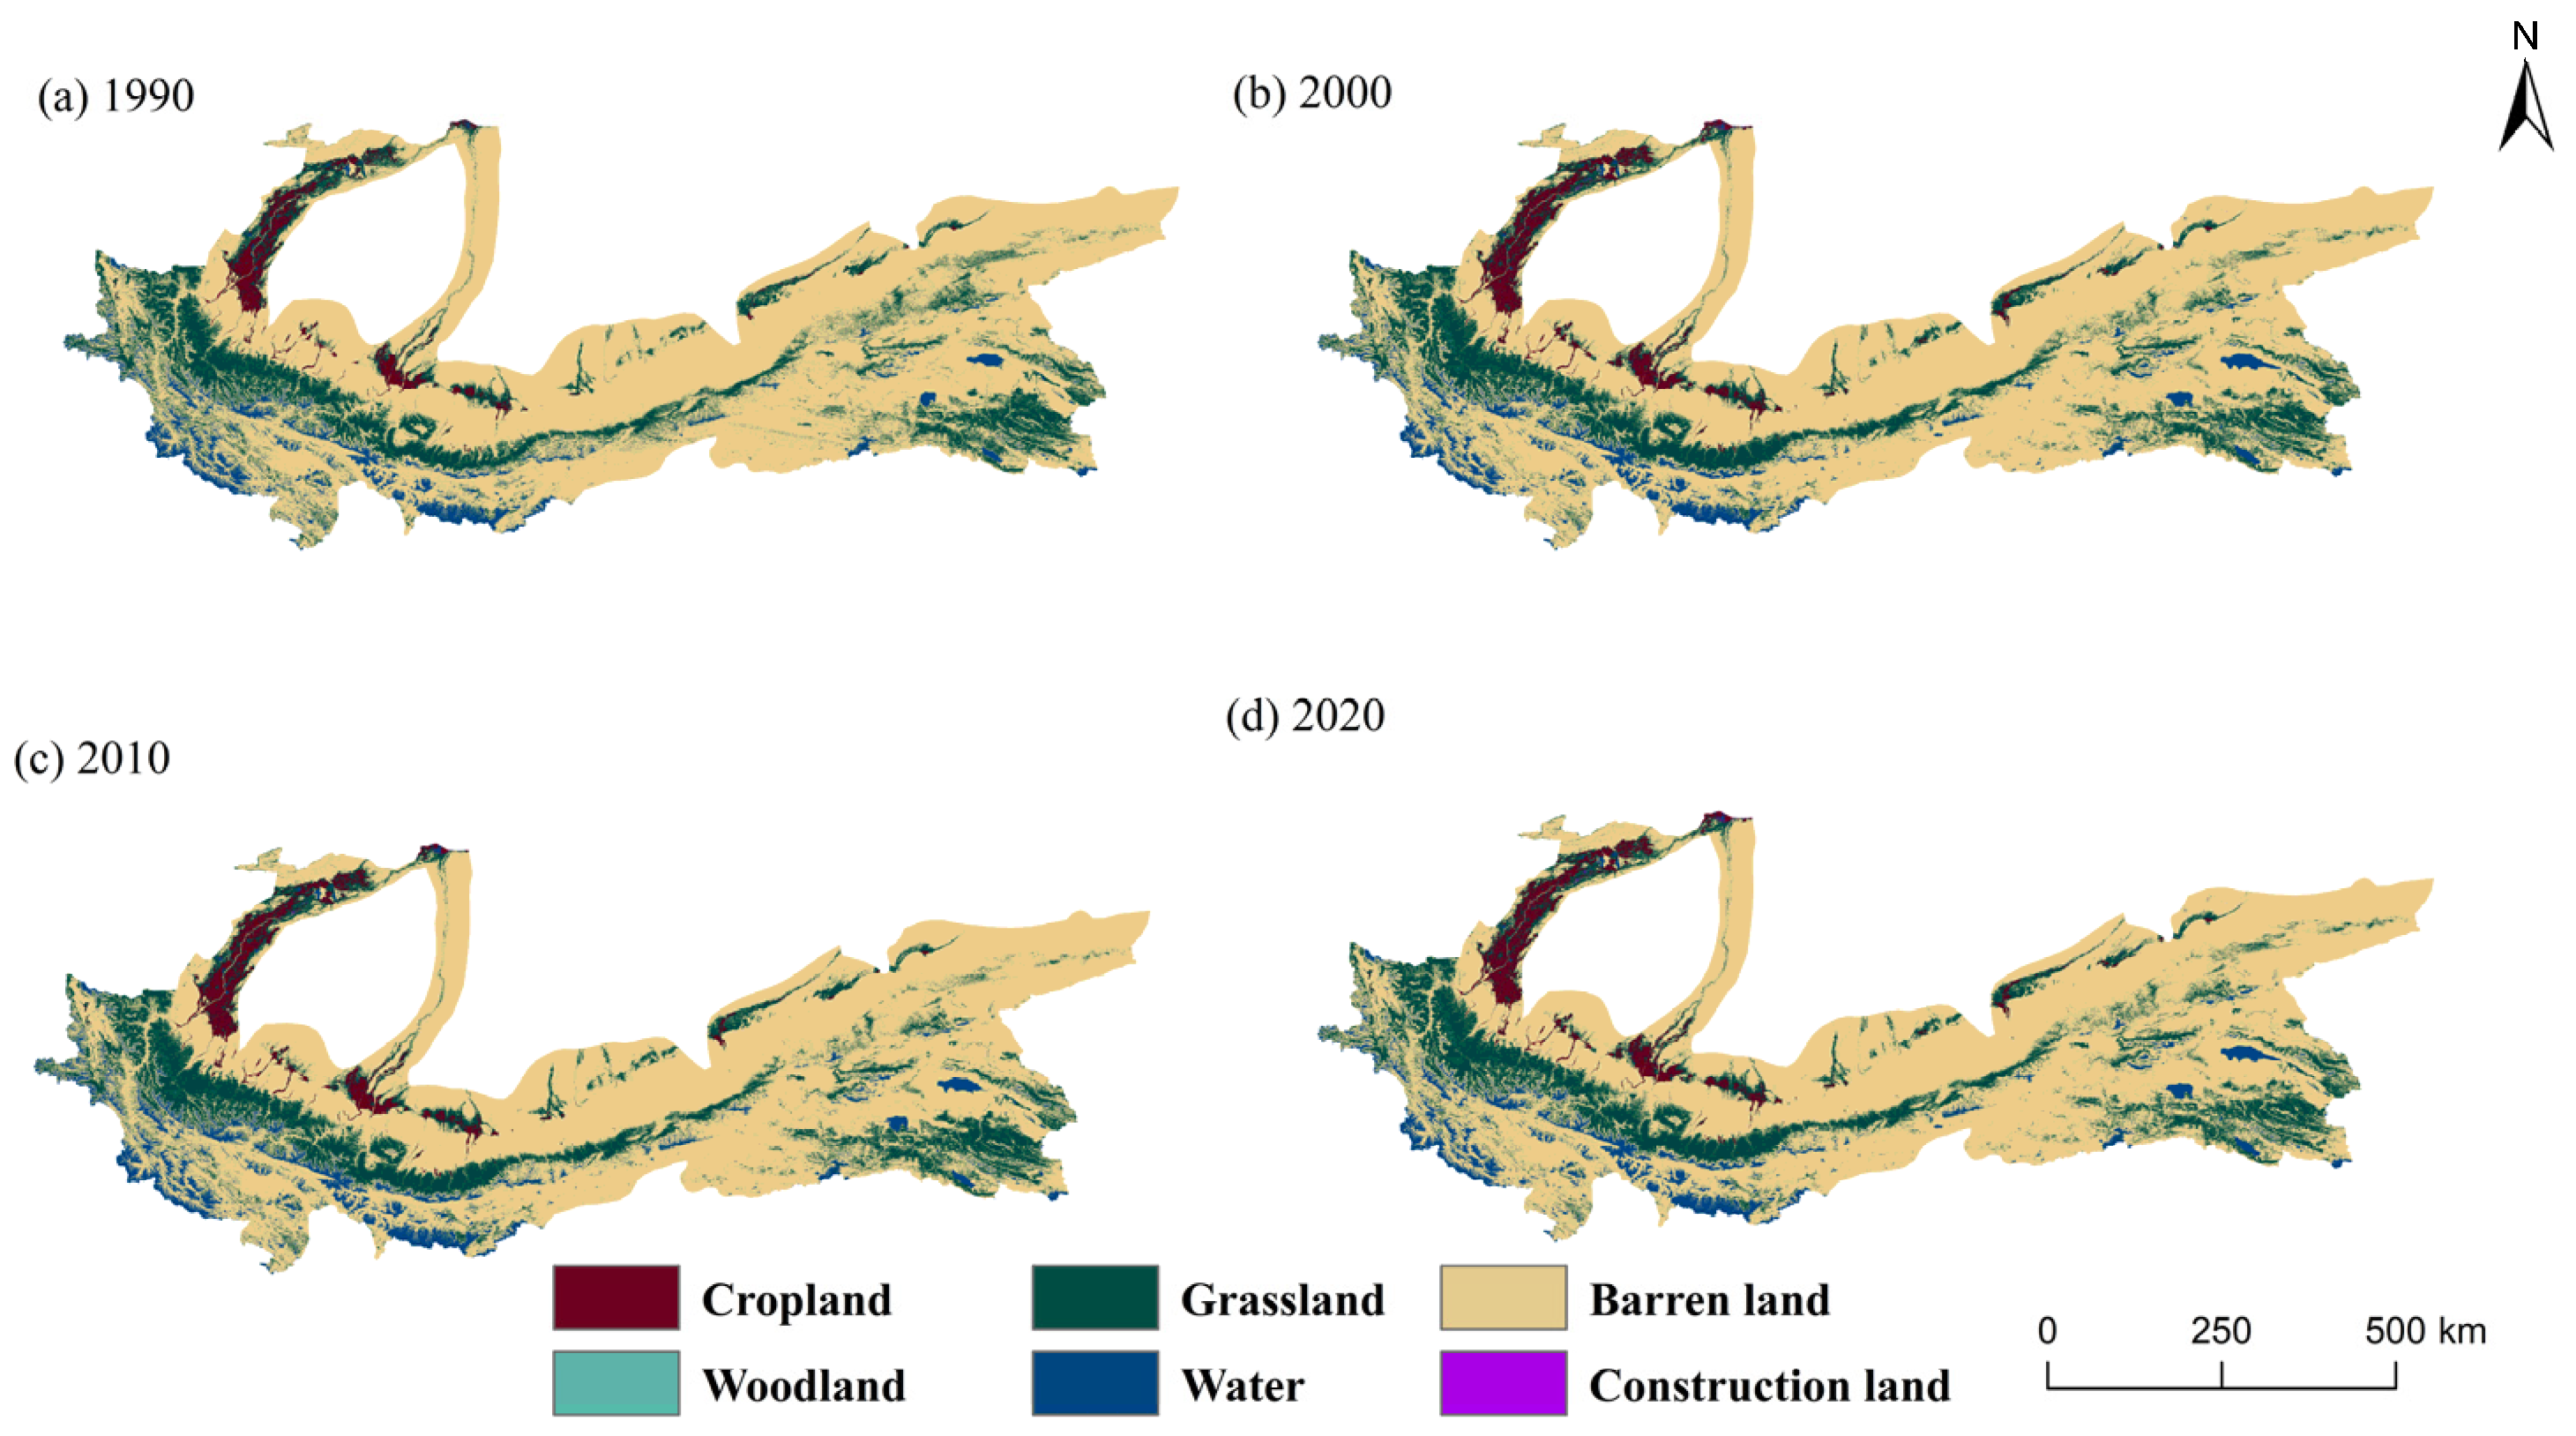
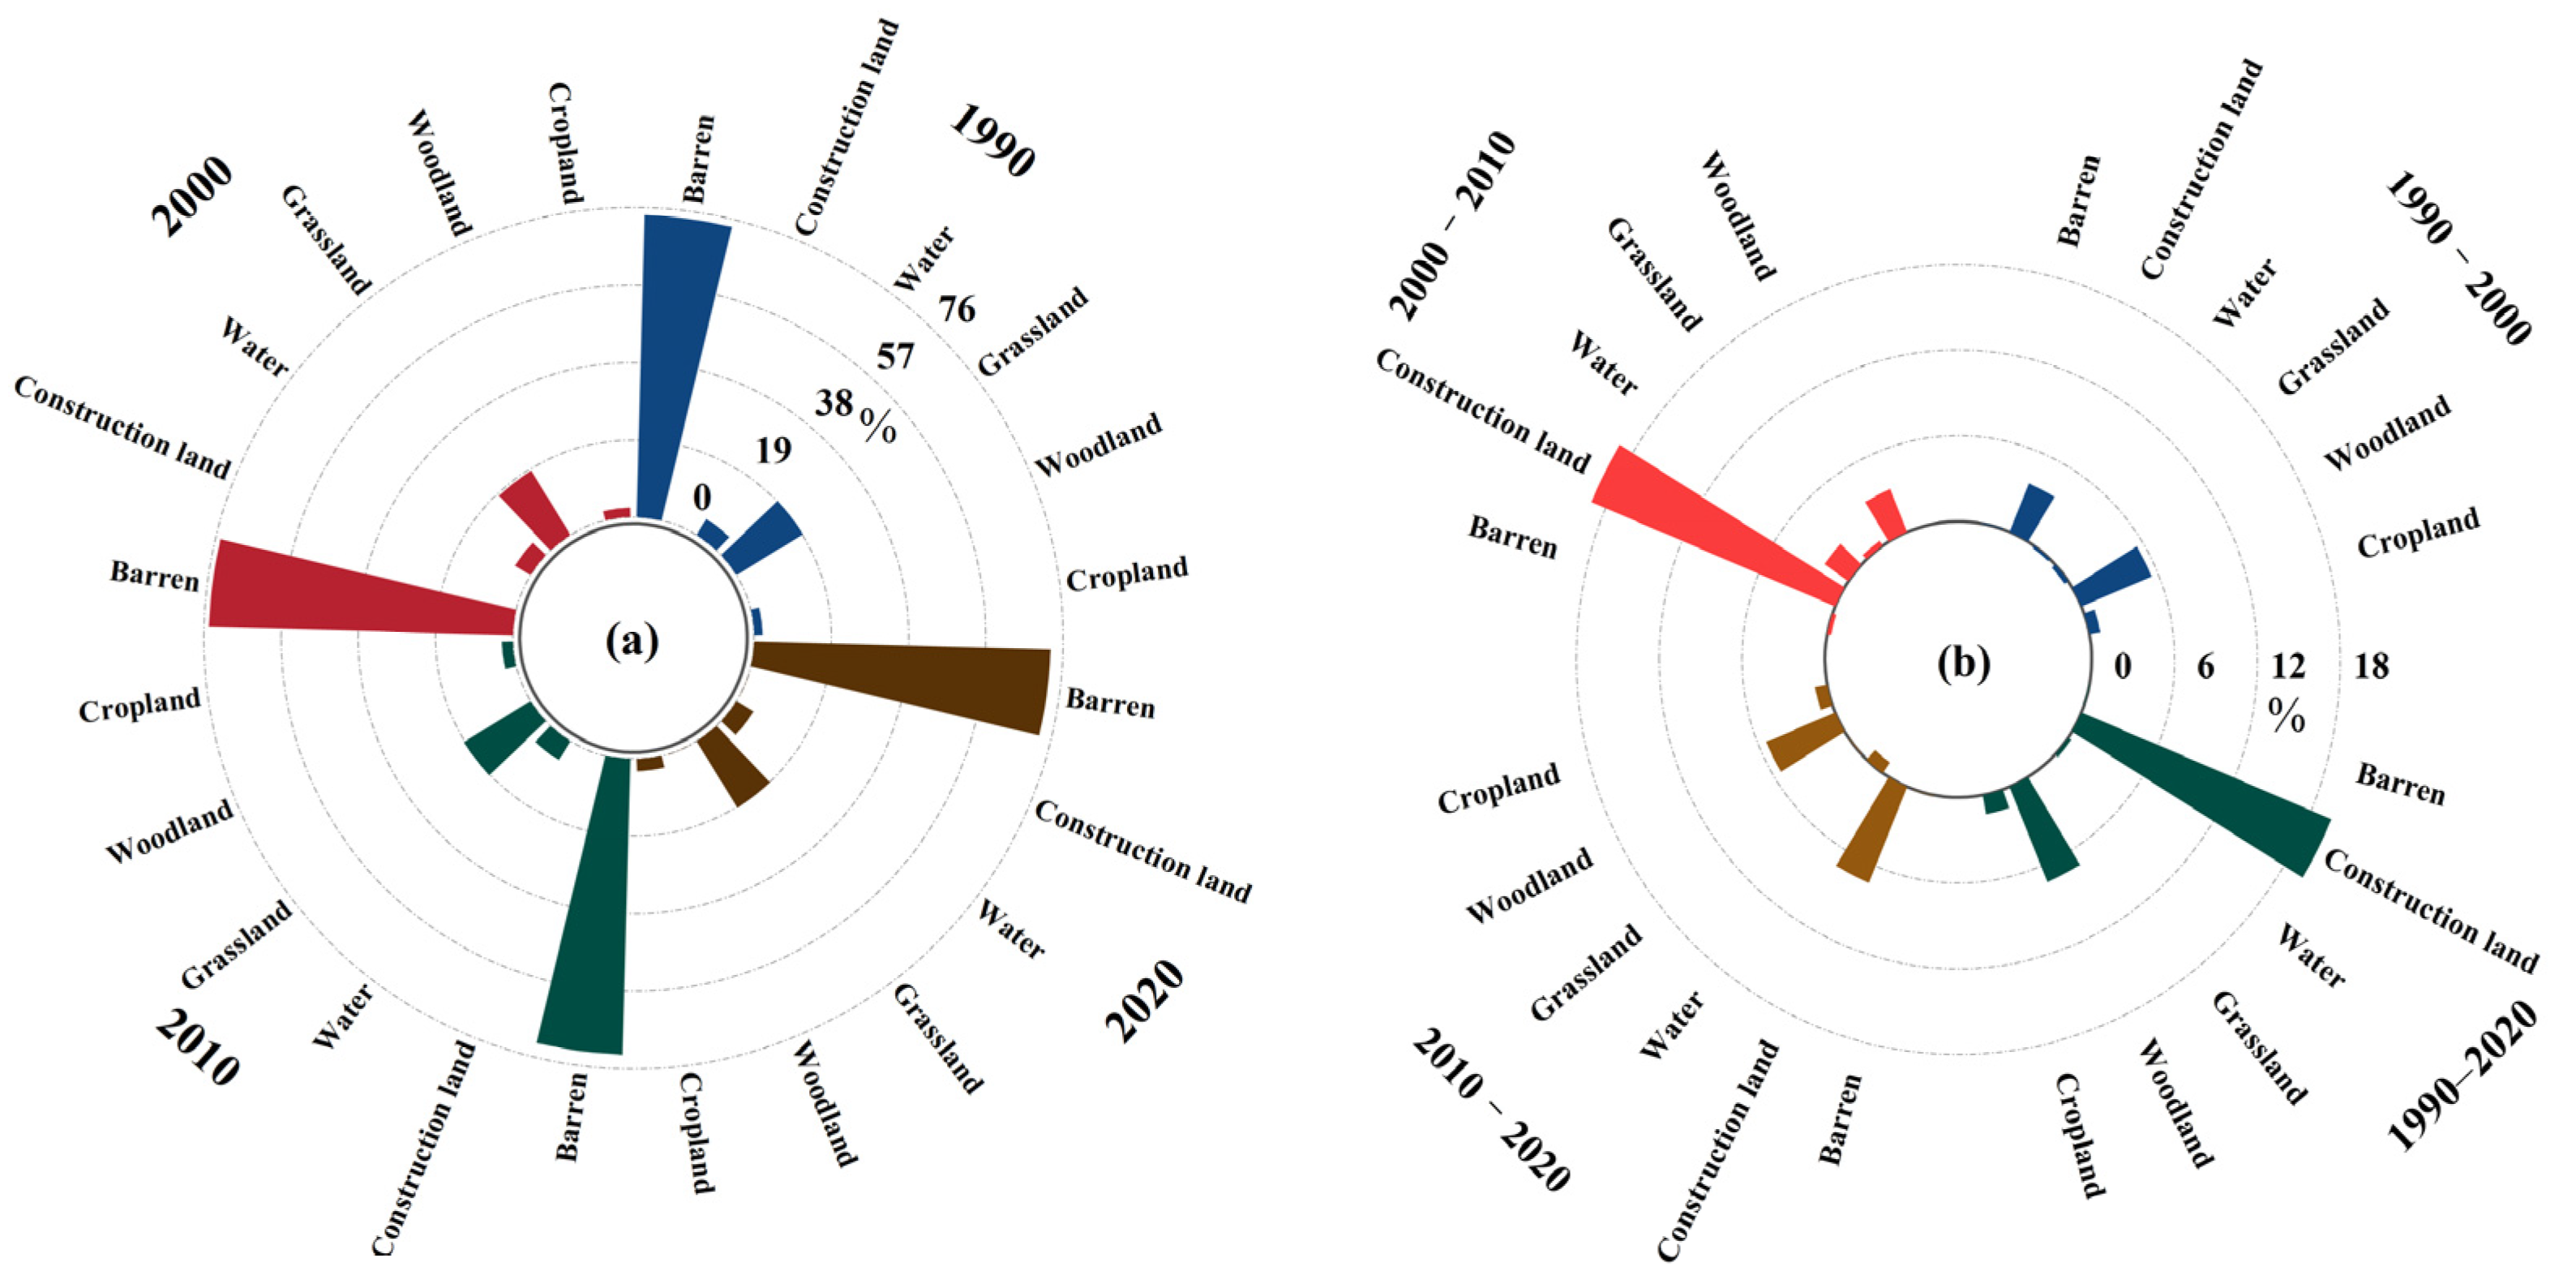
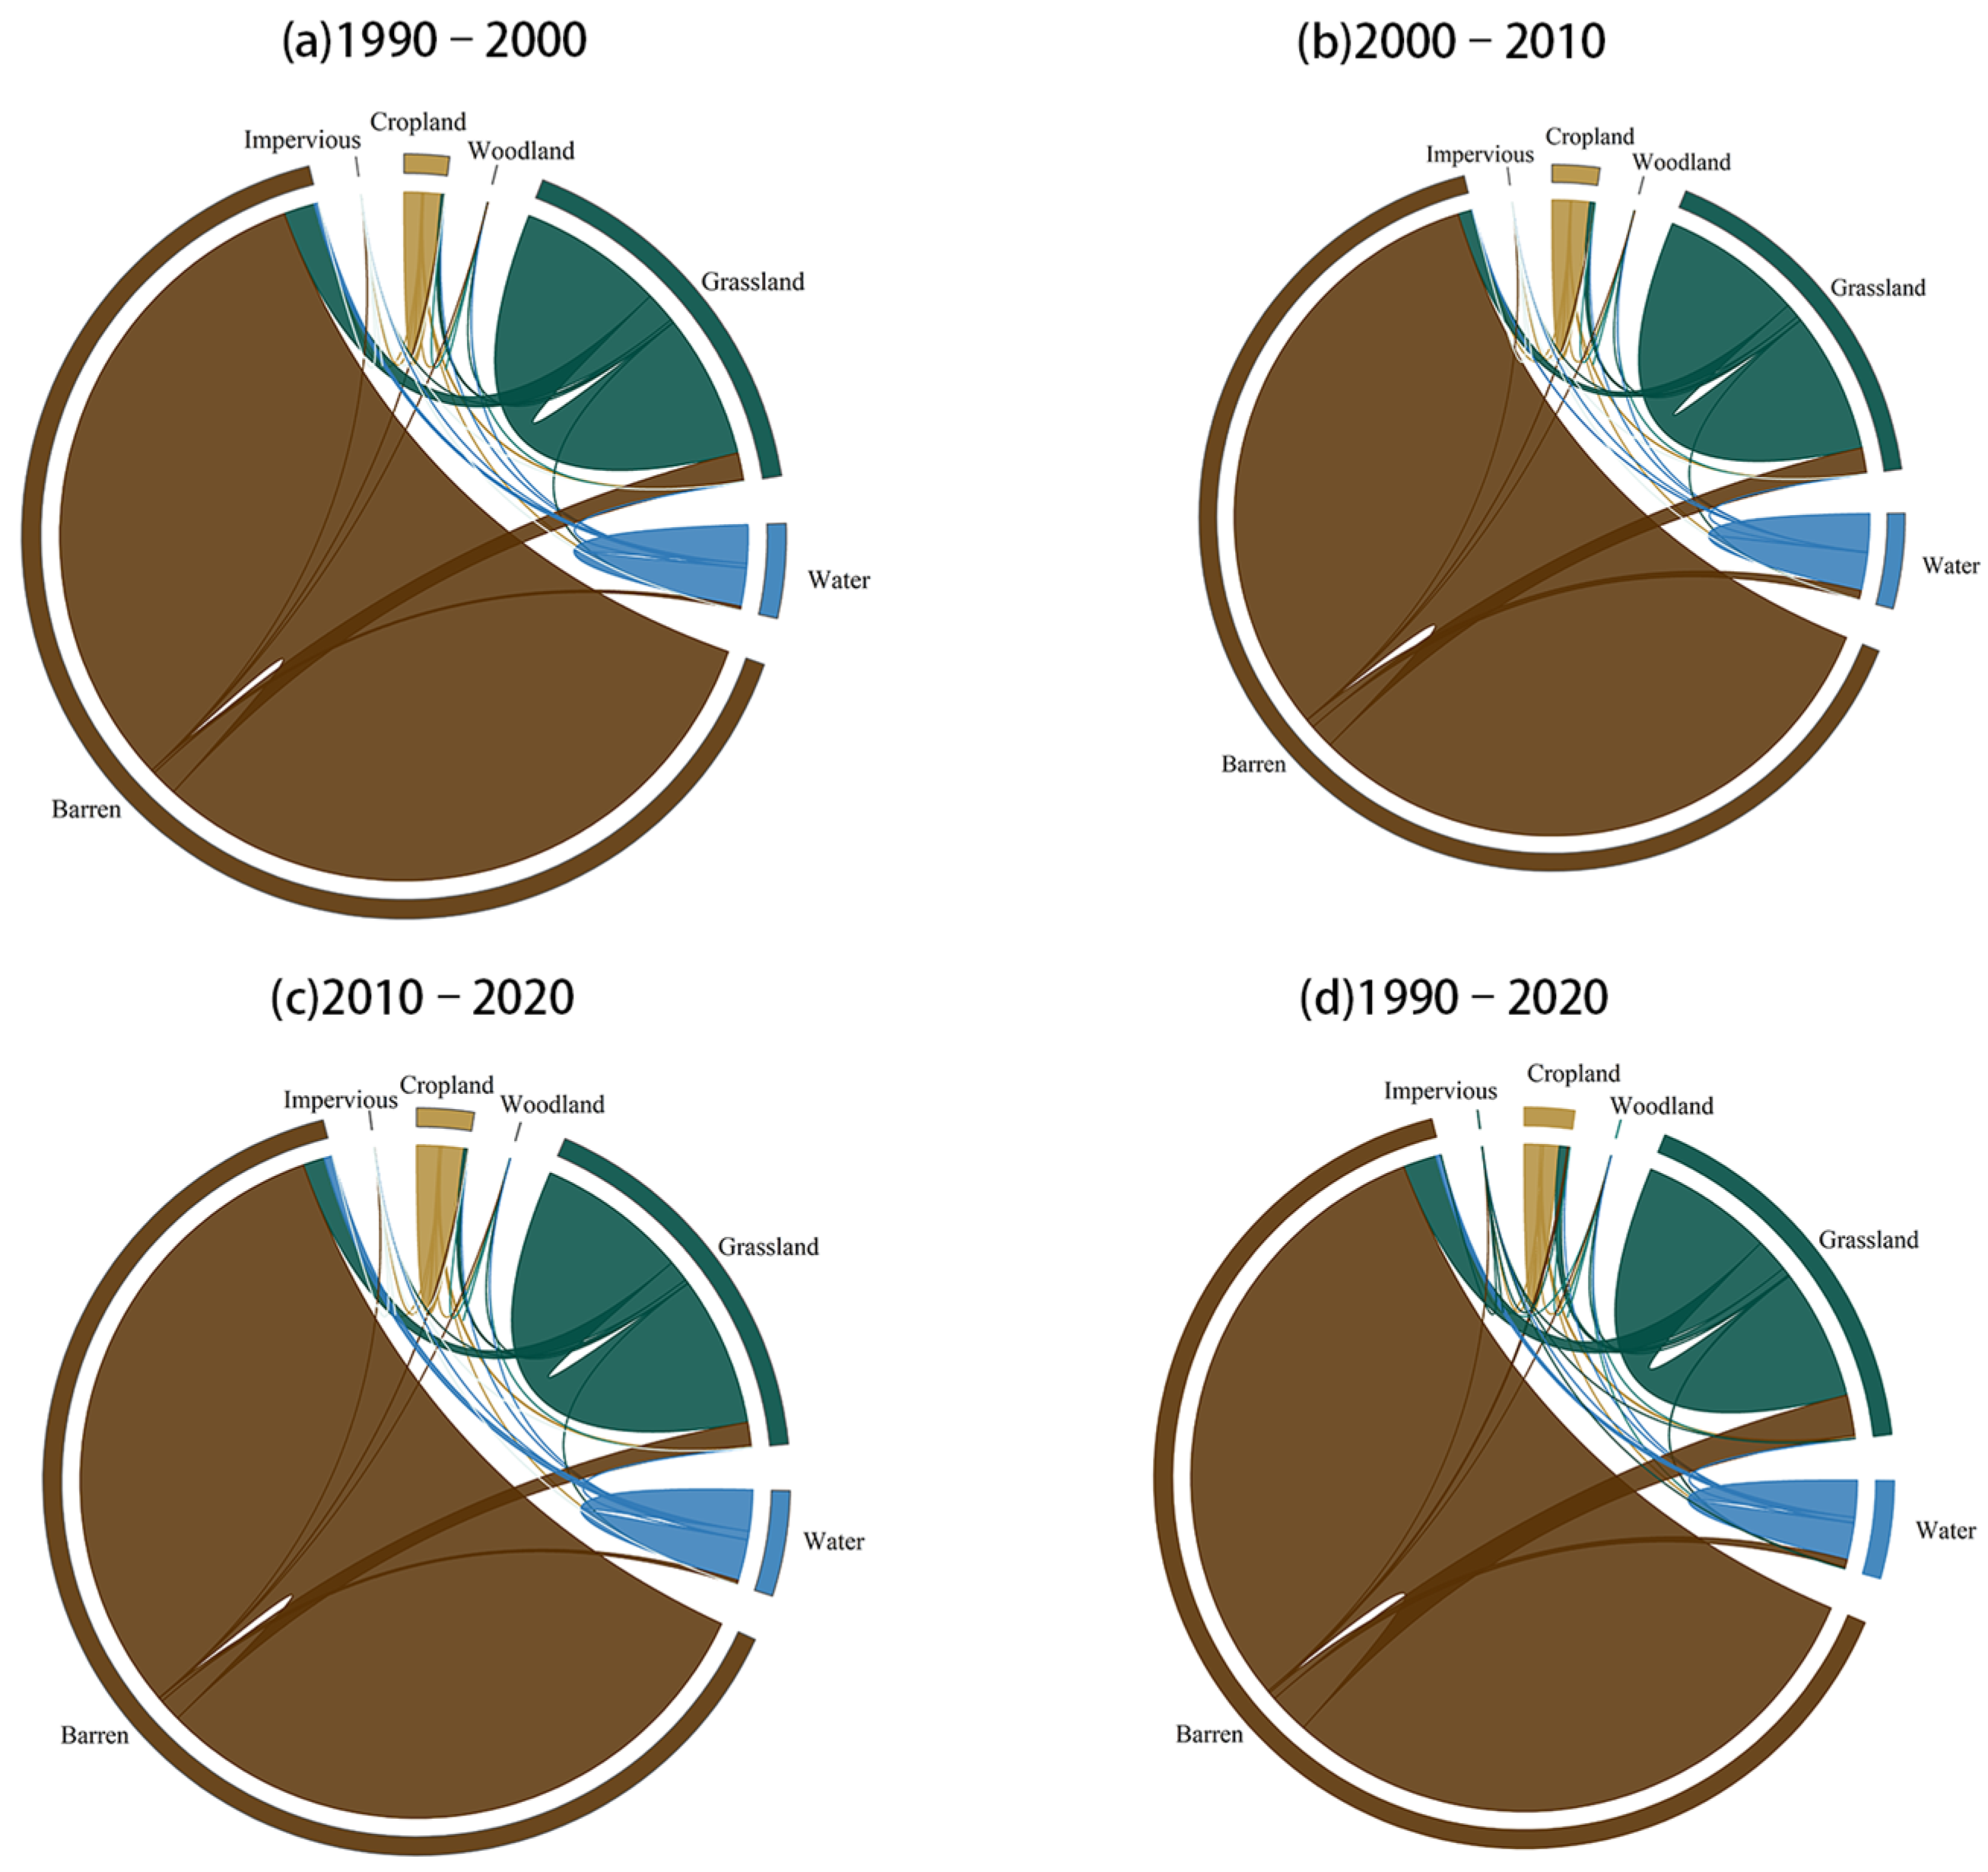
3.1. Spatial and Temporal Variation Characteristics of Land-Use Types

The current land-use status (Figure 2) and land-use structure (Figure 3a) of the northern slopes of the Kunlun Mountains from 1990 to 2020 show that the largest and most widely distributed land type in the study area is barren land. This land type dominates the ecosystem, accounting for 72.92% of the total area as of 2020, followed by grassland, which accounts for 19.15% of the total area. In contrast, water and cropland account for only 4.93% and 2.93% of the total area, respectively. Woodland and construction land are the smallest, accounting for only 0.04% of the total area.
Although each land type changed during the study period, the change characteristics differed according to land type and time period. The area of grassland, construction land, woodland, cropland, and water increased, while the area of barren land decreased. Cropland experienced the largest growth in the area, showing a total growth of 364.69 × 10³ hm2. The fastest growth rate for this land type occurred from 2000 to 2010, with a kinetic attitude of 1.97% (Figure 3b). Most of the cropland was converted from grassland (385.81 × 10³ hm2) and barren land (100.8 × 10³ hm2), with human large-scale land reclamation being an important factor in this phenomenon.
During the study period, the increase in population resulted in construction land having the largest proportional growth among all land-use types. The most significant change occurred from 2000 to 2010, with construction land expanding from 3.3 × 10³ hm2 in 1990 to 9.61 × 10³ hm2 in 2020 (Figure 4), at a growth rate of 291.04% and a moving attitude of up to 19.1%. The growth trend of forested land is also dramatic, with the fastest growth rate of forested land in 1990–2000, with a forested land movement rate of 5.49%, and the growth of forested land from 5.17 × 10³ hm2 in 1990 to 8 × 10³ hm2 in 2000, which was mainly converted from grassland (12.7 × 10³ hm2).
The area of unutilized land was 30,885.24 × 103 hm2 in 1990 and 30,341.86 × 103 hm2 in 2020, with an area reduction of 1.08%, and the fastest rate of reduction was in the time period of 2000–2010, with a momentum of −0.29%, which was mainly transformed into a land area consisting of grassland (1594.49 × 103 hm2), water (241.77 × 10³ hm2), and cropland (100.8 × 10³ hm2), which is mainly due to the increase in temperature, the increase in mountain runoff, and the increase in precipitation in the recent years, which makes the study area gradually move towards ecological restoration.
Meanwhile, The growth trend of grassland in the past 30 years is a small increase of 155.26 × 10³ hm2 (Table 3), and the grassland is mainly transformed by unutilized land (1929.37 × 103 hm2) and arable land (119.95 × 10³ hm2), and the large-scale reclaiming of the grassland (184.59 × 10³ hm2) into arable land and overgrazing from 1990 to 2000 led to the large-scale reduction of grassland (345.27 × 10³ hm2), and after 2000, in response to the national policy, people began to pay attention to ecological conservation, and the area of grassland was recovered. From 1990 to 2000, human beings massively reclaimed grassland (184.59 × 10³ hm2) as arable land and overgrazed it, resulting in the large-scale reduction of grassland (345.27 × 10³ hm2).
Furthermore, over the past 30 years, the area of the watershed has increased by 155.26 × 10³ hm2, and the fastest rate of increase was during the period of 2000–2010, with a motivation of 2.09%, which was mainly made up of unused land (364.82 × 10³ hm2), grassland (60.32 × 10³ hm2), and arable land (1.36 × 10³ hm2). During 2000–2010, the transformation of unutilized land and grassland to water was the most drastic, respectively (550.42 × 10³ hm2 and 19.27 × 10³ hm2). In general, the increase of water and the decrease of unutilized land area have certain spatial synergies with the decrease of glacier area in the Kunlun Mountains and the intensification of the water cycle in arid zones, which also indicates that the ecological environment in the study area is developing in a good direction. It also indicates that the ecological environment in the study area is developing in a favorable direction.

3.2. Spatial and Temporal Variation Characteristics of ESV

3.2.1. Characteristics of Changes in the Temporal Dimension of ESV

In this study, the ecosystem service values of the northern slopes of the Kunlun Mountains were estimated for 1990, 2000, 2010, and 2020 based on the primary land-use classification (Table 4). Overall, ESV showed a rising trend, with a total increase of CNY 17.906 billion (or about 5.8%), while for the four above-stated years, the ESV was 3086.45, 3032.90, 343.147, and 326.550 billion, respectively. It can be concluded from these figures that the ESV trend first slowly decreased, then significantly increased, and finally flatly decreased while generally showing an upward trend. Specifically, from 1990 to 2000, the ESV slowly decreased by CNY 5.535 billion. From 2000 to 2010, it increased dramatically by CNY 39.857 billion, and from 2010 to 2020, it showed a significant downward trend, dropping CNY 16.579 billion.
Furthermore, in looking at the changes in ESV for each category for the whole study period (Table 5), we can see that woodland and cropland ESV changed the most, increasing by CNY 459.00 and 4.604 billion, respectively, which was 216.28% and 40.95%, respectively. The ESV of barren land, on the other hand, showed a decreasing trend, reducing by CNY 429 million. This is some indication that the ecology of the study area is, in general, in a state of improvement. There is an improvement in the ecosystem health of the protected areas, and the globally warming environment has led to an increase in the ESV of woodland and water areas. At the same time, the intensification of human activities and the speed of socio-economic development have led to a continuous increase in the ESV of cropland.
The dominant service value in the study area is the regulating function, which consists of four main aspects: gas regulation, climate regulation, water connotation, and waste treatment. The overall service functions of these regulations during the study period show an upward trend of CNY 42.56, 80.21, 626.3, and 63.217 billion, respectively, with a slight decrease from 1990 to 2000. There is also a significant upward trend in water connotation and waste treatment from 2000 to 2010, followed by a slight decrease from 2010 to 2020. The increase in water area also plays a key role in regulating services. For the service functions of water source containment and waste treatment, the decrease followed by an increase is consistent with grassland and water area changes.
The two service functions of soil formation/conservation and biodiversity conservation are called support services. Between 1990 and 2020, these two services showed a decrease followed by an increase. They are mainly influenced by cropland, woodland, and grassland, so their value increased due to the expansion of woodland and cropland areas and the fluctuating increase in grassland.
Supply services include the two service functions of food production and raw material production, whereas cultural services include only recreational and cultural functions and thus account for a relatively small proportion of the value of ecosystem services in the study area. Furthermore, the supply function is mainly influenced by cropland, woodland, and grassland, so when cropland and grassland areas expand, there is a subsequent increase in the production of crops and livestock products. The result is a gentle upward trend in the food production function, which in the study area occurred from 1990 to 2000, followed by a more dramatic increase from 2000 to 2020. The function of raw material production service experienced a slight upward trend from 1990 to 2020, similar to the changing trend of cropland and grassland areas. The changes in supply services are mainly due to the combined effect of cropland, woodland, and grassland, charting an overall upward trend.
In contrast, the cultural service function shows an upward trend from 1990 to 2010 and a downward trend from 2010 to 2020, with an especially dramatic upward trend from 2000 to 2010. This service function is mainly influenced by woodland, grassland, and water areas, and its change trend is consistent with changes in woodland and water areas.
Overall, the value of ecosystem services on the northern slopes of the Kunlun Mountains from 1990 to 2020 maintained an upward trend, consistent with changes in regulating services. The data show a slight decline followed by a sharp upward trend from 2000 to 2010 and then another slight decline from 2010 to 2020.

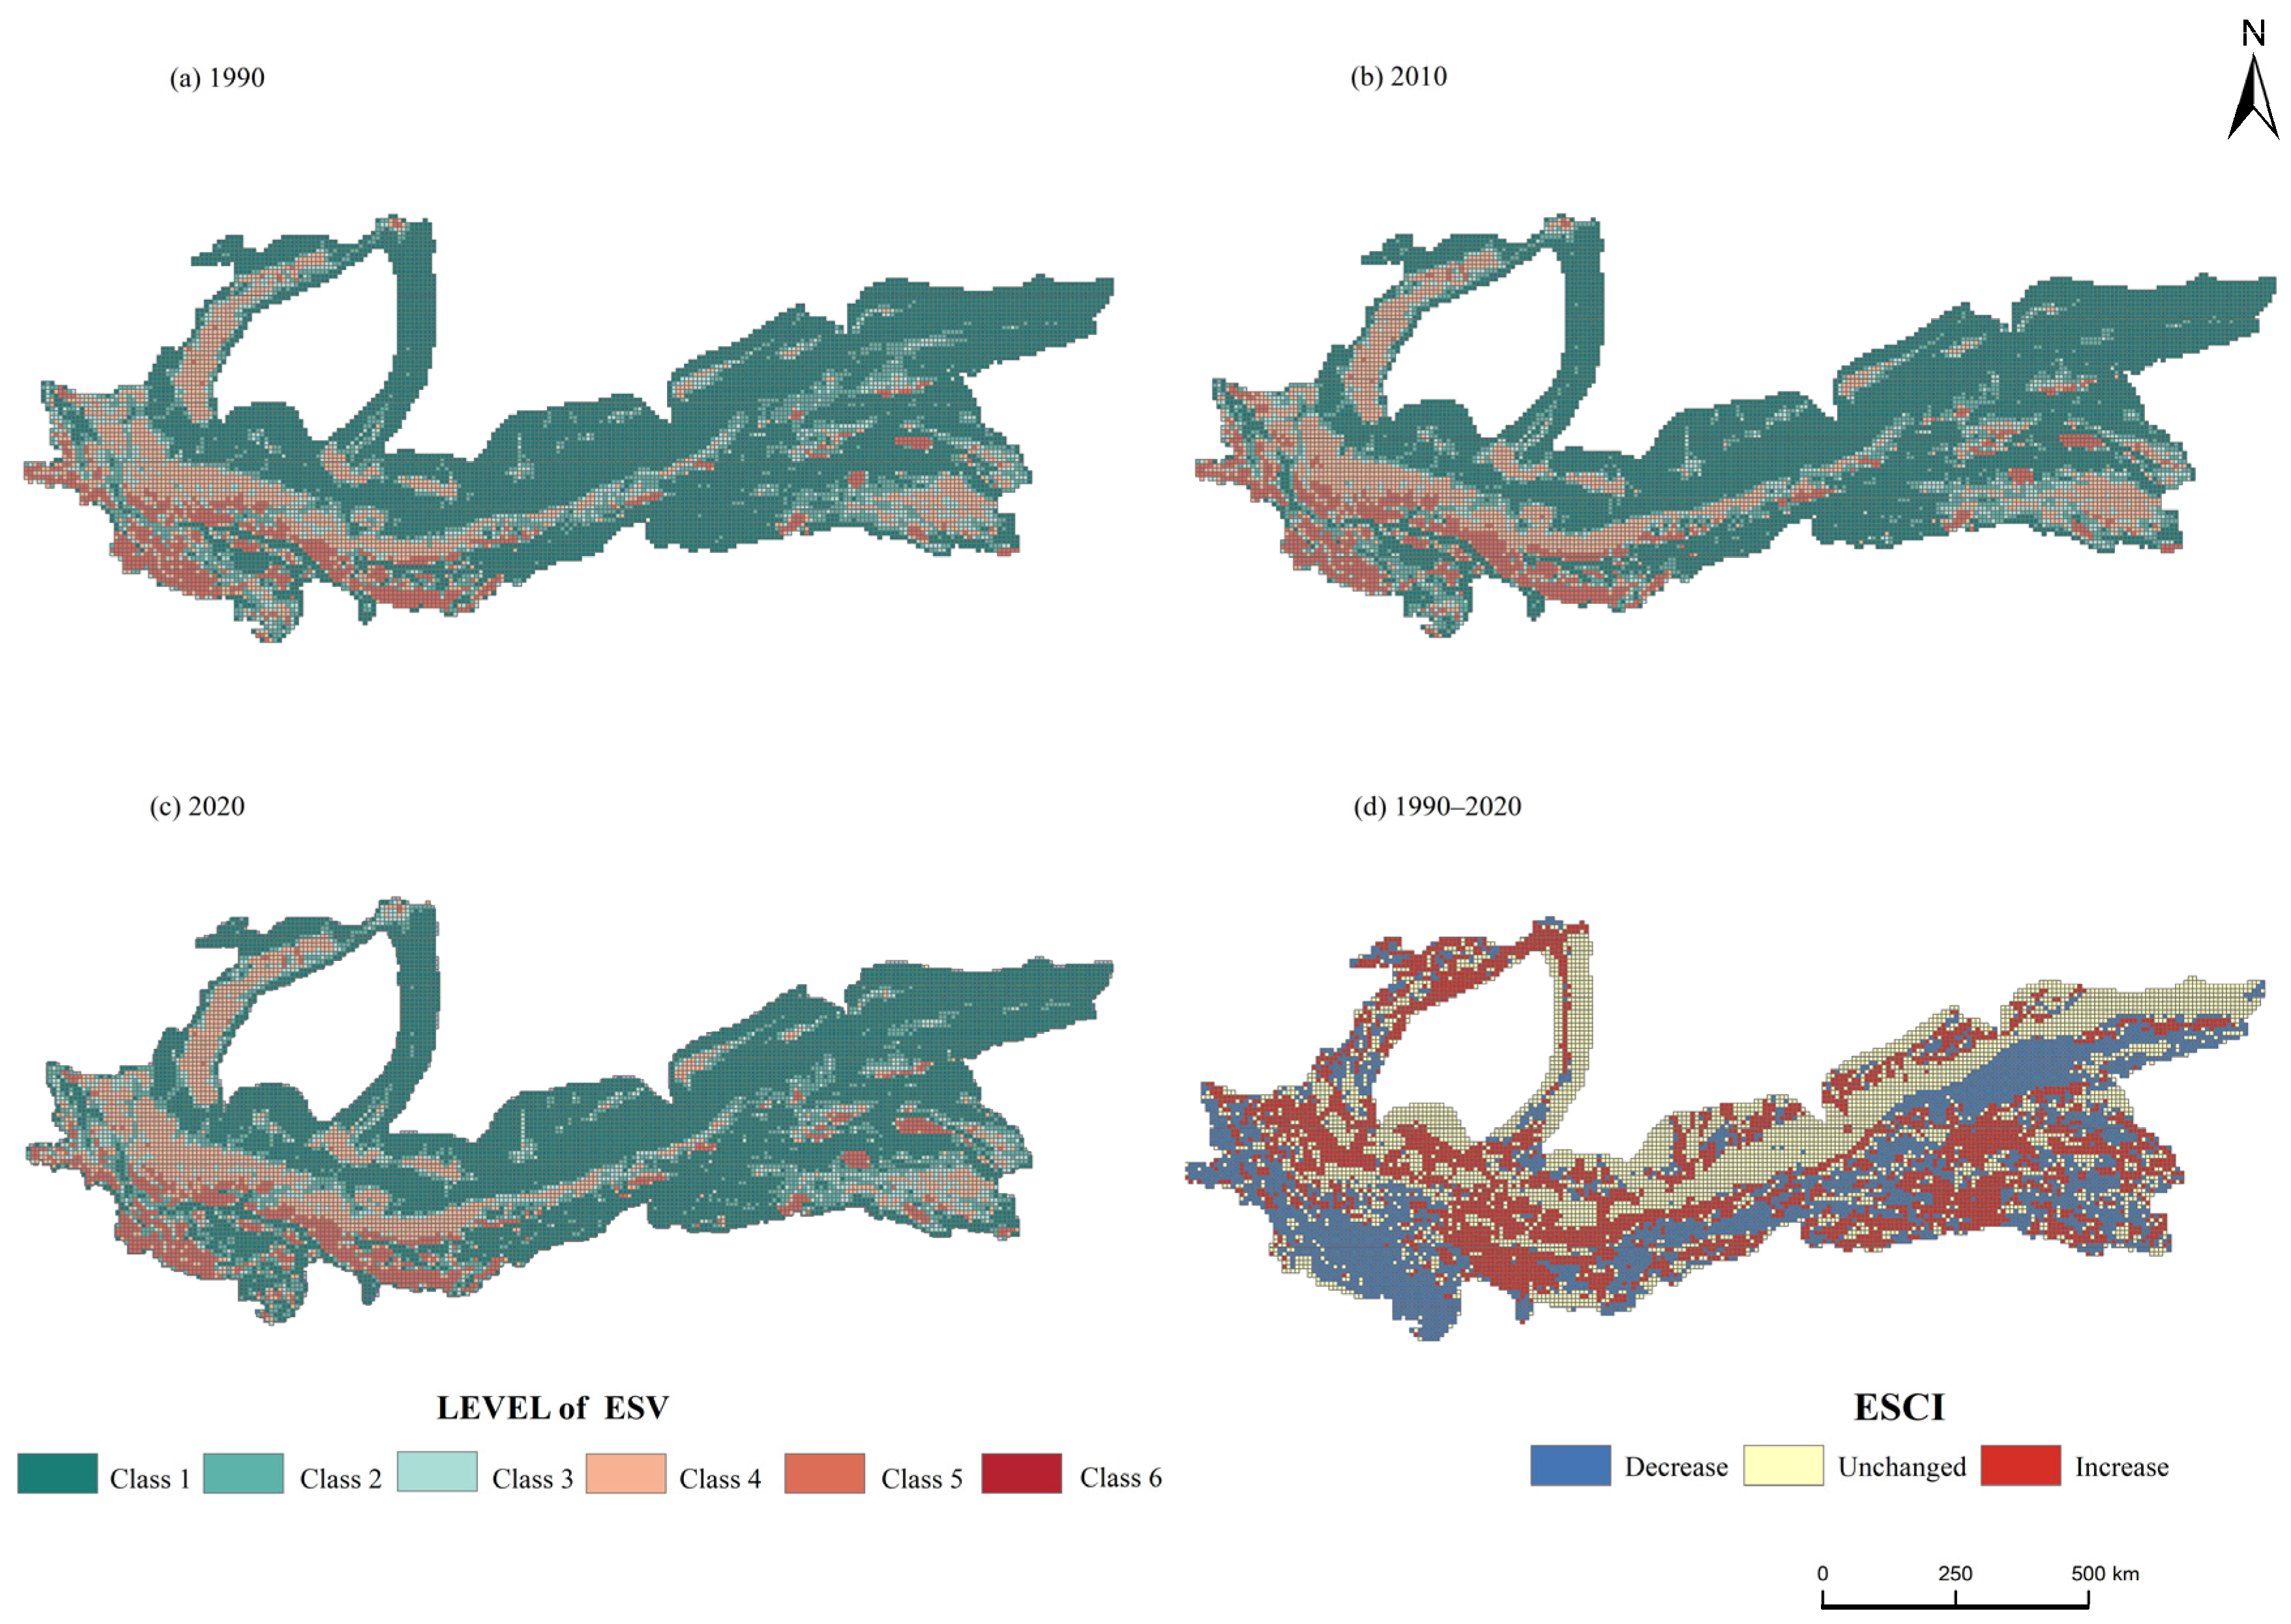
3.2.2. Characteristics of Changes in ESV Spatial Dimension

The spatial distribution pattern shows that the highest values are mainly concentrated in grassland and watersheds in the western and southeastern portions of the study area (Figure 5). This is highly consistent with the unique landscape type distribution characteristics of the region, which includes vast desert areas and barren land in the northeast (low ESV), the Yarkand River Basin in the northwest (high ESV), mountainous areas in the southwest (high ESV), and the Kumkuri Basin in the southeast within the Alpine Reserve (high ESV). Comparing the spatial distribution changes of ESV from 1990 to 2022, the high-value areas showed an expanding trend, while the low-value zone showed a decrease in size. Overall, the ESV in the study area showed a significant increasing trend.
Similarly, the loss and gain value of ecosystem services for the northern slopes of the Kunlun Mountains from 1990 to 2020 shows an increasing trend, mainly due to the acceleration of the global water cycle. The result was the conversion of land types with lower ESV (barren land) to land types with higher ESV (grassland, water). In the northeastern and northern parts of the study area, there are slab-like portions of gain, primarily resulting from the expansion of water and grassland areas. There are also some point-like gain sections in the northeast, mainly due to the local increase in grassland and water areas post-ecological restoration. Meanwhile, the ESV gain areas in the west are thanks to the increase in grassland cover in some areas due to the development of water resources.

3.3. Spatial Correlation Analysis of ESV

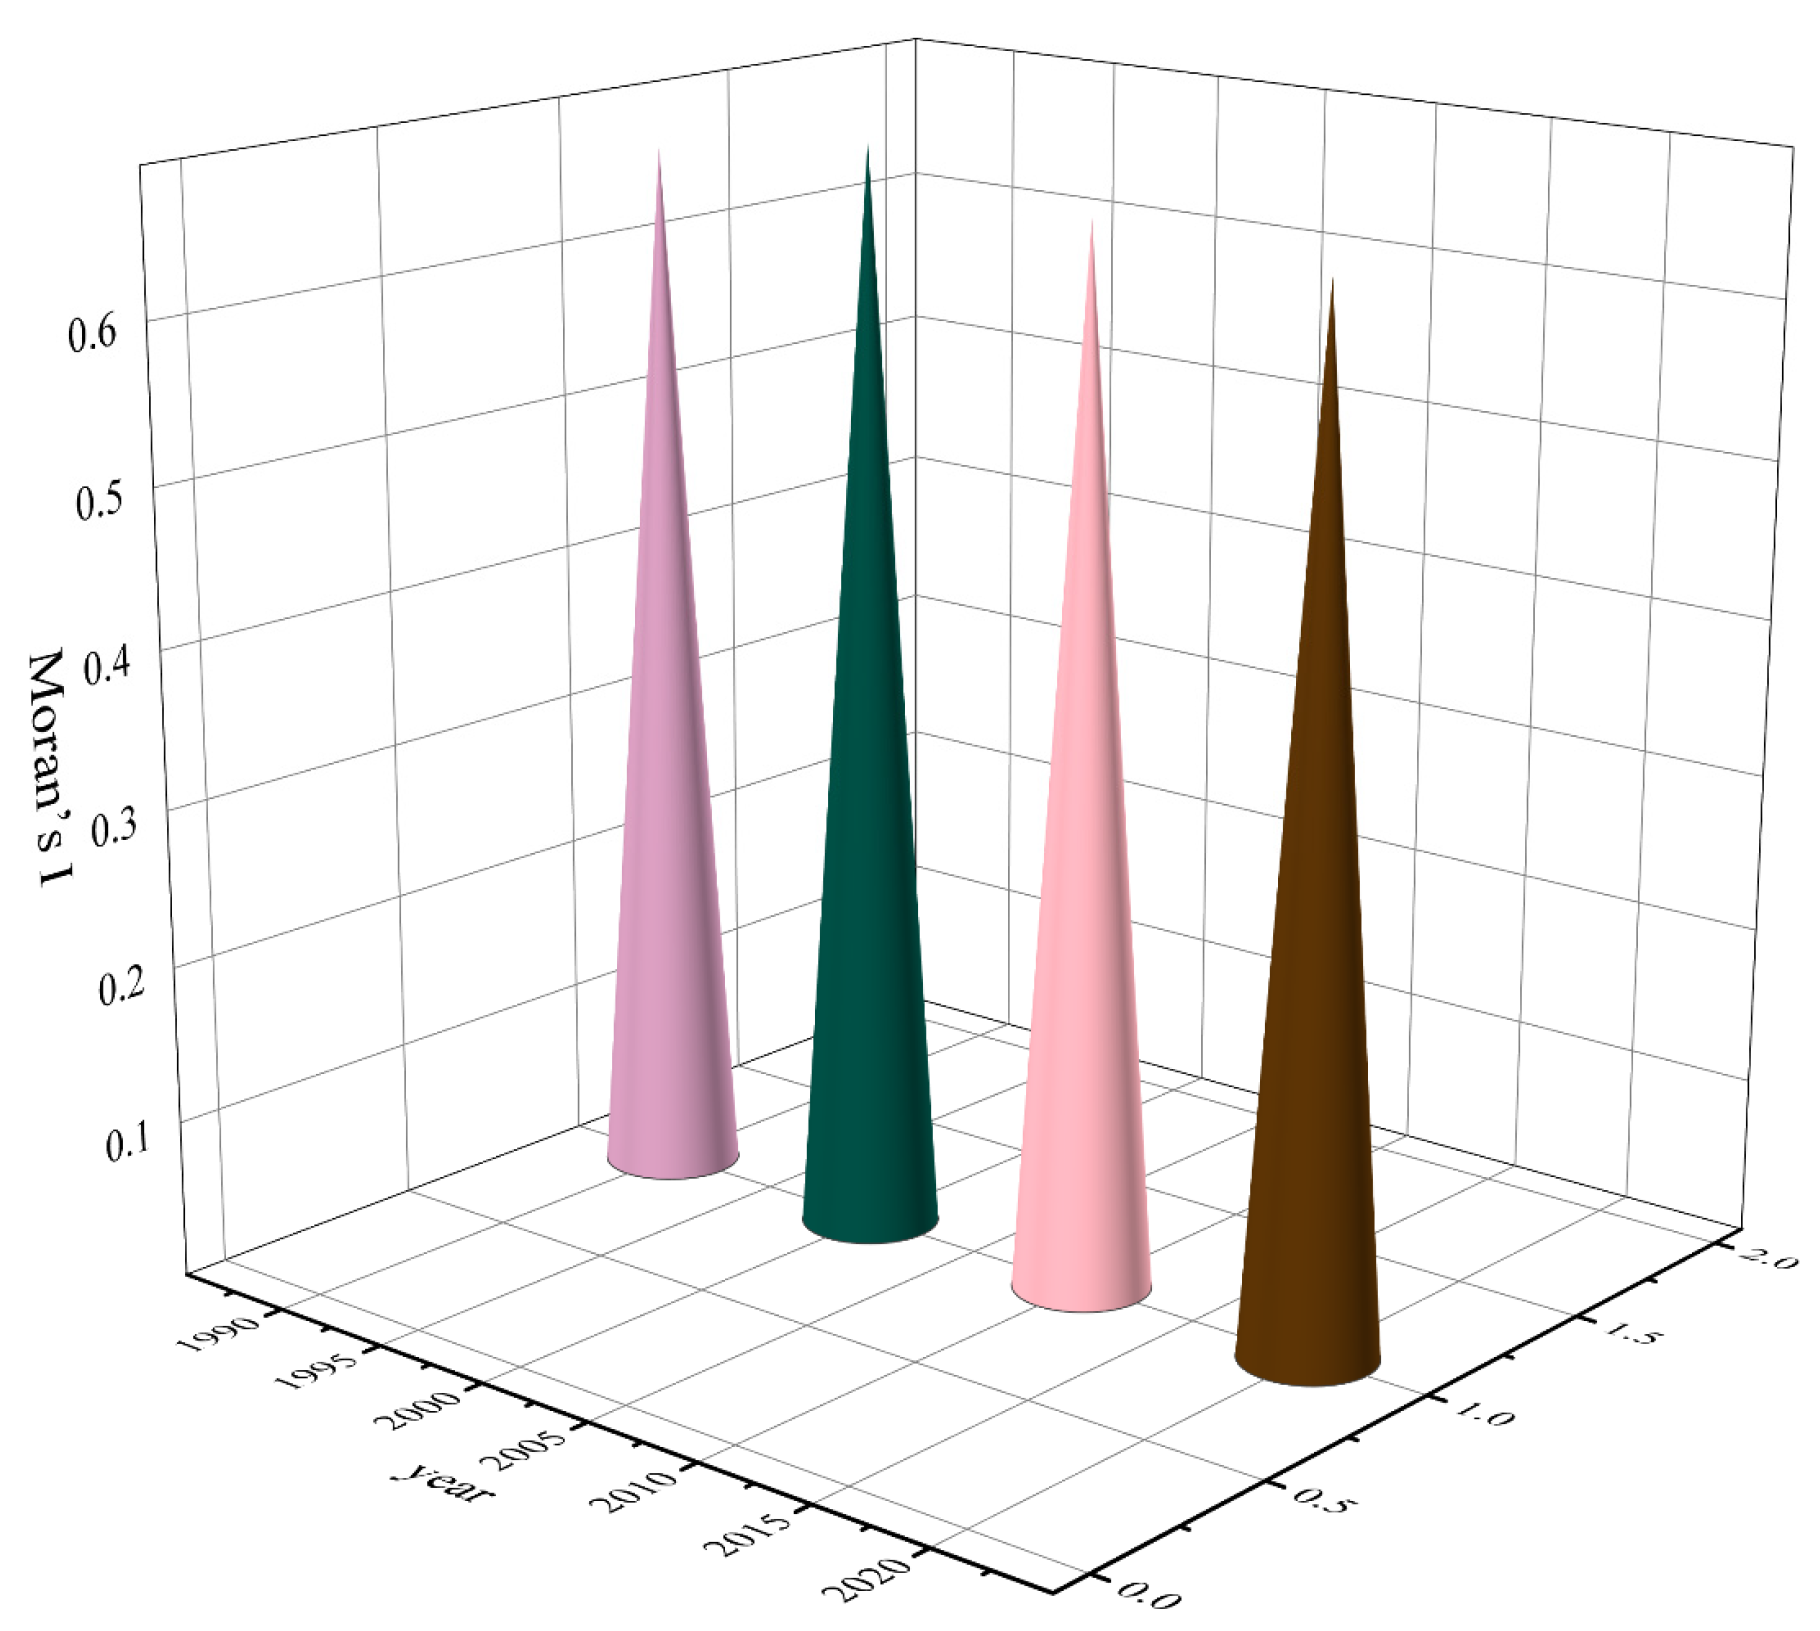
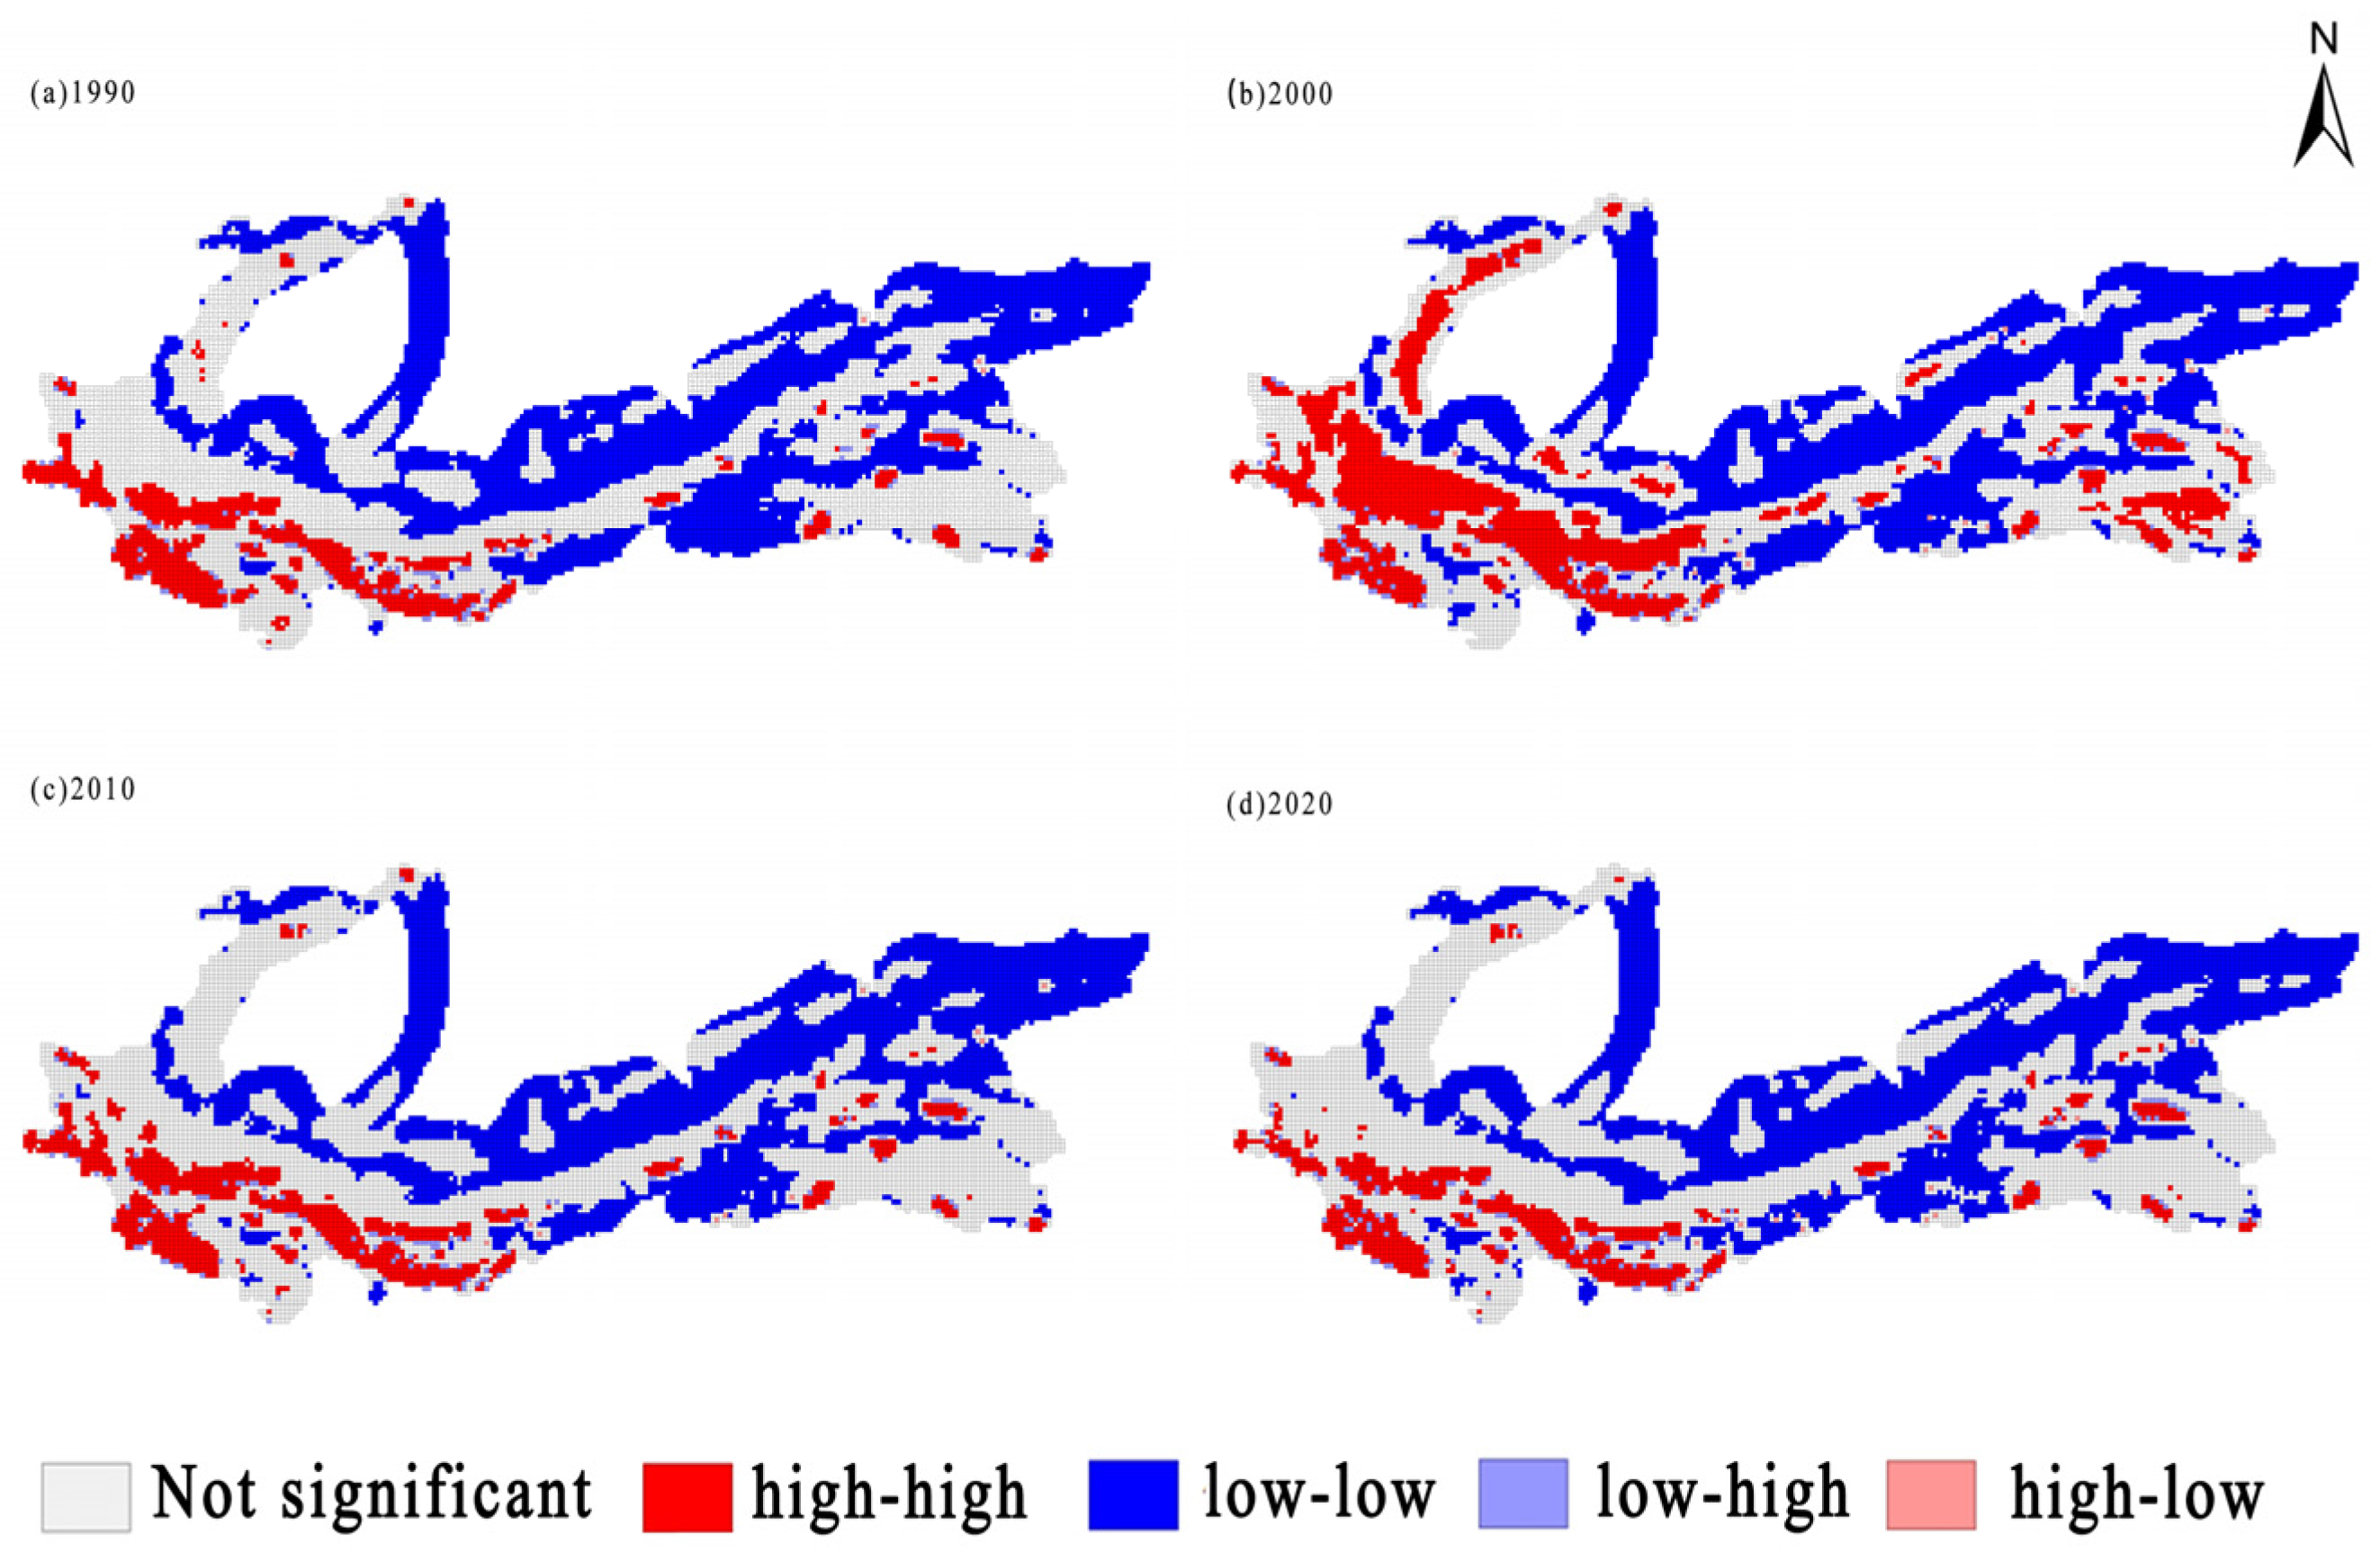
3.3.1. Spatial Autocorrelation Analysis

The present study conducted global autocorrelation analysis using the GeoDa model to find the spatial pattern characteristics of the ecosystem service values for the northern slopes of the Kunlun Mountains from 1990 to 2020. According to the calculated results, there is a very significant spatial correlation in the ESV distribution, i.e., the spatial distribution is clustered in places with high ESV values and vice versa. The global Moran’s I Index for the four periods of 1990, 2000, 2010, and 2020 (Figure 6) shows a maximum value of 0.692 in 1990. This trend is consistent with the spatial correlation of ESV in the study area, which reveals a yearly increase in area and higher ESV for grassland and water. Analysis of the correlation of the dynamic change in ESV indicated a changing trend of initial gradual increase. With the help of the Local Moran’s I Index, a LISA clustering map was created (Figure 7).
The main spatial clustering types of ESV in the study area are High–High, Low–High, and Low–Low. The High–High ESV value areas from 1990 to 2020 were mainly distributed throughout the north, west, and south, with a small amount distributed in the southeast, all of which are rich in grassland and water resources. The northern region is also characterized by intensive human activities, which then leads to more cropland and a higher level of socio-economic development. The low–high ESV areas were mainly distributed in the west and southeast from 1990 to 2020, covering barren land and grassland. The Low–Low type areas are mainly distributed in the central and northeastern regions of the study area, where the land is barren, has low ESV value, is ecologically fragile, and is difficult to develop and use.

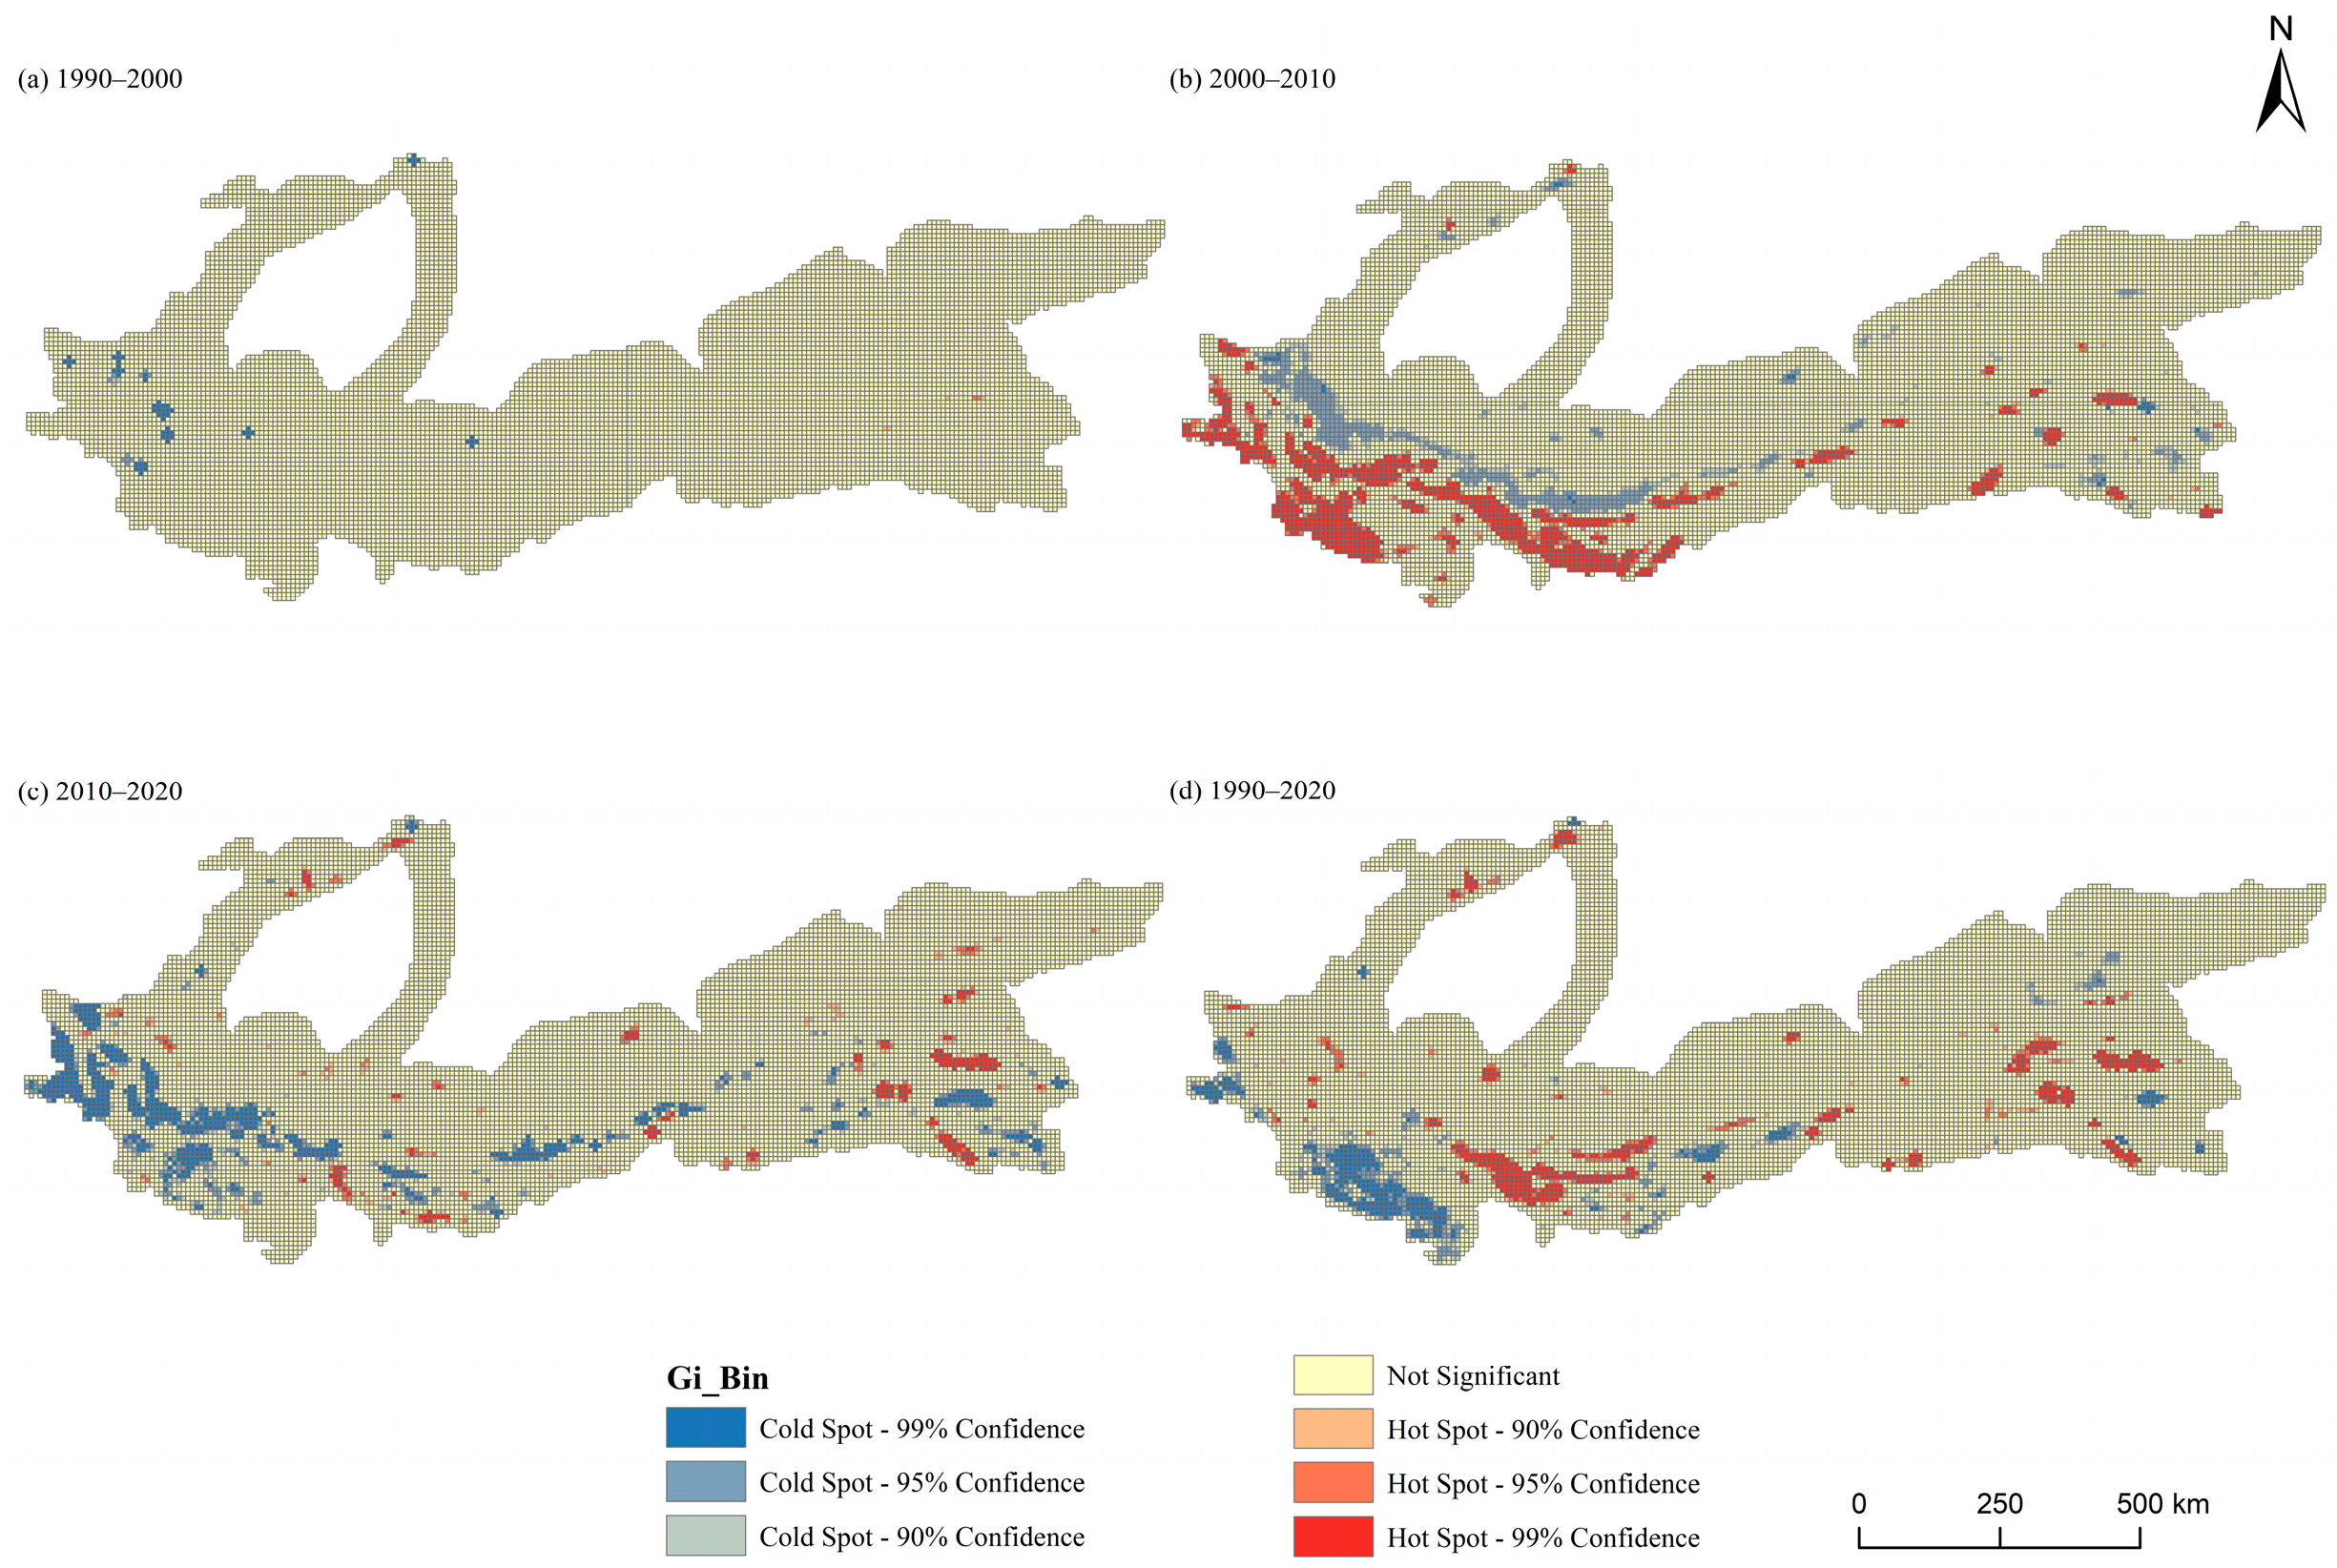
3.3.2. Cold Hot Spot Analysis

With the help of the ArcGIS 10.2 software cold and hotspot analysis tool, the ESV dynamics of the study area were spatially expressed by selecting the statistically significant spots with a confidence level of 90% or more from the obtained results (Figure 8).
The results indicate that the ESV value-added hotspots in the study area from 1990 to 2000 were dispersed throughout the oasis-desert intersection and some areas in the south. The dispersion pattern is mostly due to the conversion of barren land to cropland and the growth of water area, which led to the growth of ESV in some places. The cold spots were mainly distributed in the southwest and were primarily caused by the shrinkage of water and grassland area, resulting in the loss of ESV. In 2010–2020, ESV gain hotspots were concentrated in the southwest, with some patchy hotspots in the southeast and center. The intensification of the global water cycle and rising temperatures resulted in the conversion of significant amounts of barren land into grassland and water, resulting in an increase in ESV in 2010. The loss of ESV mainly occurred at the border between the Taklamakan Desert and the western portion of the study area, where the degree of desertification was greater and ESV, therefore, lower.
The ESV gain hotspots in 2010–2020 were primarily located in the southeast, which is mostly due to the increase in water resources in that area caused by rising temperatures and accelerating snow melt. However, this change, to some extent, improved the grassland ecosystem in the region, increasing grassland and water area and a subsequent uptick in ESV. The cold spots designating ESV loss were mainly located in the northern and western parts of the study area and were mostly the result of increased human activities, which included some behaviors such as large-scale reclamation and grazing activities. The outcome of these activities was the conversion of land types with high ESV value, such as grassland, into land types with low ESV value, such as barren land.
Overall, the changes in cold hot spots from 1990 to 2020 are similar to those in ESV gains and losses in terms of spatial distribution characteristics. The ESV value-added hotspots were concentrated in the southeastern and southern regions and were due mainly to the increase in grassland and water area. The cold spots were mainly located in the north and southwest and were the direct result of human activities leading to the conversion of grassland and water into cropland and barren land. The distribution area of ESV loss hotspots shows an overall increase in ESV in the study area for the 30-year study period.

3.4. CA–Markov Model Simulation and Prediction

In this study, the equivalent factor method was used to calculate the ecosystem service value, and the change in land-use type is closely related to the ecosystem service value. We analyzed the change in ecosystem service value on the northern slopes of the Kunlun Mountains from 1990 to 2020. Based on the land-use data of 2020, the CA–Markov model is used to simulate and predict the period from 2020 to 2030. Based on the impact of land-use type conversion on the value of ecosystem services, we discussed the reasons for the increase in the value of ecosystem services and provided a scientific basis for ecological protection in the study area in the future.
Through simulation and prediction, it can be concluded that the conversion between various land types in different periods on the northern slopes of the Kunlun Mountains is quite frequent, and its main feature is the mutual conversion between grassland, forest land, unused land, and other land types (Figure 9). The area of grassland, forest land, construction land and water area is increasing, and the area of grassland is increasing the most. The increase was 4534.89 × 103 hm2 (Table 6). In the study area, the water area increased by 644.97 × 10³ hm2, and the unused land and cultivated land both showed a decreasing trend. The unused land decreased by 4830.42 × 103 hm2 with the largest amplitude. The unused land was transformed into grassland and water area by 6417.17 × 103 hm2 and 515.09 × 10³ hm2, respectively. Grassland increased mainly in the Yerqiang River basin in the southwest and the upper Chelson River basin in the east. Unused land in the Hotan River Basin and Keriya River Basin is also partially converted to grassland and water.
The ecosystem service value of the northern slopes of the Kunlun Mountains predicted by the simulation will increase from 2020 to 2030. According to the simulation prediction, the ecosystem service value of the northern slopes of the Kunlun Mountains in 2030 is CNY 455.495 billion (Table 7), which increases by CNY 128.945 billion compared with 2020. Among them, the adjustment services, support services, supply services, and cultural services have, respectively, increased relative to 2020: 765.1, 422.76, 62.33, and CNY 3.924 billion. We found that the main increase in the value of ecosystem services predicted by the simulation in 2030 comes from the regulation services. Through the study, we concluded that grassland, water area, and forest land are the main factors that increase the regulation services. The decrease in unused land and cultivated land and the increase in grassland, forest, and water areas on the northern slopes of the Kunlun Mountains indicate that the ecology in the study area is gradually recovering. Therefore, strengthening the ecological protection in the study area is of great significance to the ecological restoration of the northern slopes of the Kunlun Mountains.

4. Discussion

4.1. Methods for Valuing Ecosystem Services

Ecosystem service value assessment translates the current state of the ecosystem into many ecological assets [43]. Its intuitive form is more suitable for interpretation by policymakers and the public and helps to identify problems. Research on the assessment of ecosystem service values and their driving mechanisms provides an in-depth analysis of the development trends and change mechanisms of the ecological environment [44]. Furthermore, the assessment of ESV gives a scientific basis for promoting regional ecological civilization construction and optimizing management decisions.
However, despite the obvious advantages of evaluating ESV, such evaluations can be controversial in terms of the methods applied. One study found that the evaluation of ecological status and remote sensing data combination areas is currently the most important research tool, but the degree of accuracy and timeliness of ESV evaluation may be questionable [45]. At this stage, the valuation of ecosystem services can be broadly divided into two types: methods based on the functional price per unit of service and methods based on the value equivalent factor per unit area [46]. Of these two options, the value equivalent method is more intuitive, has a uniform evaluation method and parameter criteria, and is suitable for regional ecosystem service valuation [47]. The equivalence factor approach has been applied to global regions and has been very fruitful. For example, Belay et al. estimated the value of ecosystem services in the African highlands of the Guna Mountains in northwestern Ethiopia for the period 1995–2020 and found a decreasing trend [48]. Hoque et al., estimating the value of ecosystem services in the coastal zone of Bangladesh, found that increased mangrove area and human activities led to a decrease in the value of ecosystem services in the overall coastal zone [49]. Deloyde et al. estimated the value of ecosystem services in southern Ontario, Canada, between 2002 and 2015 and found that the value of regulating services declined while the value of cultural services increased [50]. Therefore, this paper adopted a modified equivalence factor method for unit area values, which combines the ecosystem characteristics of the study area to provide a more accurate assessment of ESV. The value of ecosystem services has significant spatial variation, which is the result of the interaction between natural and socio-economic factors. Therefore, attention should be paid to spatial differentiation when exploring the influence mechanisms of value of ecosystem services.

4.2. Impacts of Land Use on the Value of Ecosystem Services

Our study area is an important part of China’s ecologically fragile northwest. It is also the core of the Silk Road Economic Belt, so ecological monitoring of this area is crucial. Since 1990, the transformation between land-use types has been dramatic, due mostly to the combined effects of global warming and socio-economic development. A large amount of grassland has been transformed into cropland and barren land, while the water area has maintained an upward trend after initially increasing and then decreasing. The fastest increase occurred from 2000 to 2010. The conversion of barren land to water is mostly the result of the accelerated water cycle and global warming [51].
In general, the conversion of ESV low-value land types to high-value land types is one of the main reasons for the increase in ESV. This suggests that the northern slopes of the Kunlun Mountains are in a zone that is sensitive to global changes and responds more directly to temperature increases and intensified water cycles within the arid zone. Accordingly, when further developing the economy in the north, attention should be paid to the impact of the significant reduction in grassland areas on the fragile ecological environment. Furthermore, ecological problems such as the waste of water resources and the shortage of ecological water supply downstream due to the increase in cropland areas and water conservancy facilities should also be considered [52]. Alongside vigorously promoting living standards, we still need to focus on improving the quality of the living environment. The increase and protection of ecological land will, to a certain extent, alleviate the human/land conflict and improve the region’s overall ESV.
Although the ESV benefits in the study area have increased, enormous ecological problems remain in the region. The impact of multiple factors should be considered when exploring the balance point of loss and gain of regional ESV, and ecological restoration projects should be implemented according to the regional environmental characteristics to achieve the purpose of maintaining regional ecological assets and promoting green and high-quality development. María [53] argued that increased land-use intensity alters key components critical to ecosystem functioning and changes the synergies between biodiversity and ecosystem functions and services and that different land-use types respond differently to the valuation of ecological services. In the spatial deployment of the value of ecosystem services, policymakers should thus focus on the trade-offs between land market returns, ecosystem restoration, and biodiversity conservation [54].
In addition, there is as yet no universally accepted method to explore the impact of land-use change on ESV based on a spatial scale. In this paper, we applied the spatial autocorrelation analysis method based on grid cells, as we hoped this approach would better express the response of ESV to land-use change from a spatial perspective. We also used the LISA clustering map and ESV hotspot map to show the characteristics of ESV distribution change. This combined approach can provide a feasible way for future exploration of the impact of land-use evolution on the value of ecosystem services.
Moreover, in our research, we found that High–High-type areas are mostly located in the mountains and at the intersection of mountains and plains, indicating that the vegetation area is significantly increasing. This finding further supports that the increase in surface water resources leads to the expansion of vegetation area under climate change, thus affecting ESV changes. The increase in Low–High type areas points to an increase in cropland area, which is highly aggregated in space. However, ESV remains of low value because the ecosystem service capacity of agricultural land is weak.
In the spatial correlation analysis from 2010 to 2020, a decreasing trend was found in the High–High-type area, mainly due to a reduction in the watershed. The change in the area of water resources was affected by numerous factors, including increases in temperature and the conversion of ecological land such as grassland, wetland, and watershed into agricultural land and wasteland by excessive reclamation.

4.3. Ecological Conservation and Development in the Study Area

To explore the value of ecosystem services on the northern slopes of the Kunlun Mountains, land-use data from 1990 to 2020 were selected and combined with the CA–Markov model, and the status and future changes in ecosystem services on the northern slopes of the Kunlun Mountains were analyzed. By comparing the changing characteristics of ESV between the study area and other regions in Xinjiang, China, it was found that the changing trends are not the same. For example, the ESV of the Aksu River Basin in Xinjiang showed a fluctuating upward trend from 1990 to 2020 [55], while the ESV of the northern edge of the Tarim River Basin showed a continuous downward trend from 1994 to 2016 [56]. From a regional perspective, from 2000 to 2015, the overall ESV of Xinjiang showed a downward trend [57]. The differences in ESV between regions are mainly caused by differences in land-use structure, terrain, time scale, and research area scale. Zuripia et al. estimated that the ecosystem service value of the Kashgar River Basin showed an upward trend from 2000 to 2020 [58]. The CA–Markov model is also one of the more accurate prediction methods currently available. Gasirabo et al. Predictive assessment of land use in Chittagong Hill Tracts, Bangladesh, using CA–Markov modeling [59]. Amir Siddique et al., in their study of Beijing’s urban heat, also used the CA–Markov model to predict Beijing’s land use for the period 2004–2050 [60]. Therefore, we concluded that the ecosystem service value of the northern slopes of the Kunlun Mountains showed an upward trend between 1990 and 2030.
In addition, the ecological problems of the northern slopes of the Kunlun Mountains, which are at the core of the Silk Road Economic Belt, are one of the biggest obstacles to the ecological restoration process of China’s “green water and green mountains”. In recent years, against a background of global changes and the intensification of human activities [61], the ecological environment of the study region has become increasingly fragile, and the conflict between humans and land has intensified, seriously hindering the progress of ecological civilization construction in the basin. This paper takes the spatial and temporal changes in ESV as an entry point to map the ecological assets of the watershed at both temporal and spatial scales to measure the current ecological status of the watershed and visual changes in ecological assets and to provide more general theoretical support for decision-makers in formulating ecological restoration policies. In addition, the study of dynamic changes in ESV at spatial scales provides basic support for delineating regions to formulate ecological restoration policies to ensure their implementation in accordance with local conditions.

5. Conclusions

Based on long-term land-use data and spatial autocorrelation analysis, this paper explores the impacts of land-use pattern evolution on ecosystem service values on the northern slopes of the Kunlun Mountains from 1990 to 2020 and the analysis of future simulation prediction. The study uses grid cells to cover the study area and the modified unit area equivalent factor method. The main findings are as follows:
(1)
Unexploited land, grassland, and watershed are the land-use types that account for more than 85% of the study area. During the study period, the water area showed a continuous growth trend, while grassland, cropland, woodland, and construction land showed a fluctuating growth trend and barren land charted a continuous decline. Among these land types, construction land had the highest increase (291.04%), followed by woodland, whereas grassland had the lowest increase. Only barren land showed a decrease.
(2)
The ESV of the study area trended slightly downward from 1990 to 2000 and sharply upward from 2000 to 2010, and then reverted to a slight downward trend from 2010 to 2020. The overall ESV showed an upward trend from 1990 to 2020, with a total increase of CNY 17.906 billion. The upward trend of watershed areas intensified the most from 2000 to 2010, with ESV increasing by CNY 39.857 billion due mainly to low-value land-use types shifting to high-value land-use types.
(3)
In terms of space, the value-added areas of ESV in the study area from 1990 to 2020 are mainly concentrated in the northwest and southern regions of the study area. the loss area of ESV is mainly distributed in the northern part of the study area. Based on the cold and hot spot map of ESV changes in the study area, it can be seen that the ecosystem service value of the northern slopes of the Kunlun Mountains is increasing. According to the CA–Markov model analysis, the grassland, forest land, and water area in the study area will increase from 2020 to 2030. The growth trend of the ecosystem service value of the northern slopes of the Kunlun Mountains is obvious in 2030, and the ecological environment will steadily improve. This is due to the conversion of unused land into grassland and forest land. We also found that the conversion of unused land into grassland has a positive impact on the ecology of the region. In the future, we will continue to research the northern slopes of the Kunlun Mountains, explore the driving factors of ecosystem service value, and conduct in-depth research on the impact of climate change on the ecosystem service value of the northern slopes of the Kunlun Mountains.

Author Contributions

Y.W. contributed to the formulation of the research questions; Z.Z. (Zhichao Zhang) performed the data analysis and paper writing; H.T. and Z.Z. (Zhen Zhu) were responsible for data processing and interpretation of the results. Y.W. managed the project and funded this paper. All authors have read and agreed to the published version of the manuscript.

Funding

This research was funded by the Third Xinjiang Scientific Expedition Program (Grant No: 2021xjkk010202).

Data Availability Statement

The data presented in this study are available on request from the corresponding author.

Conflicts of Interest

The authors declare no conflict of interest.

References

  1. Costanza, R.; D’Arge, R.; Groot, R.D.; Farber, S.; Grasso, M.; Hannon, B.; Limburg, K.; Naeem, S.; Neill, R.V.; Paruelo, J.; et al. The value of the world’s ecosystem services and natural capital. Nature 1997, 387, 253–260. [Google Scholar] [CrossRef]
  2. Darvill, R.; Lindo, Z. The inclusion of stakeholders and cultural ecosystem services in land management trade-off decisions using an ecosystem services approach. Landsc. Ecol. 2016, 31, 533–545. [Google Scholar] [CrossRef]
  3. Daily, G.C. Nature’s Services: Societal Dependence on Natural Ecosystems; Island Press: Washington, DC, USA, 1997; p. 3. [Google Scholar]
  4. OuYang, Z.Y.; Wang, X.K.; Miao, H. A preliminary study on the service functions of terrestrial ecosystems and their ecological and economic values in China. J. J. Ecol. 1999, 5, 19–25. [Google Scholar]
  5. Xie, G.D.; Zhang, C.X.; Zhang, C.S.; Xiao, Y.; Lu, C.X. The value of ecosystem services in China. Resour. Sci. 2005, 37, 1740–1746. [Google Scholar]
  6. Parron, L.M.; Villanueva, A.J.; Glenk, K. Estimating the value of ecosystem services in agricultural landscapes amid intensification pressures: The Brazilian case. Ecosyst. Serv. 2022, 57, 101476. [Google Scholar] [CrossRef]
  7. Shi, F.; Zhou, B.; Zhou, H.; Zhang, H.; Li, H.; Li, R.; Guo, Z.; Gao, X. Spatial Autocorrelation Analysis of Land Use and Ecosystem Service Value in the Huangshui River Basin at the Grid Scale. Plants 2022, 11, 2294. [Google Scholar] [CrossRef]
  8. Braun, D.; de Jong, R.; Schaepman, M.E.; Furrer, R.; Hein, L.; Kienast, F.; Damm, A. Ecosystem service change caused by climatological and non-climatological drivers: A Swiss case study. Ecol. Appl. A Publ. Ecol. Soc. Am. 2019, 29, e01901. [Google Scholar] [CrossRef]
  9. Pan, N.; Guan, Q.; Wang, Q.; Sun, Y.; Li, H.; Ma, Y. Spatial differentiation and driving mechanisms in ecosystem service value of arid region:a case study in the middle and lower reaches of shule river basin, nw china. J. Clean. Prod. 2021, 319, 128718. [Google Scholar] [CrossRef]
  10. Nelson, E.; Mendoza, G.; Regetz, J.; Polasky, S.; Tallis, H.; Cameron, D.R.; Chan, K.M.A.; Daily, G.C.; Goldstein, J.; Kareiva, P.M. Modeling multiple ecosystem services, biodiversity conservation, commodity production, and tradeoffs at landscape scales. Front. Ecol. Environ. 2009, 7, 4–11. [Google Scholar] [CrossRef]
  11. Felipe-lucia, M.R.; Comín, F.A.; Bennett, E.M. Interactions among ecosystem services across land uses in a floodplain agroecosystem. Ecol. Soc. 2014, 19, 360–375. [Google Scholar] [CrossRef]
  12. Gren, I.M.; Groth, K.H.; Sylvén, M. Economic values of danube floodplains. J. Environ. Manag. 1995, 45, 333–345. [Google Scholar] [CrossRef]
  13. Benez, S.; Fabio, J.D.; Puneet, F.; Susana, H.C.; Jeffrey, W. Trade-offs Between the Value of Ecosystem Services and Connectivity Among Protected Areas in the Upper Chattahoochee Watershed. J. Environ. Manag. 2022, 69, 937–951. [Google Scholar]
  14. Wu, C.Y.; Chen, B.; Huang, X.J.; Wei, Y.H.D. Effect of land-use change and optimization on the ecosystem service values of Jiangsu province, China. J. Ecol. Indic. 2020, 117, 106507. [Google Scholar] [CrossRef]
  15. Gagarin, L.; Wu, Q.; Cao, W. Icings of the Kunlun Mountains on the Northern Margin of the Qinghai-Tibet Plateau, Western China: Origins, Hydrology and Distribution. J. Water 2022, 14, 2396. [Google Scholar] [CrossRef]
  16. Kang, L.; Jia, Y.; Zhang, S.L. Spatiotemporal distribution and driving forces of ecological service value in the Chinese section of the “Silk Road Economic Belt”. J. Ecol. Indic. 2022, 141, 109074. [Google Scholar] [CrossRef]
  17. Ma, X.; Zhang, H. Land-Use/Land-Cover Change and Ecosystem Service Provision in Qinghai Province, China: From the Perspective of Five Ecological Function Zones. J. Land. 2023, 12, 656. [Google Scholar] [CrossRef]
  18. Chen, Y.; Xu, E. The Spatiotemporal Change in Land Cover and Discrepancies within Different Countries on the Qinghai–Tibet Plateau over a Recent 30-Year Period. Land 2023, 12, 1797. [Google Scholar] [CrossRef]
  19. Hughes-Allen, L.; Bouchard, F.; Séjourné, A.; Fougeron, G.; Léger, E. Automated Identification of Thermokarst Lakes Using Machine Learning in the Ice-Rich Permafrost Landscape of Central Yakutia (Eastern Siberia). Remote Sens. 2023, 15, 1226. [Google Scholar] [CrossRef]
  20. Mantas, V.; Caro, C. User-Relevant Land Cover Products for Informed Decision-Making in the Complex Terrain of the Peruvian Andes. Remote Sens. 2023, 15, 3303. [Google Scholar] [CrossRef]
  21. Druckenmiller, H. Accounting for ecosystem service values in climate policy. J. Nat. Clim. Chang. 2022, 12, 596–598. [Google Scholar] [CrossRef]
  22. Maimaiti, B.; Chen, S.; Kasimu, A. Coupling and Coordination Relationships between Urban Expansion and Ecosystem Service Value in Kashgar City. Remote Sens. J. 2022, 14, 2557. [Google Scholar] [CrossRef]
  23. Niu, S.; Sun, M.; Wang, G.; Wang, W.; Yao, X.; Zhang, C. Glacier Change and Its Influencing Factors in the Northern Part of the Kunlun Mountains. Remote Sens. 2023, 15, 3986. [Google Scholar] [CrossRef]
  24. Zhang, Z.; Xia, F.; Yang, D.; Huo, J.; Chen, H. Spatiotemporal characteristics in ecosystem service value and its interaction with human activities in Xinjiang, China. J. Ecol. Indic. 2020, 110, 105826. [Google Scholar] [CrossRef]
  25. Beaudon, E.; Sheets, J.M.; Martin, E.; Sierra-Hernández, M.R.; Mosley-Thompson, E.; Thompson, L.G. Aeolian Dust Preserved in the Guliya Ice Cap (Northwestern Tibet): A Promising Paleo-Environmental Messenger. Geosciences 2022, 12, 366. [Google Scholar] [CrossRef]
  26. Zhu, S.; Zhao, Y.; Huang, J.; Wang, S. Analysis of Spatial-Temporal Differentiation and Influencing Factors of Ecosystem Services in Resource-Based Cities in Semiarid Regions. J. Remote Sens. 2023, 15, 871. [Google Scholar] [CrossRef]
  27. Ma, X.; Yan, W.; Zhao, C.; Kundzewicz, Z.W. Snow-Cover Area and Runoff Variation under Climate Change in the West Kunlun Mountains. Water 2019, 11, 2246. [Google Scholar] [CrossRef]
  28. Li, C.G.; Wang, M.; Liu, W.; Lee, S.Y.; Hou, J. Quantitative estimates of Holocene glacier meltwater variations on the Western Tibetan Plateau. J. Earth Planet. Sci. Lett. 2021, 559, 116766. [Google Scholar] [CrossRef]
  29. Lu, Q.; Hua, D.; Li, Y.; Wang, D. Estimation of Water Resource Ecosystem Service Value inTarim River Basin—From a Full Value Chain Perspective. Water 2022, 14, 2355. [Google Scholar] [CrossRef]
  30. Xu, H.; Yang, J.; Xia, G.; Lin, T. Spatio-temporal Differentiation of Coupling Coordination between Ecological Footprint and Ecosystem Service Functions in the Aksu Region, Xinjiang, China. Sustainability 2022, 14, 3483. [Google Scholar] [CrossRef]
  31. Adila, A.; Abudukeyimu, A.; Abdugheni, A.; Abdulla, A.; Jiao, J.; Bin, O. Land Use and Land Cover Change Effects on the Value of Ecosystem Services in the Konqi River Basin, China, under Ecological Water Conveyance Conditions. Forests 2023, 14, 1028. [Google Scholar]
  32. Yang, J.; Huang, X. The 30 m annual land cover dataset and its dynamics in China from1990 to 2019. J. Earth Syst. Sci. Data 2021, 13, 3907–3925. [Google Scholar] [CrossRef]
  33. Liu, C.; Xu, R.; Xu, K.; Lin, Y.; Cao, Y. Carbon Emission Effects of Land Use in Chaobai River Region of Beijing–Tianjin–Hebei, China. Land 2023, 12, 1168. [Google Scholar] [CrossRef]
  34. Xie, G.D.; Zhang, C.X.; Zhen, L.M.; Chen, W.H.; Li, S.M. Dynamic changes in the value of China’s ecosystem services—ScienceDirect. J. Ecosyst. Serv. 2017, 26, 146–154. [Google Scholar] [CrossRef]
  35. Zhang, S.; Wang, Y.; Wang, Y.; Li, Z.; Hou, Y. Spatiotemporal Evolution and Influencing Mechanisms of Ecosystem Service Value in the Tarim River Basin, Northwest China. Remote Sens. 2023, 15, 591. [Google Scholar] [CrossRef]
  36. Ling, H.B.; Yan, J.J.; Xu, H.L.; Guo, B.; Zhang, Q.Q. Estimates of shifts in ecosystem service values due to changes in key factors in the Manas River basin, northwest China. J. Sci. Total Environ. 2019, 659, 177–187. [Google Scholar] [CrossRef]
  37. Orna, R.; Shiri, Z.; Ido Izhaki, A.L. The effect of wildfire and land-cover changes on the economic value of ecosystem services in Mount Carmel Biosphere Reserve, Israel. J. Ecosyst. Serv. 2021, 49, 101291. [Google Scholar]
  38. Wan, L.H.; Wang, S.W.; Chen, X.H. Spatial correlation of GDP in Hadazhi industrial corridor based on GeoDA. Geogr. Res. 2011, 30, 8. [Google Scholar]
  39. Wu, X.; Zhang, L.; Gao, L.; Li, Y.; Liu, X. Change and Tradeoff/Synergy Analysis of Watershed Ecosystem Services: A Case Study of Qinghai Lake Basin. Sustainability 2023, 15, 11711. [Google Scholar] [CrossRef]
  40. Guo, C.Y.; Gao, S.; Zhou, B.Y.; Gao, J.H. Effects of land use change on ecosystem service value in Funiu Mountain based upon a grid square. J. Acta Ecol. Sin. 2019, 39, 3482–3493. [Google Scholar]
  41. Di-Gregaria, A.; Jonsen, L.J. Land Cover Classification System, Concepts and User Manual; FAO: Rome, Italy, 2005. [Google Scholar]
  42. Bcp, A.; Dgb, B.; Bas, C.; Gam, D. Using neural networks and GIS to forecast land use changes: A Land Transformation Model. Computers. Environ. Urban Syst. 2002, 26, 553–575. [Google Scholar]
  43. Ouyang, Z.; Zheng, H.; Xiao, Y.; Polasky, S.; Liu, J.; Xu, W.; Wang, Q.; Zhang, L.; Xiao, Y.; Rao, E.; et al. Improvements in ecosystem services from investments in natural capital. J. Sci. 2016, 352, 1455–1459. [Google Scholar] [CrossRef]
  44. Long, X.R.; Lin, H.; An, X.X.; Chen, S.D.; Qi, S.Y.; Zhang, M. Evaluation and analysis of ecosystem service value based on land use/cover change in Dongting Lake wetland. J. Ecol. Indic. 2022, 136, 108619. [Google Scholar] [CrossRef]
  45. Li, C.; Zheng, H.; Li, S.Z.; Chen, X.S.; Li, J.; Zeng, W.H.; Liang, Y.C.; Polasky, S.; Feldman, M.W.; Ruckelshaus, M.; et al. Impacts of conservation and human development policy across stakeholders and scales. Proc. Natl. Acad. Sci. USA 2015, 112, 7396–7401. [Google Scholar] [CrossRef]
  46. Cheng, Q.; Zhou, L.; Wang, T. Assessment of ecosystem services value in Linghekou wetland based on landscape change. Environ. Sustain. Indic. 2022, 15, 100195. [Google Scholar] [CrossRef]
  47. Xiao, Y.; Huang, M.D.; Xie, G.D.; Zhen, L. Evaluating the impacts of land use change on ecosystem service values under multiple scenarios in the Hunshandake region of China. J. Sci. Total Environ. 2022, 850, 158067. [Google Scholar] [CrossRef]
  48. Belay, T.; Melese, T.; Senamaw, A. Impacts of land use and land cover change on ecosystem service values in the Afroalpine area of Guna Mountain, Northwest Ethiopia. Heliyon 2022, 8, e12246. [Google Scholar] [CrossRef]
  49. Hoque, M.Z.; Islam, I.; Ahmed, M.; Hasan, S.S.; Prodhan, F.A. Spatio-temporal changes of land use land cover and ecosystem service values in coastal Bangladesh. Egypt. J. Remote Sens. Space Sci. 2022, 25, 173–180. [Google Scholar]
  50. DeLoyde, C.N.M.; Mabee, W.E. Ecosystem service values as an ecological indicator for land management decisions: A case study in southern Ontario, Canada. Ecol. Indic. 2023, 151, 110344. [Google Scholar] [CrossRef]
  51. Hang, X.; Chen, D.C.; Fan, J.D.; Yu, C.; Zhou, Y.; Tang, J.J. Study on the change of ecosystem service value and its correlation with human activities: Taking Changzhou City as an example. J. Environ. Eng. Technol. 2022, 12, 2124–2131. [Google Scholar]
  52. Liu, W.; Liu, Z.; An, Z. Late Miocene episodic lakes in the arid Tarim Basin, western China. Proc. Natl. Acad. Sci. USA 2014, 111, 16292–16296. [Google Scholar] [CrossRef] [PubMed]
  53. María, R.F.L.; Soliveres, S.; Penone, C. Land-use intensity alters networks between biodiversity, ecosystem functions, and services. Proc. Natl. Acad. Sci. USA 2020, 117, 28140–28149. [Google Scholar]
  54. Gui, D.; Lei, J.; Mu, G.; Zeng, F. Effects of different management intensities on soil quality of farmland during oasis development in southern Tarim Basin, Xinjiang, China. J. Int. J. Sustain. Dev. World Ecol. 2009, 16, 295–301. [Google Scholar] [CrossRef]
  55. Xie, L.; Wang, H.W.; Liu, S.H. The ecosystem service values simulation and driving force analysis based on land use/land cover: A case study in inland rivers in arid areas of the Aksu River Basin, China. J. Ecol. Indic. 2022, 138, 108828. [Google Scholar] [CrossRef]
  56. Ling, H.B.; Guo, B.; Zhang, G.P.; Xu, H.L.; Deng, X.Y. Evaluation of the ecological protective effect of the “large basin” comprehensive management system in the Tarim River basin, China. Sci. Total Environ. 2019, 650, 1696–1706. [Google Scholar] [CrossRef]
  57. Wang, Y.; Shataer, R.; Zhang, Z.C.; Zhen, H.; Xia, T. Evaluation and Analysis of Influencing Factors of Ecosystem Service Value Change in Xinjiang under Different Land Use Types. J. Water 2022, 14, 1424. [Google Scholar] [CrossRef]
  58. Kulaixi, Z.; Chen, Y.; Li, Y.; Wang, C. Dynamic Evolution and Scenario Simulation of Ecosystem Services under the Impact of Land-Use Change in an Arid Inland River Basin in Xinjiang, China. J. Remote Sens. 2023, 15, 2476. [Google Scholar] [CrossRef]
  59. Yu, X.; Xiao, J.; Huang, K.; Li, Y.; Lin, Y.; Qi, G.; Liu, T.; Ren, P. Simulation of Land Use Based on Multiple Models in the Western Sichuan Plateau. Remote Sens. 2023, 15, 3629. [Google Scholar] [CrossRef]
  60. Amir Siddique, M.; Wang, Y.; Xu, N.; Ullah, N.; Zeng, P. The Spatiotemporal Implications of Urbanization for Urban Heat Islands in Beijing: A Predictive Approach Based on CA–Markov Modeling (2004–2050). Remote Sens. 2021, 13, 4697. [Google Scholar] [CrossRef]
  61. Huang, X.; Ma, J.L. Changes in the ecosystem service values of typical river basins in arid regions of Northwest China. J. Ecohydrol. 2013, 6, 1048–1056. [Google Scholar] [CrossRef]
Figure 1. Overview map of the study area.
Land 12 02123 g001
Figure 2. Status of land use on the northern slopes of the Kunlun Mountains.
Land 12 02123 g002
Figure 3. (a) Structure of land-use types (%); (b) dynamic attitude of land-use types (%).
Land 12 02123 g003
Figure 4. Status of land-use flow on the northern slopes of the Kunlun Mountains from 1990 to 2020.
Land 12 02123 g004
Figure 5. Spatial variation distribution characteristics of ESV on the northern slopes of the Kunlun Mountains.
Land 12 02123 g005
Figure 6. Moran Index for the northern slopes of the Kunlun Mountains, 1990–2020.
Land 12 02123 g006
Figure 7. LISA clustering map of ESV on the northern slopes of the Kunlun Mountains, 1990–2020.
Land 12 02123 g007
Figure 8. Cold hotspot analysis of ESV on the northern slopes of the Kunlun Mountains.
Land 12 02123 g008
Figure 9. Future land change and future ecosystem service values on the northern slopes of the Kunlun Mountains: (a) 2020; (b) actual and simulated land-use change results from the CA–Markov model in 2030; (c) ecosystem service values in 2020; and (d) projected ecosystem service values in 2030.
Land 12 02123 g009
Table 1. Classification of Land Use.
Serial NumberLand-Use TypeLand Type
1CroplandPaddy fields, drylands, mountains, hills, plains, sloping land, etc.
2WoodlandWoodlands, open woodlands, shrublands, and other woodlands, etc.
3GrasslandHigh-coverage grassland, medium-coverage grassland, low-coverage grassland, etc.
4WaterRivers and canals, lakes, reservoirs, wetlands, ponds, etc.
5Construction landUrban land, rural settlements, etc.
6Barren landSandy land, Gobi, saline land, etc.
Table 2. ESV Coefficient for the Northern Slopes of the Kunlun Mountains/CNY·hm−2.
Ecosystem Service FunctionLand-Use Type
CroplandWoodlandGrasslandWaterConstruction LandBarren Land
Gas regulation940.916586.371505.46000
Climate regulation1674.825080.921693.64865.6400
Water conservation1129.096021.831505.4638,351.50056.45
Soil formation
and protection
2747.467339.103669.5518.82037.64
Waste disposal3086.192465.182465.1834,211.50018.82
Biodiversity conservation1336.096134.742051.184685.730639.82
Food production1881.82188.18564.55188.18018.82
Raw material production188.184892.7394.0918.8200
Entertainment culture18.822408.7375.278167.1082.6018.82
Total13,003.3841,117.7813,624.3886,507.2982.60790.36
Table 3. Land-Use Transfer Matrix for the Northern Slopes of the Kunlun Mountains, 1990–2020 (×103 hm2).
Land-Use TypeCroplandWoodlandGrasslandWaterConstruction LandBarren LandTotalTransfer
Cropland769.44 0 119.95 1.36 2.64 2.11 895.50 126.06
Woodland0 4.33 0.75 0.02 0.38 0 5.48 1.15
Grassland385.81 12.70 6251.13 60.32 1594.49 10.15 8314.59 2063.46
Water4.04 0.07 25.07 1748.17 241.77 0.36 2019.48 271.31
Construction land100.80 0.36 1929.37 364.82 29,672.65 2.64 32,070.65 2398.00
Barren land0.10 0 0.54 0.05 0.14 1.65 2.48 0.83
Total1260.19 17.46 8326.82 2174.74 31,512.07 16.91
Transfer in490.75 13.13 2075.69 426.56 1839.42 15.26
Table 4. Changes in ESV by Land-Use Type on the Northern Slopes of the Kunlun Mountains, 1990–2020/108 CNY.
Land-Use TypeCroplandWoodlandGrasslandWaterConstruction LandBarren LandTotal
1990ESV112.43 2.12 1083.72 1644.06 0 244.11 3086.45
Proportion3.64%0.07%35.11%53.27%0%7.91%100%
2000ESV121.53 3.29 1047.68 1614.50 0 245.89 3032.90
Proportion 4.01%0.11%34.54%53.23%0%8.11%100%
2010ESV145.45 4.36 1090.76 1952.11 0.01 238.78 3431.47
Proportion 4.24%0.13%31.79%56.89%0%6.96%100%
2020ESV158.47 6.72 1085.42 1775.06 0.01 239.81 3265.50
Proportion 4.85%0.21%33.24%54.36%0%7.34%100%
ESV changes from 1990 to 202046.04 4.59 1.70 131.00 0.01 −4.29 179.06
ESV change rate from 1990 to 202040.95%216.28%0.16%7.97%587.41%−1.76%5.80%
Table 5. Changes in Various ESVs in the Northern Slopes of the Kunlun Mountains, 1990–2020 (108 CNY).
Type 1Type 21990200020102020
Regulation servicesGas regulation128.224.15%125.094.12%121.233.53%132.484.06%
Climate regulation165.915.38%162.455.36%174.405.08%173.935.33%
Water conservation876.1228.39%860.1328.36%1016.2829.62%938.7528.75%
Waste disposal878.9028.48%862.9628.45%1009.8429.43%942.1128.85%
Subtotal2049.1566.39%2010.6266.29%2321.7567.66%2187.2866.98%
Support
services
Soil formation and protection328.0010.63%320.5110.57%337.099.82%338.8310.38%
Biodiversity conservation461.6914.96%457.2115.07%478.8513.95%470.9814.42%
Subtotal789.6925.59%777.7225.64%815.9323.78%809.8124.80%
Provision of servicesFood production70.582.29%70.382.32%76.202.22%77.512.37%
Raw material production9.720.31%9.740.32%10.580.31%10.970.34%
Subtotal80.302.60%80.122.64%86.782.53%88.4920.50%
Cultural
services
Entertainment culture167.305.42%164.445.42%196.485.73%179.935.51%
Total3086.45 3032.90 3420.95 3265.50
Table 6. Simulated projected land-use transfer matrix for the northern slopes of the Kunlun Mountains, 2020–2030 (×103 hm2).
Land-Use TypeCroplandWoodlandGrasslandWaterConstruction LandBarren LandTotalTransfer
Cropland896.58 52.77 182.78 18.26 37.82 71.91 1260.12 363.54
Woodland0 2.44 13.20 0.06 0 1.55 17.25 14.81
Grassland256.98 195.72 6177.14 110.21 21.11 1566.64 8327.82 2150.67
Water0.71 0.23 65.52 1548.90 0.01 560.27 2175.68 626.74
Construction land2.27 2.98 6.89 1.36 3.10 0.19 16.79 13.68
Barren land31.99 65.21 6417.17 515.09 1.53 24,481.08 31,512.13 7030.99
Total1188.53 319.34 12,862.71 2193.88 60.66 26,684.56
Transfer in291.95 316.90 6685.57 644.97 60.47 2200.57
Table 7. Prediction of various ESVs on the northern slopes of the Kunlun Mountains in the future 2030 (108 CNY).
Type 1Type 2Land-Use Type
CroplandWoodlandGrasslandWaterConstruction LandBarren LandTotal
Regulation servicesGas regulation12.65 24.05 214.74 000251.44
Climate regulation22.52 18.56 241.58 20.54 00303.19
Water conservation15.18 21.99 214.74 909.81 016.74 1178.46
Waste disposal41.49 9.00 351.63 811.60 05.58 1219.30
Subtotal91.84 73.61 1022.68 1741.94 022.32 2952.38
Support servicesSoil formation and protection36.94 26.80 523.42 0.45 011.16 598.77
Biodiversity conservation17.96 22.40 292.58 111.16 0189.70 633.81
Subtotal54.90 49.21 815.99 111.61 0200.86 1232.57
Provision of servicesFood production25.30 0.69 80.53 4.46 05.58 116.56
Raw material production2.53 17.87 13.42 0.45 00 34.27
Subtotal27.83 18.56 93.95 4.91 05.58 150.82
Cultural servicesEntertainment culture0.25 8.80 10.74 193.75 0.06 5.58 219.17
Total174.83 150.17 1943.35 2052.21 0.06 234.34 4554.95
Disclaimer/Publisher’s Note: The statements, opinions and data contained in all publications are solely those of the individual author(s) and contributor(s) and not of MDPI and/or the editor(s). MDPI and/or the editor(s) disclaim responsibility for any injury to people or property resulting from any ideas, methods, instructions or products referred to in the content.

