
Identification of Facade Elements of Traditional Areas in Seoul, South Korea


1
Department of Architecture, Chungbuk National University, Cheongju 28644, Republic of Korea
2
Department of Civil and Environmental Engineering, Korea Advanced Institute of Science and Technology, Daejeon 34141, Republic of Korea
3
Institute of Construction and Environmental Engineering, Seoul National University, Seoul 08826, Republic of Korea
*
Author to whom correspondence should be addressed.
Land 2023, 12(2), 277; https://doi.org/10.3390/land12020277
Submission received: 9 December 2022
/
Revised: 3 January 2023
/
Accepted: 9 January 2023
/
Published: 18 January 2023
(This article belongs to the Special Issue Ecology of the Landscape Capital and Urban Capital)
Abstract
:The Bukchon area in Seoul boasts a high density of Hanok, the traditional Korean architecture representing the region. Because the Hanok facade plays a vital role in the streetscape formation, we must record it in terms of social, cultural, historical, artistic, and scenic values. However, recording the facade of an existing Hanok building through drawing or image information is time consuming and labor intensive, and therefore costly. Further, its digital conversion is inherently difficult. This study proposes the use of deep learning to identify the form elements that comprise the Hanok facade. Three-dimensional modeling was performed on 405 well-preserved Hanok facades in the region, and 2808 items of image data were created under similar conditions and at differing angles. Labeling was performed on the shape elements of the Hanok facade, and a methodology was established to identify the facade elements using MASK R-CNN. The type of roof, windows, the lower part of the outer wall, and the design were identified with high accuracy.
1. Introduction
A street is the smallest unit of city through which humans can navigate the city and the combination of streets defines its physical form and image [1,2]. Additionally, it is the smallest unit of public space that contains daily human life and continues to create the region’s characteristics. To restore localities and improve the image and competitiveness of the city as a whole, it is crucial to understand street-level spaces [3]. We must maintain and restore local characteristics by overcoming the limitations of area management methods such as zoning, and by implementing unique rules (codes) in the street that reflect regional characteristics [4,5]. In Korea, the “District unit plans” and “Special street zones” systems stipulate detailed building standards at the street level [6,7].
The street space comprises various physical elements, such as architecture, roads, landscaping, and humans, and buildings are the essential elements. A building is a sociocultural product, an artificial structure created by human beings through social agreement, following local rules [8]. For this reason, buildings significantly contribute to forming regional characteristics by influencing the streetscape. The exterior of a building exposed to the street space comprises elements such as the number of floors, outline of the building, color, windows and doors, structure, and finishing materials, and the combination of these elements determines the character of the street. Understanding the morphological rules of the building exterior makes it easy to establish a street unit policy based on locality or to make an architectural design.
To understand the morphological rules of the exterior of buildings in the region, we must examine the available records. Building exterior records of traditional buildings in densely populated areas are useful because planning information for such areas is no longer available. Studies are being conducted to record historical, artistic, and scenic values of traditional areas that are losing their local characteristics because of development. For instance, facade drawings are prepared through actual measurements or recorded as photographic information of existing buildings. Additionally, there are attempts to create three-dimensional records by obtaining 3D shape information using a sensor. These records are provided with high-quality information through web services [9,10,11,12,13]. However, it is difficult to understand the locality well through the rules concerning building exteriors alone. Therefore, in addition to recording drawings, images, and shape information, detailed form elements that form the exterior of a building should be classified and recorded. Further, features occurring in a region can be presented as a form-based code (FBC) [14].
Building exterior information is crucial in digital twin advancement and the implementation of building information modeling (BIM) information conversion in addition to value records for exploring the locality. Adding data properties to image or shape information can be extended and linked with the BIM model. Form elements can be identified from image information and built into digital data through a pre-designed BIM library. However, classifying the exterior information of each building located in the street space is time consuming and expensive. Modern buildings can utilize digital drawing information; however, for traditional buildings without drawings, exterior information must be newly recorded. A deep learning-based image processing method, which has been actively and extensively researched, is expected to effectively identify the form elements constituting the exterior of a building.
This study utilizes a deep learning model to identify the form elements that constitute the facade of a traditional South Korean building, the Hanok. Before applying the model to modern buildings with a diverse morphological range, we first applied it to traditional buildings with complex forms, but simple combination principles. The deep learning model utilized detectron2’s Mask R-CNN. The target site was a building (Hanok) constructed recently in a traditional area (Bukchon) in Jongno-gu, Seoul, Korea (Figure 1). After selecting well-preserved Hanok cases, these were modeled with BIM (Revit) similarly to the actual ones, and 2808 images rendered under the same conditions were extracted. After labeling the form elements constituting the Hanok facade, the form elements were identified through Mask R-CNN (Figure 1 and Figure 2).
2. Literature Review
2.1. Street and Place
A street is the smallest unit of public space where daily life occurs [1]. Visitors experience the city first from the street, and the city is formed and defined by a combination of these streets [1,2]. A street is a space that can be easily encountered in daily life and where locality is well revealed [15]. Although numerous researchers have mentioned the importance of street spaces, they are often underestimated compared to urban planning or architectural design within a lot.
Urban planning in several countries, including the United States [16], Canada [17], France [18], Japan [19], and South Korea [20], determines architectural behavior through zoning. Zoning is an urban management tool that suppresses the quantitative expansion of the city by controlling the building behavior in an area after classifying the developmental scope and use of the area [21]. Lots can be classified into residential, commercial, and industrial types, and the density, height, size, green area, and parking can be regulated. Single-use zoning allows a village to form a community of local residents, but it is difficult to access for visitors [1]. In contrast, downtown areas are easy for visitors to access but have a disadvantage in that it is difficult to form a community [1]. To compensate for each disadvantage, multiuse zones in which different uses are mixed have emerged. With the mixing of residential and commercial areas, there are examples of a balance between attracting visitors and improving the community of local residents [1]. Although this was developed to subdivide the use area, because it was a top-down plan that prioritized efficient management, it was laborious to consider the characteristics of the area or community. Regional characteristics can be approached with the concept of place, and it is difficult to include the sociocultural values, residents’ activities, and physical characteristics of the region in detail. Accordingly, street unit plans are based on regions or places that appeared under New Urbanism [22]. New Urbanists attempted to manage the quality level of the public area with a street unit plan and proposed a detailed regulation plan for the shape of the building [22]. Local officials proposed the shape-based code to maintain regional characteristics by establishing rules for controlling the shape of buildings [4,5].
In a street space, places are formed through the physical environment, human social activities, meanings, and experiences [23]. The physical environment of the street is composed of various elements, such as buildings, walking paths, landscaping, and roads, and contains the social activities and meanings of the region. In particular, the essential element that composes the street space is buildings, and they are crucial in shaping the atmosphere of the street space while representing the regional characteristics. Because a building is an artificial structure created by human beings through social agreement, it contains local rules, such as the number of floors, building outline, color, windows, structure, and finishing materials [8]. Because a building is a social and cultural product of human beings, it is apparent that understanding the shape of a building comprehends all aspects of a local place. However, by understanding the physical rules, we can understand the sociocultural meaning and activities of the region. Furthermore, we can use regional characteristics by presenting a specific form known as FBC.
2.2. Traditional Architecture in the Modern Period of Seoul: Urban Hanok in Bukchon
In Seoul, traditional buildings are concentrated in the Bukchon area (Figure 3). Located next to the Gyeongbokgung Palace and Changdeokgung Palace in the center of Seoul, it was the residence of influential people during the Joseon Dynasty. Recently, it is being used as a residential area while preserving traditional buildings [24]. However, in the early 1900s, as the population exploded in Seoul, the housing crisis escalated, and the land in the Bukchon residential area was divided to build Hanok [24]. As it was built by dividing a lot, the walls and the building were matched, and an urban Hanok with a narrow yard was constructed [24]. This type of Hanok was continuously built until the 1960s, but began to be demolished because of rapid development [24]. However, in 2000, a social movement for preserving traditional sites emerged. Through government funding and repair support policies, the number of Hanoks increased and the region established itself as a representative traditional building concentration area in Seoul [24].
The Bukchon area is formed along the valley that flows north to south. Naturally formed streets, those created through land readjustment in the early 1900s, and roads expanded until the 1980s reached the current road system [24]. The street width in these areas varies from a narrow street of approximately 2 m to a wide road where cars can pass, but most are narrow. In addition, when dividing a large lot, the street is connected to the dwellings in each lot, and the buildings and streets arranged along the south side show regularity [25].
Hanoks in the Bukchon area are built on a dense background by dividing a large lot and on the street boundary to form a unique streetscape. Therefore, urban Hanoks in the Bukchon area are morphologically different from those in the suburbs. Furthermore, since urban Hanok were built in modern times, materials such as glass, tiles, and bricks were also used and supplied in a relatively standardized form [25]. Hanok legally refers to a building with a wooden main structure with columns, beams, and a Korean-style roof, and reflects the traditional Korean architectural style [26]. The Hanok exposed from the street can be identified by such legally defined features and the stylobate, outer walls, openings, gates, and walls, and the facade is composed according to the combination of these elements. In some cases, Hanoks in the Bukchon area have traditional elements that are well preserved, and in others, were improved in the modern era.
2.3. Image Processing for Building Facade
Object detection in computer vision (CV) was used to detect features through a rather cumbersome process. However, with the advent of deep learning technology, the level of technology from object detection to classification has expanded, and the accuracy of object detection using learning data has increased. A deep learning model for image processing has been developed based on convolutional neural networks (CNNs) [27]. Since the development of the R-CNN model [28], an early object detection model, in 2013, various deep learning models have emerged. Faster R-CNN [29], you only look once (YOLO) [30,31], and Detectron are representative models that have improved accuracy, speed, and platform versatility. Recognition technology using elemental features has been steadily developed in the field of deep learning. Using a neural network, a classifier that categorizes possible distortions in images into four categories and quantifies the level of image distortion to obtain a special and more accurate estimate of image quality [32,33] was trained.
Mask R-CNN is effective for object identification with complex shapes [34]. It is more accurate than the rectangular area object identification model because the object segments it. The model selects candidates for areas where objects in the image are likely to be and undergoes a two-step process of extracting latent features of classification, bounding box regression, and segmentation. It has achieved high accuracy for complex shapes, but it is computationally taxing.
Research on identifying exterior building information using deep learning technology has been conducted to identify components or detect construction or structural combinations. These studies have primarily focused on extracting building outlines, facade features, and exterior wall materials. Before the deep learning technology was applied, the building outline, brightness, and feature points were extracted based on CV. A minimum spanning tree (MST) algorithm was proposed to analyze image pixels to identify windows or doors on the elevation of a building with a probability of 70% [35]. A study to detect the entrance or windows of a building by extracting and synthesizing the characteristics of lines, colors, and textures has also been conducted [36]. Another study was conducted to identify the shape of the roof using aerial photographs. Hipped, flat, and gable roofs were classified based on the pattern of the pixel structure of the shape image [37]. As the resolution of aerial photographs has increased over time, it has become possible to precisely obtain the shape of buildings and texture and location information of materials [38,39]. With the application of deep learning technology, the preprocessing process is simplified, and higher identification is possible. However, it is still often used in parallel with CV. The outline and protrusion features of the building exterior were extracted using image-processing techniques, and the building was recognized using a deep learning model [40]. The features of the building were extracted from the image, and the location and direction of the building were estimated using a 2D map [40]. R-CNN was used to classify East Asian buildings, and the YOLO model was used to identify the simple exterior shapes of traditional buildings [41]. In this study, YOLO was used to identify complex structural forms and elements with large morphological differences [41]. Images were extracted from the 3D map, and information on the exterior shape of the downtown buildings was extracted using a faster R-CNN [42]. A window identification methodology of more than 90% was proposed using open 3D maps [42]. Additionally, a method for identifying windows using Mask R-CNN in building facade images was presented [43].
3. Building an Image Dataset of Hanok Facade Using 3D Modeling
Existing architectural facade deep learning research was conducted using building photos captured by researchers, photos in architectural books, and road view images for analysis. However, external environmental conditions and factors other than architectural elements are unpredictable. That is, depending on the weather, light, and shade, the illumination inside the building may differ. Furthermore, it may be difficult to secure a complete building image owing to obstacles in the road, such as trees, cars, and benches. In addition, since the building is three-dimensional, the facade may appear different depending on the angle, but it may be difficult to reflect the complete appearance if it is analyzed using only one facade image per building. In this respect, this study constructs an image dataset via rendering the complete exterior facade unaffected by the external environment at various angles by 3D modeling the Hanok building using “Revit BIM”.
3.1. Selection of Target Site
After selecting the target site, standardized Hanok 3D modeling was implemented for the actual Hanok. The target site was located in the Bukchon area of Seoul, which is South Korea’s representative Hanok concentration area. This area is a place where small and medium-sized urban Hanoks were collectively built as the urban structure was modernized in the 1930s. Because the Hanoks in Bukchon were built in large quantities, various materials such as wood form the standard. Furthermore, the exterior of the area has been well preserved through the Bukchon Renovation Project. Therefore, the area was selected as the modeling target site as the exterior was standardized and well preserved while maintaining the characteristics of a traditional Hanok.
The Bukchon area includes Gahoe-dong, Samcheong-dong, Palpan-dong, Hwa-dong, Sogyeok-dong, Songhyeon-dong, Sagan-dong, Anguk-dong, Jae-dong, Gye-dong, and Wonseo-dong. In 2016, the National Hanok Center conducted a complete enumeration survey focusing on these areas and classified existing Hanoks into A, B, and C grades. Grade A refers to a Hanok with both upper and lower structures and two or more of the materials of the wall/window/roof are in good condition [44]. This study implements standardized Hanok modeling for grade A Hanoks. This grade is suitable for modeling because these Hanoks are well preserved and are of considerable cultural value. Bukchon has 598 grade A Hanoks. This study excluded commercial and religious facilities and two-story Hanoks. Furthermore, 63 Hanoks distinguished by separate facades because they were adjacent to two or more roads were classified into individual cases. Finally, a standardized facade image of an urban Hanok was implemented by modeling 405 Hanok cases and producing 468 Hanok facade images.
3.2. 3D Modeling of Hanoks Using Revit BIM
3.2.1. Classification of the Components of Building Exterior and Form Elements of Hanok
When modeling Hanoks, we must first identify the components of the building exterior and form elements of each case. After establishing a form elements classification system based on Shon’s (2018) [3] raw dataset, which was digitized by conducting a complete enumeration survey on the facade elements of existing Bukchon Hanoks, the facade elements of 405 Hanok cases were digitized by referring to the road view image. Shon (2018) largely classified the form elements of the urban landscape into 26 form elements based on the building plan/facade/street elements and 133 detailed form elements [3] (Figure 3, Figure 4, Figure 5, Figure 6, Figure 7, Figure 8, Figure 9 and Figure 10). The plan elements of Hanoks are not apparent on the facade, but they affect the outline and shape of the buildings depending on the classification, main house type, layout type, orientation of the road, and plan. Furthermore, the facade is composed of visual and direct form elements. These elements also include the main gate type, main gate location, difference between ground level and road, distance between road and building line, slope, window type, wall configuration, exterior wall lower part, outer wall middle part, outer wall decoration, roof type, rafter color, eave type, stylobate type, and eave length. Finally, street elements include road materials, road width, fence wall type, and fence wall form.
Among the existing 26 form elements presented in Shon (2018), four elements (i.e., the orientation of the plan, road width, road material, and distance between the road and building line) were excluded because they are not visible on the facade [3]. Furthermore, the length of the eaves was excluded from the classification factor because it was difficult to implement short eaves of at most 600 mm with a design automation program, and the eaves were unified as 1200 mm. Finally, the 21 form elements appearing on the facade were classified into 102 detailed form elements as presented in Table 1, and 3D modeling was conducted for each Hanok. To improve the recognition and performance of Mask R-CNN analysis, standardized modeling was conducted for each detailed form element. Specifically, each member or mapping source and facade form element was unified and modeled for each detailed element. For a facade width of 10 m, it will be modeled as 12 m, and each element within a facade width will be modeled to the largest dimension. The wall design pattern uses one unified pattern rather than a pattern image for each actual Hanok.
3.2.2. 3D Modeling of Hanok Using an Automatic Design Program
The “Hanok BIM design support tool”, which is a Hanok automatic design program of Revit, was used to perform standardized 3D modeling [45] (Figure 11). The software uses “Kan” as the basic module unit of the plan, which is a program that designs and models Hanoks in the order of body structure, roof structure, and roof tiling. Specifically, a space, such as a pillar and a wall, is first partitioned using a “Kan” module to plan the body structure. A roof structure to be installed at the top of this body structure is planned. Subsequently, a member that converts and combines each “family” into a member body and conjunctive parts with an actual shape is completed, and rafters and roof tiles are automatically placed in the final modeling form.
The aforementioned tool automatically models a Hanok by optimizing and connecting various members created as a “family” according to the size or type/form of the member planned by the designer. However, members may be unexpectedly connected, and some areas may not be created. Therefore, among the ones modeled using the program, the designer must arbitrarily modify and supplement the parts that are modeled differently from the actual ones. After 3D modeling of the Hanok case of the target site based on the form elements classified in Section 3.2.1, the profile, parameters, or dimensions of the member were modified in the review stage for parts where the facade form did not match the existing Hanok case.
3.3. Building an Image Dataset of Hanok Facade
A total of 468 Hanok facade images for 405 Hanok cases were extracted from Mask R-CNN analysis using the executing program “Enscape”. First, an appropriate mapping image for each member was applied using a material library and a mapping source, and the material bump and reflection values were appropriately set. Furthermore, the background and atmosphere such as illumination (i.e., sunlight and shadow), cloudiness, saturation, and color temperature were appropriately set to reveal the facade images of the Hanok. The setting values were applied equally to all of the facade images to improve the accuracy of the Mask R-CNN analysis. Furthermore, because the facade of the actual building is clear from various angles as well as the front when walking, the facade image was extracted by rendering the front and the side slightly rotated to the left and right. Essentially, facade images in three different directions were extracted for one facade case. To prevent the distortion of the facade image according to the camera viewpoint, the rendering projection mode was set to orthographic instead of perspective. The rendering image was output with the same size and resolution (1920 X 1080) for all Hanok facades for Mask R-CNN analysis. In addition, to improve the performance of the CNN analysis and prevent overfitting, numerous image datasets were required and, in this respect, the image data augmentation (DA) methods were also performed. DA performs geometric and photometric transformations of an image, and geometric methods include flipping, cropping, translation, and rotation [46,47]. The number of images was augmented using a horizontal flipping method that can retain the complete facade image of a Hanok. The modeled Hanok uses standardized members of the Hanok BIM design support tool, and each of these members is symmetrical, so the appearance of the general Hanok can be maintained even if it is horizontally flipped. Finally, 2808 image datasets were constructed by extracting six types of facade images, including those in three different directions and each horizontal flipped image, for one Hanok facade case (Figure 12).
4. Experiment and Results
Based on the image dataset constructed in Section 3, we briefly describe the experimental performance plan to classify and identify the elements of a Hanok building using deep learning technology and verify the performance. First, the experimental process and results used to verify the performance of the model are explained. Thereafter, the process of extracting Hanok building element information using image processing techniques from the extracted images and the experimental results are schematically described.
4.1. Mask R-CNN for Hanok Exterior Element Detection
Before the development of deep learning technology, researchers used machine learning approaches such as support vector machine (SVM) and histogram of oriented gradient (HOG) for object detection and image classification. For object detection, the selective search algorithm, which is a mathematical algorithm technique for image data, was used [48]. As the convolution neural network (CNN) model of deep learning began outperforming SVM in image classification, an object detection model was created in which only the image classification part of the model was transformed into a CNN, known as R-CNN. The main methods for object detection and segmentation in images are faster R-CNN [29] and YOLO [30,31].
We used the Mask R-CNN model to classify the Hanok exterior elements. Instance segmentation was used to extract significant elements for detection. This was conducted because we can detect objects and classify specific elements such as patterns of exterior elements. It distinguishes and recognizes different entities even if they have the same class and combines object detection and semantic segmentation. In Mask R-CNN, a mask is applied to classify each class as an instance within the region of interest (ROI). Subsequently, for the classification calculated through the classification layer, color is applied to the pixels determined to have an instance to proceed with instance segmentation. Mask R-CNN is a structure in which a mask branch that predicts the segmentation task for each ROI is added to the existing faster R-CNN. It comprises three branches: classification, bounding box regression, and segmentation mask, and performs three tasks simultaneously. The mask branch is a small-sized fully connected network (FCN) that predicts a segmentation mask that determines whether an object is present for each of the K-classes per pixel in a pixel-to-pixel manner. Furthermore, the ROI pooling of the existing faster R-CNN was replaced with the ROI align layer to preserve the object’s spatial location, that is, location information [34]. Mask R-CNN of the Detectron2 platform provided by Facebook Artificial Intelligence Research was used for learning [49]. The structure of Mask R-CNN is explained in Figure 13.
4.2. Labeling for Segmentation
We performed labeling of exterior elements to apply the Mask R-CNN model focused on detecting Hanok exterior elements. Because Hanok images and elements are not included in the COCO dataset, we trained the new custom model. For training, we first labeled the elements. To perform the labeling, we first set the labels of the elements of the image dataset. A total of 9 out of 21 classes were excluded owing to a problem in recognizing the results of the pilot test. Elements A and B could not be segmented by checking the image of the plane alone. This would have been possible if a rendering image had been taken. It is difficult to verify C with a flat image; therefore, it is expected that the result will be obtained if a rendered image with a 3D background is trained in 3D in the future. In addition, because of the nature of segmentation for the purpose of classification, it is difficult to classify elements consisting of numerical values such as length and width, namely D, M, F, N, and Q, through training because the specific location is unknown. The Labelme program was used to label elements in the flat image of Hanok, and 64 elements were labeled. Each element is labeled and saved as a JavaScript object notation (JSON) file. In general, when a deep learning model is trained to detect or classify an object, coordinate values for a box or shape corresponding to an object area in an image are displayed. In the detection model, a rectangle box is used, but in segmentation, we must categorize the target even if it is the same target; hence, we need to extract polygonal cross section values. An example where the bounding range of a polygon shape marks the object area of the image is illustrated in Figure 14.
We trained a deep learning segmentation model by setting bounding boxes for Hanok elements in the extracted image information. Boundary polygon settings were manually set for all images in the training and test datasets. Additionally, boundary polygons were extracted using Labelme open-source software [50]. Labelme supports object scoping and metadata extraction for model training. When training a deep learning model, images are required, and it is important to include metadata or annotations containing object information in the images. Metadata includes information such as boundary polygon coordinates, label name, image path, and size, and is stored in JSON format.
To utilize the Mask R-CNN model of Detectron2, the COCO format file is required. The format was changed using a code that changes the JSON file to COCO format. The changed format is then used for training. The visualization result of the Hanok elements that were labeled is presented in Figure 15. Each element shows a unique ID value and color. Bounding polygons were set to classify elements from Hanok images.
An example of a JSON file obtained with Labelme before using it for training is presented in Table 2. The result of labeled elements of the Hanok image was extracted. The label ID is different because each image has different elements. The “label” value is the output id of the element that we labeled from Labelme. Thereafter, we changed to the COCO format for training.
Unlike the JSON file, the COCO format consists of id, image_id, category_id, segmentation, area, bbox, and iscrowd, and each of the 64 labels in the last category is expressed as a value from 0 to 63 (Table 3). Table 3 is an example of a COCO Format JSON file used for training. In the given example, Hanok elements’ information was extracted from the image. In this format, we should focus on “category_id”. The “category_id” key value includes category number of elements. The “category_id” serves to enable segmentation of objects in the training process.
4.3. Results of Segmentation
In this section, we describe the results of classifying the exterior elements of a Hanok building using a deep learning model. To classify the elements in the Hanok model image, the Mask R-CNN model was used in the Detectron2 environment. Because 2808 images were acquired, approximately 1900 (70%) were used for training, and approximately 900 (30%) were used for testing. For learning hyperparameters, the learning rate was set to 0.0005 and the maximum number of iterations was set to 5000. Additionally, we used the early stopping feature of training to stop when loss reduction no longer occurred on subsequent iterations, thus reducing the training time. The process repeated approximately 1200 times before stopping. The loss graph of the model is presented in Figure 16. The total loss value of the model is 0.015694.
Accuracy in instance segmentation is calculated as average precision (AP). Before determining AP, one needs to understand the intersection over union (IoU). IoU is used as an object detection evaluation index and indicates that the overlap of the correct answer area overlaps with the predicted area. The higher the IoU value, the better the object detection. AP means mAP in the threshold range of the corresponding IoU. The numbers next to it, such as AP50 and AP75, are AP (averaged over IoU thresholds) thresholds. AP50 is the average of IoU exceeding 0.5. AP75 is the average of IoUs exceeding 0.75. The results of AP are reported in Table 4 below.
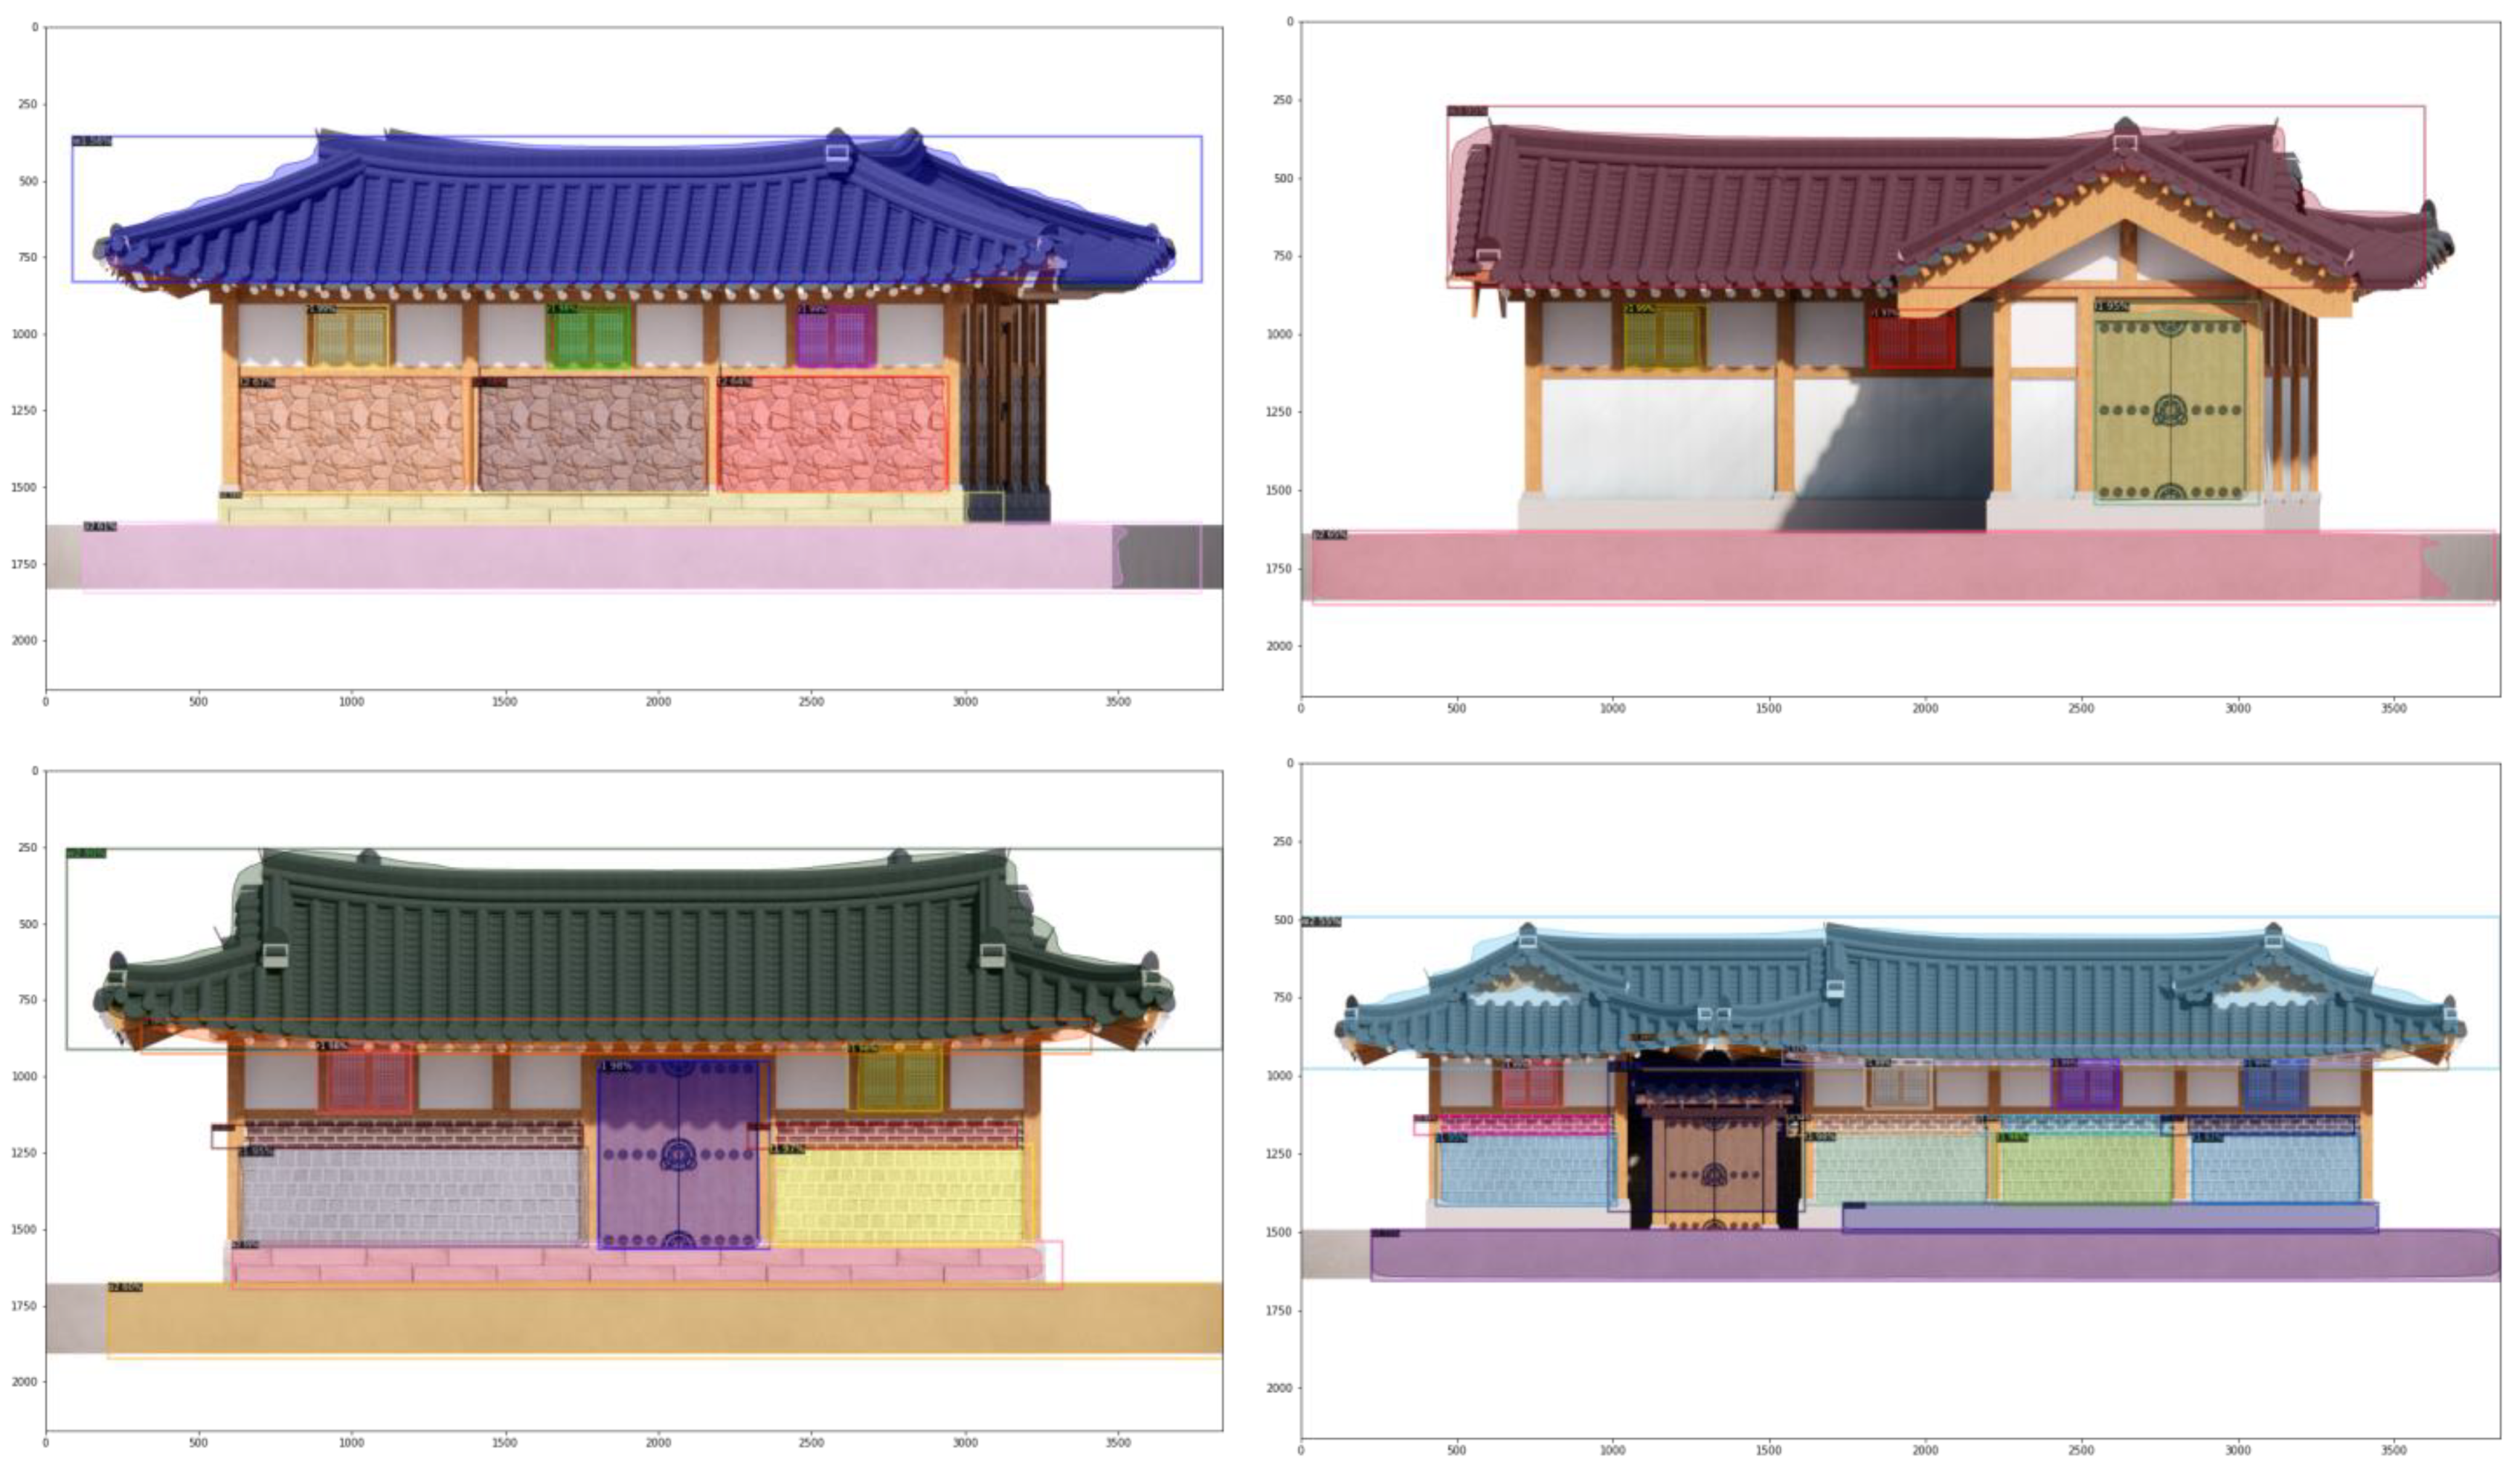
We performed segmentation by labeling 64 elements. The outer wall, stylobate, and gate of the Hanok were mainly accurately detected and segmented. The segmentation results are illustrated in Figure 17 below. Of the 21 classes, 12 labeled classes (I, J, K, P, R, T, U, V, L, W, X, and Y) were well segmented. Therefore, among the horizontal elements, the facade elements except for the width of the road and other elements that can affect the shape and contour of the building were well distinguished. This demonstrates that elements outside the Hanok can be distinguished by shape and color. This method can be used for the pre-processing of more detailed classification methods in future studies.
5. Conclusions
This study classified and detected the external elements of Hanok buildings using deep learning and image processing technology to recognize and classify the information of Hanok elements. We used the Mask R-CNN model of Detectron2 to detect and segment elements outside of the Hanok. In general, the segmentation was satisfactorily conducted, and the type of roof, windows, the lower part of the outer wall, and the design were segmented with high accuracy. The contribution of this research is twofold. First, a model for learning images, such as the exterior of a Hanok, was developed using Hanok images that had not been previously attempted. Extensive architectural research has attempted to segment Hanok images.
Second, this study obtained satisfactory classification accuracy using the latest image segmentation model and proposed a method for recognizing and extracting information regarding elements outside of a Hanok. The proposed method can be adopted in future studies to automatically acquire basic Hanok information. It can also be used for pre-processing to recognize more detailed information regarding the elements outside the Hanok. This research can be a good pilot study to discriminate external factors by training images of various Hanok types and materials.
However, there were several limitations. Although the roof type was well understood, it was difficult to detect and segment the facade layout because it was difficult to train considering the elements such as the main house type, layout type, and road layout direction. Furthermore, although the type of gate was well identified, it was difficult to determine its location. These were difficult to determine because the specific coordinate values of the component class were not properly given. In future studies, it is expected that the current limitations can be supplemented by the measurement and training of aerial view images and specific position values. Moreover, in this paper, the train and test steps are conducted using 3D modeling data suitable for the purpose of the experiment. In future studies, experiments can be conducted using actual Hanok images in the verification stage such as performance evaluation.
Author Contributions
Conceptualization and methodology, D.S. and G.B.; software, formal analysis, and data curation, S.C.; writing—original draft preparation, D.S.; writing—review and editing, G.B.; visualization and supervision, S.C.; funding acquisition, D.S. All authors have read and agreed to the published version of the manuscript.
Funding
This work was supported by the National Research Foundation of Korea (NRF) grant funded by the Korean government (MSIT) (NRF-2021R1F1A1061804).
Acknowledgments
The authors wish to express their gratitude to the anonymous reviewers for the comments and suggestions provided, which have been very helpful in improving the paper.
Conflicts of Interest
The authors declare no conflict of interest.
References
- Jacobs, J. Death and Life of Great American Cities; Random House: New York, NY, USA, 1961. [Google Scholar]
- Lynch, K. The Image of the City; The MIT Press: Cambridge, MA, USA, 1960. [Google Scholar]
- Shon, D. Analysis of Traditional Urban Landscape Composition Using Data Mining. Ph.D. Thesis, Seoul National University, Seoul, Republic of Korea, 2018. [Google Scholar]
- Kropf, K. The Handbook of Urban Morphology; John Wiley & Sons: Hoboken, NJ, USA, 2018. [Google Scholar]
- Hall, A.C. Dealing with incremental change: An application of urban morphology to design control. J. Urban Des. 1997, 2, 221–239. [Google Scholar] [CrossRef]
- Korean Law Information Center. Building Act. Available online: https://www.law.go.kr/ (accessed on 2 December 2022).
- Korean Law Information Center. ENFORCEMENT DECREE OF THE NATIONAL LAND PLANNING AND UTILIZATION ACT. Available online: https://www.law.go.kr/ (accessed on 2 December 2021).
- Markus, T.A. Buildings and Power, Freedom and Control in the Origin of Modern Building Types; Routledge: England, UK, 1993. [Google Scholar]
- Vworld Map. Available online: https://vworld.kr/v4po_main.do (accessed on 15 November 2021).
- Seoul City 3D Map. S-MAP. Available online: https://smap.seoul.go.kr/ (accessed on 15 November 2022).
- Google Earth, 3D Map. Available online: https://earth.google.com/web/ (accessed on 15 November 2022).
- Daum Kakao Map. Available online: http://map.daum.net (accessed on 15 November 2022).
- Naver Map. Available online: http://map.naver.com (accessed on 25 November 2022).
- Form Based Code Institute.2022. Available online: https://formbasedcodes.org/definition/ (accessed on 15 November 2022).
- Halprin, L. The Landscape as Matrix. Ekistics, Vol 32; Oct.; Oxford University Press: New York, NY, USA, 1971. [Google Scholar]
- Planning in the 20th Century. 2022. Available online: https://urbanla.weebly.com/history-of-planning.html (accessed on 20 December 2022).
- Zoning in Canada. 2022. Available online: https://www.thecanadianencyclopedia.ca/en/article/zoning (accessed on 20 December 2022).
- Town Planning Code in France. 2022. Available online: https://www.legifrance.gouv.fr/codes/id/LEGITEXT000006074075/ (accessed on 20 December 2022).
- Law of Urban Planning in Japan. 2022. Available online: https://elaws.e-gov.go.jp/document?lawid=343AC0000000100 (accessed on 20 December 2022).
- Law of Zoning in South Korea. 2022. Available online: https://www.law.go.kr/LSW/eng/engLsSc.do?menuId=2§ion=lawNm&query=%EA%B5%AD%ED%86%A0%EA%B3%84%ED%9A%8D&x=36&y=20#liBgcolor0 (accessed on 20 December 2022).
- Elliott, D. A Better Way to Zone: Ten Principles to Create More Livable Cities; Island Press: Washington, DC, USA, 2008. [Google Scholar]
- Congress for the New Urbanism. Charter of the New Urbanism; McGraw-Hill Professional: New York, NY, USA, 1999. [Google Scholar]
- Relph, E. Place and Placelessness; Pion Limited: London, UK, 1976. [Google Scholar]
- Jeong, S.; Song, I.; Moon, H. Report of Bukchon Master Plan; Seoul City Press: Seoul, Republic of Korea, 2001. [Google Scholar]
- Song, I. Study on the Types of Urban Traditional Housing in Seoul from 1930 to 1960. Ph.D. Thesis, Seoul National University, Seoul, Republic of Korea, 1990. [Google Scholar]
- The Korean Law Information Center. Act on Value Enhancement of Hanok and Other Architectural Assets. 2021. Available online: https://www.law.go.kr/ (accessed on 14 June 2021).
- Lecun, Y.; Boser, B.; Denker, J.S.; Henderson, D.; Howard, R.E.; Hubbard, W.; Jackel, L.D. Backpropagation applied to handwritten zip code recognition. Neural Comput. 1989, 1, 541–551. [Google Scholar] [CrossRef]
- Girshick, R.; Donahue, J.; Darrell, T.; Malik, J. Rich Feature Hierarchies for Accurate Object Detection and, Semantic Segmentation. In Proceedings of the IEEE Conference on Computer, Vision, and Pattern Recognition (CVPR), Columbus, OH, USA, 24–27 June 2014; pp. 580–587. [Google Scholar]
- Ren, S.; He, K.; Girshick, R.; Sun, J. Faster R-CNN: Towards real-time object detection with region, proposal networks. IEEE Trans. Pattern Anal. Mach. Intell. 2015, 39, 91–99. [Google Scholar] [CrossRef] [PubMed] [Green Version]
- Redmon, J.; Divvala, S.; Girshick, R.; Farhadi, A. You Only Look Once: Unified, Real-time Object Detection. In Proceedings of the 29th IEEE Conference on Computer Vision and Pattern, Recognition, Las Vegas, NV, USA, 27–30 June 2016; pp. 779–788. [Google Scholar]
- Tian, Y.; Yang, G.; Wang, Z.; Wang, L.; Liang, Z. Apple detection during different growth stages in orchards using the improved YOLO-V3 model. Comput. Electron. Agric. 2019, 157, 417–426. [Google Scholar] [CrossRef]
- Yan, C.; Teng, T.; Liu, Y.; Zhang, Y.; Wang, H.; Ji, X. Precise no-reference image quality evaluation based on distortion identification. ACM Trans. Multimed. Comput. Commun. Appl. (TOMM) 2021, 17, 1–21. [Google Scholar] [CrossRef]
- Yan, C.; Meng, L.; Li, L.; Zhang, J.; Wang, Z.; Yin, J.; Zheng, B. Age-invariant face recognition by multi-feature fusionand decomposition with self-attention. ACM Trans. Multimed. Comput. Commun. Appl. (TOMM) 2022, 18, 1–18. [Google Scholar] [CrossRef]
- He, K.; Gkioxari, G.; Dollar, P.; Girshick, R. Mask R-CNN. In Proceedings of the IEEE International Conference on Computer Vision (ICCV), Venice, Italy, 22–29 October 2017; pp. 2980–2988. [Google Scholar]
- Koo, W.; Yokoda, T.; Takizawa, A.; Kato, N. Image Recognition Method on Architectural Components from Architectural Photographs Glass: Openings Recognition Based on Bayes Classification. Archit. Inst. Jpn. 2006, 121, 123–128. [Google Scholar]
- Talebi, M.; Vafaei, A.; Monadjemi, A. Vision -based entrance detection in outdoor scenes. Multimed. Tools Appl. 2018, 77, 26221. [Google Scholar] [CrossRef]
- Koo, W.; Takizawa, A.; Kato, N. A Study on discriminating roof types from aerial image. Archit. Inst. Jpn. 2007, 72, 99–105. [Google Scholar] [CrossRef] [Green Version]
- Karsli, F.; Dihkan, M.; Acar, H.; Ozturk, A. Automatic building extraction from very high-resolution image and LiDAR data with SVM algorithm. Arab. J. Geosci. 2016, 9, 635. [Google Scholar] [CrossRef]
- Cai, W.; Wen, X.; Tu, Q.; Guo, X. Research on image processing of intelligent building environment based on recognition technology. J. Vis. Commun. Image Represent. 2019, 61, 141–148. [Google Scholar] [CrossRef]
- Armagan, A.; Hirzer, M.; Roth, P.M.; Lepetit, V. Accurate Camera Registration in Urban Environments Using High-Level Feature Matching. In Proceedings of the British Machine Vision Conference (BMVC), London, UK, 2 September 2017. [Google Scholar]
- Ji, S.-Y.; Jun, H.-J. Deep learning model for form recognition and structural member classification of east asian traditional buildings. Sustainability 2020, 12, 5292. [Google Scholar] [CrossRef]
- Shon, D.; Noh, B.; Byun, N. Identification and extracting method of exterior building information on 3D map. Buildings 2022, 12, 452. [Google Scholar] [CrossRef]
- Sun, Y.; Malihi, S.; Li, H.; Maboudi, M. Deepwindows: Windows instance segmentation through an improved mask R-CNN using spatial attention and relation modules. ISPRS Int. J. Geo-Inf. 2022, 11, 162. [Google Scholar] [CrossRef]
- Architecture & Urban Research Institute. Hanok Statistics White Paper; Auri Press: Sejong, Republic of Korea, 2017. [Google Scholar]
- AUTODESK, BIM Hanok Tool. 2022. Available online: https://www.autodesk.com/autodesk-university/ko/class/saeloun-seolgye-bangbeobloneul-tonghae-hanogeul-swibgo-ppaleuge-seolgyehal-su-issneun-BIM#video (accessed on 28 November 2022).
- Taylor, L.; Nitschke, G. Improving deep learning with generic data augmentation. In Proceedings of the 2018 IEEE Symposium Series on Computational Intelligence (SSCI), Bengaluru, India, 15 May 2018; pp. 1542–1547. [Google Scholar]
- Shorten, C.; Khoshgoftaar, T.M. A survey on image data augmentation for deep learning. J. Big Data 2019, 6, 60. [Google Scholar] [CrossRef]
- Van de Sande, K.E.; Uijlings, J.R.; Gevers, T.; Smeulders, A.W. Segmentation as selective search for object recognition. In Proceedings of the 2011 International Conference on Computer Vision, Washington, DC, USA, 6–13 November 2011; pp. 1879–1886. [Google Scholar]
- Detectron2. 2019. Available online: https://github.com/facebookresearch/detectron2 (accessed on 15 November 2022).
- Labelme. 2022. Available online: https://github.com/wkentaro/labelme (accessed on 15 November 2022).
Figure 1.
Location and target Hanok in the Bukchon area in Seoul, Korea.

Figure 2.
Flowchart of research.
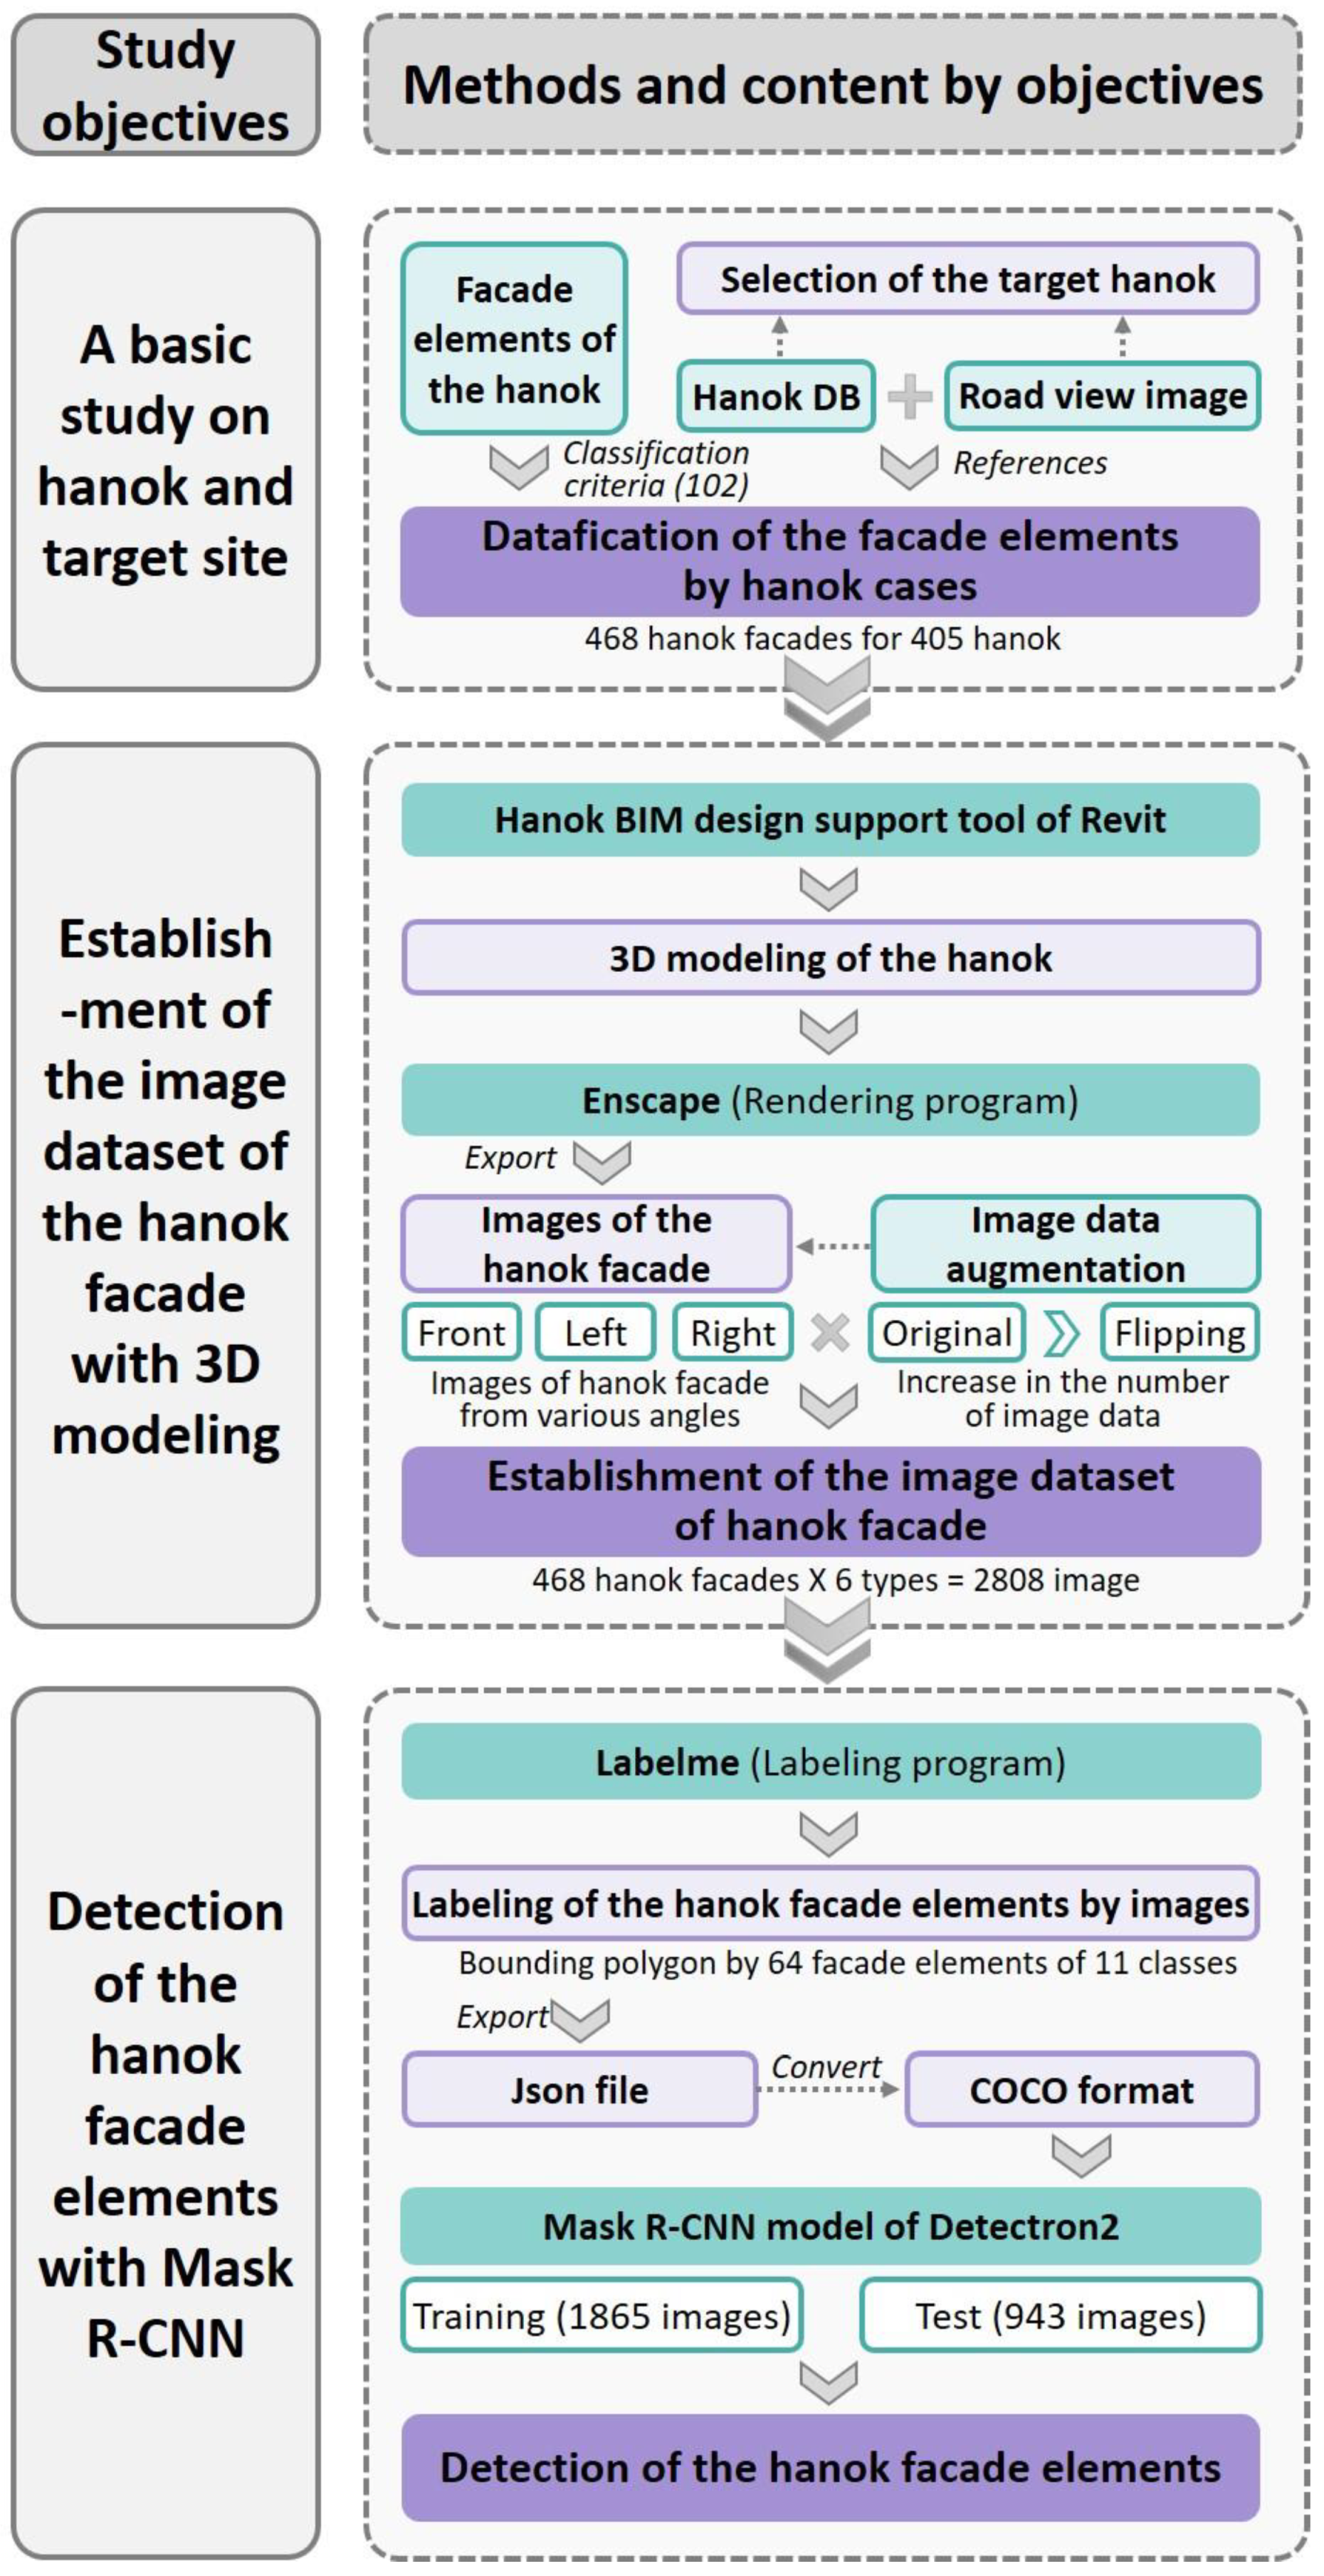
Figure 3.
Streetscape and urban Hanok in the Bukchon area.
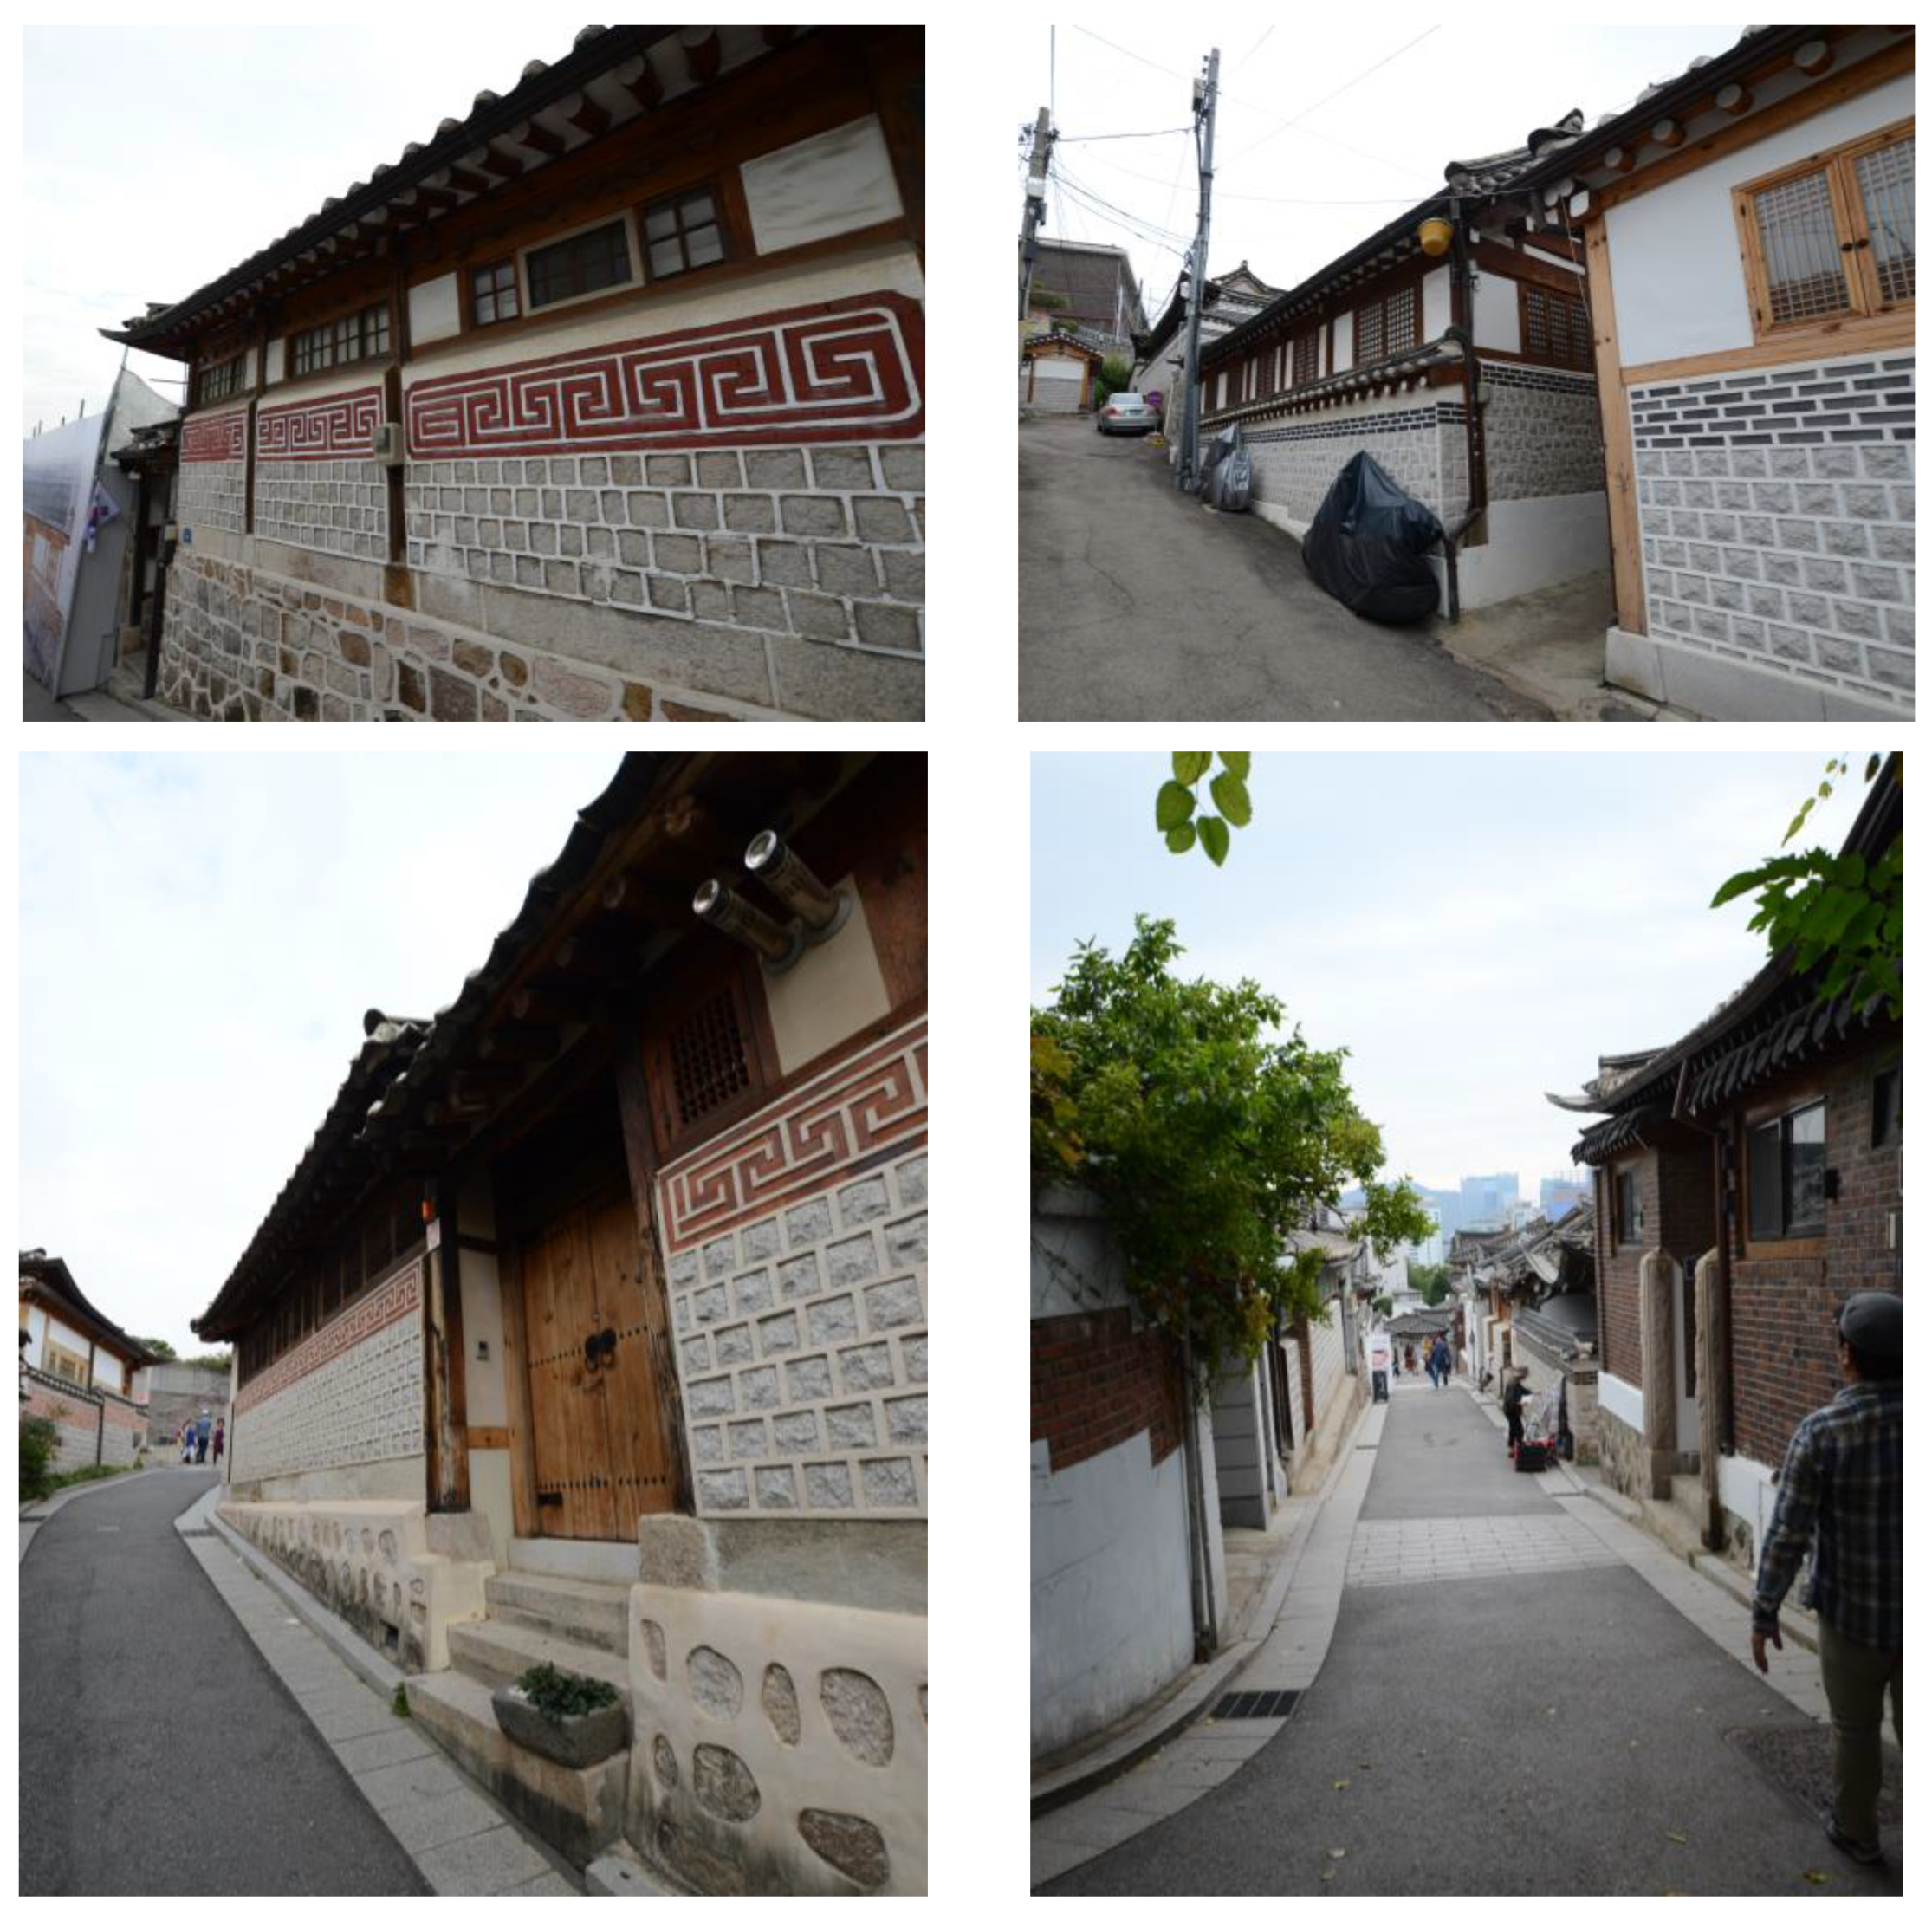
Figure 4.
Main house types (A) Reprinted/adapted with permission from Ref. [3]. 2018, Donghwa Shon: These are classified according to the plan of the main house and the shape of facade is different for each type.
Figure 4.
Main house types (A) Reprinted/adapted with permission from Ref. [3]. 2018, Donghwa Shon: These are classified according to the plan of the main house and the shape of facade is different for each type.

Figure 5.
Layout types (B) Reprinted/adapted with permission from Ref. [3]. 2018, Donghwa Shon: Depending on the layout of the main house and gate building, the plan and facade of the Hanok differ. For example, even if it is the same ㅁ-shaped layout, when only main house is ㅁ-shaped (a3 + b3) and when the ㄱ-shaped main house and ㄱ-shaped gate building are combined (a1 + b3), the facade is different due to the continuity of the roof and the wall. For this reason, classes A and B are distinguished.
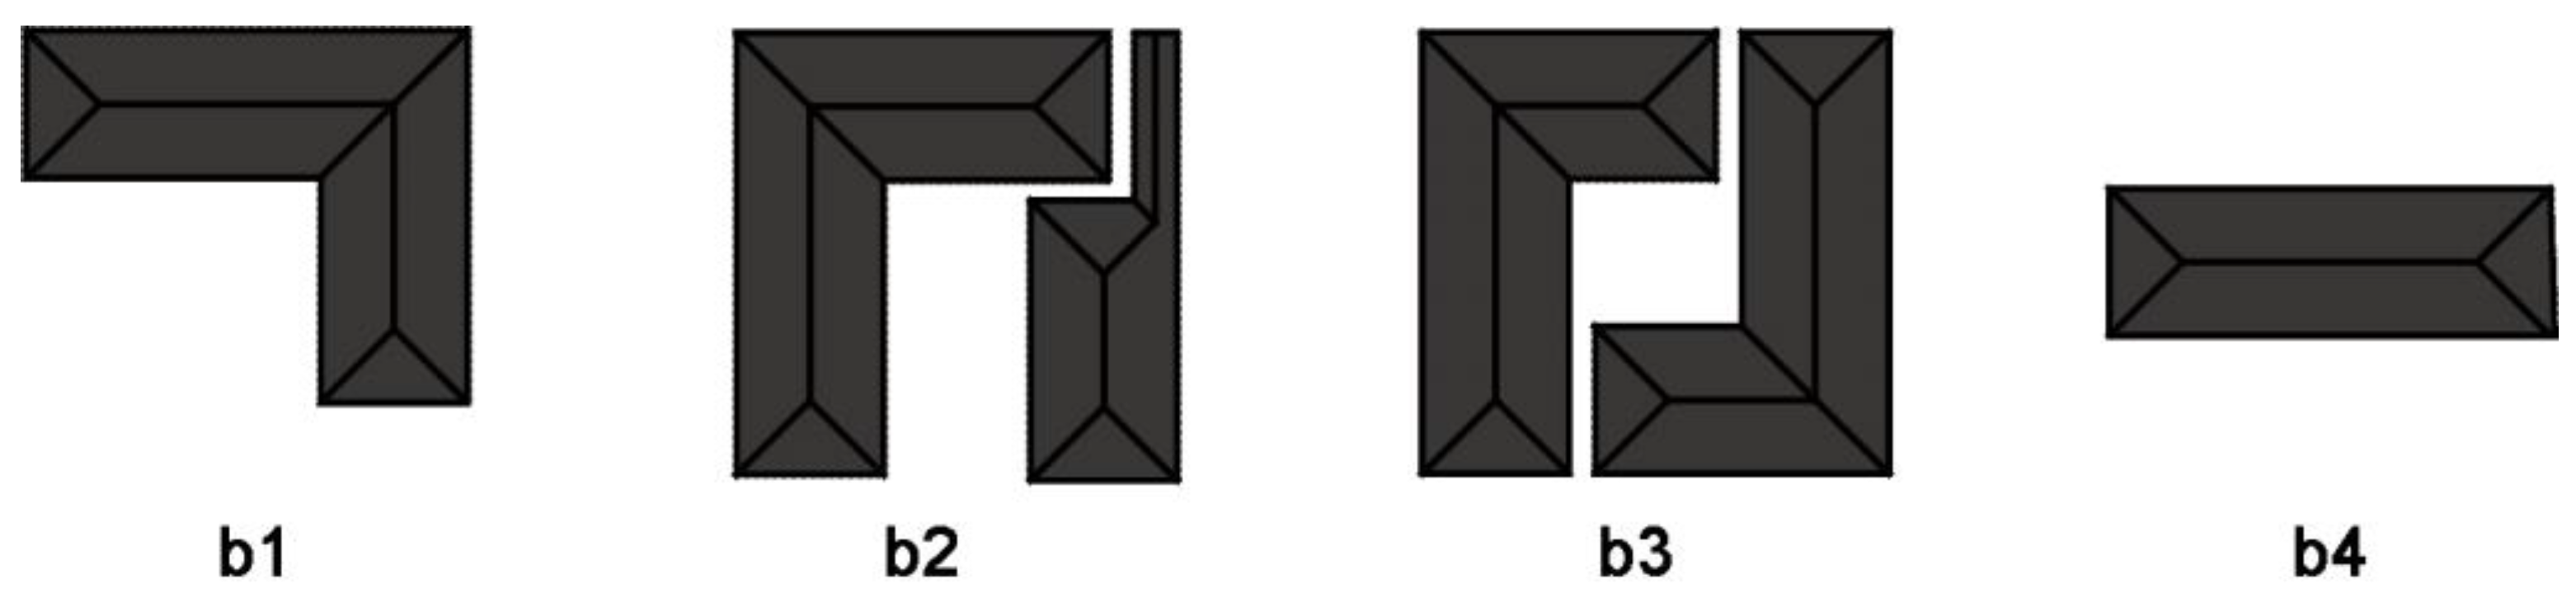
Figure 6.
Orientation of the road (C) Reprinted/adapted with permission from Ref. [3]. 2018, Donghwa Shon: Even in the same Hanok, the facade varies depending on the direction facing the road.
Figure 6.
Orientation of the road (C) Reprinted/adapted with permission from Ref. [3]. 2018, Donghwa Shon: Even in the same Hanok, the facade varies depending on the direction facing the road.
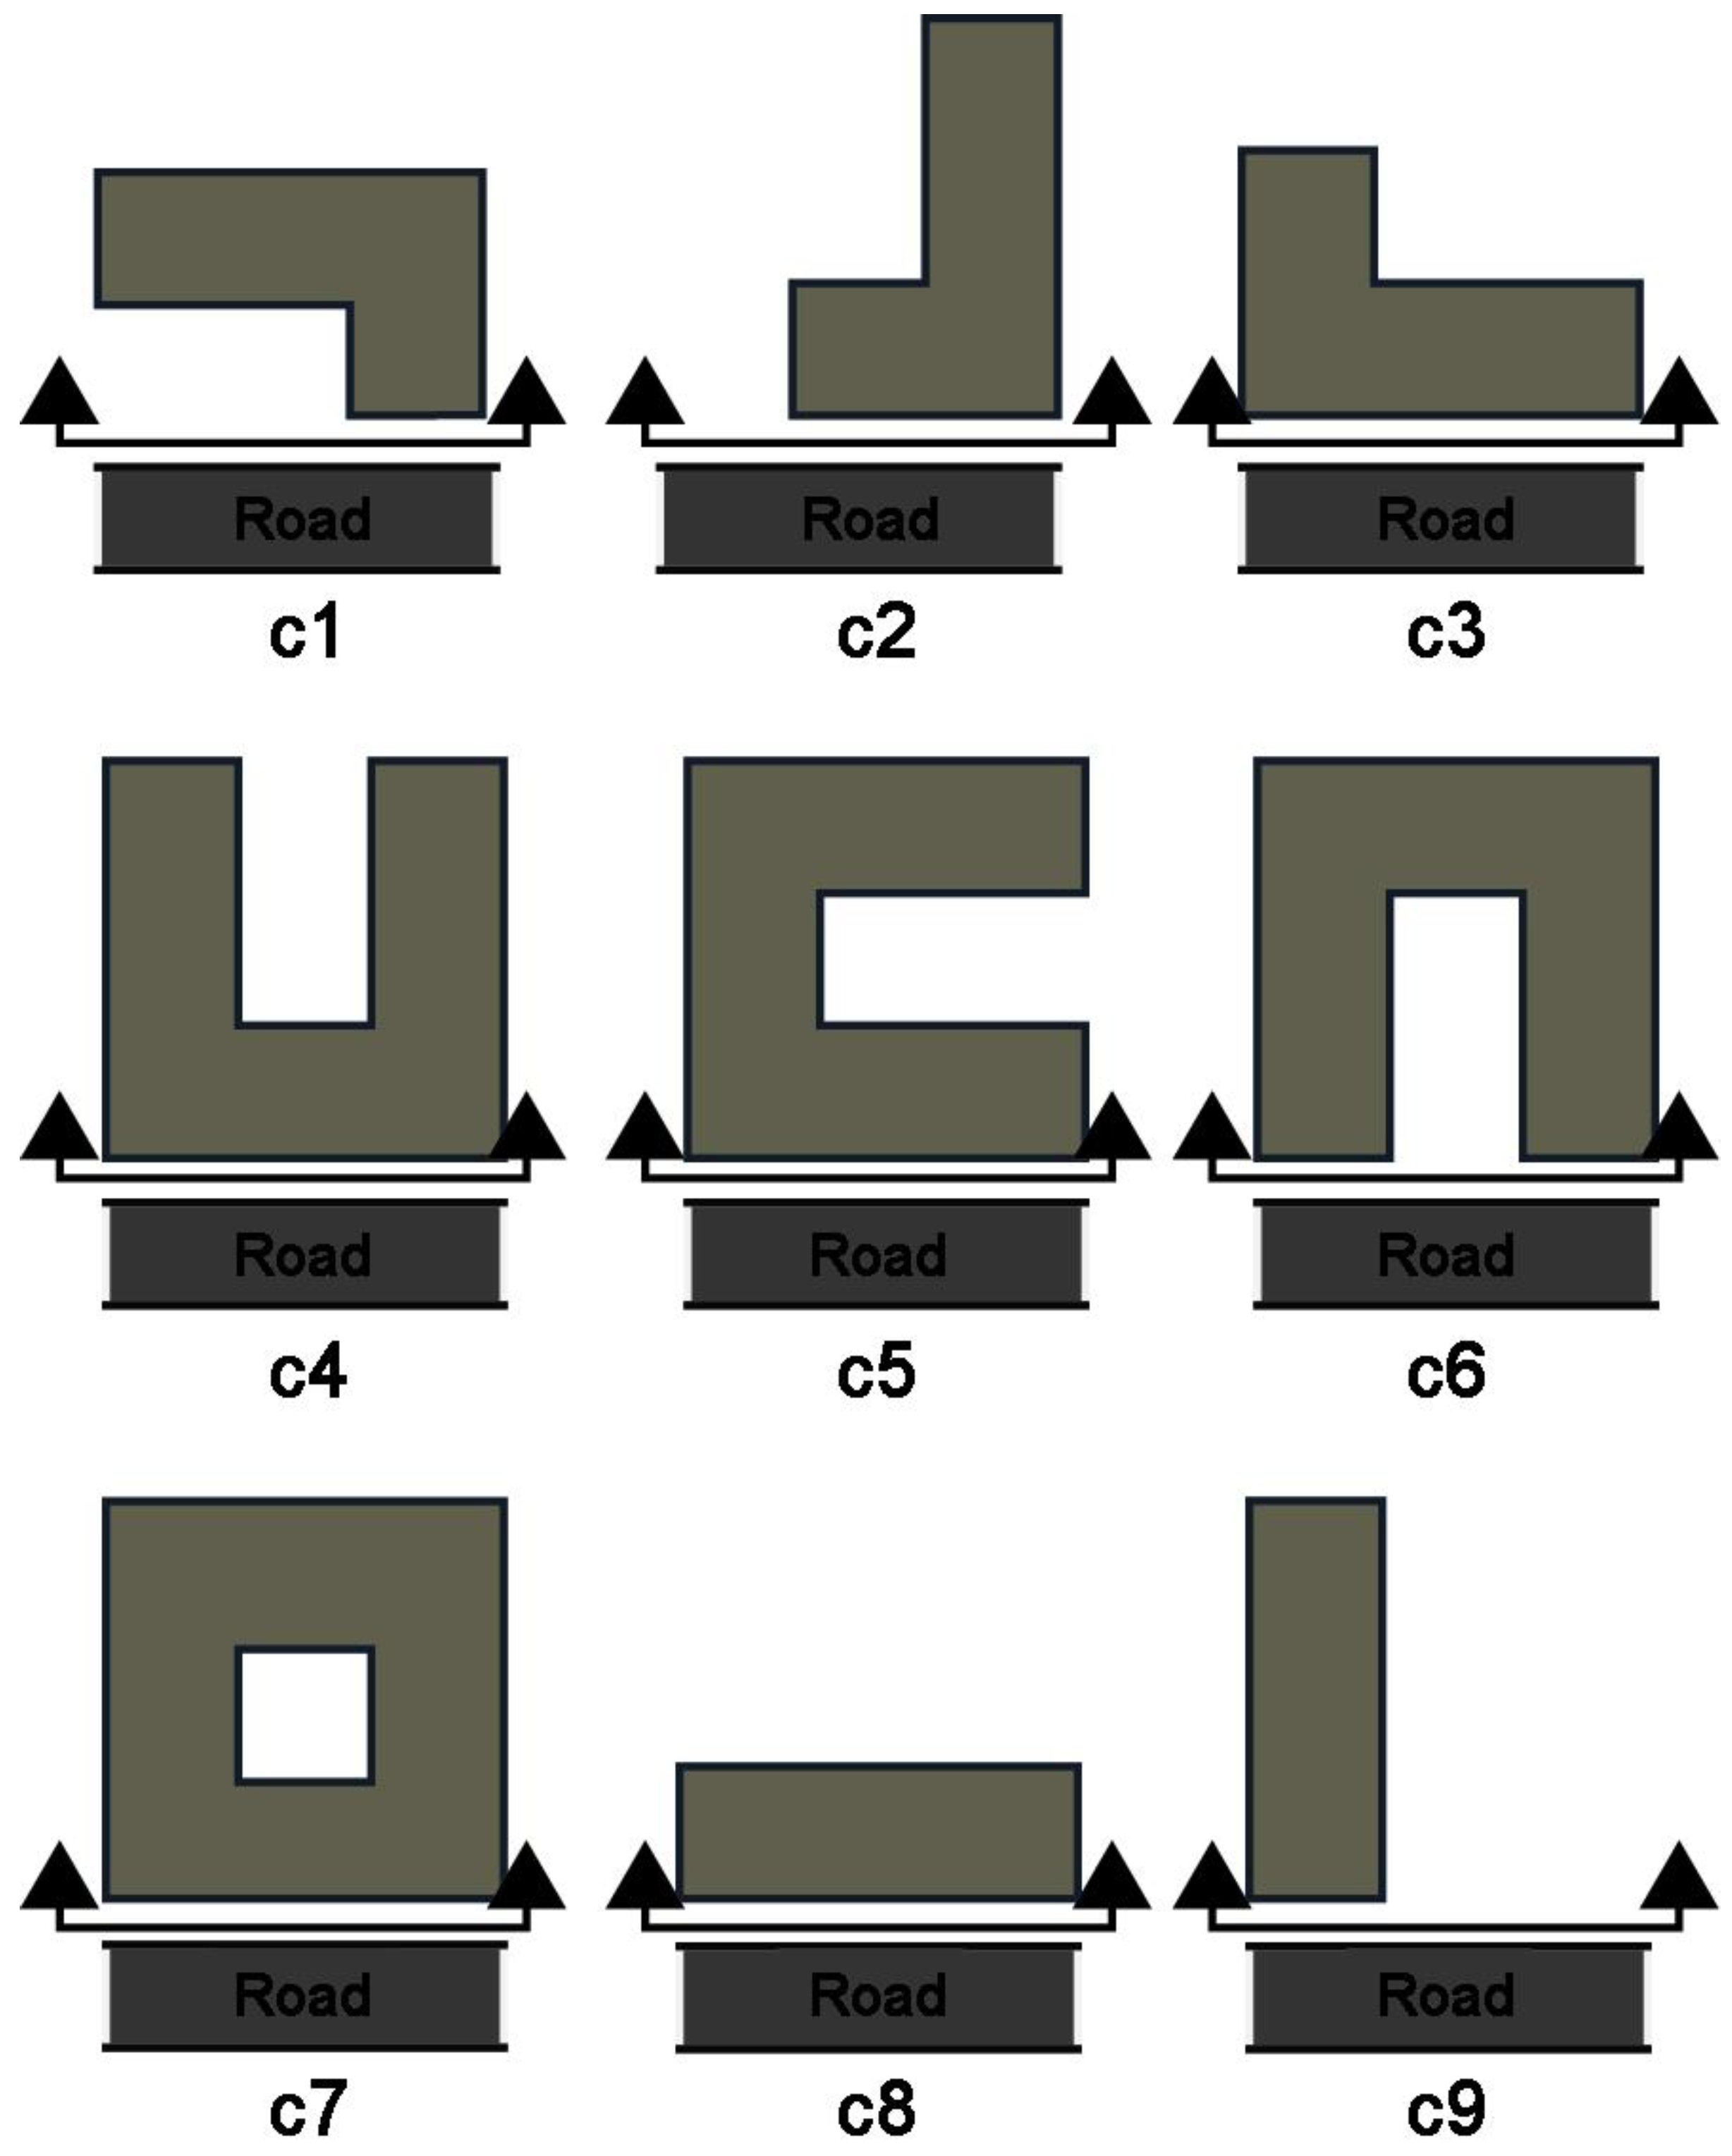
Figure 7.
Plan form facing the road (A + B + C) Reprinted/adapted with permission from Ref. [3]. 2018, Donghwa Shon: The facade appears in various ways according to the combination of the type and layout of the main house and gate building, and the orientation of the road. These images are exemplary images that various facades can appear depending on the combination of elements for each class A, B, and C.

Figure 8.
Location of the main gate in the plan (D) Reprinted/adapted with permission from Ref. [3]. 2018, Donghwa Shon: When the main gate is on a different elevation, the facade consists of outer walls and windows without a gate (d1). And when there is a gate, the gate is located on the same line as the wall (d2) or on the setback from the wall line (d3).

Figure 9.
Location of the main gate in the facade (M) Reprinted/adapted with permission from Ref. [3]. 2018, Donghwa Shon: It is distinguished whether the main gate is located on the side, in the center, or outside of the building.
Figure 9.
Location of the main gate in the facade (M) Reprinted/adapted with permission from Ref. [3]. 2018, Donghwa Shon: It is distinguished whether the main gate is located on the side, in the center, or outside of the building.

Figure 10.
Facade image of Hanok by the combination of form elements. Reprinted/adapted with permission from Ref. [3]. 2018, Donghwa Shon: The facade of a Hanok is composed of a combination of various elements. These figures are exemplary images showing the facade of each Hanok by the combination of elements simplified with the alphabets in Table 1. (a) a2 + b2 + c5 + w3 + x2 + y1 + l1 + d3 + m1 + f1 + s1 + t1 + u5 + v1 + r3 + k2 + i9 + j5 + n2 + q2 + p2; (b) a2 + b2 + c5 + w2 + x1 + y1 + l1 + d3 + m1 + f2 + s2 + t1 + u6 + v2 + r8 + k1 + i9 + j5 + n4 + q2 + p1; (c) a2 + b2 + c6 + w1 + x1 + y1 + l1 + d2 + m2 + f3 + s2 + t1 + u6 + v6 + r7 + k2 + i1 + j3 + n2 + q2 + p2; (d) a2 + b2 + c5 + w4 + x1 + y1 + l2 + d1 + m2 + f2 + s1 + t2 + u5 + v6 + r1 + k1 + i9 + j5 + n2 + q2 + p2; (e) a2 + b2 + c5 + w2 + x1 + y2 + l1 + d3 + m2 + f2 + s2 + t8 + u8 + v3 + r7 + k2 + i9 + j5 + n2 + q2 + p2; (f) a1 + b1 + c1 + w3 + x2 + y1 + l2 + d2 + m2 + f2 + s2 + t4 + u4 + v4 + r1 + k2 + i5 + j3 + n5 + q2 + p1; (g) a2 + b2 + c4 + w4 + x1 + y1 + l1 + d3 + m2 + f2 + s2 + t1 + u5 + v6 + r1 + k1 + i1 + j4 + n3 + q2 + p1; (h) a3 + b3 + c7 + w6 + x1 + y1 + l1 + d2 + m2 + f3 + s2 + t2 + u3 + v6 + r1 + k1 + i2 + j4 + n2 + q2 + p2; (i) a2 + b2 + c4 + w4 + x2 + y1 + l1 + d2 + m1 + f3 + s2 + t1 + u5 + v6 + r1 + k2 + i1 + j2 + n2 + q1 + p1; (j) a3 + b3 + c7 + w2 + x1 + y2 + l2 + d2 + m2 + f3 + s2 + t4 + u4 + v6 + r6 + k1 + i1 + j1 + n2 + q2 + p1.


Figure 11.
3D modeling of Hanok using an automatic design program [45].
Figure 11.
3D modeling of Hanok using an automatic design program [45].
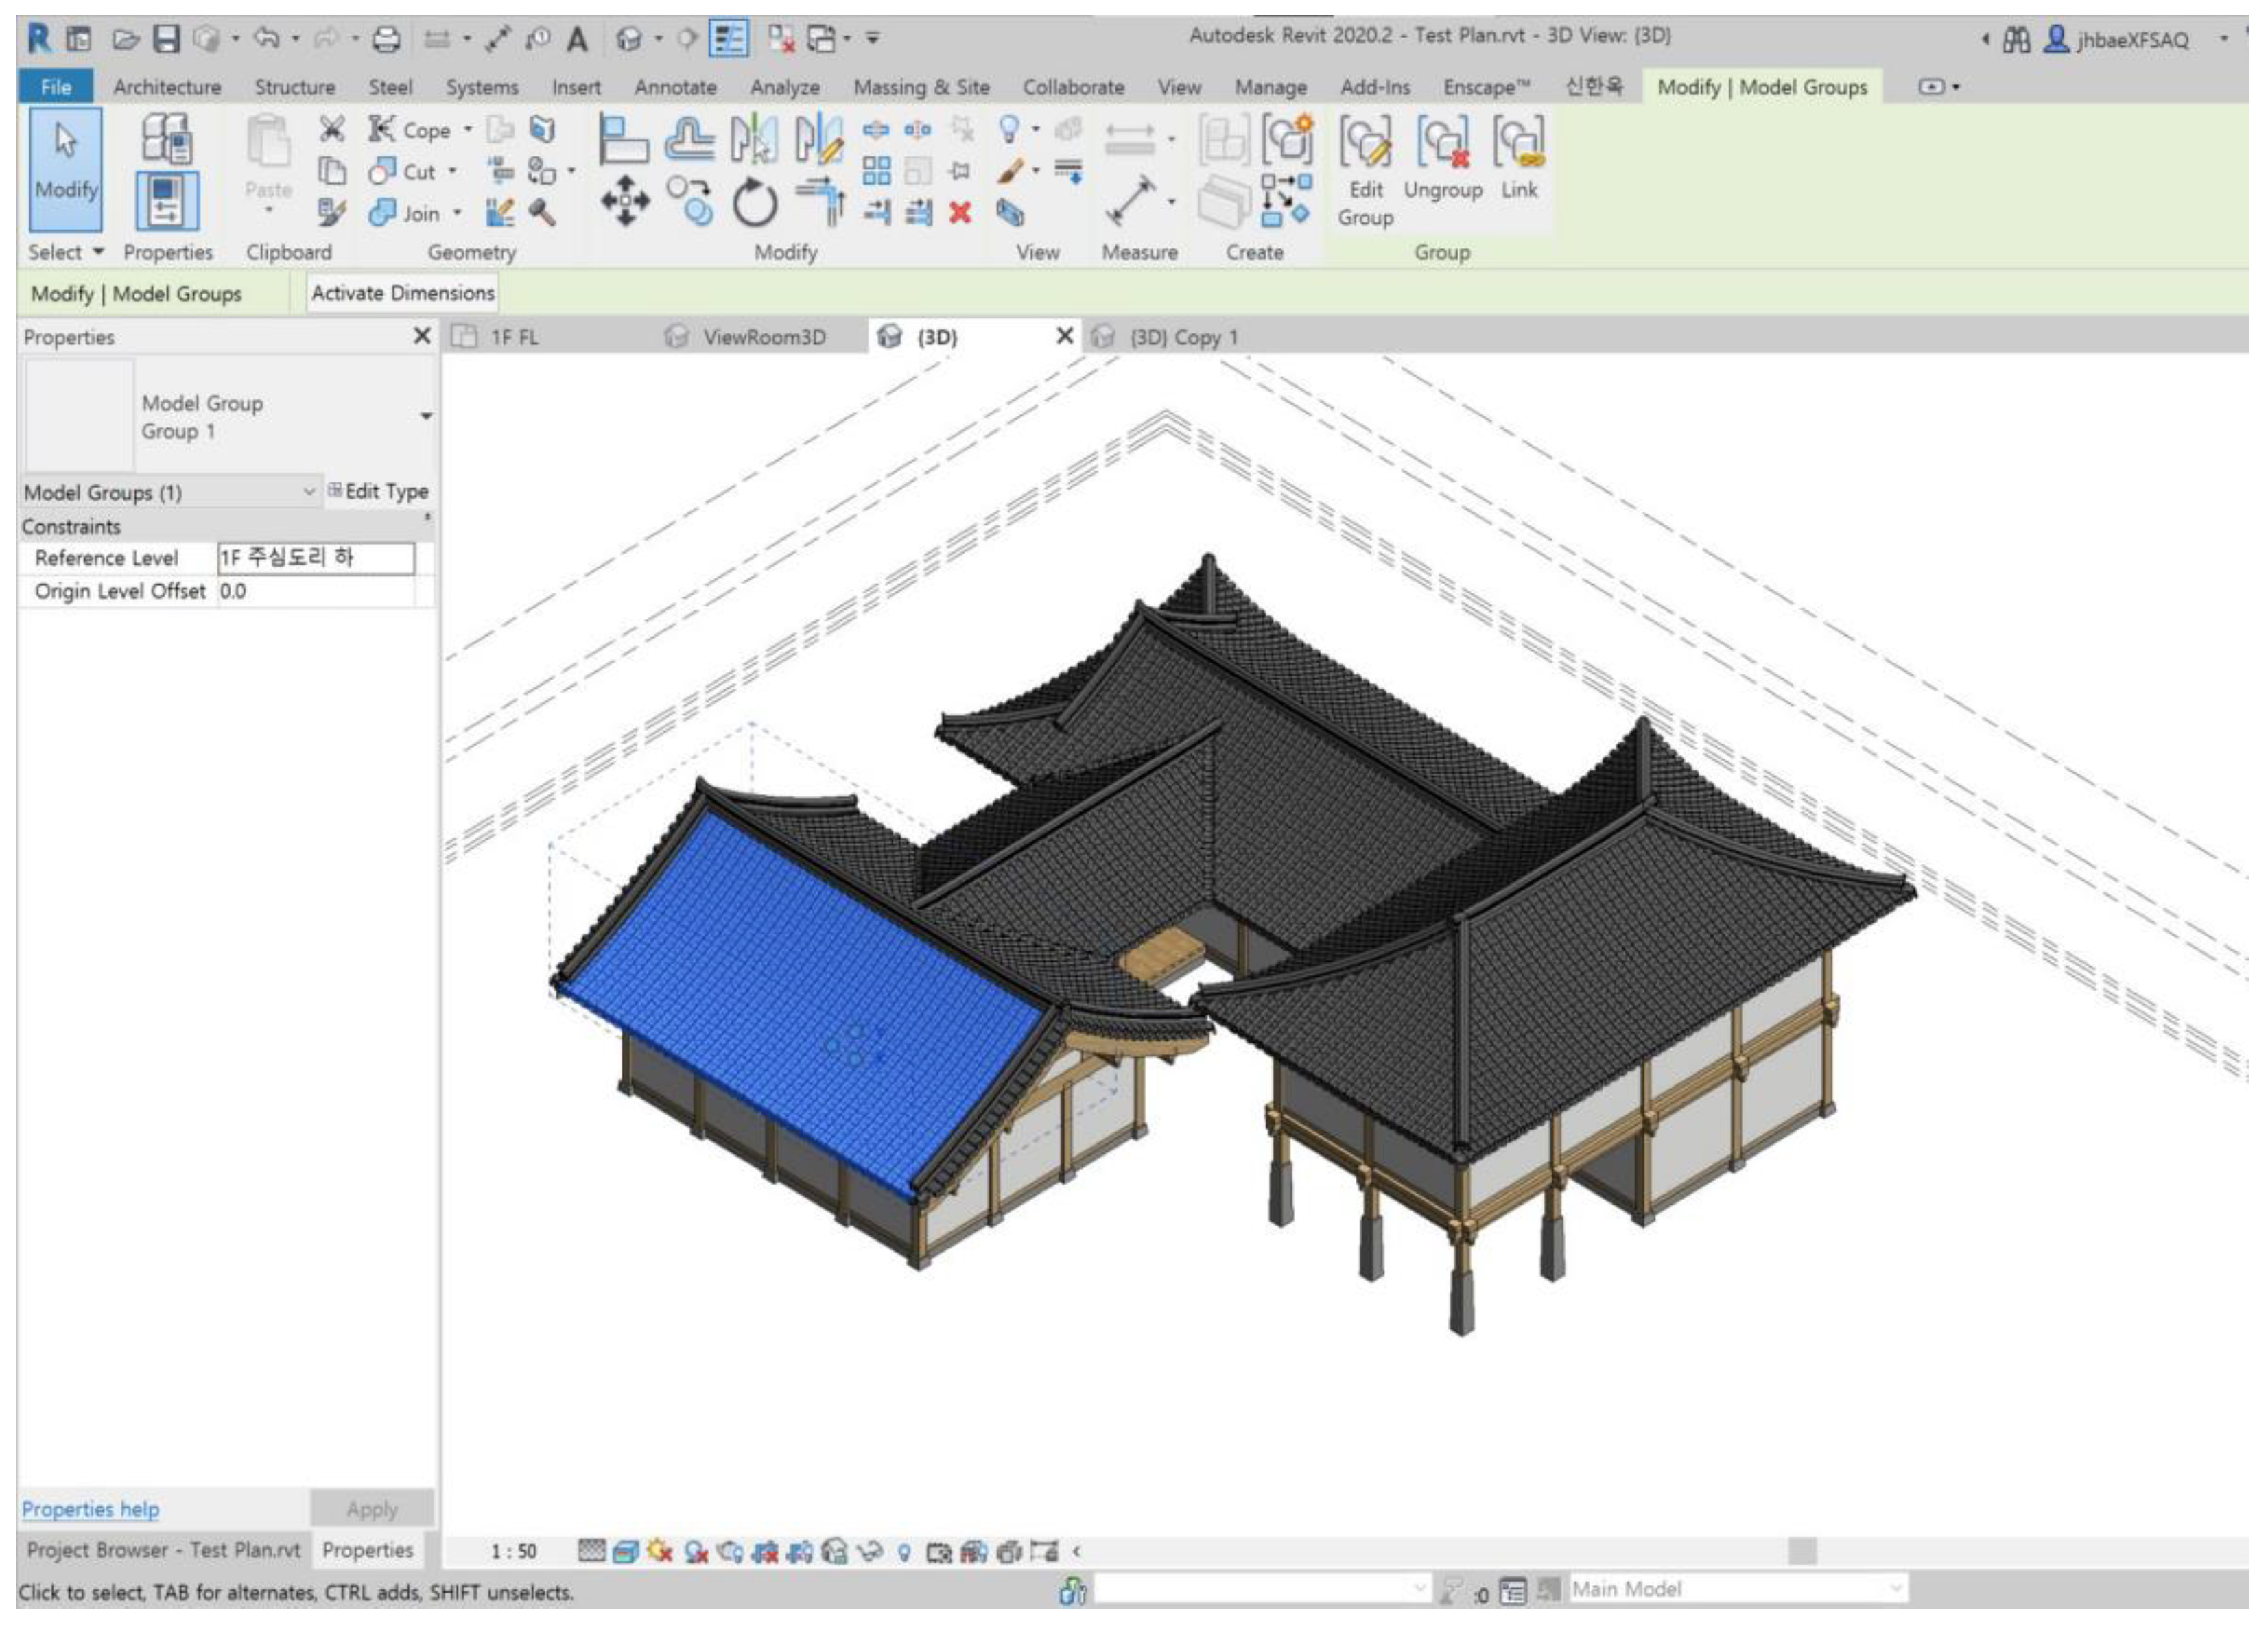
Figure 12.
Data augmentation of facade images. (a) Front image, (b) left side image, (c) right side image, (d) flipped front image, (e) flipped left image, (f) flipped right image.
Figure 12.
Data augmentation of facade images. (a) Front image, (b) left side image, (c) right side image, (d) flipped front image, (e) flipped left image, (f) flipped right image.
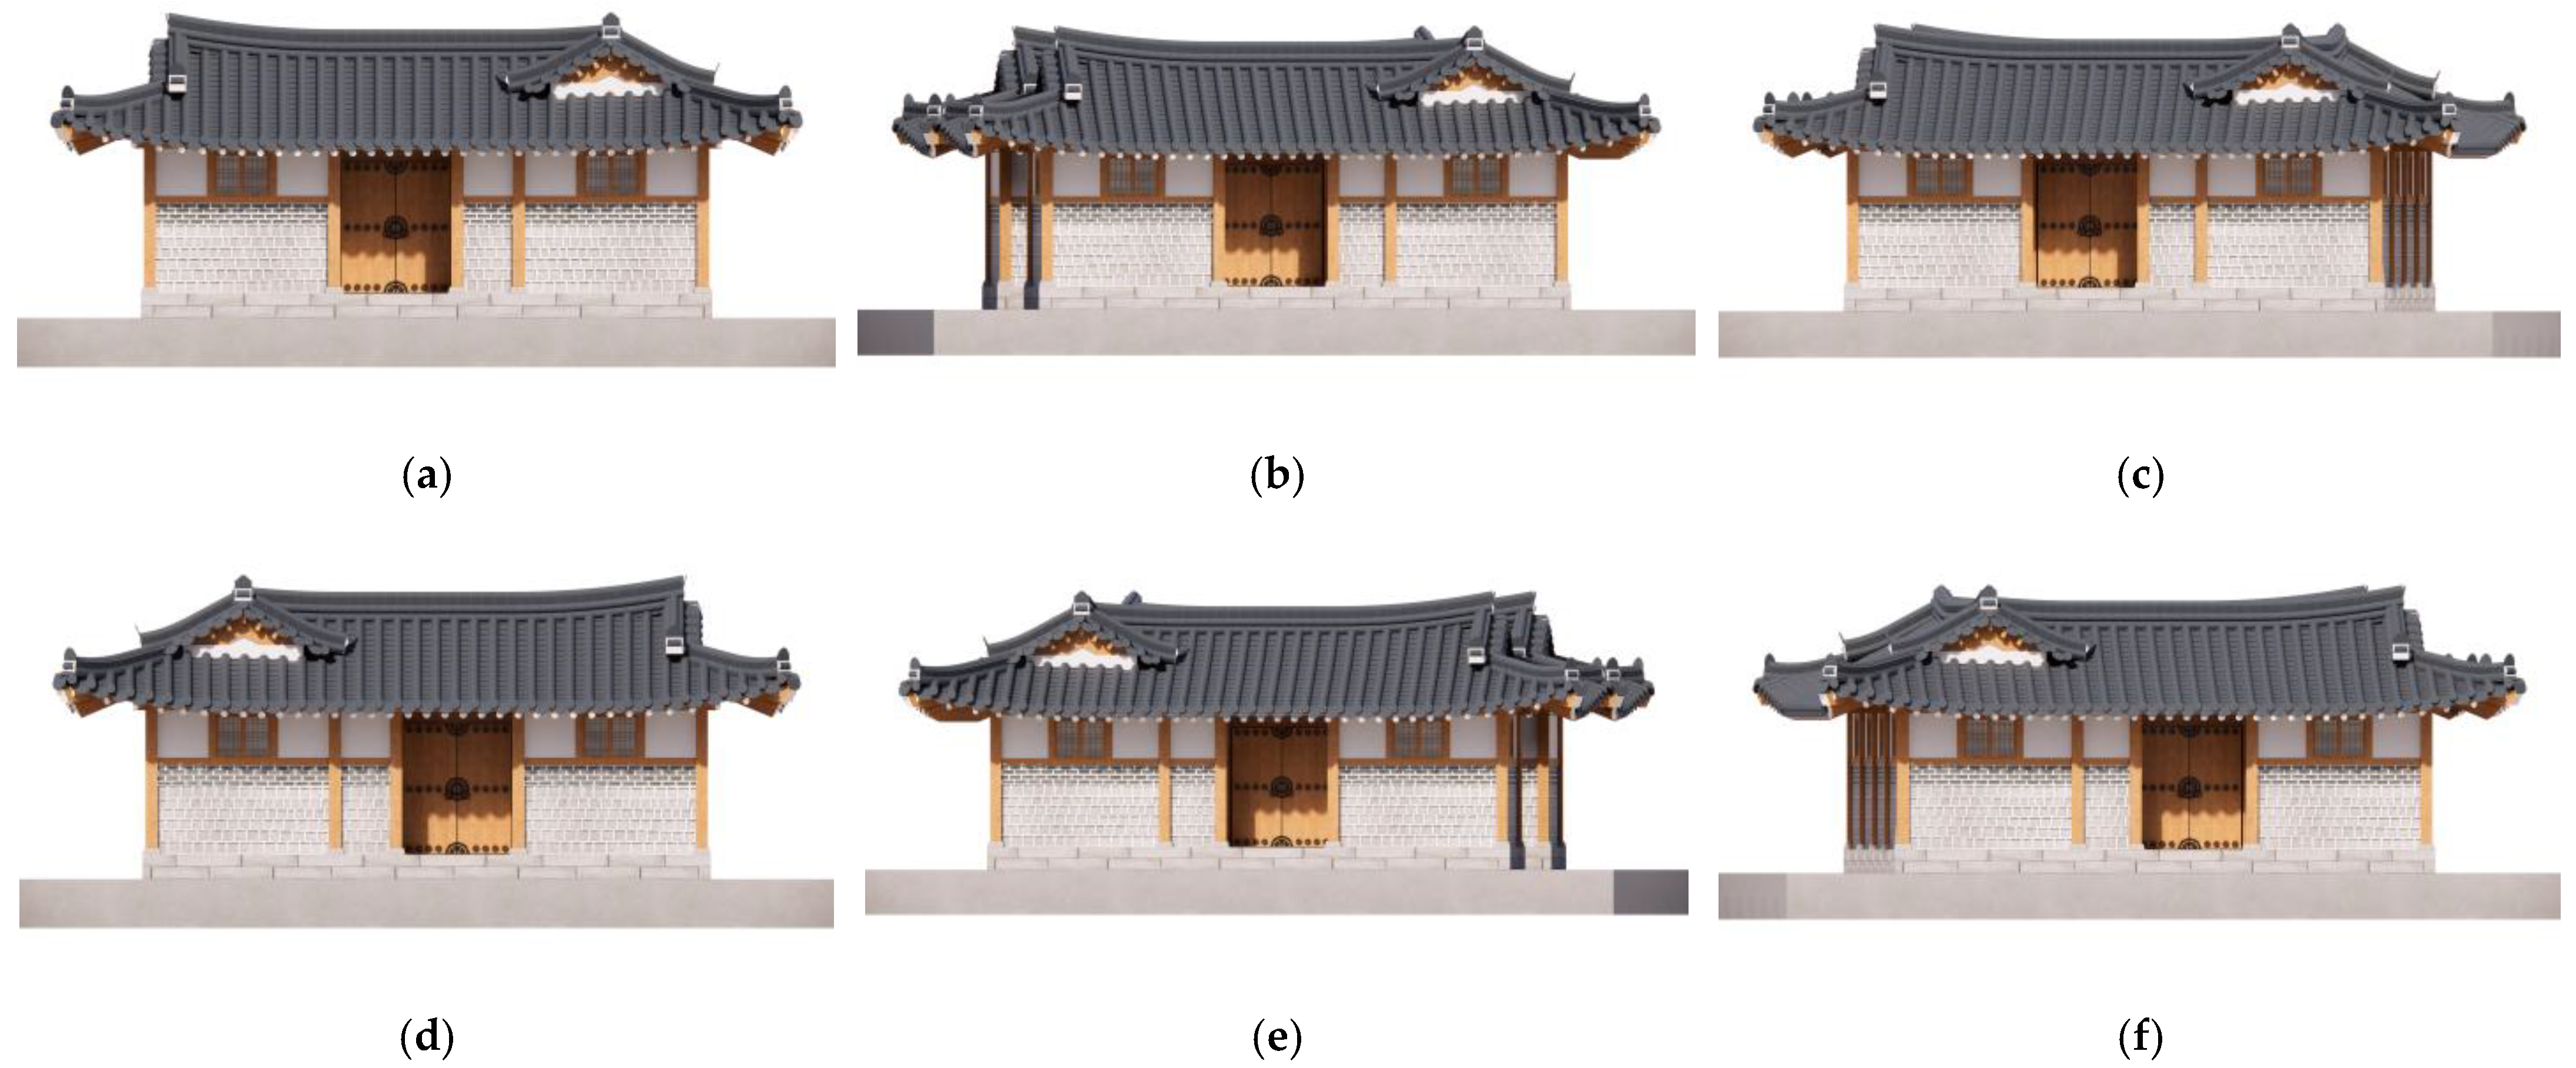
Figure 13.
Structure of Mask R-CNN.
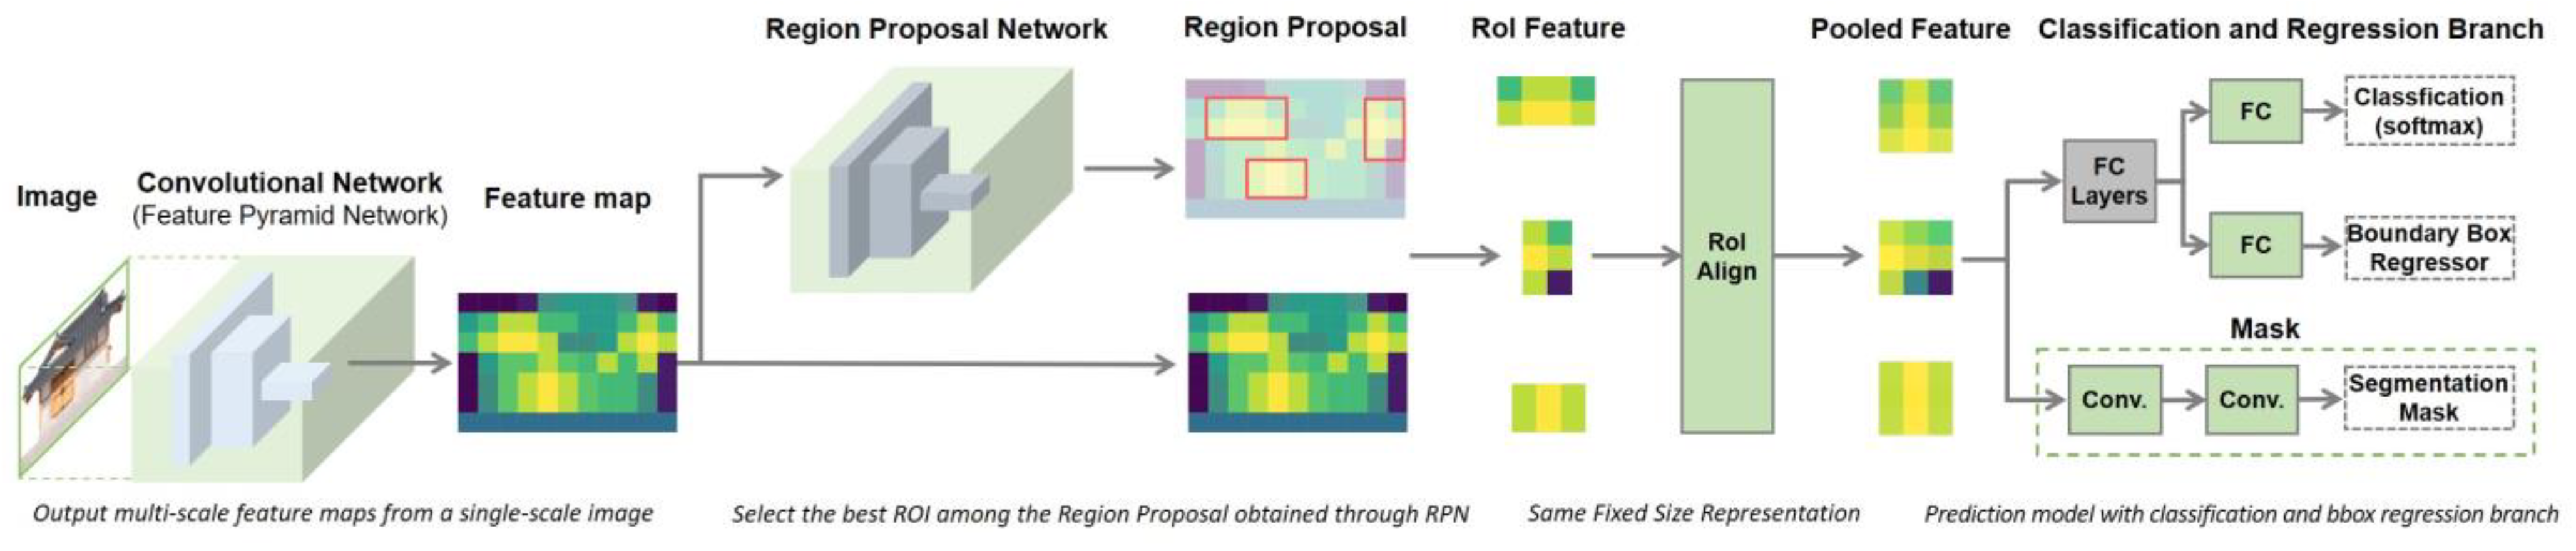
Figure 14.
Example of labeling using Labelme.
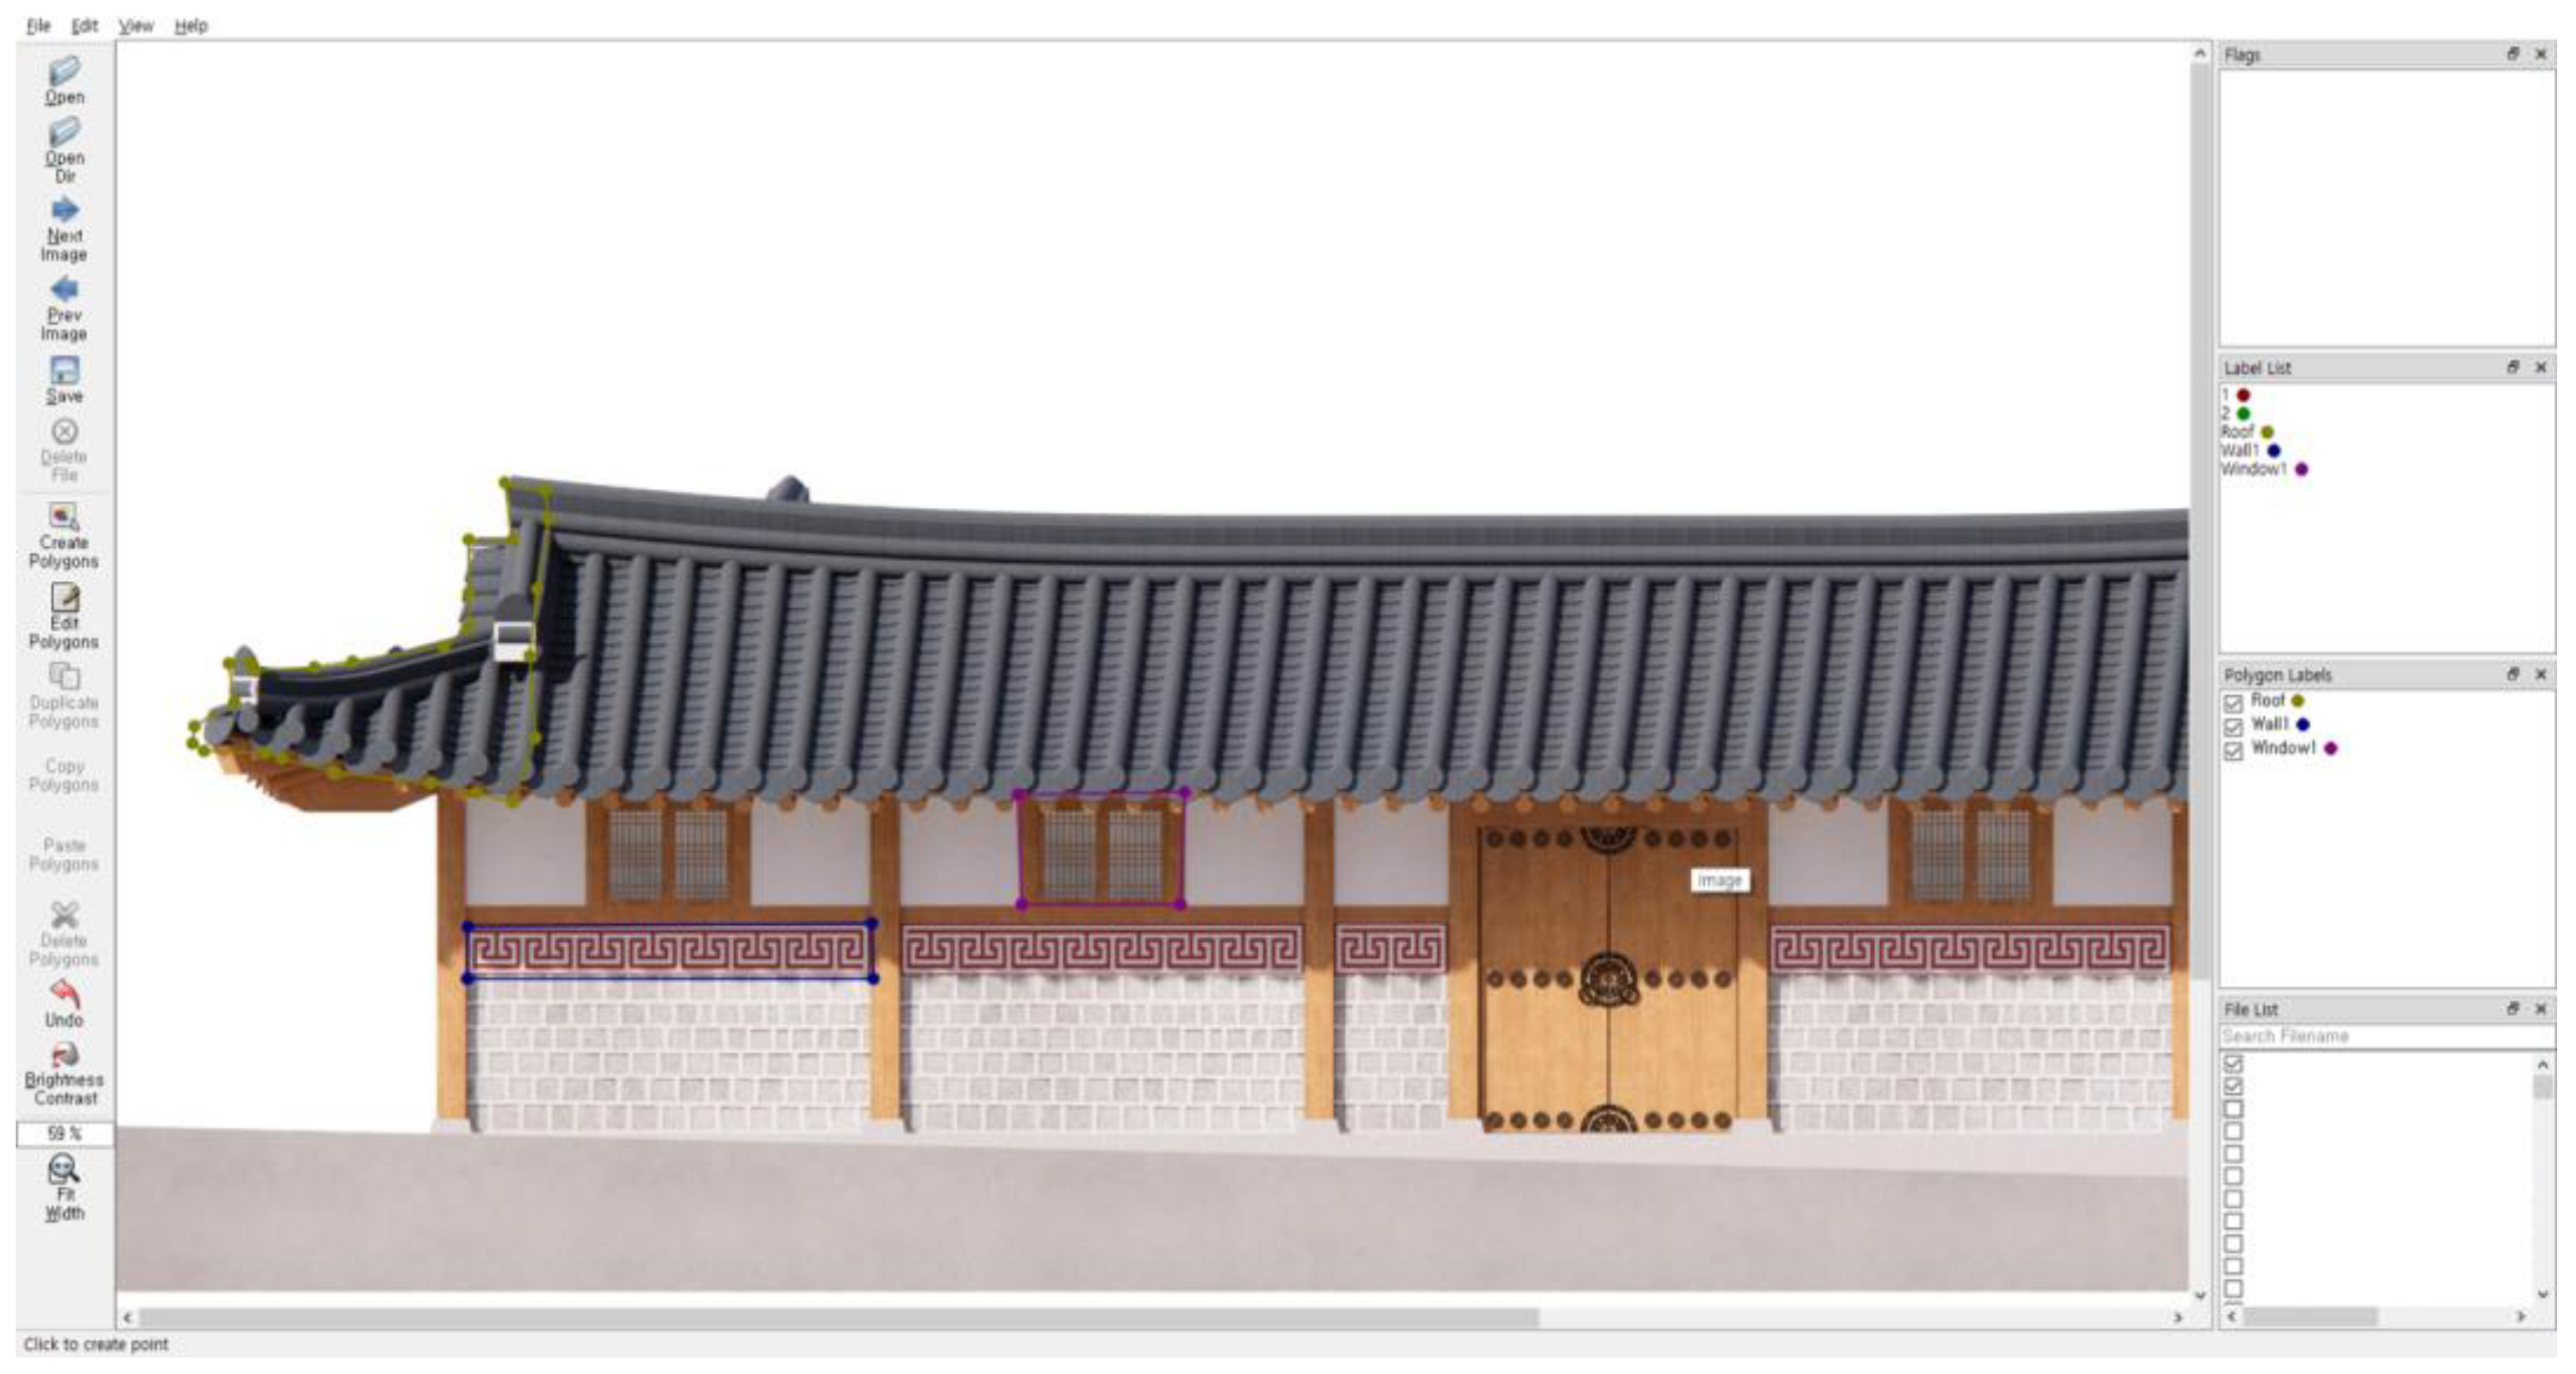
Figure 15.
Visualization of labeled examples.

Figure 16.
Losses by iteration.
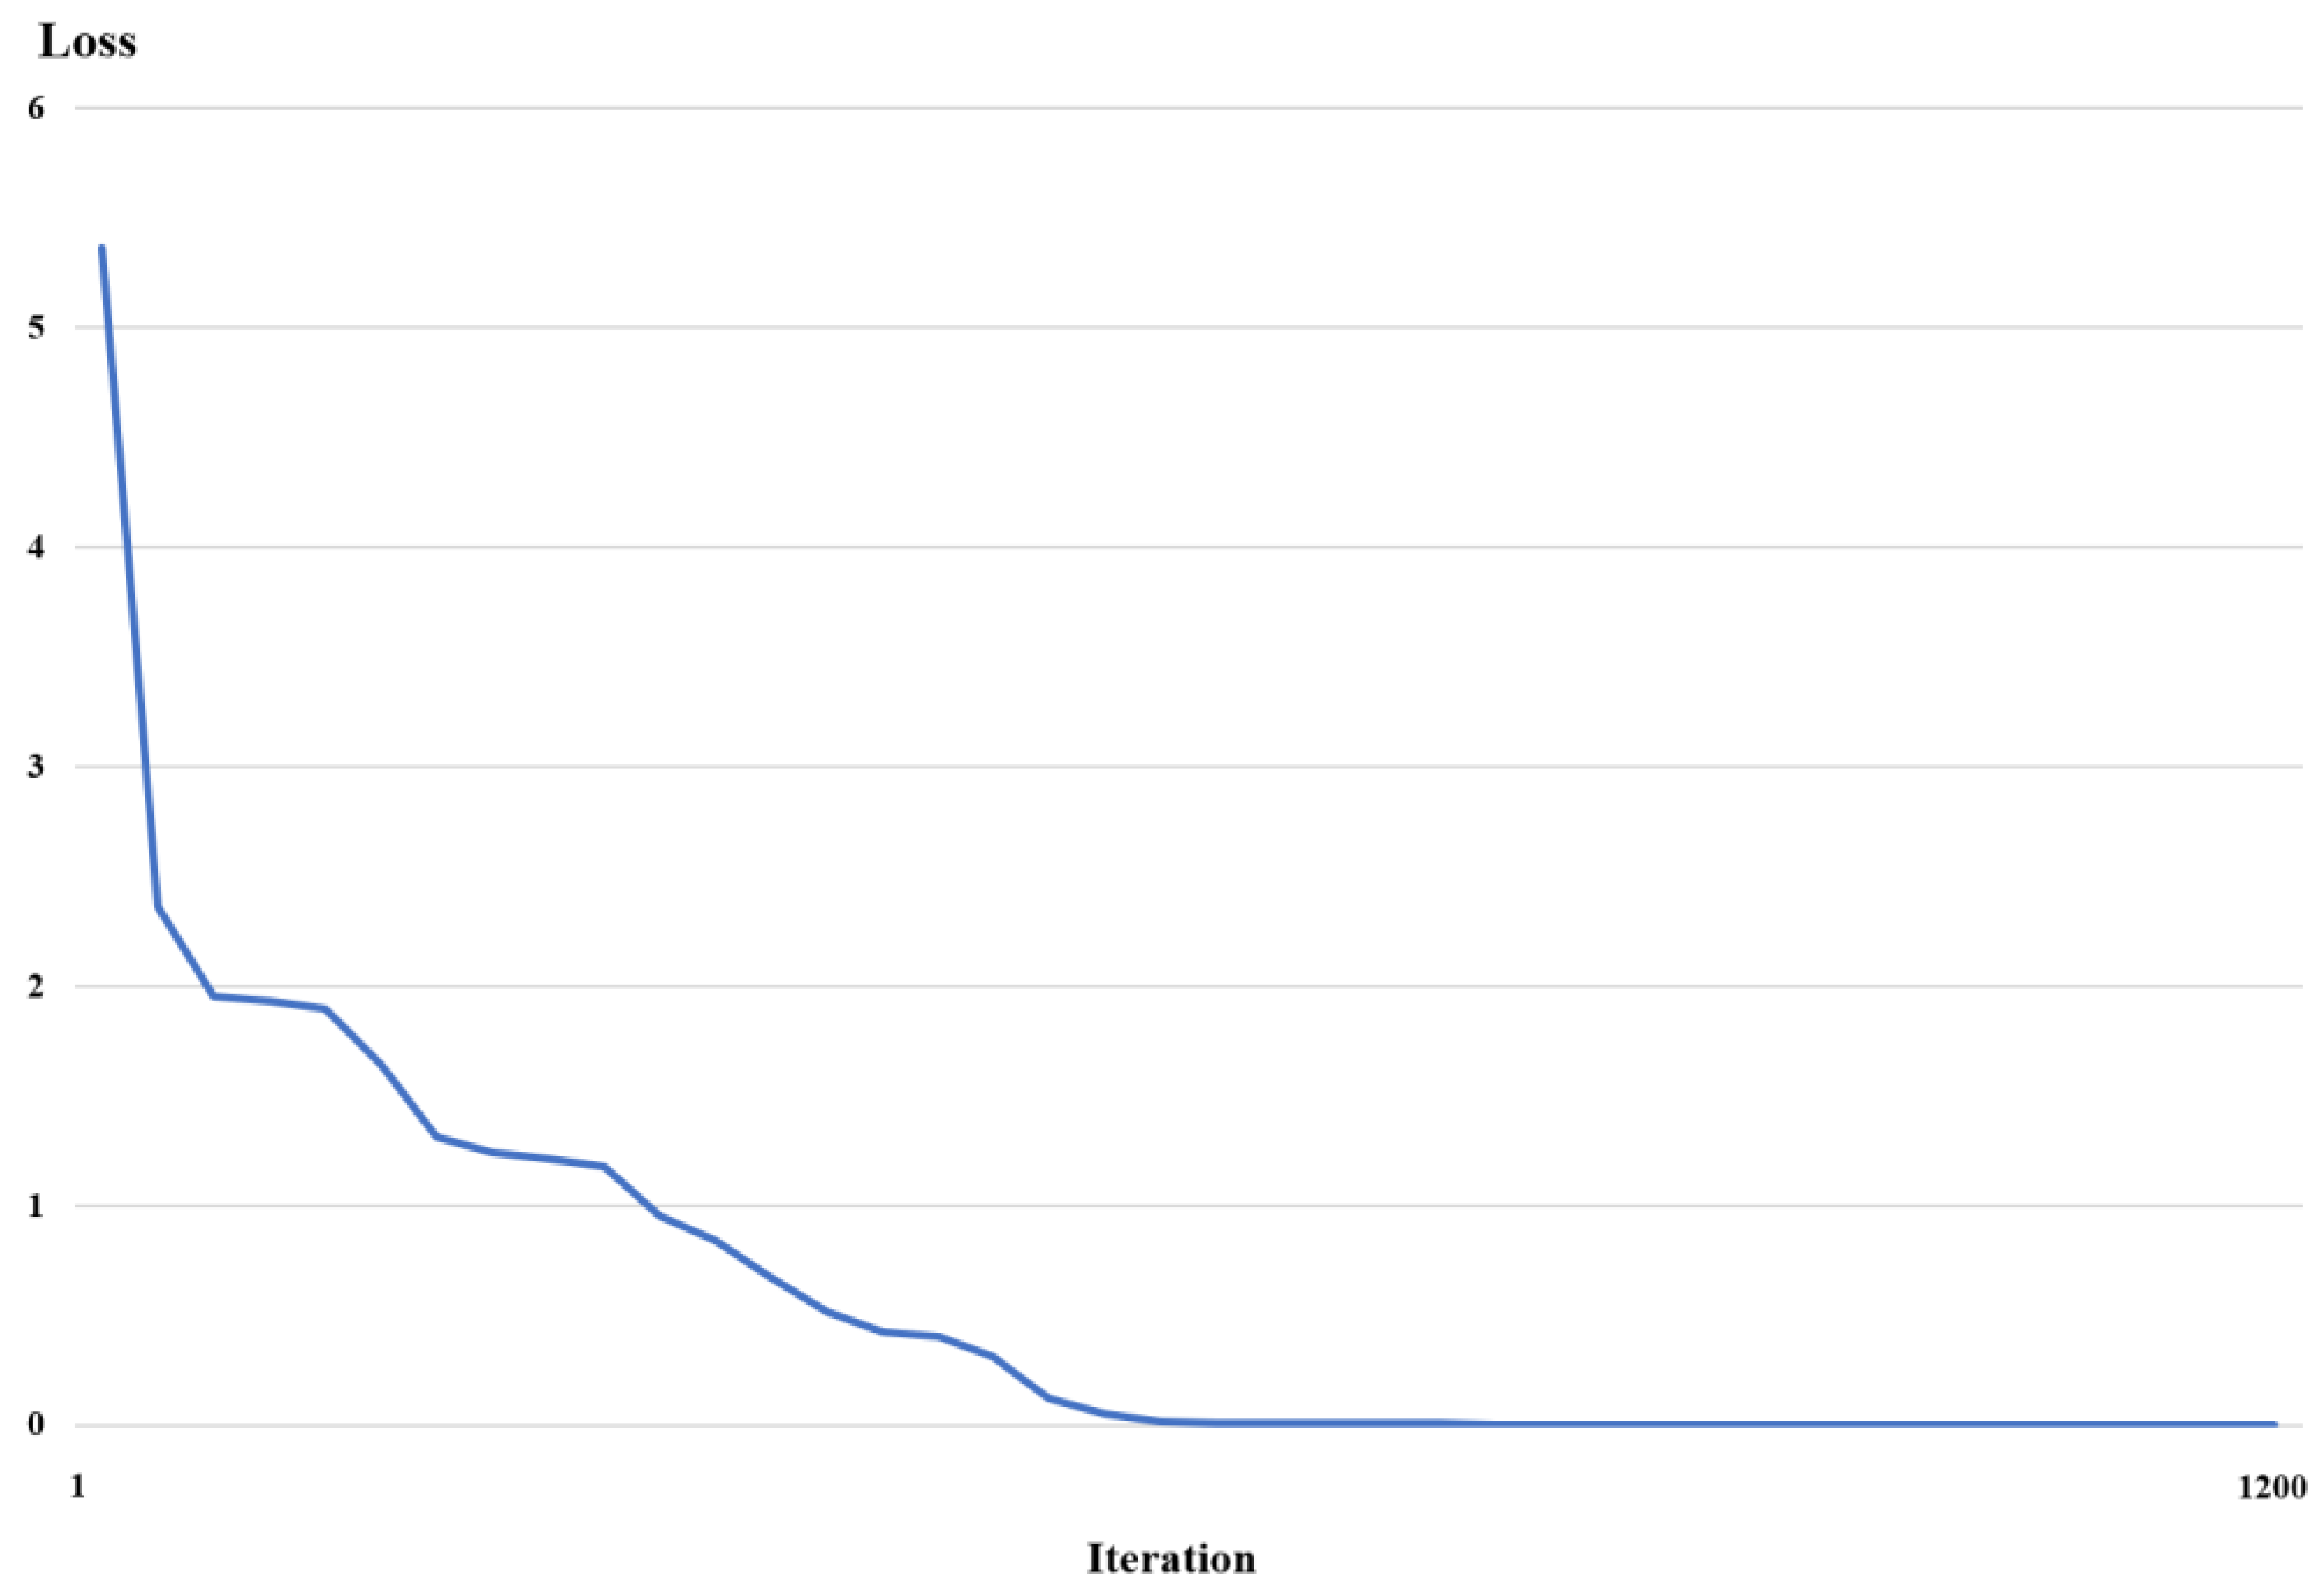
Figure 17.
Segmentation results of Hanok image.

Table 1.
Components of building exterior and form elements of Hanok.
| Components of Building Exterior (7) | Facade Form Elements (21) | Detailed Form Elements (102) |
|---|---|---|
| Placement | Main house types (A) * | ㄱ-shaped plan (a1), ㄷ-shaped plan (a2), ㅁ-shaped plan (a3), ㅡ-shaped plan (a4) |
| Layout types (B) * | ㄱ-shaped layout (ㄱ-shaped main house, b1), ㄷ-shaped layout (ㄱ-shaped and ㅡ-shaped gate building, b2), ㅁ-shaped layout (ㄱ-shaped main house and ㄱ-shaped gate building, b3), ㅡ-shaped layout (ㅡ-shaped main house, b4) | |
| Orientation of the road (C) * | Under the ㄱ-shaped plan (c1), right of the ㄱ-shaped plan (c2), top of the ㄱ-shaped plan (c3), left of the ㄷ-shaped plan (c4), under the ㄷ-shaped plan (c5), right of the ㄷ-shaped plan (c6), side of the ㅁ-shaped plan (c7), long side of ㅡ-shaped plan (c8), short side of ㅡ-shaped plan (c9) | |
| Roof | Roof types (W) | Hipped roof (w1), hipped-and-gabled roof (w2), gabled roof (w3), gabled roof and hipped-and-gabled roof (w4), hipped-and-gabled roof and hipped roof (w5), gabled roof and hipped roof (w6) |
| Rafter color (X) | Color (x1), colorlessness (x2) | |
| Eave types (Y) | Single eave (y1), double eave (y2) | |
| Main gate | Main gate types (L) | Pyeong daemun gate (flat gate, l1), ilgak daemun gate (two-pillar gate, l2), iron gate (l3), no gate in facade (l5) |
| Location of the main gate on the plan (D) * | No gate in facade (d1), same as the wall line (d2), set back from the wall line (d3) | |
| Location of the main gate in facade (M) * | End of the building (m1), center of the building (m2), outside the building (m3) | |
| Outer wall | Facade width (F) * | ~6 m (f1), 7~9 m (f2), 10~12 m (f3), 13~15 m (f4), 16~18 m (f5), 19~21 m (f6), 22~24 m (f7) |
| Wall configuration (S) * | Flat wall (s1), pillar wall (s2) | |
| Lower part of the wall (T) | Sagoseog (18–20 cm cubic granite, t1), natural stone (t2), layers with roof tile (t3), plastered wall (t4), gray brick (t5), red brick (t6), cement (t7), tile (t8), glass (t9) | |
| Middle part of the wall (U) | Sagoseog (18–20 cm cubic granite, u1), natural stone (u2), layers with roof tile (u3), plastered wall (u4), gray brick (u5), red brick (u6), cement (u7), tile (u8), glass (u9) | |
| Exterior wall decoration (V) | Grid rounding (v1), floral pattern (v2), design pattern (v3), not applicable (v6) | |
| Window types (R) | Grid (r1), jeongja (r3), ahja (r4), bitsal (r5), wanja (r6), general window (r7), yongja (r8), no window (r9) | |
| Stylobate | Stylobate types (K) | Natural stone stylobate (k1), rectangular stone stylobate (k2), cement stylobate (k3), brick stylobate (k4) |
| Fence wall | Fence types (I) | Sagoseog and brick and roof tile (i1), natural stone and roof tile (i2), sagoseog and layers with roof tile and roof tile (i3), sagoseog and roof tile (i4), layers with roof tile and plastered wall and roof tile (i5), sagoseog and floral pattern and roof tile (i6), brick/tile and roof tile (i7), cement and roof tile (i8), no fence (i9) |
| Fence forms (J) | Entire fence at a different level than the road (j1), partial fence at a different level than the road (j2), entire fence at the same level as the road (j3), partial fence at the same level as the road (j4) | |
| Site | Level difference between ground and road (N) * | −1~0 m (n1), 0~0.5 m (n2), 0.5~1 m (n3), 1~2 m (n4), 2~3 m (n5) |
| Level difference of ground (Q) * | Difference between ground level and road (q1), no difference between ground level and road (q2) | |
| Slope of ground (P) | Slope (p1), no slope (p2) |
* Only the Hanok form elements presented by Shon (2018), corresponding to the facade of the target site in the current study, are organized and classified [3]. All of these classes and elements were used for the 3D modeling of a Hanok. However, classes marked with ( ) * were excluded from the Mask R-CNN analysis because of recognition problems in Chapter 4, and the other classes and elements were utilized in the analysis.
Table 2.
JSON format metadata structure of labeled image.
| Key Values | Description | Item Values (Example) | Data Format | |
|---|---|---|---|---|
| version | JSON Format Version | “4.6.0” | STRING | |
| flags | Null | {…} | STRING | |
| shapes | Shape Format | […] | LIST | |
| └ | label | Image Class | “a1” | STRING |
| └ | points | Bounding box coordinate | {...} | DICTIONARY |
| └ | group_id | Null | Null | STRING |
| └ | Shape_type | Type of Shape | “polygon” | STRING |
| └ | flags | Null | null | STRING |
| ... (continued) | ||||
Table 3.
COCO Format metadata for training.
| Key Values | Description | Item Values (Example) | Data Format | |
|---|---|---|---|---|
| annotations | Annotations | [...] | LIST | |
| └ | id | Order of Images | {...} | INT |
| └ | image_id | Order of Images | “0” | INT |
| └ | category_id | Id of Labels | “13” | INT |
| └ | segmentation | Segmentation Coordinate | […] | DICTIONARY |
| └ | area | Area of Pixel | “115,672.0” | INT |
| └ | bbox | Bounding box coordinate | […] | LIST |
| └ | iscrowd | Single or Multi Object | “0 or 1” | INT |
| ... (continued) | ||||
Table 4.
AP value of the experiment.
| mAP | ||
|---|---|---|
| 62.6 | 78.75 | 69.41 |
Disclaimer/Publisher’s Note: The statements, opinions and data contained in all publications are solely those of the individual author(s) and contributor(s) and not of MDPI and/or the editor(s). MDPI and/or the editor(s) disclaim responsibility for any injury to people or property resulting from any ideas, methods, instructions or products referred to in the content. |
© 2023 by the authors. Licensee MDPI, Basel, Switzerland. This article is an open access article distributed under the terms and conditions of the Creative Commons Attribution (CC BY) license (https://creativecommons.org/licenses/by/4.0/).
Share and Cite
MDPI and ACS Style
Shon, D.; Byun, G.; Choi, S. Identification of Facade Elements of Traditional Areas in Seoul, South Korea. Land 2023, 12, 277. https://doi.org/10.3390/land12020277
AMA Style
Shon D, Byun G, Choi S. Identification of Facade Elements of Traditional Areas in Seoul, South Korea. Land. 2023; 12(2):277. https://doi.org/10.3390/land12020277
Chicago/Turabian StyleShon, Donghwa, Giyoung Byun, and Soyoung Choi. 2023. "Identification of Facade Elements of Traditional Areas in Seoul, South Korea" Land 12, no. 2: 277. https://doi.org/10.3390/land12020277
Note that from the first issue of 2016, this journal uses article numbers instead of page numbers. See further details here.