1. Introduction
Technological development in close-range Remote Sensing (RS) for landscape archaeology has enabled many important advances in the field of both knowledge and methodologies for the discovery, conservation, and protection of Cultural Heritage (CH) [
1,
2,
3,
4,
5,
6,
7,
8]. In particular, the development of technologically advanced close-range RS tools for (i) discovery, (ii) 2D and 3D surveying, and (iii) non-invasive prospecting, has allowed archaeologists to overcome many problems associated with archaeological fieldwork. Although these tools cannot replace the work of the archaeologist, they provide support in research and identification of high potential archaeological areas, in order to plan activities and avoid unnecessary expenditure of resources, time, and energy [
9,
10,
11]. For the latter reason, RS has proved to be a useful tool for archaeologists as it allows them to undertake landscape archaeology remotely over very large or difficult-to-access areas [
12,
13,
14,
15].
Among the most exciting and complex challenges faced in archaeological prospecting, the study of a densely-forested landscape is one of the most challenging. Forest cover preserves the archaeological remains and, at the same time, limits their visibility through both traditional survey methodology and indirect techniques, including passive remote sensing and geophysics [
9,
16,
17,
18,
19,
20]. In such operational circumstances, archaeological investigation is even more challenging: (i) in conditions of articulated or complex orography or (ii) when the archaeological proxies are partly due to micro-topographic variations, thus making it difficult to distinguish those of cultural interest from those of a geomorphological nature.
This study focuses on the integration of different close-range remote sensing techniques for the knowledge of medieval settlements under canopy. Currently, there are not many scientific works that simultaneously integrate the use of ALS, TLS, aerial/terrestrial PHG, and archaeological surveys for archaeological research in under-canopy contexts. In most cases, this involves the use of a single or two tools (e.g., ALS and TLS, PHG and TLS), while case studies that aim to achieve a complete integration in a single project are rare, and often for forestry and non-archaeological studies [
5,
12,
21,
22,
23,
24,
25,
26,
27,
28,
29,
30,
31]. Non-invasive close-range RS techniques (aerial and terrestrial Laser Scanner—ALS and TLS, aerial and terrestrial photogrammetry, topographic survey, GNSS survey) were used together to collect data at different resolutions. The work aims to show a virtuous methodological approach (operational chain) based on: (i) data acquired from airborne LiDAR and archaeological studies (e.g., archaeological bulletins), for the identification of archaeological remains; (ii) validation of the data through field surveys; (iii) creation of detailed documentation through 3D and 2D surveying; and (iv) and creation of a GIS information database and 2D and 3D documentation. The case study used to achieve this purpose was the fortified site of Altanum in Calabria, a densely-vegetated area in southern Italy. Altanum was chosen as a case study because, to date, no updated and modern archaeological documentation exists for the hill of Sant’Eusebio and the conditions of the scenario were ideal for the purpose of the project.
2. Materials and Methods
The investigations were coordinated by the CNR (National Research Council) under the financial support of the Italian Ministry of the University and Research (MUR), and were conducted within the framework of E-RIHS.it, the Italian node of the European research infrastructure on Heritage Science (see acknowledgement).
The choice of tools to be used was mainly dictated by the densely-vegetated scenario with steep slopes, and the need to know the location of the archaeological remains and document them in depth.
Both were used from the ground and from UAS, and the data acquired by them were then complemented by field survey and topographic acquisition activities (GNSS and total station).
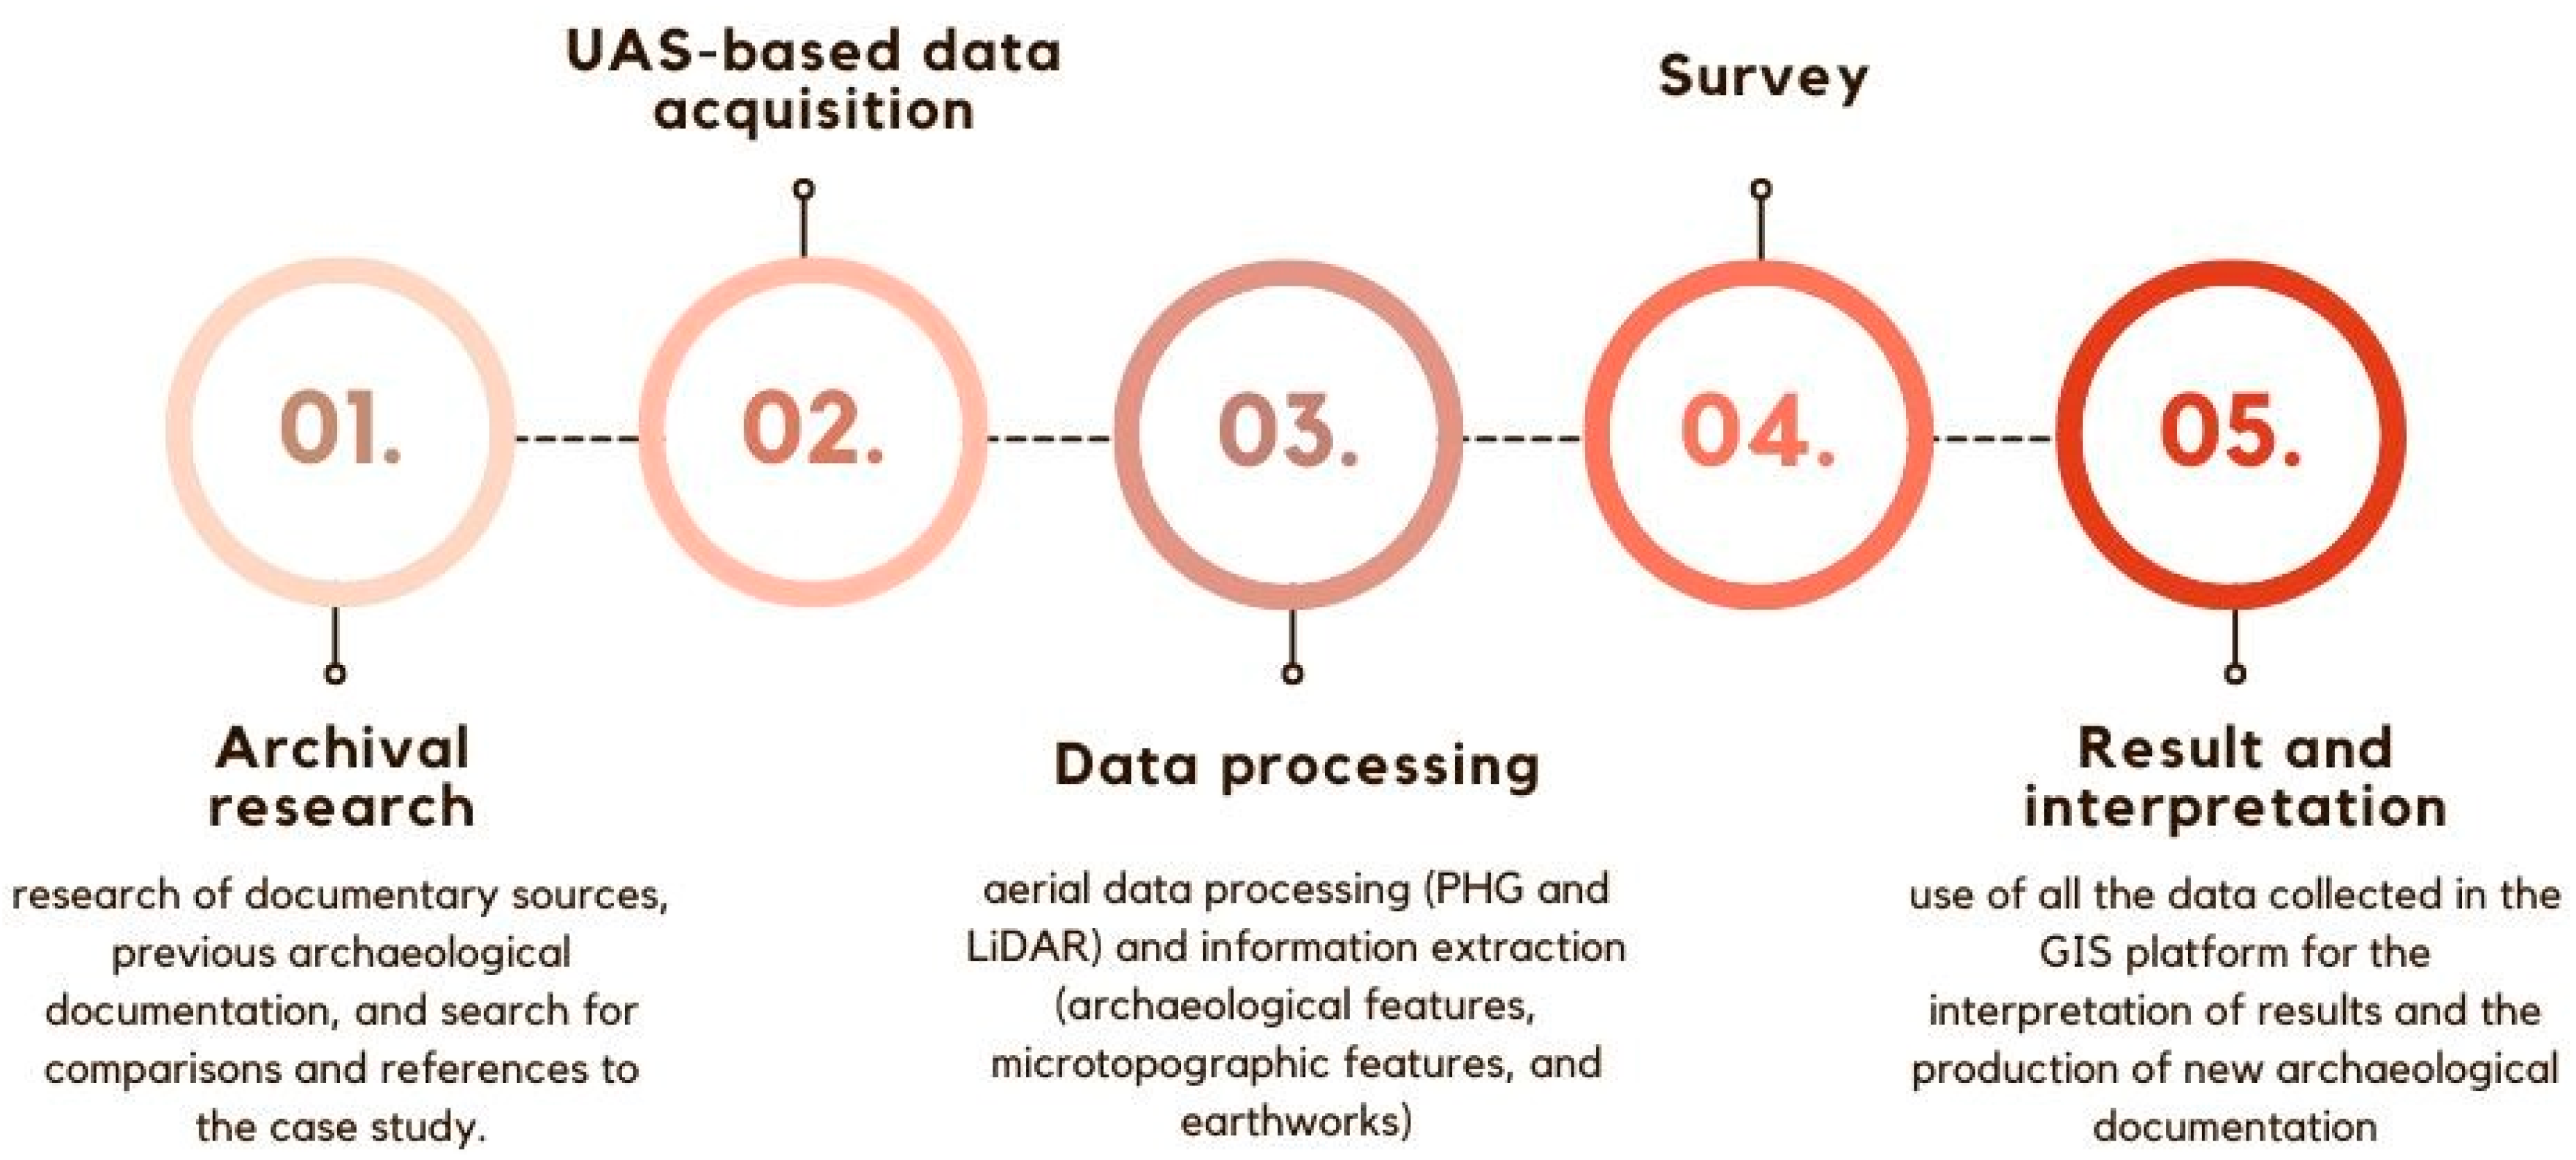
The survey activities started with an extensive aerial survey of the site (ALS and PHG) in order to identify both areas to be further surveyed (field survey, TLS and PHG) and to detect surface anomalies under the canopy (e.g., buildings or archaeological features). The work was carried out according to the following steps:
Identification, record of the extent of the medieval settlement and detection of archaeological anomalies using non-invasive technologies such as drone LiDAR (ALS) and aerial photogrammetry (PHG);
Direct investigation and survey of archaeological features and earthwork anomalies, using aerial photogrammetry (PHG) and terrestrial laser scanner (TLS);
Surveying remains under the canopy, hardly accessible by the means of TLS and PHG, and built phases characterization by stone masonry observation; and
Providing in-depth documentation for use in future archaeological investigations by creating a single project using open-source GIS (QGIS) containing: (i) data acquired by archaeological research, (ii) data acquired by ALS and TLS, (iii) data acquired by PHG, and (iv) data acquired by field surveys and topographic surveys.
The flowchart in
Figure 1 summarizes the activities carried out at Altanum.
2.1. Study Area
The site stands on top of Sant’Eusebio hill in San Giorgio Morgeto Municipality (RC) (
Figure 2).
San Giorgio Morgeto is a small town in the province of Reggio Calabria and is dominated by the homonymous castle, a great example of Norman-Swabian defensive architecture in Calabria [
32]. The castle is dated to the 13th century A.D., according to historical sources. The whole area was characterized by different occupation periods, such as those of the Greek, Byzantine, and Norman-Swabian eras. The oldest Byzantine presence is located on the hill of Sant’Eusebio, about 2 km from the city. The site is located 800 m above sea level (a.s.l.) and had an important strategic position in control of the Valley of Gioia Tauro and the Tyrrhenian Sea. Historical interpretations of the structure of the hill of Sant’Eusebio were offered by local scholars during the 17th and 18th centuries.
Marafioti claimed that the ruins belonged to a Roman statio (Latin name for rest or post station) called Altanum, while other scholars argued that they only belonged to a late antique or early medieval fortification (kastron) called Sant’Eusebio [
33]. None of the proposed chronologies were based on archaeological observations since the structures of Altanum were never documented or systematically studied, except for a sketch drawn by Vincenzo De Cristo in 1921 (
Figure 3).
In 1921, Vincenzo De Cristo carried out the first archaeological excavations conducted by Soprintendenza di Reggio Calabria, providing a first eidotype. De Cristo recorded the fortified walls and a circular tower (10 m diameter), which he called “bombard tower” (bombardiera). In addition, he found two ancient cisterns, a large amount of pottery, and three Byzantine coins during excavations on the western part of the hill.
The bombard tower and the wall were investigated for a second time (2002–2003) and late medieval archaeological remains were recorded [
34,
35]. The analysis of the defensive walls revealed the presence of different masonry techniques, implying the existence of several construction phases. The current hypothesis suggests that the structures built with regular courses of bricks could be associated with the first phase, while the western wall, built with stones arranged in irregular courses, could refer to a later phase. The construction of the bombard tower could be dated to the last medieval defensive activities [
34,
35].
The outer wall was probably built to defend the Byzantine village as known from other contemporary sites (e.g., Sant’Aniceto and Calanna [
32]). The area is indeed located at a strategic route point, the so-called Passo della Limina, connecting the Tyrrhenian coast to the colony of Locri and, through the Ionian coast, to the cities of Medma and Hipponion. Some remains could be instead dated to the late Middle Ages, precisely during the war between Aragonese and Angevins, while the last construction phase belongs to the modern era (18th century). Unfortunately, all documentation produced in the past cannot be considered as modern documentation as it lacks proper metric restitution as well as georeferencing, although it was very useful for the present study.
2.2. Active and Passive Sensors Used for This Study
This section describes the rationale, theory, and the physical rules of sensors used for the study, while a more detailed description (e.g., technical settings and equipment models), as well as the state-of-the-art on individual uses, is deferred to the following paragraphs (see
Section 2.3 and
Section 2.4).
As the need was to discover and record remains of archaeological interest mostly under vegetation, both active and passive sensors were used [
36,
37,
38]. Specifically, the tools used were: (i) ground and UAS-based lasers (TLS and ALS), and (ii) ground and drone cameras (PHG).
2.2.1. Active Sensors
Two types of laser tools were chosen for this study: (i) terrestrial laser scanners (see
Section 2.4) and (ii) UAS LiDAR (light detection and ranging) (see
Section 2.3.2). Laser scanners are active sensors capable of calculating the distance between the sensor and the target [
16,
39]. These produce a three-dimensional point cloud, with x-y-z coordinates and other information (e.g., colour, intensity), with high density and high accuracy [
40]. These tools are extremely useful for the creation of high-resolution three-dimensional documentation. To date, both terrestrial (TLS) and airborne and drone (ALS) laser scanners are used in several fields such as environmental monitoring [
41], structural and architectural analysis [
42,
43], forests [
44,
45], and cultural heritage [
5,
46,
47]. The most commonly-used laser sensors are time-of-flight (TOF) lasers and phase shift lasers. The differences between the two techniques are in the distance, speed, and accuracy of the acquisition. The phase shift technique is more accurate, precise and fast, while the time-of-flight technique has a greater range [
48]. TOF lasers send a short laser pulse (a few nanoseconds) to a target and the distance is measured calculating the time between the emission and the reception of the reflected pulse from the target itself (1). Phase shift lasers measure the distance using the phase difference between the departed and returned signal (2) [
40,
49,
50].
where D is the distance, C is the light speed, Δ
t is the time elapsed from emission to reception of the pulse,
f is the modulation frequency, and
φ is the phase shift.
In addition to distance measurement for the acquisition of three-dimensional point clouds, a LiDAR sensor from UAS was chosen as it was considered the best performing tool in a densely-vegetated environment to observe archaeological remains covered by vegetation, as described in [
19,
51]. The reason for this performance is inherent in the LiDAR sensor itself. LiDAR used for this type of activity records both the distance travelled by light and the targets encountered along the route. In fact, with pulses of only a few nanoseconds, the backscattered signal that forms a return wave consists of a succession of echoes corresponding to any obstacle encountered by the laser beam. The energy distribution returning to the sensor is called the waveform, and the amount of energy returning to the LiDAR sensor is known as the intensity, sometimes also referred to as reflectance, and expressed in dB (decibels). The data can be recorded and analysed as: (i) single echo (first or last echo), (ii) first and last echo, and (iii) multi-echo (first, intermediate, last) [
52]. In the field of the study of archaeological remains under vegetation, this feature is very important as the acquisition of a number (>1) of echoes makes it possible to digitally remove the vegetation (point cloud classification) in order to observe the ground and structures on or partially embedded in it, as well as microtopographical anomalies [
16,
19,
51,
53].
2.2.2. Photogrammetry
Passive sensors used were terrestrial (see
Section 2.4) and UAS (see
Section 2.3.1) cameras. They were used for the creation of accurate three-dimensional models through the use of three-dimensional photogrammetry. Three-dimensional photogrammetry is a technique that allows a digital model of the real object to be obtained from photos, using a technique called SfM (Structure from Motions) [
54,
55,
56,
57,
58,
59]. It is a widely-used technique in the field of cultural heritage close range RS because it is affordable compared to other techniques, fast, and easy to apply. Furthermore, when combined with other techniques to enhance its performance, such as topographic survey and GNSS, it provides precise and accurate results, and very-high-resolution three-dimensional models. This method is based on metric image processing and works on precise mathematical and geometrical rules (projective-prospective geometry) to extract 3D metric coordinates from images. Each image, in fact, contains all the information necessary to reproduce both the shape (mesh) and the colour (texture) of the photographed object [
60]. In photogrammetry, if an object is imaged from at least two points of view, it is possible to obtain stereoscopic views and derive three-dimensional information based on the overlapping areas of the images. Unlike other three-dimensional visualisation techniques, photogrammetry aims to obtain metrically-accurate, precise and geometrically-reliable information. Photogrammetry is based on a principle called collinearity [
61]. This principle is based on two Equations (11) and (12) to correlate the coordinates in the sensor plane (2D) with those of the three-dimensional object (3D) [
55,
60,
62] (3)–(5):
where
x,
y,
z refer to the sensor’s coordinate system with x and y in the sensor’s plane;
xp,
yp,
zp are the coordinates of point P on the object (3D);
x,
y are the coordinates of P on the sensor plane (2D);
x0,
y0,
z0 are the coordinates of the optical projection center;
ℓ is the fixed ratio between
x −
x0 and
x0 −
xp,
y −
y0 and
y0 −
yp, and the distance from the projection center to the sensor plane is given by
z0 = c and
zp −
z0. Solved in (6) and (7):
and then in (8)–(10):
where
X,
Y,
Z are the coordinates of P outside the camera;
X0,
Y0,
Z0 are the coordinate of the projection center; and
R is a 3 × 3 rotation matrix. Finally, the two collinearity equations are generated (11) and (12):
2.3. Aerial Survey
During last decade, aerial photogrammetry (PHG) and LiDAR (Light Detection And Ranging) acquisitions from UAS have been widely used in archaeology [
46,
55,
58,
63,
64,
65].
Aerial photogrammetry is currently a widely-spread tool in aerial archaeology, allowing large-scale acquisition of three-dimensional data in visible, multispectral, and thermal spectra [
55,
56,
59,
65,
66,
67]. This technique has long case history in visible (3D models and large-scale acquisitions), multispectral and thermal (identification of crop- and soil-marks, and buried structures) surveys, such as the case of 3D models in Hierapolis (Phrygia, Turkey) by Chiabrando et al. [
58], the reconstruction of the plan of the medieval monastery of San Vincenzo al Volturno (Isernia, Molise) using multitemporal and multispectral analysis by Abate et al. [
68], and the discovery of traces of archaeological interest through the analysis of thermal intertie and evapotranspiration analyzed by Casana [
66].
LiDAR technology (ALS) is currently used on both airplanes and drones and, to date, is probably one of the most effective approaches among RS techniques applied to identification of archaeological remains under vegetation [
46,
51,
54,
63,
69,
70,
71,
72]. In modern literature, several studies are related to LiDAR implementation leading to significant archaeological discoveries under canopy, such as those conducted by Khan et al. [
73] for the reconstruction of ancient landscape covered by the Amazon Forest; by Chase et al. [
74,
75] on the ancient Maya civilizations; by Evans et al. [
76] in Angkor Wat in Cambodia; by Masini et al. [
17,
70] in Italian medieval sites; and by Danese et al. [
77] related to the looting phenomena. In addition, recent trends applied to LiDAR for archaeological prospection led numerous scholars to assess pipelines for data filtering [
51,
64] and data extraction, through the use of machine and deep learning [
78,
79], as well as the use of supervised or non-supervised archaeological features detection [
80].
Two different approaches were used for UAS acquisitions at the Altanum site: an RGB camera-equipped UAS was used to produce a high-resolution orthophoto of the area, and a LiDAR-equipped UAS was used to produce a high-resolution DFM (Digital Feature Model) or NVS (Non-Vegetated Surface) [
51,
63,
64] in order to analyse features and earthwork anomalies to be associated with archaeological evidence. The area surrounding the hill is covered by a dense forest of oaks and cork. Operating conditions dictated the use of LiDAR technology as the only one able to obtain a ground model without vegetation [
63,
64,
81].
2.3.1. Aerial Photogrammetry Survey
Aerial photogrammetric survey was performed by DJI Matrice 210 v.2 multirotor UAS, equipped with a high-resolution (20 MP) RGB DJI Zenmuse X5S camera with a DJI MFT 15 mm/1.7 ASPH lens (
Figure 4a). The area investigated was approximately 43 hectares (ha) and has a highly variable morphology. The flight mission was planned with the UGCS
® software (v.4.6.520). The software allows the creation of flight plans and setting of all parameters (e.g., speed, altitude, lateral/frontal overlap). In addition, it allows autonomous flight function called terrain awareness, useful for flying at constant height following the orographic profile of the ground, having a constant GSD (Ground Sample Distance) in all photos. DEMs (Digital Elevation Model) provided by Tinitaly (
http://tinitaly.pi.ingv.it/, accessed on 10 October 2021) were used for both aerial photogrammetry and LiDAR flights [
82,
83,
84,
85].
The area was acquired flying: (i) at 120 m Above Ground Level (AGL); (ii) at a speed of 3 m/s; (iii) using single flight path mode; (iv) nadiral camera (90°); and (v) with a lateral and frontal overlap of 80% and 80% between images.
High-visibility coded targets, also called Ground Control Points (GCPs), have been distributed in the area and recorded using a GNSS Topcon GR5, in order to correct the accuracy of the captured data (photogrammetric and TLS). A total of 20 GCPs in the reference system WGS 84 UTM 33N were used: 15 as control points and 5 as verification points.
The acquisition produced 693 RGB photos, which were then processed within Agisoft Metashape®. The process steps within the photogrammetry software were: (i) dataset creation; (ii) camera calibration; (iii) alignment (sparse cloud); (iv) identification of Ground Control Points in photos; (v) addition of GCP coordinates; (vi) data correction and alignment adjustment (native correction in Agisoft Metashape); (vii) dense cloud creation; (viii) DTM creation; and (ix) orthophoto creation. The use of GCPs allowed us to obtain an orthophosomosaic with 2.6 cm/pixel resolution, with an average error, estimated (thanks to the validation points on the ground) as approx. ≤2 cm (East and North) and ≤4 cm (Altitude).
2.3.2. LiDAR Survey
LiDAR survey was performed using a Riegl MiniVux-3 5-echo laser scanner, equipped with a GNSS PPK positioning system, used as a payload on a DJI Matrice 600 drone (
Figure 4b,c). LiDAR acquisition covered an area of about 60 ha. Flights were carried out at 70 m AGL, at a constant speed of 3 m/s, in double acquisition grid pattern [
80]. In order to cover the entire area, 16 flights were carried out in 8 sub-rectangular areas of approx. 250 × 250 m (
Figure 5a). The LiDAR was used: (i) at 300 Khz pulse repetition frequency, (ii) 120° of FOV (Field Of View), and (iii) 100,000 measurements per second.
Data processing followed the steps described below:
Acquisition of GNSS RINEX data from the permanent stations located in the Italian peninsula;
Correction of the route acquired by the drone PPK antenna based on the data from the permanent GNSS stations, in Applanix POSPac UAV software (reference system WGS 84 UTM 33N) (
Figure 5b);
Use of Riegl’s RiPROCESS® suite for the creation of the point cloud;
Use of Riegl’s RiPRECISION function to refine the alignment of the scans obtained from the several flights (Riegl software standard correction parameters);
Georeferenced LiDAR point cloud export.
Once the points cloud was produced, ground points were classified using Global Mapper
® v.22.1 software. Global Mapper
® is a software produced by BMG (Blue Marble Geographics—U.S.A.) that uses a type of hybrid filter called BMHF (Blue Marble Hybrid Filter), already discussed in [
86].
Point cloud filtering operations were:
1. Classification of ground points, noise, and other classes, using the software’s automatic classification algorithm (using BMG-suggested parameters for high density point clouds in stepped scenario [
87]). The density of the classified point cloud (ground class) was between approx. 1 and 2.300 points/m
2 (
Figure 5c,d). The high number of points in the vegetation-free areas was due to the overlap of LiDAR acquisitions, increased by the double-grid flight, as well as by the lateral overlap between the lines (30 m) and by the large FOV (120°) of the Riegl LiDAR;
2. Creation of a TIN (Triangulated Irregular Network) model from the classified point cloud at 0.1 m/pixel [
88,
89];
3. Creation of the DSM (Digital Surface Model) and DFM (Digital Feature Model) (
Figure 5e,f).
The acronym DFM (Digital Feature Model) will be used in the following text instead of DTM. In fact, the term DFM, also synonymous with NVS (Non-Vegetated Surface), indicates the digital terrain model by adding structures above it or partially embedded in it [
51,
64,
81].
The DFM was then exported at a 0.1 m/pixel of resolution for subsequent analysis.
Finally, the DFM obtained from LiDAR acquisition was subjected to several operations to improve archaeological features rendering and visibility. Operations can be summarized in two types: (i) noise reduction and (ii) creation of derivative DFM models from different visualization techniques.
General noise and speckle reduction was performed using an Enhanced Lee Filter in QGIS software [
90], using a 9 × 9 pixel window, according to (13):
where:
- (i)
LM is the Local Mean of the filter window;
- (ii)
CU = is the noise variation coefficient;
- (iii)
Cmax = is the maximum noise variation coefficient;
- (iv)
CI = is the image variation coefficient;
- (v)
K = ;
- (vi)
PC is the Center Pixel value of window;
- (vii)
SD is the Standard Deviation in filter window;
- (viii)
NLooks is the Number of Looks; and
- (ix)
D is the Damping factor.
The second operation performed on DFM, after filtering with the Enhanced Lee filter, was the production of different derivatives based on visualization techniques (VTs) [
51,
63,
64]. These techniques, generally based on light direction calculation over DFM’s nodes, can be categorised in the following two classes: (i) ones based on direct or diffuse illumination models calculation, and (ii) ones based on topographical parameters computation (
Table 1).
The first VT class includes: Hill Shading (HS), evidencing the surface’s relief (as Lambertian surface) with given zenith and azimuth artificial light direction; Multi Hill Shading and diffuse (isotropic) illumination, such as Sky View Factor (SVF) [
92] and “Openness” [
93]. The second VT class is focused on computation, based on topographical features such as slope gradient, convexity, Local Relief Model (LRM) and Trend Removal. The result is obtained by removing macro-topography, computing a smoothed DFM, using a low pass filter, and subtracting the smoothed DFM to the initial one, thus calculating zero meter contours from the difference model in order to obtain break lines [
94,
95].
All the produced data were subsequently analyzed in a GIS environment to produce archaeological cartography displaying contour lines, architectural features, and anomalies. These results were used as base for subsequent activities—in particular, planning field survey activities (ground truth and data validation) and establishing areas to further acquire with TLS and terrestrial PHG.
2.4. Land Survey
Field surveys were conducted according to LiDAR data and its derivatives.
The field survey made it possible to recognise some surviving portions of the settlement’s walls, while elsewhere, steep elevation variation was noted. These earthworks often have a straight course characterised by the abundant presence of scattered stones. The cropmarks visible in many areas from aerial photography are an indication of probable buried structures (
Figure 6). A detailed tridimensional survey, using TLS and PHG, was carried out on: (i) the remains of a circular structure already known as the “bombard tower”; (ii) parts of the defensive wall; (iii) the remains of the two buildings (cisterns); and (iv) the building interpreted as a church (
Figure 7). The survey was conducted according to a well-established methodology [
96,
97,
98].
Preliminary to the 3D surveying was the topographical survey, carried out using a GPS receiver (Topcon GR5) and a total station (Ruide RCS), concerning the measurement of a control network. Ground Control Points (GCP) have been positioned on the ground, for both TLS scans alignment and PHG data integration. After targets positioning and acquisition with total station, local coordinates obtained were transformed into geographical coordinates by measuring coded targets with a GNSS and performing a rototranslation with Toposoft
® software. This strategy was necessary due to the distance among areas to be subjected to topographic surveys, requiring the implementation of four local coordinate system networks, one for each building to be surveyed, subsequently connected through GNSS technique. GPS accuracy was further incremented by downloading Rinex data from the Smartnet Network service (
Figure 8).
TLS survey was performed using a high-resolution phase shift scanner Faro Focus 3D MS120 (1 point every 6 mm @ 10 m). This sampling choice allowed reasonable acquisition times and adequate metric resolution, performing 40 scans to completely document all the remains. The acquisitions produced point clouds of approx. 1 billion points. Such numbers facilitated data registration and reduced, as much as possible, shadow cones caused by dense vegetation growing on structures. Point cloud registration was performed within Faro Scene® software using the “Cloud to Cloud” procedure. Registration was subsequently verified using topographic measurements of coded targets (the Root Mean Square Error—RMSE is less than 1 cm), that were also used to georeference range maps.
PHG acquisition was performed using the 3DEye system® in order to capture images at different heights, since some wall portions were higher than 4 m. 3DEye is a photogrammetric solution composed by a Sony Alpha camera remotely controlled via software. The camera is stabilized by a pivoted support and it is mounted on a telescopic pole. In this case, it was impossible to use drones for a detailed survey of wall surfaces due to the presence of vegetation close to the structures.
Integration among PHG and TLS data was carried out within RealityCapture
®. Integration of range maps in this software is based on the generation of synthetic images from TLS registered point clouds using color or intensity. These spherical images, one for each standpoint, are converted into six .lsp files [
99]. The .lsp files are calibrated and oriented for each rotation, generating a cube that is externally positioned and orientated as the TLS standpoint. Photogrammetry image matching and orientation is subsequently based on the TLS synthetic images [
100] (
Figure 9).
3. Results
As mentioned, the activities conducted using different tools to document the remains at different scales allowed an accurate and, above all, adequate analysis for the creation of a useful dataset. Such documentative efforts were carried out in order to accomplish two main aims: to understand and discover the true extent of the site and structures of archaeological interest, which were unknown due to the presence of vegetation, and to create, for the first time, a detailed map of all visible archaeological remains, attempting to define their function within their historical period [
71].
3.1. Aerial Survey Data
Results from the processing of aerial data (PHG and LiDAR), in particular the post-processing of LiDAR data as described, provided important information for understanding and analysing the site (
Figure 10).
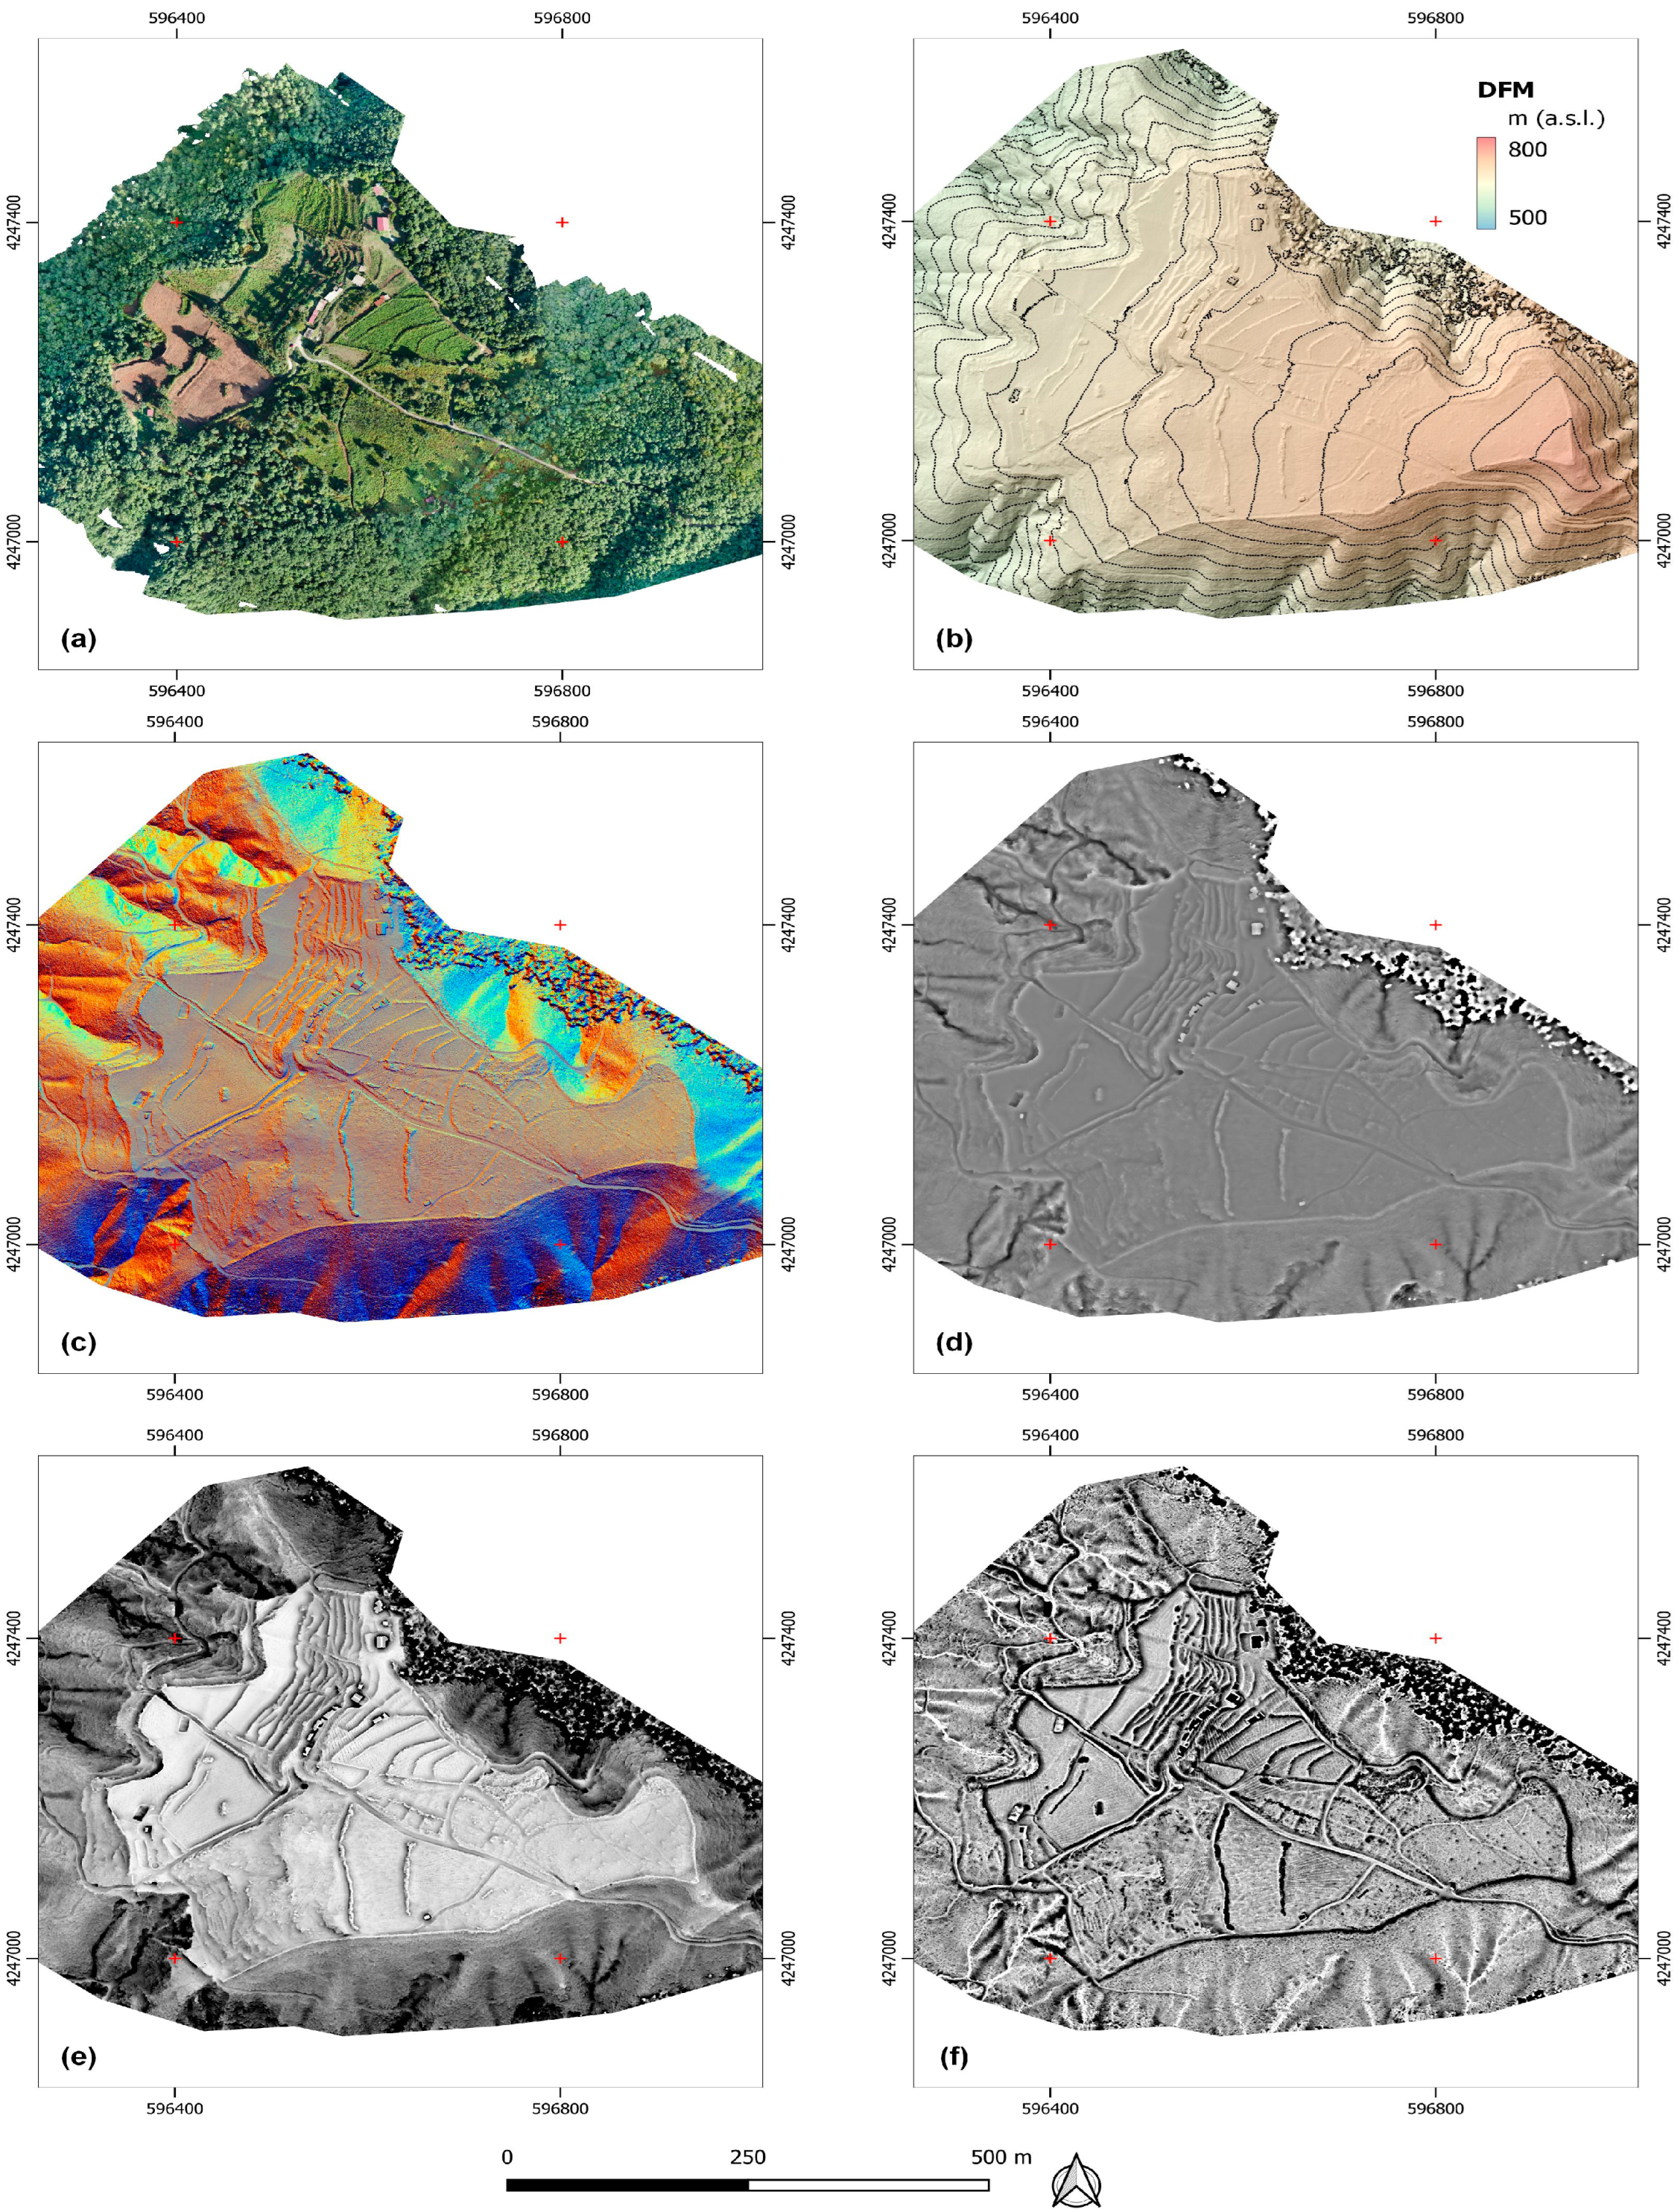
Multi Hill Shading, Simple Local Relief Model (SLRM), Sky-view-factor (SVF), and Openness Negative (ON) proved to be particularly useful for the Altanum case study. These LiDAR derivatives significantly improved visibility of earthwork and feature anomalies under canopy, as mentioned in [
17,
70,
75,
92,
101,
102]. The analyses provided information useful to: (i) identify multiple structures previously undocumented in the 1921 eidotype (
Figure 3); (ii) establish the areas to be deep documented with TLS and PHG surveys; and (iii) create for the first time a GIS-based archaeological map for the area (
Figure 11).
3.2. Land Survey Data
Land survey was aimed at the generation of architectural scale surveys (plans, elevations and cross-sections) useful both in the general mapping of the area and for the restitution of detailed documentation of the surviving archaeological structures. In order to produce 2D deliverables as described (
Figure 12), four high-resolution 3D textured models were generated (
Table 2).
4. Discussion
Processing and filtering operations performed on DFM were aimed at enhancing images, improving rendering and visibility. This allowed small contours to be emphasised and, consequently, the identification of archaeological features and the drawing of them on the map. These features are generated by topographical and microtopographical variations called terrain proxy indicators. Some of them were confirmed through field survey and matched those described in Vincenzo De Cristo’s 1921 eidotype. Newly-identified anomalies and those depicted in the eidotype mainly refer to surrounding wall structures, towers, and cisterns.
Figure 13 shows how the rectilinear mounds visible in the DFM match the cropmarks identified in the aerial photos. At the same time,
Figure 13 shows how far the eidotype deviates from the real pattern of structures.
A further in situ survey allowed for the identification of wall portions precisely placed along these anomalies, thus confirming the existence of a defensive circuit.
The DFM analysis allowed the identification of new traces referable to archaeological remains within the defensive wall circuit. The analysis of the DFM obtained by LiDAR highlighted the difference between agricultural and wooded areas in the preservation of archaeological remains. In fact, as already mentioned (see
Section 1), in agricultural areas, land use has almost erased microtopographical features, whereas in the forest, structures have been preserved. The identified traces are mainly concentrated in area C and present regular shapes (
Figure 13 and
Figure 14).
These anomalies are located in the area where some investigations were conducted in 1921 by De Cristo and duly indicated by the letters N, M, P and Q in his eidotype. Probably, the wall included within its circuit a whole inhabited area, or a large number of dependent rectangular buildings.
Another important result from data processing was the reconstructive hypothesis of the defensive walls. In fact, both identified anomalies and visible remains run all along the hill’s top, following contour lines and adapting to changes in the morphology of the terrain.
Along the defensive wall, three circular structures have also been re-discovered and interpreted as towers. The first (B1), the so-called “bombardier tower”, is the only one still visible. It must have been about 10 m in diameter and 7 m high and is placed completely outside the defensive wall, to which it is connected through a quadrangular room.
The second building (B2) is located at the opposite side of the site in a strategic position, occupying the highest standpoint on the hill. The structure is present in the 1921 eidotype and sketched with “approximate orthogonal lines” (as quoted by the author). The third hypothesized tower is B3 and is not described in the 19th-century archaeological documentation. The tower, that could be a “turris auxiliaria”, was not built along the walls. It was connected to the settlement walls by a fortified walkway. The “turris auxiliaria” was an advanced fortified building, created to control access routes. The area, marked with the letter A, could be one of the gateways to the settlement. Considering the morphology of the site, anyone who wanted to access the complex from this side of the hill, before arriving at gate A, had to pass by tower B2 and through a second fortified wall, perhaps functioning as a ravelin (D).
A break in the circuit wall has been identified by LiDAR data and field survey in the area called E (also reported in De Cristo’s drawing). Contrary to what was observed in 1921, analyses conducted have demonstrated that the identified opening is partly due to a landslide that partially damaged the wall.
The well-preserved wall segment G (30 m long and 4.5 m high) presents a masonry technique similar to that of the tower. In fact, it has an irregular laying of heterogeneously-shaped and -sized stones, both river pebbles and split stones, and a few brick fragments, bonded with abundant mortar. The internal materials, used for the core of the wall, generally consist of pebbles, stone fragments, and chips of stone arranged horizontally. Three alignments of beam-holes are visible. They are located at a regular distance of about 70 cm in height, which is functional for the installation of wooden scaffolding. Unfortunately, it was not possible to detect the thickness because the section leans against a knoll. A small wall section F, preserving both wall faces (inner and outer), is still visible in the southern part of the settlement, near the bombardment tower, and is partially covered by vegetation. The thickness here is roughly between 1.2 and 1.3 m. Thanks to the data acquired, it was possible to confirm some hypotheses for which supporting documentation was lacking:
- (i)
Altanum is a multi-layered site consisting of several building phases and built in a strategic position; and
- (ii)
the so-called bombard tower (B1) seems to belong to the last phases and could date back to a period between the 14th and 16th centuries. The visible wall is typical of the early firearms period. The tower has an impressive thickness of about 1.8 m at the base and the wall construction technique is characterized by stone blocks. The stones have extremely variable size and shape and are irregularly arranged and bonded with plenty of tenacious mortar. On the eastern side of the tower, there are rectangular holes for the location of horizontal beams probably supporting the wooden platform floor. Furthermore, there are some circular openings that have already been interpreted as loopholes for firearms.
5. Conclusions
Data and procedure integration (LiDAR, PHG, TLS, GNSS, total station, and field survey) allowed us to define the settlement’s shape and extent, and detect new archaeological features. The most significant survey result has been outlining the presence and path of an extensive defensive wall provisioned with towers and gates, and other rectangular structures – buildings whose function could be investigated in the future with targeted excavations. The added value of a multi-scale, multi-sensor close range remote sensing approach allowed for both a general look at the site and a particular look at structures already known or discovered during the acquisition campaign. This is a level of detailed knowledge from air to ground that would not have been possible without the combined use of terrestrial (TLS and PHG) and aerial (photogrammetry and LiDAR) techniques, as well as the canonical archaeological survey. Several new data have been acquired at the site as a result of this approach.
In fact, although the accuracy of De Cristo’s work was remarkable for the time (1921) and his work was indeed pioneering, the LiDAR investigation of this study nevertheless provides some new and remarkable data from an archaeological perspective as well. For example, with the exception of the 2002–2003 surveys, whose activity was focused only on the area of the bombard, for the first time in 100 years there is direct evidence of the existence and condition of the structures, located in such a particular environment. The study was not only able to detect all the remaining evidence, but also able to determine the exact position and perimeter of the wall, at some points very different from those described by De Cristo. At the same time, the final output, particularly the DFM model, highlighted the close link between morphology and defensive structures at the site. The size of the settlement and the probable presence of large cisterns and numerous structures within the defensive perimeter (evidenced by the earthwork anomalies as already indicated in the previous section) suggest that on the Sant’Eusebio hill there was a large inhabited settlement and thus that it was not exclusively a military garrison. Indeed, these first analyses carried out using integrated technologies have clearly begun to highlight the size of the site of Altanum and its archaeological potential that is not yet fully uncovered.
The data acquired allowed for a much more detailed topographical documentation of the site than that possessed so far, but did not allow for any further hypotheses on the dating of the archaeological site, which can only be further investigated through archaeological excavation.
The archaeological cartography produced in the GIS environment will remain a valuable help in the coming years for the protection activities conducted by the Superintendence of Reggio Calabria. The study is part of a larger project that will develop through future campaigns of archaeogeophysical acquisitions and archaeological excavation. In fact, only targeted excavation activities and the support of geophysical surveys (especially in the agricultural area) will be able to collect new data, circumscribe the period of construction of the structures, and shed more light on the nature and functions of the settlement.
Author Contributions
Conceptualization, D.F., A.A., N.M. and A.M.G.; methodology, N.A., D.R., V.V., F.G., D.F., A.A., N.M.; formal analysis, N.A., D.R., V.V., F.G., D.F., A.A., N.M., A.M.G.; investigation, (aerial survey) N.A., V.V., F.G., N.M., (terrestrial survey) D.F., D.R., A.A.; data curation, (aerial survey) N.A., V.V., A.M.A. (terrestrial survey) D.R. and A.A.; data interpretation: N.A., V.V., D.F.; writing—original draft preparation, N.A., D.F., D.R., A.A., F.G. and A.G; writing—review and editing, N.A., D.R., V.V., F.G., D.F., A.A., N.M., A.M.A. and A.M.G.; project administration, D.F., A.A., N.M. All authors have read and agreed to the published version of the manuscript.
Funding
This research was funded by FOE E-RIHS IT and PON Ricerca e Innovazione 2014–2020, CCI: 2014IT16M2OP005.
Data Availability Statement
The data presented in this study are available on request from the corresponding author. The data are not publicly available due to the sensitivity of the data.
Acknowledgments
The support of MUR (FOE E-RIHS IT and PON Ricerca e Innovazione 2014–2020, CCI: 2014IT16M2OP005) is acknowledged. The authors would like to thank the Aspromonte National Park, the Gruppo Archeologico di Altano, and the Municipality of San Giorgio Morgeto (RC).
Conflicts of Interest
The authors declare no conflict of interest.
References
- Agapiou, A. Remote Sensing Heritage in a Petabyte-Scale: Satellite Data and Heritage Earth Engine© Applications. Int. J. Digit. Earth 2017, 10, 85–102. [Google Scholar] [CrossRef] [Green Version]
- Agapiou, A.; Lysandrou, V. Remote Sensing Archaeology: Tracking and Mapping Evolution in European Scientific Literature from 1999 to 2015. J. Archaeol. Sci. Rep. 2015, 4, 192–200. [Google Scholar] [CrossRef]
- Gizzi, F.T.; Bentivenga, M.; Lasaponara, R.; Danese, M.; Potenza, M.R.; Sileo, M.; Masini, N. Natural Hazards, Human Factors, and “Ghost Towns”: A Multi-Level Approach. Geoheritage 2019, 11, 1533–1565. [Google Scholar] [CrossRef]
- Fedi, M.; Cella, F.; Florio, G.; La Manna, M.; Paoletti, V. Geomagnetometry for Archaeology. In Sensing the Past; Masini, N., Soldovieri, F., Eds.; Springer: Berlin, Heidelberg, 2017; pp. 203–230. [Google Scholar]
- Lercari, N. Terrestrial Laser Scanning in the Age of Sensing. In Digital Methods and Remote Sensing in Archaeology; Forte, M., Campana, S., Eds.; Quantitative Methods in the Humanities and Social Sciences; Springer International Publishing: Cham, Switzerland, 2016; pp. 3–33. ISBN 978-3-319-40656-5. [Google Scholar]
- Agapiou, A.; Lysandrou, V.; Hadjimitsis, D.G. Earth Observation Contribution to Cultural Heritage Disaster Risk Management: Case Study of Eastern Mediterranean Open Air Archaeological Monuments and Sites. Remote Sens. 2020, 12, 1330. [Google Scholar] [CrossRef] [Green Version]
- Masini, N.; Lasaponara, R. Sensing the Past from Space: Approaches to Site Detection. In Sensing the Past; Masini, N., Soldovieri, F., Eds.; Geotechnologies and the Environment; Springer International Publishing: Cham, Switzerland, 2017; Volume 16, pp. 23–60. ISBN 978-3-319-50516-9. [Google Scholar]
- Sensing the Past: From Artifact to Historical Site; Masini, N.; Soldovieri, F. (Eds.) Geotechnologies and the Environment; Springer International Publishing: Cham, Switzerland, 2017; Volume 16, ISBN 978-3-319-50516-9. [Google Scholar]
- Renfrew, C.; Bahn, P.G. Archaeology: Theories, Methods, and Practice, 7th ed.; Hudson: London, UK, 2016; ISBN 978-0-500-29210-5. [Google Scholar]
- Danese, M.; Masini, N.; Biscione, M.; Lasaponara, R. Predictive Modeling for Preventive Archaeology: Overview and Case Study. Cent. Eur. J. Geosci. 2014, 6, 42–55. [Google Scholar] [CrossRef]
- Abate, N.; Lasaponara, R. Preventive Archaeology Based on Open Remote Sensing Data and Tools: The Cases of Sant’Arsenio (SA) and Foggia (FG), Italy. Sustainability 2019, 11, 4145. [Google Scholar] [CrossRef] [Green Version]
- Balsi, M.; Esposito, S.; Fallavollita, P.; Melis, M.G.; Milanese, M. Preliminary Archeological Site Survey by UAV-Borne Lidar: A Case Study. Remote Sens. 2021, 13, 332. [Google Scholar] [CrossRef]
- Good Practice in Archaeological Diagnostics: Non-Invasive Survey of Complex Archaeological Sites, 1st ed.; Corsi, C.; Slapšak, B.; Vermeulen, F. (Eds.) Natural Science in Archaeology; Springer: Cham, Switzerland, 2013; ISBN 978-3-319-01784-6. [Google Scholar]
- Rowlands, A.; Sarris, A. Detection of Exposed and Subsurface Archaeological Remains Using Multi-Sensor Remote Sensing. J. Archaeol. Sci. 2007, 34, 795–803. [Google Scholar] [CrossRef]
- Campana, S.; Piro, S. Seeing the Unseen. Geophysics and Landscape Archaeology; CRC Press: Boca Raton, FL, USA, 2008; ISBN 978-0-203-88955-8. [Google Scholar]
- Doneus, M.; Briese, C.; Fera, M.; Janner, M. Archaeological Prospection of Forested Areas Using Full-Waveform Airborne Laser Scanning. J. Archaeol. Sci. 2008, 35, 882–893. [Google Scholar] [CrossRef]
- Masini, N.; Gizzi, F.; Biscione, M.; Fundone, V.; Sedile, M.; Sileo, M.; Pecci, A.; Lacovara, B.; Lasaponara, R. Medieval Archaeology Under the Canopy with LiDAR. The (Re)Discovery of a Medieval Fortified Settlement in Southern Italy. Remote Sens. 2018, 10, 1598. [Google Scholar] [CrossRef]
- Interpreting Archaeological Topography: Airborne Laser Scanning, 3D Data and Ground Observation; Opitz, R.S.; Cowley, D. (Eds.) Occasional publication of the Aerial Archaeology Research Group; Oxbow Books: Oxford, UK; Oakville, CT, Canada, 2013; ISBN 978-1-84217-516-3. [Google Scholar]
- Fernandez-Diaz, J.C.; Carter, W.E.; Shrestha, R.L.; Glennie, C.L. Now You See It… Now You Don’t: Understanding Airborne Mapping LiDAR Collection and Data Product Generation for Archaeological Research in Mesoamerica. Remote Sens. 2014, 6, 9951–10001. [Google Scholar] [CrossRef] [Green Version]
- Roiha, J.; Heinaro, E.; Holopainen, M. The Hidden Cairns—A Case Study of Drone-Based ALS as an Archaeological Site Survey Method. Remote Sens. 2021, 13, 2010. [Google Scholar] [CrossRef]
- Doneus, M.; Briese, C.; Studnicka, N. Analysis of Full-Waveform ALS Data by Simultaneously Acquired TLS Data: Towards an Advanced Dtm Generation in Wooded Areas. In ISPRS TC VII Symposium–100 Years ISPRS; IAPRS: Vienna, Austria, 2010; Volume 38, pp. 193–198. [Google Scholar]
- Holata, L.; Plzák, J.; Světlík, R.; Fonte, J. Integration of Low-Resolution ALS and Ground-Based SfM Photogrammetry Data. A Cost-Effective Approach Providing an ‘Enhanced 3D Model’ of the Hound Tor Archaeological Landscapes (Dartmoor, South-West England). Remote Sens. 2018, 10, 1357. [Google Scholar] [CrossRef] [Green Version]
- Olson, B.R.; Placchetti, R.A.; Quartermaine, J.; Killebrew, A.E. The Tel Akko Total Archaeology Project (Akko, Israel): Assessing the Suitability of Multi-Scale 3D Field Recording in Archaeology. J. Field Archaeol. 2013, 38, 244–262. [Google Scholar] [CrossRef]
- De Reu, J.; De Smedt, P.; Herremans, D.; Van Meirvenne, M.; Laloo, P.; De Clercq, W. On Introducing an Image-Based 3D Reconstruction Method in Archaeological Excavation Practice. J. Archaeol. Sci. 2014, 41, 251–262. [Google Scholar] [CrossRef]
- Larsson, L.; Trinks, I.; Söderberg, B.; Gabler, M.; Dell’unto, N.; Neubauer, W.; Ahlström, T. Interdisciplinary Archaeological Prospection, Excavation and 3D Documentation Exemplified through the Investigation of a Burial at the Iron Age Settlement Site of Uppåkra in Sweden. Archaeol. Prospect. 2015, 22, 143–156. [Google Scholar] [CrossRef]
- Koutsoudis, A.; Vidmar, B.; Ioannakis, G.; Arnaoutoglou, F.; Pavlidis, G.; Chamzas, C. Multi-Image 3D Reconstruction Data Evaluation. J. Cult. Herit. 2014, 15, 73–79. [Google Scholar] [CrossRef]
- Lambers, K.; Eisenbeiss, H.; Sauerbier, M.; Kupferschmidt, D.; Gaisecker, T.; Sotoodeh, S.; Hanusch, T. Combining Photogrammetry and Laser Scanning for the Recording and Modelling of the Late Intermediate Period Site of Pinchango Alto, Palpa, Peru. J. Archaeol. Sci. 2007, 34, 1702–1712. [Google Scholar] [CrossRef] [Green Version]
- Fryskowska, A.; Walczykowski, P.; Delis, P.; Wojtkowska, M. ALS and TLS Data Fusion in Cultural Heritage Documentation and Modeling. Int. Arch. Photogramm. Remote Sens. Spat. Inf. Sci. 2015, XL-5/W7, 147–150. [Google Scholar] [CrossRef] [Green Version]
- Barrile, V.; Bernardo, E.; Fotia, A.; Bilotta, G. Integration of Laser Scanner, Ground-Penetrating Radar, 3D Models and Mixed Reality for Artistic, Archaeological and Cultural Heritage Dissemination. Heritage 2022, 5, 1529–1550. [Google Scholar] [CrossRef]
- Rabbia, A.; Sammartano, G.; Spanò, A. Fostering Etruscan Heritage with Effective Integration of UAV, TLS and SLAM-Based Methods. In Proceedings of the 2020 IMEKO TC-4 International Conference on Metrology for Archaeology and Cultural Heritage Trento, Trento, Italy, 22–24 October 2020; pp. 322–327. [Google Scholar]
- Yastikli, N. Documentation of Cultural Heritage Using Digital Photogrammetry and Laser Scanning. J. Cult. Herit. 2007, 8, 423–427. [Google Scholar] [CrossRef]
- Martorano, F. Chiese e Castelli Medioevali in Calabria; Antiqua et nova; Rubbettino: Soveria Mannelli, Italy, 1996; ISBN 978-88-7284-500-4. [Google Scholar]
- Marafioti, G. Croniche et Antichità Di Calabria; Ad Istanza degli’Uniti: Padova, Italy, 1601. [Google Scholar]
- Iannelli, M.T.; Cuteri, F. Altanum. In I Segni DELL’UOMO Nelle Terre Alte d’Aspromonte; Picone Chiodo, A., Ed.; Edimedia Edizioni: Pescia, Italy, 2005; pp. 63–68. [Google Scholar]
- Cuteri, F.; Iannelli, M.; Rotundo, B. Da Kellerana a Borrello. Percorsi e Insediamenti a Nord Delle Saline Tra X e XII Secolo. In Proceedings of the Atti del XII (Catanzaro, 23-24 ottobre 1998) e XIII (Reggio Calabria e Seminara, 23-24 ottobre 2004) Incontro di studi bizantini, 23–24 October 2009; Edizioni Nausica. pp. 199–252. [Google Scholar]
- Lambers, K. Airborne and Spaceborne Remote Sensing and Digital Image Analysis in Archaeology. In Digital Geoarchaeology: New Techniques for Interdisciplinary Human-Environmental Research; Siart, C., Forbriger, M., Bubenzer, O., Eds.; Natural Science in Archaeology; Springer International Publishing: Cham, Switzerland, 2018; pp. 109–122. ISBN 978-3-319-25316-9. [Google Scholar]
- Luo, L.; Wang, X.; Guo, H.; Lasaponara, R.; Zong, X.; Masini, N.; Wang, G.; Shi, P.; Khatteli, H.; Chen, F.; et al. Airborne and Spaceborne Remote Sensing for Archaeological and Cultural Heritage Applications: A Review of the Century (1907–2017). Remote Sens. Environ. 2019, 232, 111280. [Google Scholar] [CrossRef]
- Opitz, R.; Herrmann, J. Recent Trends and Long-Standing Problems in Archaeological Remote Sensing. J. Comput. Appl. Archaeol. 2018, 1, 19–41. [Google Scholar] [CrossRef] [Green Version]
- Vacca, G.; Deidda, M.; Dessi, A.; Marras, M. LASER SCANNER SURVEY TO CULTURAL HERITAGE CONSERVATION AND RESTORATION. ISPRS Int. Arch. Photogramm. Remote Sens. Spat. Inf. Sci. 2012, XXXIX-B5, 589–594. [Google Scholar] [CrossRef] [Green Version]
- Suchocki, C. Comparison of Time-of-Flight and Phase-Shift TLS Intensity Data for the Diagnostics Measurements of Buildings. Materials 2020, 13, 353. [Google Scholar] [CrossRef] [PubMed] [Green Version]
- Shen, Y.; Wang, J.; Lindenbergh, R.; Hofland, B.G.; Ferreira, V. Range Image Technique for Change Analysis of Rock Slopes Using Dense Point Cloud Data. Remote Sens. 2018, 10, 1792. [Google Scholar] [CrossRef] [Green Version]
- Cabo, C.; Ordóñez, C.; Argüelles-Fraga, R. An Algorithm for Optimizing Terrestrial Laser Scanning in Tunnels. Autom. Constr. 2017, 83, 163–168. [Google Scholar] [CrossRef]
- Erdélyi, J.; Kopáčik, A.; Kyrinovič, P. Construction Control and Documentation of Facade Elements Using Terrestrial Laser Scanning. Appl. Geomat. 2018, 10, 113–121. [Google Scholar] [CrossRef]
- Lin, Q.; Huang, H.; Jingxu, W.; Huang, K.; Liu, Y. Detection of Pine Shoot Beetle (PSB) Stress on Pine Forests at Individual Tree Level Using UAV-Based Hyperspectral Imagery and Lidar. Remote Sens. 2019, 11, 2540. [Google Scholar] [CrossRef] [Green Version]
- Newnham, G.J.; Armston, J.D.; Calders, K.; Disney, M.I.; Lovell, J.L.; Schaaf, C.B.; Strahler, A.H.; Danson, F.M. Terrestrial Laser Scanning for Plot-Scale Forest Measurement. Curr. For. Rep. 2015, 1, 239–251. [Google Scholar] [CrossRef]
- Cohen, A.; Klassen, S.; Evans, D. Ethics in Archaeological Lidar. J. Comput. Appl. Archaeol. 2020, 3, 76–91. [Google Scholar] [CrossRef]
- Crutchley, S. The Light Fantastic–Using Airborne Lidar in Archaeological Survey; English Heritage: Swindon, UK, 2010; Volume 38. [Google Scholar]
- Nejad, S.; Olyaee, S.; Mohammad, S.; Al, N. Comparison of TOF, FMCW and Phase-Shift Laser Range-Finding Methods by Simulation and Measurement. Quart. J. Technol. Educ. 2006, 11, 51–58. [Google Scholar] [CrossRef]
- Yoon, H.; Song, H.; Park, K. A Phase-Shift Laser Scanner Based on a Time-Counting Method for High Linearity Performance. Rev. Sci. Instrum. 2011, 82, 075108. [Google Scholar] [CrossRef] [PubMed]
- Tan, K.; Zhang, W.; Shen, F.; Cheng, X. Investigation of TLS Intensity Data and Distance Measurement Errors from Target Specular Reflections. Remote Sens. 2018, 10, 1077. [Google Scholar] [CrossRef] [Green Version]
- Lozić, E.; Štular, B. Documentation of Archaeology-Specific Workflow for Airborne LiDAR Data Processing. Geosciences 2021, 11, 26. [Google Scholar] [CrossRef]
- Puech, C.; Durrieu, S.; Bailly, J.-S. Airborne Lidar for Natural Environments Research and Applications in FRANCE. Rev. Francaise Photogramm. Teledetec. 2012, 200, 54–68. [Google Scholar] [CrossRef]
- Vilbig, J.M.; Sagan, V.; Bodine, C. Archaeological surveying with airborne LiDAR and UAV photogrammetry: A comparative analysis at Cahokia Mounds. JAS Rep. 2020, 33, 102509. [Google Scholar] [CrossRef]
- Adamopoulos, E.; Rinaudo, F. UAS-Based Archaeological Remote Sensing: Review, Meta-Analysis and State-of-the-Art. Drones 2020, 4, 46. [Google Scholar] [CrossRef]
- Carvajal-Ramírez, F.; Navarro-Ortega, A.D.; Agüera-Vega, F.; Martínez-Carricondo, P. Unmanned Aerial Vehicle Photogrammetry and 3D Modeling Applied to Virtual Reconstruction of an Archaeological Site in the Bronce Age. ISPRS Int. Arch. Photogramm. Remote Sens. Spat. Inf. Sci. 2019, XLII-2/W15, 279–284. [Google Scholar] [CrossRef] [Green Version]
- Nex, F.; Remondino, F. UAV for 3D Mapping Applications: A Review. Appl. Geomat. 2014, 6, 1–15. [Google Scholar] [CrossRef]
- Remondino, F.; Barazzetti, L.; Nex, F.; Scaioni, M.; Sarazzi, D. UAV Photogrammetry for Mapping and 3d Modeling–Current Status and Future Perspectives. Int. Arch. Photogramm. Remote Sens. Spat. Inf. Sci. 2011, 38, C22. [Google Scholar] [CrossRef] [Green Version]
- Chiabrando, F.; D’Andria, F.; Sammartano, G.; Spanò, A. UAV Photogrammetry for Archaeological Site Survey. 3D Models at the Hierapolis in Phrygia (Turkey). Virtual Archaeol. Rev. 2018, 9, 28. [Google Scholar] [CrossRef] [Green Version]
- Pecci, A. Introduzione All’utilizzo Dei Droni in Archeologia; Arbor Sapientiae Editore: Roma, Italy, 2021. [Google Scholar]
- Remondino, F.; El-Hakim, S. Image-Based 3D Modelling: A Review: Image-Based 3D Modelling: A Review. Photogramm. Rec. 2006, 21, 269–291. [Google Scholar] [CrossRef]
- Derenyi, E.E. Photogrammetry: The Concepts; Lecture Notes; UNB-Geodesy and Geomatics Enginieering: Fredericton, NB, Canada, 1996. [Google Scholar]
- Mikhail, E.M.; Bethel, J.S.; McGlone, J.C. Introduction to Modern Photogrammetry; Wiley: New York, NY, USA; Chichester, UK, 2001; ISBN 978-0-471-30924-6. [Google Scholar]
- Štular, B.; Lozić, E.; Eichert, S. Airborne LiDAR-Derived Digital Elevation Model for Archaeology. Remote Sens. 2021, 13, 1855. [Google Scholar] [CrossRef]
- Štular, B.; Eichert, S.; Lozić, E. Airborne LiDAR Point Cloud Processing for Archaeology. Pipeline and QGIS Toolbox. Remote Sens. 2021, 13, 3225. [Google Scholar] [CrossRef]
- Marín-Buzón, C.; Pérez-Romero, A.; López-Castro, J.L.; Ben Jerbania, I.; Manzano-Agugliaro, F. Photogrammetry as a New Scientific Tool in Archaeology: Worldwide Research Trends. Sustainability 2021, 13, 5319. [Google Scholar] [CrossRef]
- Casana, J.; Wiewel, A.; Cool, A.; Hill, A.C.; Fisher, K.D.; Laugier, E.J. Archaeological Aerial Thermography in Theory and Practice. Adv. Archaeol. Pract. 2017, 5, 310–327. [Google Scholar] [CrossRef] [Green Version]
- Campana, S. Drones in Archaeology. State-of-the-Art and Future Perspectives: Drones in Archaeology. Archaeol. Prospect. 2017, 24, 275–296. [Google Scholar] [CrossRef]
- Abate, N.; Frisetti, A.; Marazzi, F.; Masini, N.; Lasaponara, R. Multitemporal–Multispectral UAS Surveys for Archaeological Research: The Case Study of San Vincenzo Al Volturno (Molise, Italy). Remote Sens. 2021, 13, 2719. [Google Scholar] [CrossRef]
- Briese, C.; Pfeifer, N. Airborne Laser Scanning and Derivation of Digital Terrain Models, Proceedings of the 5th Conference on Optical 3D Measurement Techniques. In Proceedings of the GRASS Users Conference 2002, Trento, Italy, 11–13 September 2001; pp. 80–87. [Google Scholar]
- Masini, N.; Lasaponara, R. On the Reuse of Multiscale LiDAR Data to Investigate the Resilience in the Late Medieval Time: The Case Study of Basilicata in South of Italy. J. Archaeol. Method Theory 2021, 28, 1172–1199. [Google Scholar] [CrossRef]
- Ronchi, D.; Limongiello, M.; Barba, S. Correlation among Earthwork and Cropmark Anomalies within Archaeological Landscape Investigation by Using LiDAR and Multispectral Technologies from UAV. Drones 2020, 4, 72. [Google Scholar] [CrossRef]
- Mazzacca, G.; Grilli, E.; Cirigliano, G.P.; Remondino, F.; Campana, S. SEEING AMONG FOLIAGE WITH LIDAR AND MACHINE LEARNING: TOWARDS A TRANSFERABLE ARCHAEOLOGICAL PIPELINE. Int. Arch. Photogramm. Remote Sens. Spat. Inf. Sci. 2022, XLVI-2/W1-2022, 365–372. [Google Scholar] [CrossRef]
- Khan, S.; Aragão, L.; Iriarte, J. A UAV–Lidar System to Map Amazonian Rainforest and Its Ancient Landscape Transformations. Int. J. Remote Sens. 2017, 38, 2313–2330. [Google Scholar] [CrossRef]
- Chase, A.F.; Chase, D.Z.; Weishampel, J.F.; Drake, J.B.; Shrestha, R.L.; Slatton, K.C.; Awe, J.J.; Carter, W.E. Airborne LiDAR, Archaeology, and the Ancient Maya Landscape at Caracol, Belize. J. Archaeol. Sci. 2011, 38, 387–398. [Google Scholar] [CrossRef]
- Chase, A.; Chase, D.; Chase, A. LiDAR for Archaeological Research and the Study of Historical Landscapes. In Sensing the Past; Springer: Cham, Switzerland, 2017; pp. 89–100. ISBN 978-3-319-50516-9. [Google Scholar]
- Evans, D. Airborne Laser Scanning as a Method for Exploring Long-Term Socio-Ecological Dynamics in Cambodia. J. Archaeol. Sci. 2016, 74, 164–175. [Google Scholar] [CrossRef] [Green Version]
- Danese, M.; Gioia, D.; Vitale, V.; Abate, N.; Amodio, A.M.; Lasaponara, R.; Masini, N. Pattern Recognition Approach and LiDAR for the Analysis and Mapping of Archaeological Looting: Application to an Etruscan Site. Remote Sens. 2022, 14, 1587. [Google Scholar] [CrossRef]
- Küçükdemirci, M.; Landeschi, G.; Ohlsson, M.; Dell’Unto, N. Investigating Ancient Agricultural Field Systems in Sweden from Airborne LIDAR Data by Using Convolutional Neural Network. Archaeol. Prospect. 2022, arp.1886. [Google Scholar] [CrossRef]
- Guyot, A.; Lennon, M.; Lorho, T.; Hubert-Moy, L. Combined Detection and Segmentation of Archeological Structures from LiDAR Data Using a Deep Learning Approach. J. Comput. Appl. Archaeol. 2021, 4, 1. [Google Scholar] [CrossRef]
- Masini, N.; Abate, N.; Gizzi, F.T.; Vitale, V.; Minervino Amodio, A.; Sileo, M.; Biscione, M.; Lasaponara, R.; Bentivenga, M.; Cavalcante, F. UAV LiDAR Based Approach for the Detection and Interpretation of Archaeological Micro Topography under Canopy—The Rediscovery of Perticara (Basilicata, Italy). Remote Sens. 2022, 14, 6074. [Google Scholar] [CrossRef]
- Guth, P.L.; Van Niekerk, A.; Grohmann, C.H.; Muller, J.-P.; Hawker, L.; Florinsky, I.V.; Gesch, D.; Reuter, H.I.; Herrera-Cruz, V.; Riazanoff, S.; et al. Digital Elevation Models: Terminology and Definitions. Remote Sens. 2021, 13, 3581. [Google Scholar] [CrossRef]
- Tarquini, S.; Nannipieri, L. The 10m-Resolution TINITALY DEM as a Trans-Disciplinary Basis for the Analysis of the Italian Territory: Current Trends and New Perspectives. Geomorphology 2017, 281, 108–115. [Google Scholar] [CrossRef]
- Tarquini, I.; Isola, M.; Favalli, F.; Mazzarini, M.; Bisson, M.T.; Pareschi, E. Boschi TINITALY/01: A New Triangular Irregular Network of Italy. Ann. Geophys. 2009, 50, 407–425. [Google Scholar] [CrossRef]
- Tarquini, S.; Isola, I.; Favalli, M.; Battistini, A. TINITALY, a Digital Elevation Model of Italy with a 10 Meters Cell Size; Istituto Nazionale di Geofisica e Vulcanologia (INGV): Rome, Italy, 2007; Available online: https://doi.org/10.13127/tinitaly/1.0 (accessed on 10 October 2021).
- Tarquini, S.; Vinci, S.; Favalli, M.; Doumaz, F.; Fornaciai, A.; Nannipieri, L. Release of a 10-m-Resolution DEM for the Italian Territory: Comparison with Global-Coverage DEMs and Anaglyph-Mode Exploration via the Web. Comput. Geosci. 2012, 38, 168–170. [Google Scholar] [CrossRef] [Green Version]
- Štular, B.; Lozić, E. Comparison of Filters for Archaeology-Specific Ground Extraction from Airborne LiDAR Point Clouds. Remote Sens. 2020, 12, 3025. [Google Scholar] [CrossRef]
- Global Mapper LiDAR Parameters. Available online: https://www.bluemarblegeo.com/knowledgebase/global-mapper-21-1/Lidar_Module/ground_classification.htm (accessed on 30 December 2022).
- Chapter 2-Geometric Processing and Positioning Techniques. In Advanced Remote Sensing (Second Edition); Liang, S.; Wang, J. (Eds.) Academic Press: Cambridge, MA, USA, 2020; pp. 59–105. ISBN 978-0-12-815826-5. [Google Scholar]
- Böhner, J.; Bechtel, B. 2.10-GIS in Climatology and Meteorology. In Comprehensive Geographic Information Systems; Huang, B., Ed.; Elsevier: Oxford, UK, 2018; pp. 196–235. ISBN 978-0-12-804793-4. [Google Scholar]
- Lee, J.-S. Digital Image Enhancement and Noise Filtering by Use of Local Statistics. IEEE Trans. Pattern Anal. Mach. Intell. 1980, PAMI-2, 165–168. [Google Scholar] [CrossRef] [Green Version]
- Kokalj, Ž.; Zakšek, K.; Oštir, K.; Pehani, P.; Čotar, K.; Somrak, M. Relief Visualization Toolbox, Ver. 2.0 Manual. Remote Sens. 2019, 3, 398–415. [Google Scholar] [CrossRef]
- Zakšek, K.; Oštir, K.; Kokalj, Ž. Sky-View Factor as a Relief Visualization Technique. Remote Sens. 2011, 3, 398–415. [Google Scholar] [CrossRef] [Green Version]
- Doneus, M. Openness as Visualization Technique for Interpretative Mapping of Airborne Lidar Derived Digital Terrain Models. Remote Sens. 2013, 5, 6427–6442. [Google Scholar] [CrossRef] [Green Version]
- Hesse, R. LiDAR-Derived Local Relief Models-a New Tool for Archaeological Prospection. Archaeol. Prospect. 2010, 17, 67–72. [Google Scholar] [CrossRef]
- Kokalj, Ž.; Hesse, R. Airborne Laser Scanning Raster Data Visualization. Založba ZRC: Ljubljana, Slovenia, 2017; Volume 14, ISBN 978-961-254-984-8. [Google Scholar]
- Ferdani, D.; Demetrescu, E.; Bottazzi, G.; Bigi, P. Il contributo dell’archeologia digitale allo studio e all’interpretazione dell’edilizia storica. Il caso di San Marino. Archeol. E Calc. 2022, 33, 181–200. [Google Scholar] [CrossRef]
- Ferdani, D.; Demetrescu, E.; D’Annibale, E.; Bottazzi, G.; Bigi, P. Le Fortificazioni Del Titano: Un Progetto Di Indagine Multidisciplinare per La Conoscenza e La Tutela Dell’edilizia Medievale Sammarinese. Archeol. Dellarchitettura 2019, XXIV, 195–215. [Google Scholar] [CrossRef]
- Adami, A.; Cerato, I.; d’Annibale, E.; Demetrescu, E.; Ferdani, D. Different Photogrammetric Approaches to 3D Survey of the Mausoleum of Romulus in Rome. Graph. Cult. Herit. 2014. [Google Scholar]
- Julin, A.; Jaalama, K.; Virtanen, J.-P.; Maksimainen, M.; Kurkela, M.; Hyyppä, J.; Hyyppä, H. Automated Multi-Sensor 3D Reconstruction for the Web. ISPRS Int. J. Geo-Inf. 2019, 8, 221. [Google Scholar] [CrossRef] [Green Version]
- Luhmann, T.; Chizhova, M.; Gorkovchuk, D.; Hastedt, H.; Chachava, N.; Lekveishvili, N. Combination of Terrestrial Laserscanning, Uav and Close-Range Photogrammetry for 3D Reconstruction of Complex Churches in Georgia. Int. Arch. Photogramm. Remote Sens. Spat. Inf. Sci. 2019, XLII-2/W11, 753–761. [Google Scholar] [CrossRef] [Green Version]
- Banaszek, Ł. LiDARchaeology. Airborne Laser Scanning of the Forested Landscapes around Polanów (Pomerania, Poland). In Aerial Archaeology and Remote Sensing from the Baltic to the Adriatic; Eotvos Lorand University: Budapest, Hungary, 2013; pp. 31–36. [Google Scholar]
- Bewley, R.H.; Crutchley, S.P.; Shell, C.A. New Light on an Ancient Landscape: Lidar Survey in the Stonehenge World Heritage Site. Antiquity 2005, 79, 636–647. [Google Scholar] [CrossRef]
Figure 1.
Flowchart of research on the Altanum site.
Figure 1.
Flowchart of research on the Altanum site.
Figure 2.
(a) Site’s location; (b) Sant’Eusebio hill oblique.
Figure 2.
(a) Site’s location; (b) Sant’Eusebio hill oblique.
Figure 3.
Altanum eidotype dating from 1921 (most of the drawn structures are no longer visible).
Figure 3.
Altanum eidotype dating from 1921 (most of the drawn structures are no longer visible).
Figure 4.
Left to right: (a) Matrice 210 assembling and set-up; (b) UGCS software flight planning; (c) flight operations with Matrice 600 equipped with Riegl miniVux-3 LiDAR sensor.
Figure 4.
Left to right: (a) Matrice 210 assembling and set-up; (b) UGCS software flight planning; (c) flight operations with Matrice 600 equipped with Riegl miniVux-3 LiDAR sensor.
Figure 5.
(a) LiDAR data acquisition grid (16 flights in 8 areas); (b) corrected GPS flights data; (c) point density map for the whole produced point cloud (unclassified); (d) point density map for the classified point cloud (ground class); (e) axonometric view of DSM obtained from LiDAR survey; (f) DFM obtained as a result of vegetation filtering operations.
Figure 6.
Mounds with rectilinear trend and related cropmarks anomalies, revealing the presence of buried archaeological structures.
Figure 6.
Mounds with rectilinear trend and related cropmarks anomalies, revealing the presence of buried archaeological structures.
Figure 7.
Left: remains of the so called “bombard tower”; right: visible stretch of settlement’s defensive wall.
Figure 7.
Left: remains of the so called “bombard tower”; right: visible stretch of settlement’s defensive wall.
Figure 8.
From left to right: topographic survey of GCPs using a differential GNSS; measurement of photogrammetric targets placed on archaeological structures with total station; 3D survey of a cistern with the laser scanner.
Figure 8.
From left to right: topographic survey of GCPs using a differential GNSS; measurement of photogrammetric targets placed on archaeological structures with total station; 3D survey of a cistern with the laser scanner.
Figure 9.
(a) Point cloud in X-ray visualization; (b) point cloud in elevation visualization; (c) Mesh model.
Figure 9.
(a) Point cloud in X-ray visualization; (b) point cloud in elevation visualization; (c) Mesh model.
Figure 10.
Example of data obtained from operations to improve yield and visibility: (a) RGB drone orthophoto, (b) Digital Feature Model (DFM), (c) Multi Hill Shading, (d) Simple Local Relief Model (SLRM), (e) Sky-view-factor (SVF), (f) Openness Negative (ON) (Reference system WGS 84—UTM33N).
Figure 10.
Example of data obtained from operations to improve yield and visibility: (a) RGB drone orthophoto, (b) Digital Feature Model (DFM), (c) Multi Hill Shading, (d) Simple Local Relief Model (SLRM), (e) Sky-view-factor (SVF), (f) Openness Negative (ON) (Reference system WGS 84—UTM33N).
Figure 11.
Archaeological cartography integrating feature and earthwork anomalies.
Figure 11.
Archaeological cartography integrating feature and earthwork anomalies.
Figure 12.
(a–e) 3D model of the building interpreted as a church resulting from TLS and photogrammetric data integration: (a) real building, (b) point cloud, (c) mesh model, (d,e) 3D textured model; (f) dense point cloud of the bombard tower obtained after processing; right: blueprint of the tower obtained by cross-sectioning the point cloud.
Figure 13.
(1) Ortophoto RGB. The circles indicate the position of wall portions (A) and (B2); (2) SLRM filter applied on DFM shows rectilinear anomalies and a circular feature in the area where B2 was found; (3) archaeological cartography reporting walls’ path as deducted by anomalies; (4) rectilinear walls and circular tower (B2) in this area are roughly represented in the drawing of De Cristo.
Figure 14.
Archaeological cartography reporting position of archaeological evidence of major significance. Interpreted anomalies: (A) gateway; (B) towers; (C) buildings; (D) defensive wall or ravelin; (E) cliff; (F,G) visible ruins of the defensive wall.
Figure 14.
Archaeological cartography reporting position of archaeological evidence of major significance. Interpreted anomalies: (A) gateway; (B) towers; (C) buildings; (D) defensive wall or ravelin; (E) cliff; (F,G) visible ruins of the defensive wall.
Table 1.
Derivatives based on visualization techniques (RVT software) [
91].
Table 1.
Derivatives based on visualization techniques (RVT software) [
91].
| Visualization Method | Parameters |
|---|
| Analytical Hill Shading | Sun azimuth (deg): 315; Sun elevation angle (deg): 35 |
| Hill Shading from Multiple Directions | Number of directions: 16; Sun elevation angle (deg): 35 |
| PCA of Hill Shading | Number of components to save: 3 |
| Slope Gradient | No parameters required |
| Simple Local Relief Model | Radius for trend assessment (pixel): 20 |
| Sky-View Factor | Number of search directions: 16; search radius (pixel): 20 |
| Openness Positive | Number of search directions: 16; search radius (pixel): 20 |
| Openness Negative | Number of search directions: 16; search radius (pixel): 20 |
| Archaeological (VAT) | Used preset: general |
Table 2.
Survey sampling metrics. The table gives account for both acquired data and deriving models in Reality Capture software. For TLS acquisitions: Scan Pos. and #points. For meshes deriving from the process: #polygons. For 2D deliverables: GSD.
Table 2.
Survey sampling metrics. The table gives account for both acquired data and deriving models in Reality Capture software. For TLS acquisitions: Scan Pos. and #points. For meshes deriving from the process: #polygons. For 2D deliverables: GSD.
| Feature Anomalies | Scan Pos. | #Points | #Polygons | GSD |
|---|
| Tower | 18 | 389 × 106 | 28.6 × 10⁶ | 1 mm/px |
| Defensive wall | 9 | 118 × 106 | 14.3 × 10⁶ | 1 mm/px |
| Cisterns | 5 | 178 × 106 | 16.4 × 10⁶ | 1 mm/px |
| Church | 8 | 111 × 106 | 30.7 × 10⁶ | 1 mm/px |
| Disclaimer/Publisher’s Note: The statements, opinions and data contained in all publications are solely those of the individual author(s) and contributor(s) and not of MDPI and/or the editor(s). MDPI and/or the editor(s) disclaim responsibility for any injury to people or property resulting from any ideas, methods, instructions or products referred to in the content. |
© 2023 by the authors. Licensee MDPI, Basel, Switzerland. This article is an open access article distributed under the terms and conditions of the Creative Commons Attribution (CC BY) license (https://creativecommons.org/licenses/by/4.0/).


 ,
, 


