Article

Low Cost and Easy to Implement Physical and Hydrological Soil Assessment of Shade-Grown Coffee in Santa Rosa, Guatemala

by
Marcelo Daniel Gerlach
1,*,
Sergio Esteban Lozano-Baez
2,
Mirko Castellini
3,
Nery Guzman
4,
Wilmer Andrés Gomez
2 and
Bayron Medina
5
1
Crisis Simulation for Peace (CRISP), 12099 Berlin, Germany
2
PUR Projet, Popayán 190003, Colombia
3
Council for Agricultural Research and Economics—Research Center for Agriculture and Environment (CREA-AA), Via C. Ulpiani 5, 70125 Bari, Italy
4
Centro Universitario Santa Rosa, Universidad San Carlos de Guatemala, Nueva Santa Rosa 06014, Guatemala
5
Independent Researcher, Zona 14, Ciudad de Guatemala 01014, Guatemala
*
Author to whom correspondence should be addressed.
Land 2023, 12(2), 390; https://doi.org/10.3390/land12020390
Submission received: 29 November 2022 / Revised: 7 January 2023 / Accepted: 21 January 2023 / Published: 31 January 2023
(This article belongs to the Section Soil-Sediment-Water Systems)

Abstract

:
Coffee agroecosystems are considered to have the potential to impact soil hydrological functions positively, such as water infiltration and soil moisture retention; however, it is not clear how hydrodynamic soil properties regenerate after land-use change and what easy to implement and low-cost indicators there are. Common methodologies to assess soil hydraulic properties are time consuming and expensive. Therefore, the development of easy, robust, and inexpensive methodologies is one of the main steps in achieving a comprehensive understanding of the effects of land-use change on soil hydraulic and physical characteristics in time and space. In order to assess soil properties, we investigated the saturated hydraulic conductivity (Ks), and two micro-climatic indicators: soil volumetric water content (VWC) and temperature above (TAL) and below soil cover (TBL) in four land-use types: a thirty-year-old shade-grown coffee (CN); a seven-year-old shade-grown coffee (CP); a one-year-old shade-grown coffee (CC) as well as a non-commercial pasture (PR), in the municipality of Nueva Santa Rosa, Santa Rosa department, Guatemala. Additionally, we conducted a visual soil assessment (VSA) elaborated on by the Catholic Relief Services for coffee soils in Central America. We used the steady version of the simplified method based on a Beerkan Infiltration run (SSBI method) to obtain Ks values after determining historical land use. The SSBI methodology is thought to be a suitable compromise between measurement reliability, applicability, simplicity, and the necessity for repeated sampling in space and time. We also counted the number of shade trees, the canopy cover, vegetation height, soil cover, diameter at breast height, and total number of shade trees. Our findings contend that CN had the highest Ks values, indicating that shade trees have a positive impact on soil hydrological properties in shade-grown coffee agroecosystems. Additionally, CP had the highest VWC content and the greatest effect of leaf litter on soil temperature, indicating a positive impact of leaf litter on microclimatic conditions and soil moisture after seven years of agroforestry coffee plantation. The visual soil assessment suggested that CN had the highest score followed by CP, corroborating the results for Ks and VWC. The selected methodologies proved to be low cost and easy to implement. To counter shortcomings of these methodologies, we recommend monitoring infiltration in tropical land-use systems at regular intervals to better understand the temporal variability of infiltration recovery and ensure robust data in time and space.

1. Introduction

Arabica coffee (Coffea arabica) accounts for ~70% of coffee production worldwide, growing mainly in shaded and non-shaded systems in many tropical regions. Traditional shaded agroforestry plantations are highly valued due to their ecological, environmental, economic, and social benefits [1,2,3]. The implementation of agroforestry systems, i.e., land-use systems where trees and crops are purposefully planted on the same piece of land, have been extensively proposed as a means of reducing soil erosion risks, improving soil’s hydraulic characteristics, soil hydrological and physical properties, and enhancing overall systems resilience [1,4,5,6]. Due to global climate change (long dry seasons, change in mean temperatures, low minimum temperature, and annual precipitation), coffee production has been affected negatively in all main producing regions [7]. Responsively, new shade-grown coffee agroecosystems have been emerging in human-impacted landscapes as a consequence of land-use change because of economic, ecological, and social reasons. These new agroforestry systems contribute to enhanced hydrological ecosystem services by improving soil infiltration, thereby contributing to the resilience of agricultural systems [5].
Soil hydraulic properties, including infiltration and hydraulic conductivity, are highly sensitive to land-use change, in terms of magnitude and variability. Thus, these properties are key elements to assess the function provided by new coffee agroecosystems and the strategies for climate change adaption [8]. In this study, we selected the soil saturated hydraulic conductivity (Ks) as a main indicator to describe soil physical and hydraulic properties. The spatial elements that influence Ks values include soil moisture and temperature, root and fauna-created channels, fissures between soil aggregates, and vegetation that can establish species-specific litter quality control [8]. Soil physical and hydraulic quality indicators are linked to the soil´s ability to hold and transmit water and air [9]. Ks controls hydrologic processes such as rainfall infiltration and surface runoff and is sensible to soil disturbance, thus it has been frequently used as a land-use change indicator to describe the alteration of infiltration and soil hydrological influence [10,11,12,13]. Furthermore, the variable Ks has been used to study the impact of coffee and cocoa agroforestry systems on soil hydrological functions, showing a positive effect of trees on soil hydrological functioning in agroforestry systems [5,11].
Soil hydraulic properties vary greatly in space and time. A large number of measurements are required to assess the magnitude of the variation within the chosen area [13]. Traditional methods for determining soil hydrological processes are costly and time consuming [14]. Evaluating the impact of soil usage on the environment may necessitate extensive and time-consuming experimental efforts. Thus, the ability to estimate soil’s physical and hydraulic properties in a simple, inexpensive, and accurate manner is appealing for agronomic assessments [15]. The steady version of the simplified method based on a Beerkan Infiltration run (SSBI method) proposed by Bagarello et al. [16], which presents a low-cost and easy to implement alternative. The SSBI method makes use of the cumulative infiltration curve but does not require additional field and laboratory measurements to estimate Ks, such as initial and final soil water content, particle size distribution, or bulk density [17]. Previous investigations on the same area suggest that the SSBI methodology is considered as a compromise between measurement reliability, applicative simplicity, and need for repeated sampling in space and time [15,18]. Furthermore, the SSBI method has been used as a robust methodology in previous studies to avoid uncertainties due to a specific shape of the cumulative infiltration [19,20] and has been recommended to be used instead of the BEST-steady method to avoid analysis failure in the case of soil hydrophobicity in tropical forests [21]. Many studies have tested and used the SSBI method to determine the hydraulic properties of different tropical land-use systems [21,22,23].
Other studies have shown that there is a strong relationship between shadow cover, soil moisture, soil temperature, and soil evaporation rates [1,3,24]. Therefore, we included a one-time measurement of volumetric water content (VWC) with a time-domain reflectometry sensor to assess soil moisture in a specific moment in time under the same conditions in every study site. Additionally, we measured the surface temperature above organic matter (TAL) and below it (TBL) to assess the influence of leaf litter and grass on soil temperature. These methodologies were chosen because they require little equipment, are low cost, and can be easily replicated across a large area.
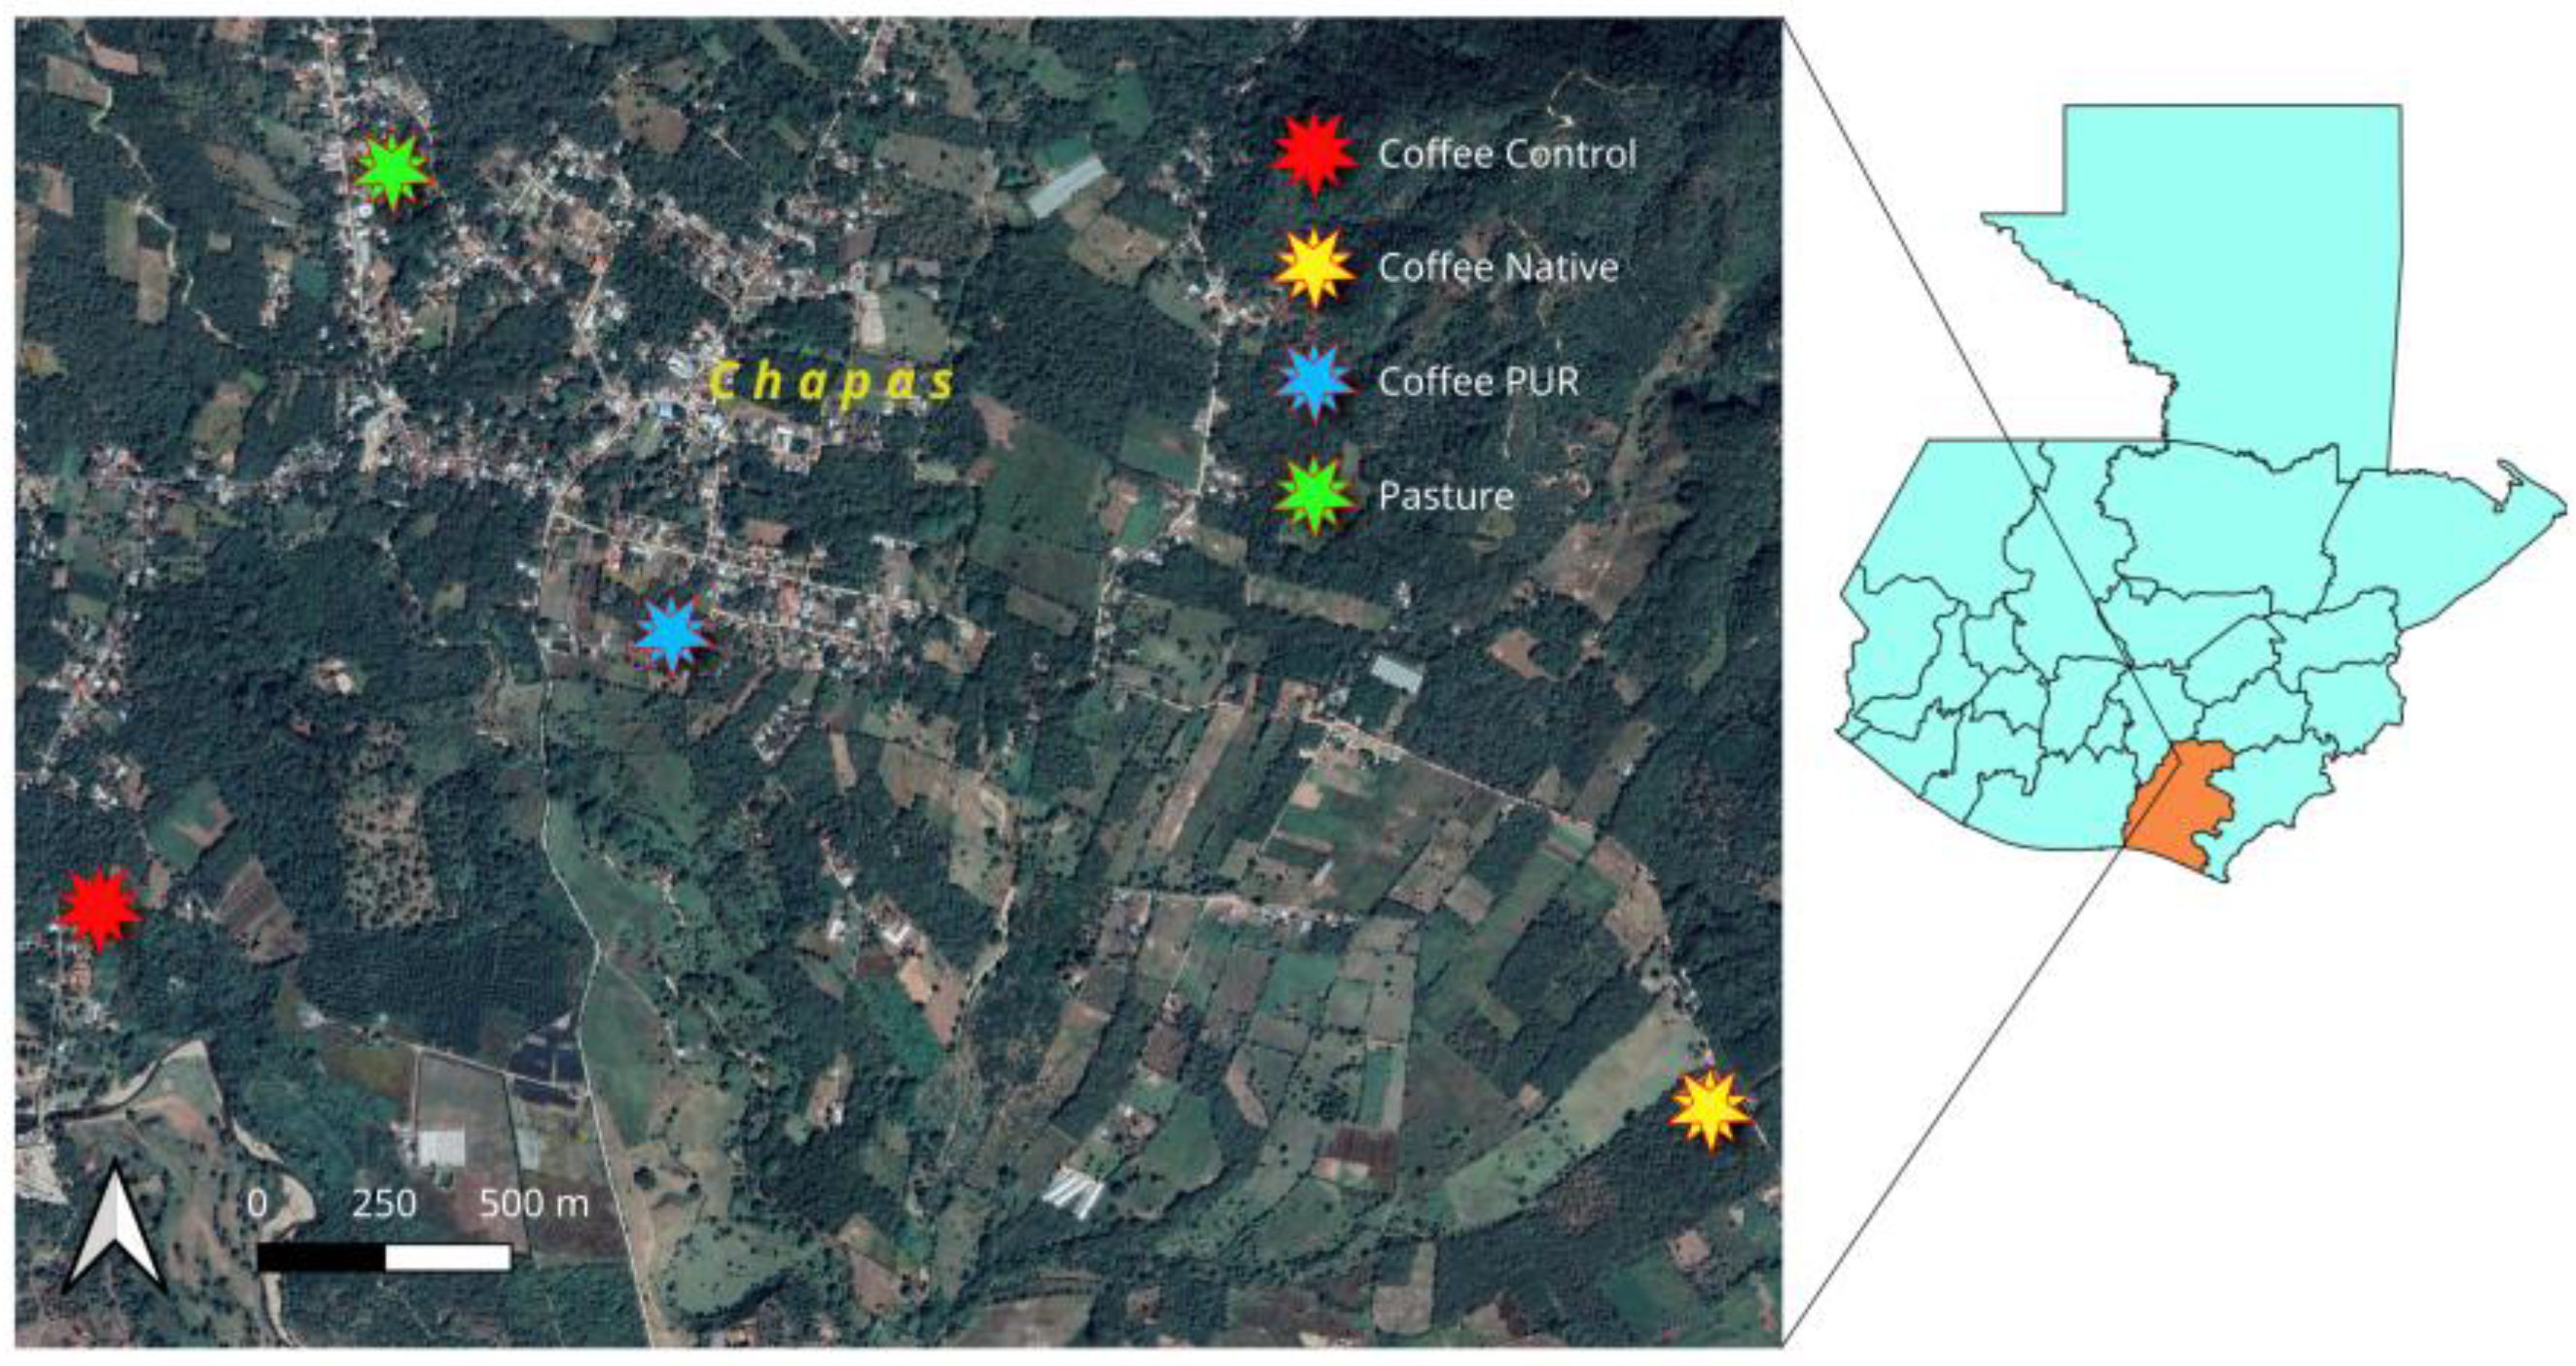
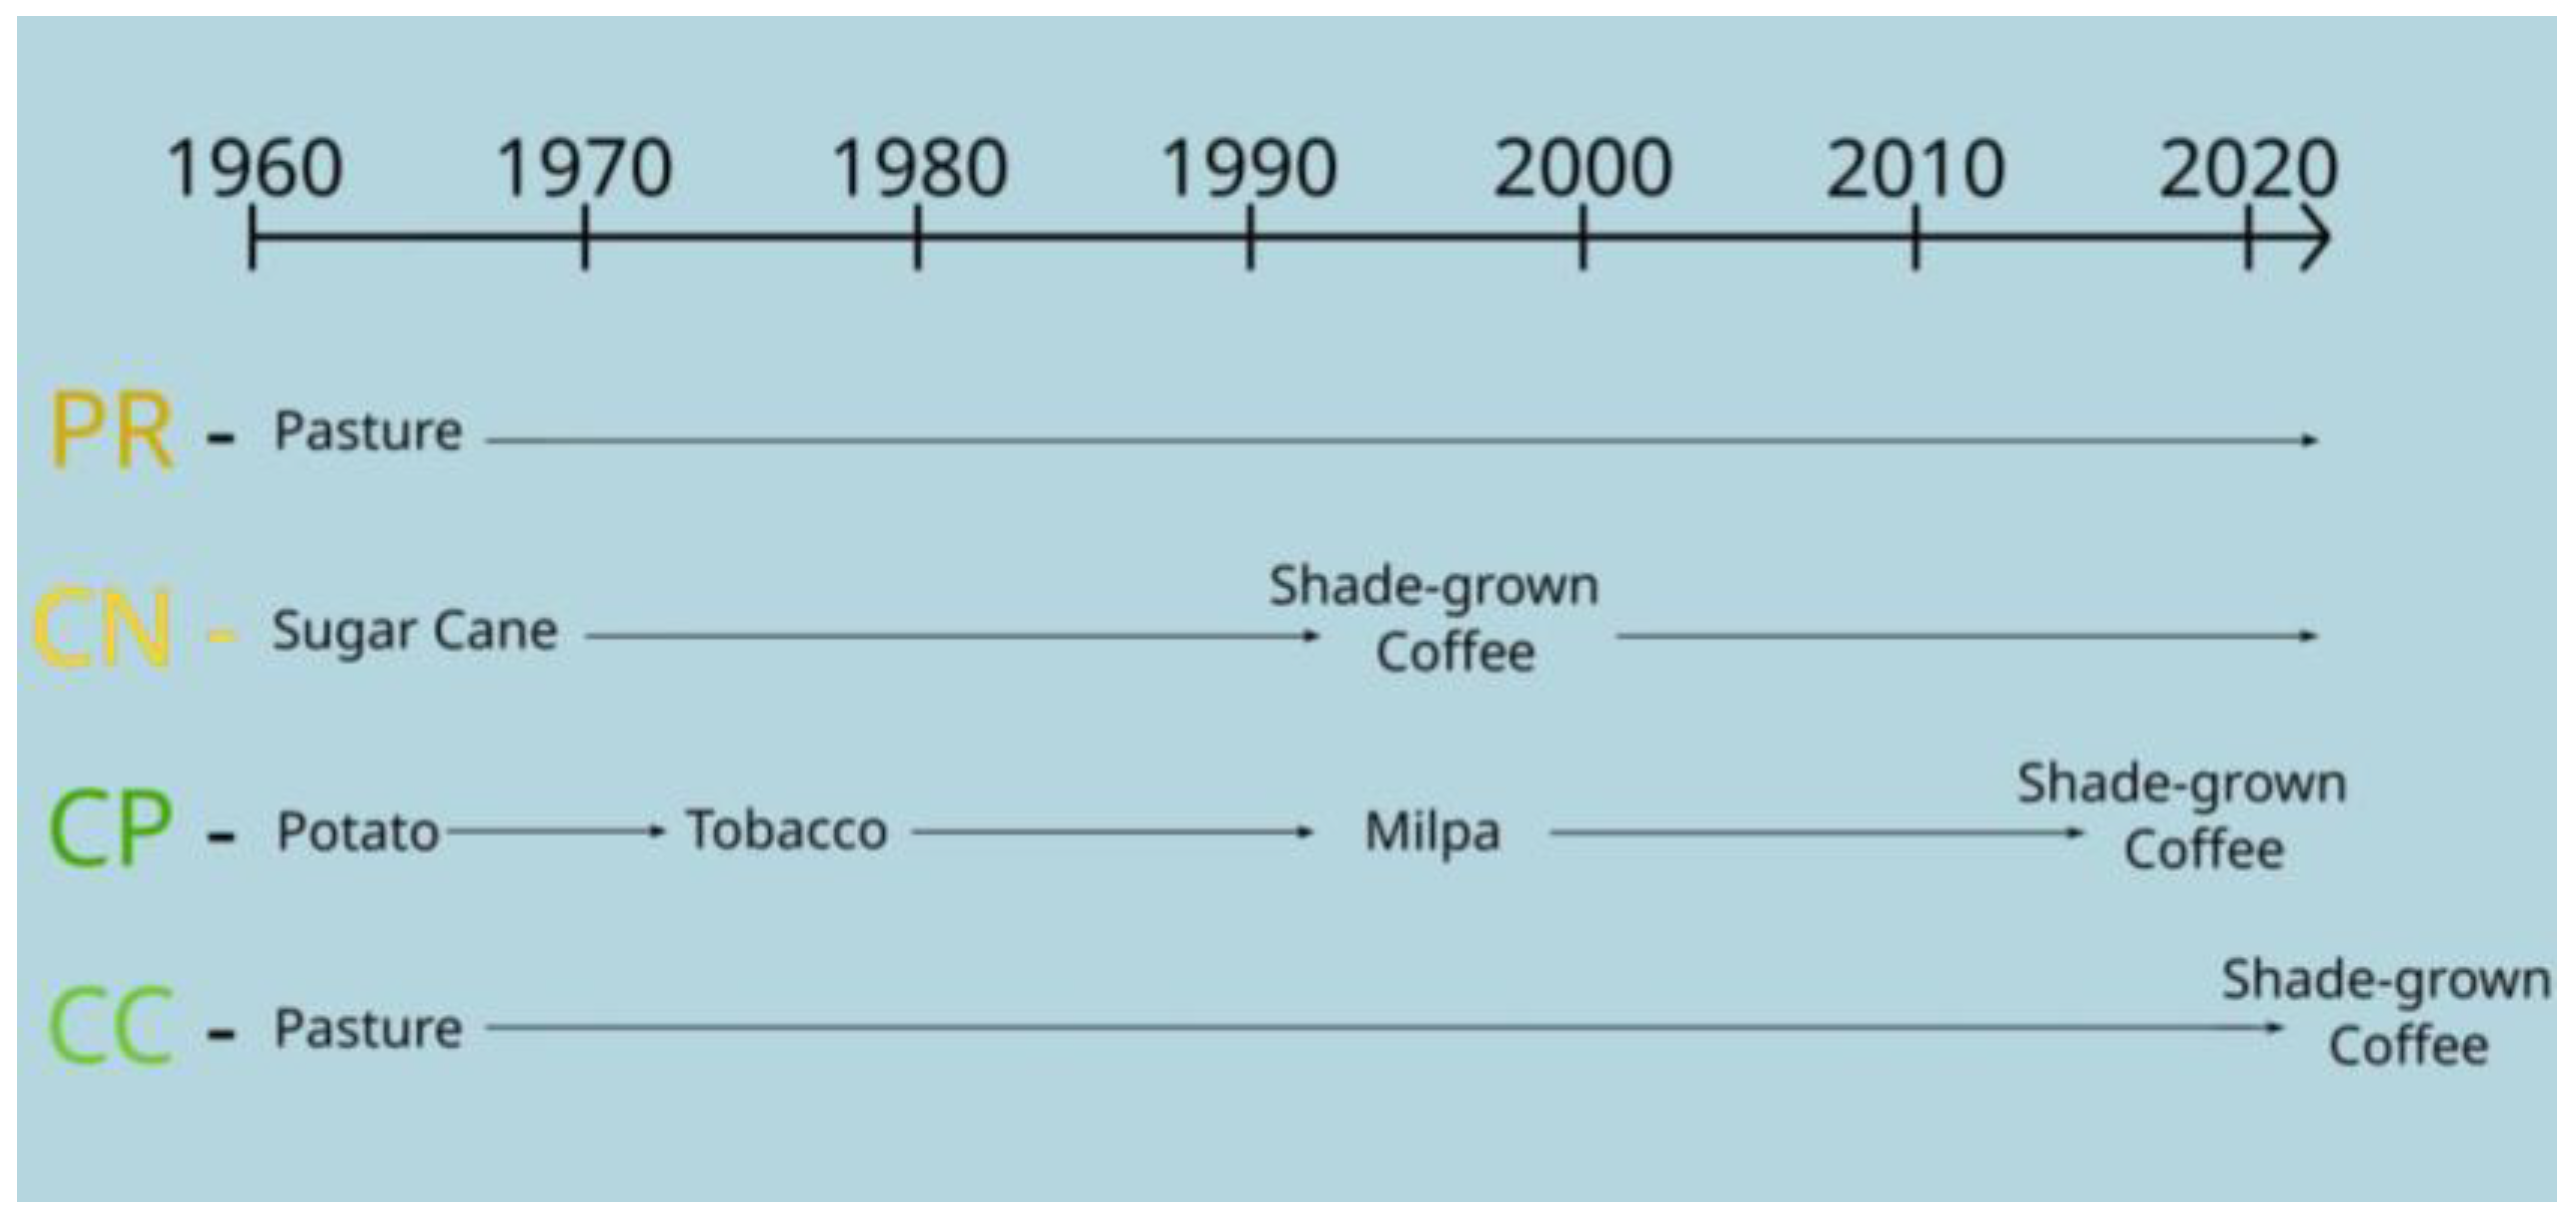
The present study aims to investigate the effect of agroforestry systems on soil physical and hydraulic properties in rainfed coffee farms of varying shade cover and age of the agroforestry system using low-cost and easy to implement methodologies. Important factors are the time needed to perform the measurements, the cost of materials, the cost of laboratory analysis, transport, and labor. Several studies regarding physical and hydraulic properties of soil have been carried out in Santa Rosa, Guatemala. Due to the absence of data about soil conditions of the coffee agroforestry system prior to the coffee plantation, we selected four land-use systems to replicate the influence of land-use systems over time in the region. A non-commercial pasture was included in the investigation to compare soil attributes to a non-agroforestry system within the same study area, resulting in a total of four land-use types: (i) a thirty-year-old shade-grown coffee (CN); (ii) a seven-year-old shade-grown coffee (CP); (iii) a one-year-old shade-grown coffee (CC); and a non-commercial pasture (PR). At each study site, we measured and compared Ks, TAL, TBL, and VWC. All four sites are located within the municipality of Nueva Santa Rosa, Santa Rosa department, Guatemala. So far, no studies have investigated the Ks values at different stages of coffee agroecosystems in time in this region. Following the findings that shaded agroforestry systems incorporating trees and cover crops improve soil physical, biochemical and biological components [25,26], and that forest regrowth promotes higher Ks increasing progressively over time [5,22,27], and that the amount of shaded cover is directly related to the variability of soil moisture for the crop of interest and it is capable of reducing overall evaporative demand from soil evaporation [1,24], we hypothesized that mean Ks and mean VWC values would vary with the amount of canopy cover and age of the agroforestry trees in the system (CN > CP > CC = PR). Following the findings that shaded agroforestry systems improve microclimate conditions and soil temperature is lower under shaded conditions [1,24,28], we hypothesized that TAL would vary with canopy cover (CC > PR > CP > CN): if the canopy cover is higher, less solar radiation will fall over the soil and temperature will be lower than that observed in land-use systems with lower canopy cover. Because the CC site is only one year old, no difference in plantation age was made between CC and PR. The PR site has higher soil cover, supporting the hypothesis that TAL would be lower than in CC.
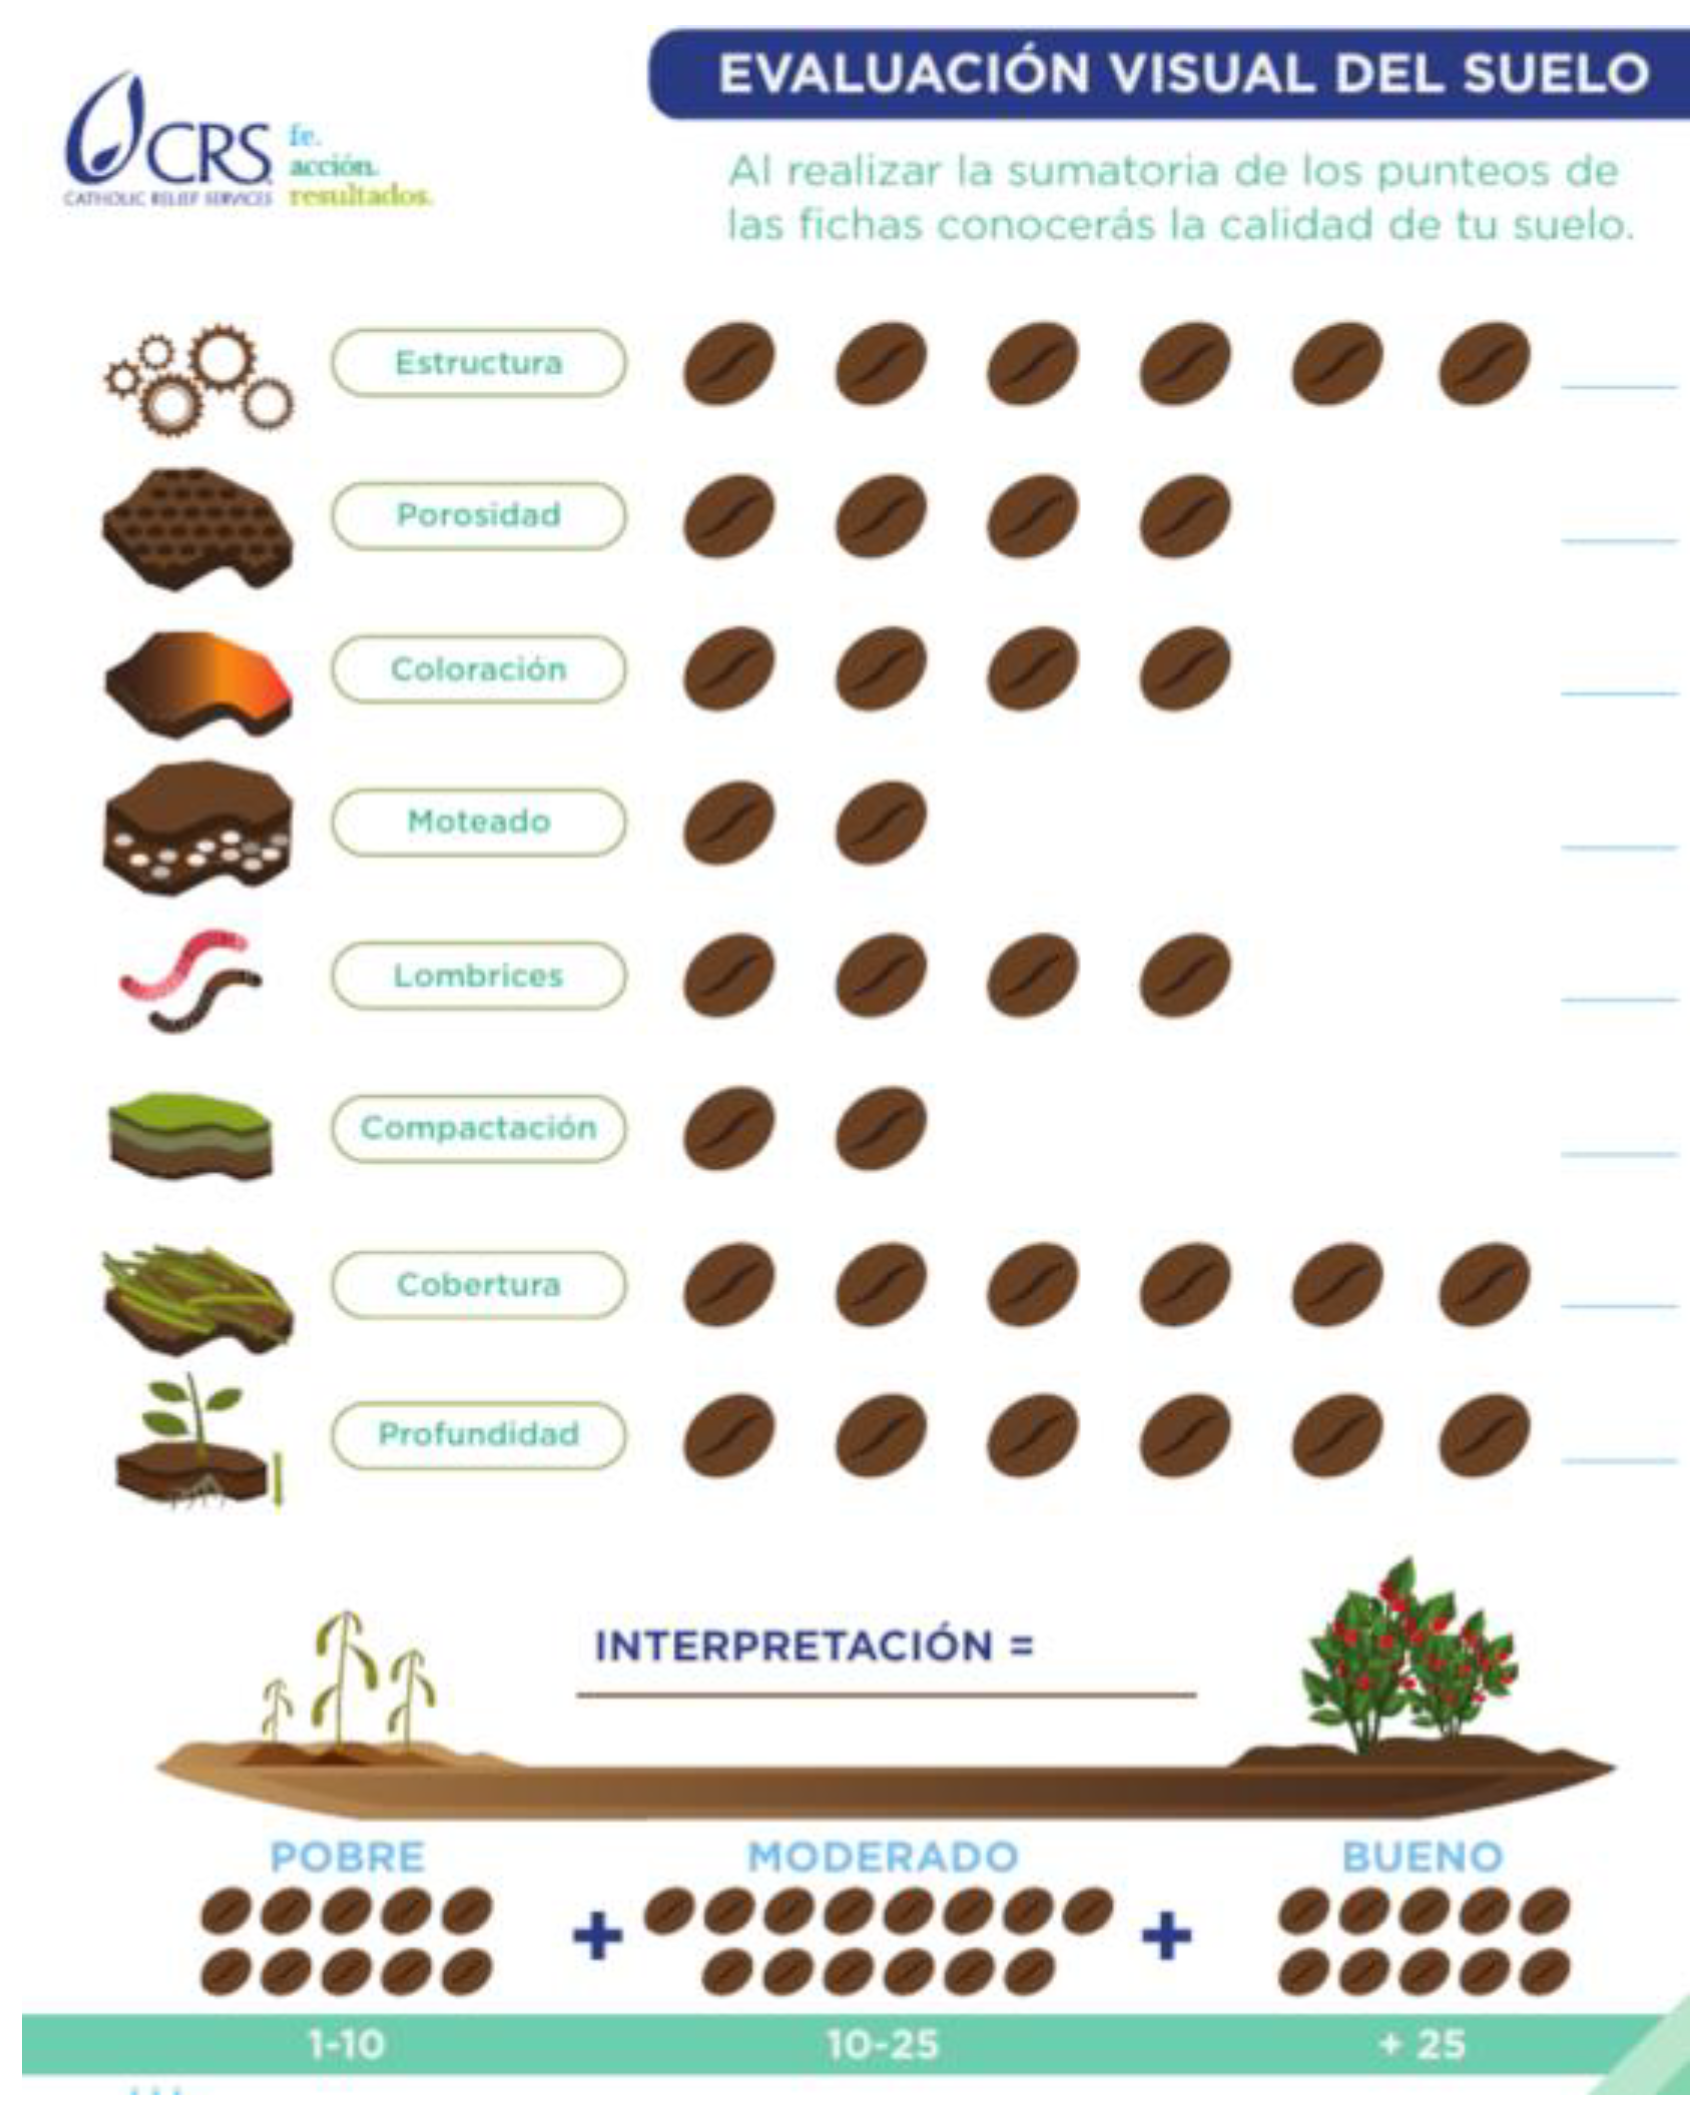
Finally, to develop low-cost, easy to implement, and practical soil assessment tools for farmers, we used a soil visual evaluation tool developed by the Catholic Relief Service for coffee soils in Central America [29]. We hypothesized that the scores for the soil visual assessment would vary with the age of the agroforestry system (CN > CP > CC = PR). Starting from the findings that coffee agroforestry systems can increase overall soil physical, biochemical, and biological components compared to non-shaded systems [5,26,30], and that conventional coffee management can lead to higher soil erosion, decreasing overall soil health [1,31], we hypothesized that the scores for the soil visual assessment would vary with the age of the agroforestry system (CN > CP > CC = PR). This assumption leads to a conclusion that coffee agroforestry systems improve the overall soil health over time.

2. Materials and Methods

2.1. Study Area

The study area is located around the town of Chapas, in the municipality of Nueva Santa Rosa (14°22′ N, 90°16′ W), Santa Rosa department, Guatemala. The climate in this region is classified as Aw according to the Köppen classification, the mean monthly precipitation is 117.38 mm, and the mean annual temperature is 23.1 °C. The wettest period lasts from May to October, while the driest is from December to March [32,33]. The study area is located in the volcanic corridor of Guatemala in the sub-basin of the Río Los Esclavos, upper section. The geology of the basin is determined by the input of material from the volcanic belt in the upper parts of the basin. The materials dumped and deposited by the volcanic activity include deposits of sands, tuffs, ashes, pumices, lahars, and pyroclastic sediments in general, which form a large and extensive plain at the foot of the volcanic mountains as a result of erosion processes, transport, and sedimentation [34]. The predominant soil types found in the study area are, according to USDA soil taxonomy, Orthens Entisols (Eo), and Psamments Entisols (Ep). The area belongs to an ecosystem classified as tropical premontane rainforest (bh-PMT), based on the classification system proposed by Holdrige and adapted to Guatemala [35].
Four study sites with different land-use types were selected within the study area (Figure 1). The sites were selected to capture variation in soil attributes. The elevation of these sites ranged between 998 m and 1033 m above sea level and no slope was greater than 10%. In each study site, two quadratic plots of 81 square meters were randomly selected with a minimum distance of 15 m from each other, resulting in eight plots in total. Within each study plot, we measured vegetation attributes, soil hydraulic, and physical properties, and conducted a visual soil assessment designed for coffee soils in Central America by the Catholic Relief Services [29]. The samplings were executed from the 4th to the 11th of March 2022, during the late dry season (Table 1). During this week, no rainfall was recorded, the sky was clear, and the mean daily temperature stayed constant. Information on the plantation year or change of land-use type was obtained directly from the farm owners. We did not find remnants of natural (primary) or secondary forest nearby with the same height and slope attributes. The parents and grandparents of the coffee farmers could not remember when the forest was cleared. This indicates that forest was cleared at least at the beginning of the 20th century. Images of the vegetation and topsoil for each study site are provided in Figure 2.
The CC site is a one-year-old shade-grown coffee (C. arabica) plantation with a low use of agrochemical. The variety of coffee planted is Marsellesa with a distance of 2 m × 1.5 m. Shade trees, such as Chrysophyllum cainito L., Musa spp., Inga fissiolyx, Cedrela odorata L. and Mangifera indica, were planted in 2020. The tree species Cedrela odorata L. seasonally shed leaves during the dry season. After more than 60 years of pasture for non-commercial cattle grazing, the land-use type was replaced by shade-grown coffee plantations. The family of the current landowner could not remember when forest was cleared. The measurements at this site represent the effect of a newly planted shade-grown coffee plantation.
Site CN is a 30-year-old shade-grown coffee (C. arabica) plantation with a low use of agrochemical. The CN site is associated with Tabebuia donnell-smithii, Cedrela odorata L., Inga Fissiolyx, Tabebuia rosea, Grevillea robusta A. Cunn., Ficus insipida, Corymbia torelliana, Inga spuria, Musa spp. and Mangifera indica tree species. The landowner of the parcel could not remember when the forest was first cleared. Since the 1950’s, sugar cane (Saccharum officinarum) was cultivated extensively. Neighboring parcels continue to cultivate sugar cane today. In the beginning of the 1990’s, sugar cane plantation was replaced by shade-grown coffee plantations. Thus, we used the CN site to represent the effect a thirty-year-old coffee agroforestry plantation has on soil.
The CP site is a seven-year-old shade-grown coffee (C. arabica) plantation with low use of agrochemical grown in association with Tabebuia donnell-smithii, Cedrela odorata L., Inga Fissiolyx and Diphysa carthagenensis tree species. The landowner and coffee producer could not remember when forest was first cleared at this site. Potato was cultivated extensively in this parcel and the neighboring land from the 1940’s. The crop use was changed to tobacco in the 1970’s as it was more economically interesting for the farmer. After 25 years of tobacco plantations, the land use changed to Guatal, a mixed land-use system interchanging yearly the traditional milpa (mixed cultivation of Zea mays, Cucurbita argyrosperma and Phaseolus vulgaris), other vegetable crops and fallow years. The land-use type changed in 2015 to shade-grown coffee plantation. This study site reflects the effect of a recent agroforestry coffee plantation.
The pasture site (PR) was initially a forest similar to the whole area, but the landowner could not remember when it was first cleared. The landowner’s father stated that his family used this land for grazing family cattle with non-commercial purpose. We used this site to represent the effect of more than 40 years of grazing in the region and compared it to the coffee agroforestry systems. A graphical summary of the land use history for the four land uses described previously is provided in Figure 3.

2.2. Vegetation Sampling

Following the investigation by Lozano-Baez et al. [5], we measured the following vegetation attributes in each 81 m2 plot: (1) canopy cover, (2) vegetation height, (3) DBH, and (4) total number of shade trees. We additionally measured (5) soil cover. These are important ecological markers that can be used to assess the structure of vegetation in tropical forest restoration conditions [23]. Following Adhikari et al. [36], we measured the percentage of canopy cover 20 times with the mobile application HabitApp (a smartphone-based android application downloaded from Google Play store developed by Greg Macdonald, based in the United Kingdom) and used the average of these measurements to determine canopy cover percentage per plot and study site. In each plot, all living shadow trees with diameter at breast height (DBH) higher than 5 cm were measured and counted. To estimate the vegetation height, we used a 3 m measuring stick, and the remaining height of trees taller than this was estimated visually. We furthermore measured the percentage of soil cover for each study site using the shoe-tip methodology proposed by Medina [37], registering 50 sampling points with the shoe-tip while zigzag walking through the study site. Sampling points registered were live and dead biomass, bare soil, and rocks.

2.3. Soil Sampling and Measurements

In each study plot site, we sampled and measured (1) 10 infiltrations based on the Beerkan infiltration run, (2) 10 times the soil volumetric water content with a time-domain reflectometry (TDR) sensor, and (3) 10 times the temperature above and below soil cover with an infrared thermometer. Additionally, in each study site, one disturbed soil sample was collected to determine the soil particle distribution, bulk density, soil water retention curve, textural class, and pH. The field capacity (θfc) was measured in the laboratory as the bulk water content retained in soil at −33.3 kPa of suction pressure and the permanent wilting point (θpm) was measured as the bulk water retained in soil at −15,000 kPa. Soil texture was classified according to the US Department of Agriculture (USDA) standards.
Prior to the soil infiltration measurements, the litter was cleared and, if necessary, the grass and ground cover were chopped to expose the soil surface before the ring was inserted. The choice of sampling points was impacted by favorable ground conditions for measurement as well as constraints such as tree roots, rocks, and microtopography differences. At each plot, we carried out 10 measurements, using a steel cylinder of 15.5 cm radius, that was inserted approximately 0.01 m into the soil surface, with a minimum distance between measurements of about 2 m. A known volume of water (125 mL) was repeatedly poured in the steel ring, and the time needed for the water to completely infiltrate was measured. We repeated the procedure until the difference in infiltration time between two or three consecutive trials became negligible, with a minimum of 15 repetitions per measurement.
We used the simplified steady-state estimation method of saturated soil hydraulic conductivity (SSBI) to estimate Ks, based on the Beerkan infiltration run proposed by Lassabatère et al. [14]. The method referred to as BEST (Beerkan estimation of soil pedotransfer parameters) estimates the soil hydraulic conductivity (Ks) making use of the cumulative infiltration curve obtained with the Beerkan test, the soil particle-size distribution, the bulk density ρb (M L−3), and the initial water content θi (L3 L−3). Furthermore, the simplified method of Ks’ estimation, based on Beerkan infiltration run proposed by Bagarello et al. [17], does not require additional field and laboratory measurements to estimate Ks, such as initial and final soil water content, particle size distribution or bulk density. By omitting these steps, the costs for determining Ks are considerably lower, and the time needed to perform the measurements is considerably less than in other methodologies. This study therefore examines methodologies that are considered low-cost and easy to implement. We chose the near steady-state phase of a Beerkan infiltration run (SSBI) as a low-cost and easy to implement alternative to the BEST-steady model. For estimating Ks with the SSBI method, the slope of the linear portion of the cumulative infiltration curve and an estimate of α* are enough [10]. The α* parameter expresses the relative importance of gravity and capillary forces during a ponding infiltration process. For this study, an α* = 0.012 mm−1, suggested as the value of first approximation for most agricultural soils, was selected. Following Bagarello et al. [17] and Lozano-Baez et al. [22], we selected the SSBI method, as it reached similar results to those obtained with other, more data-demanding procedures of analysis of the same infiltration run.
To measure the volumetric soil water content (VWC), we used a time-domain reflectometry (TDR) sensor, which is based on electromagnetic technique and has a high accuracy [38]. Following Rankoth et al. [39], we selected the Waterscout SM100 soil moisture sensors (Spectrum Technologies), as it shows a strong relationship to the gravimetric water content measurements. Moreover, according to Bermúdez-Flores et al. [40], the capacitance sensors are effective tools to study water performance on coffee soils. The sensor was inserted 10 times at different points in each plot into the soil diagonally and the data were displayed with the FieldScout Soil Sensor Reader (Spectrum Technologies), with a minimum distance between measurements of 2 m. TDR sensors are simple to use and can be used for a long time after a one-time purchase, making this tool useful in the field. Furthermore, TDR sensors are compact and easy to transport. In each study plot, prior to VWC measurements, surface temperature was measured in the same spot above (TAL) and under (TBL) soil cover if present with an infrared thermometer [41]. This is a low-cost and easy to implement indicator compared to other soil temperature measurements. By subtracting TAL from TBL, we obtained the temperature difference between above and below soil cover (TD). Temperature and VWC measurements were carried out between April 4th and April 8th, between 09:00 and 10:00 h. The last rain occurred more than 10 days before the 4th of April and the temperatures and weather conditions stayed constant during the week.

2.4. Visual Soil Assessment

Furthermore, we conducted a visual soil assessment in each 81 m2 plot, based on the work proposed by the Catholic Relief Services for coffee soils in Central America [23]. In the study site CN, plot one, we carried out two visual soil assessments, because the soil showed great differences within the same plot. This easy to implement and low-cost soil assessment is a practical methodology to assess soil health, based on the visual observation of soil properties that indicate the quality of the soil: color, structure, consistency, porosity, and depth. For this, we extracted a 0.2 m3 undisturbed soil cube. We cleared coarse plant material from the site to be sampled. We lifted the undisturbed soil cube one meter height and let it drop onto a sack of plastic. If large clods remained, we repeated the fall a total of three times. Once the soil had spread out, we placed the larger clods at one end and the finer clods at the other (Figure A1). Finally, we proceeded to assess each of the eight indicators (structure, porosity, color, mottle, earthworms, compaction, soil cover, and depth), using the indicator scorecard (Figure A2). The total sum of the values for each indicator assesses the state of the soil in poor state (<10 points); moderate state (1025 points); and good state (>25 points).

2.5. Data Analysis

For each variable considered in this investigation (Ks, TAL, TBL, VWC, canopy cover, vegetation height, and DBH), the Levene test was used to examine the assumptions of homogeneity of variance, and the Shapiro–Wilk test was used to examine the assumption of normal distribution. For the VWC data, five values containing cero were eliminated. The VWC data were not normally distributed, and the assumption of homoscedasticity was not met. Log transformation and Box–Cox transformation did not change that; therefore, for a statistical comparison, VWC data were analyzed using the Kruskal–Wallis test for non-parametric data. Then, the post-hoc Dunn test was applied, which performs a pairwise comparison between each independent group, considering the land-use type as an explanatory variable, the related p-values were computed and compared to the level of significance of 0.05. The TBL and TD data were Box–Cox transformed and the Ks data were Log transformed prior to analysis, the transformed data were normally distributed, and the variance was equal across the sample according to the mentioned tests. For the data sets (Log transformed KS data, Box-Cox transformed TBL and TD data, and TAL data), one way analysis of variance (ANOVA) was performed considering the land-use type as an explanatory variable. Then, the Tukey test was applied, which compares the means two by two, the related p-values were computed and compared to the level of significance of 0.05. All analyses were performed through the R software [42].

3. Results

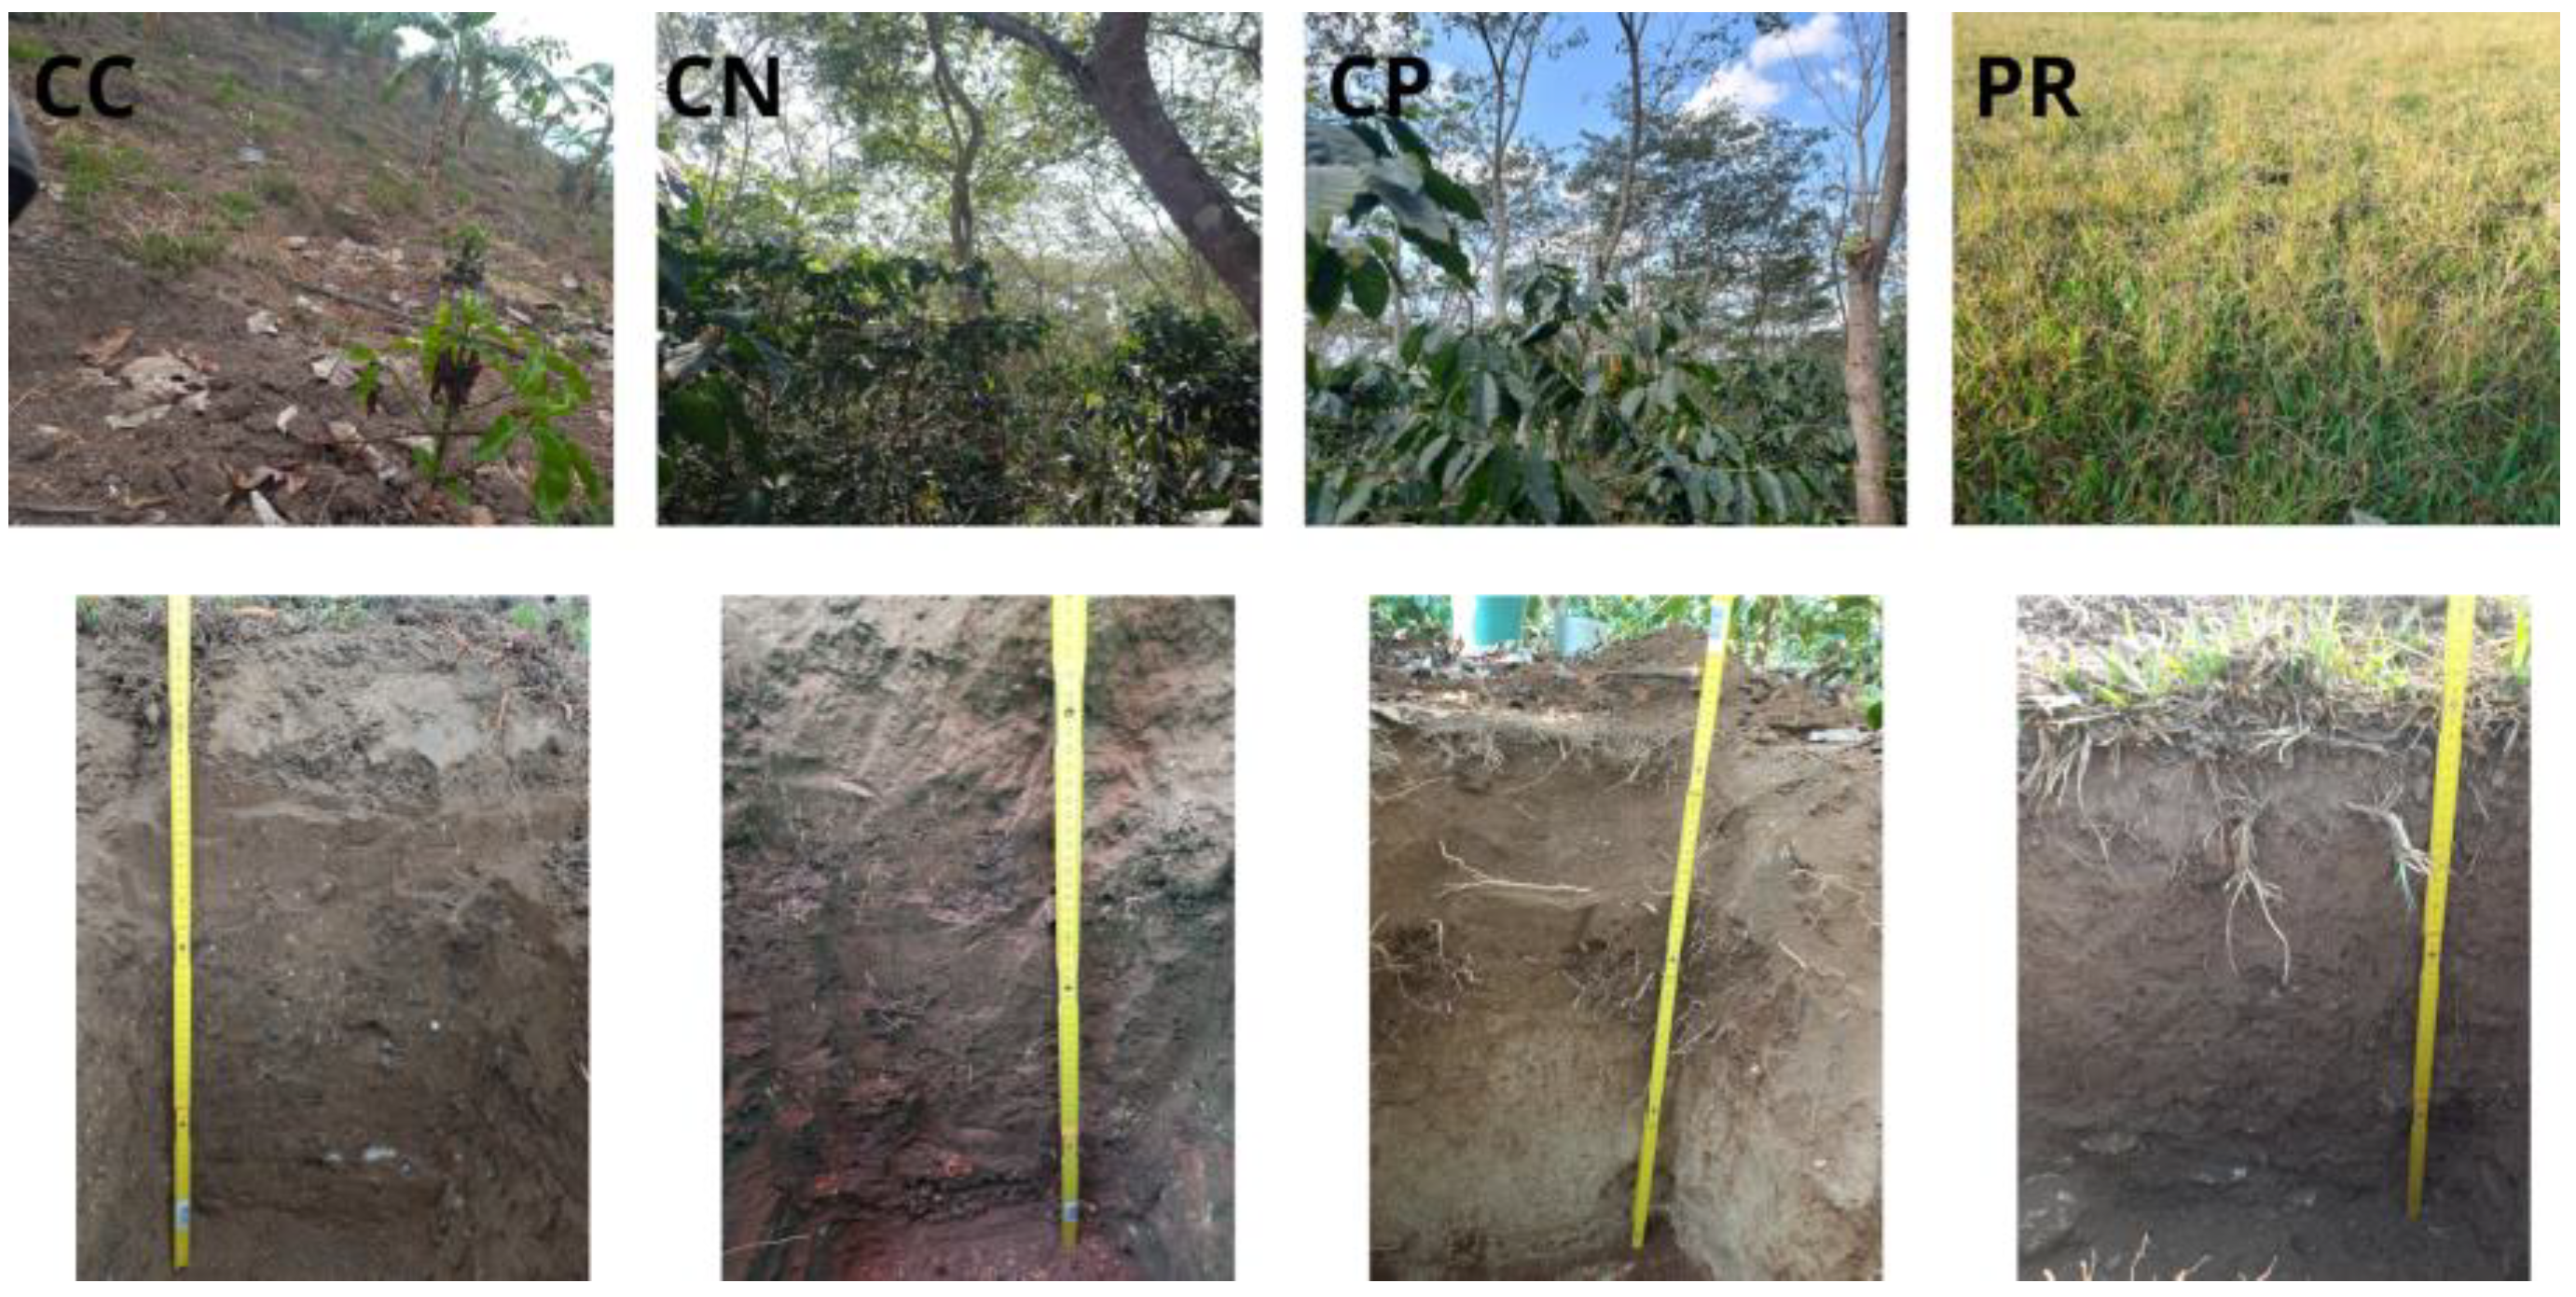
The vegetation characteristics show that the CN site has a significant higher canopy cover than the CP site (Table 2). Otherwise, vegetation height of tree and DBH are highly similar between both land-use types.
The CC, CN, and CP sites had similar percentage of live biomass as soil cover (Table 3), all between 21 and 30%. Most live biomass in the CN and CP sites were fern, creeping plants, and broad leaf plants such as Achiyranthes aspera L. and Ipomoea purpurea L. Otherwise, the live biomass on CC site includes mainly herbaceous vegetation, as it was converted from pasture to coffee plantation one year before. The PR site was covered entirely by live biomass, herbaceous vegetation. The CN site and CP site had a very high dead biomass percentage of soil cover, mainly leaf litter from the trees within the plots. The CC site had little dead biomass, mostly dead grass used as mulch. The site with the highest percentage of bare soil was CC. The other sites had no to a very low percentage of bare soil.
The texture of the first 0–30 cm of soil is sandy loam in CC, while it is sandy clay loam in CN, CP, and PR sites (Table 4). The clay content is the lowest for the CC site with 7%. For the other sites, the clay content ranges between 21% and 34%. The silt content ranges between 18% and 31%, while the CC site has the lowest silt content, the PR site has the highest silt content. The sand content varies between 35% and 76%, with considerably higher sand values in CP and lower values in PR. The bulk density (ρb) values range from 1.05 to 1.18 g cm−3, with higher similarities between CC and CP, the lowest value for PR and the highest for CN. Comparisons of field capacity (θfc) values between studies depict similar values for CC with 0.2227 cm3 cm−3, CN with 0.2541 cm3 cm−3, and CP with 0.2196 cm3 cm−3, and a considerably higher values for PR with 0.3207 cm3 cm−3. The same observation is made for θfc applied to the permanent wilting point (θpm), with PR having the highest value with 0.2008 cm3 cm−3. The pH has similar values in all study sites, ranging from 4.4 to 5.0.
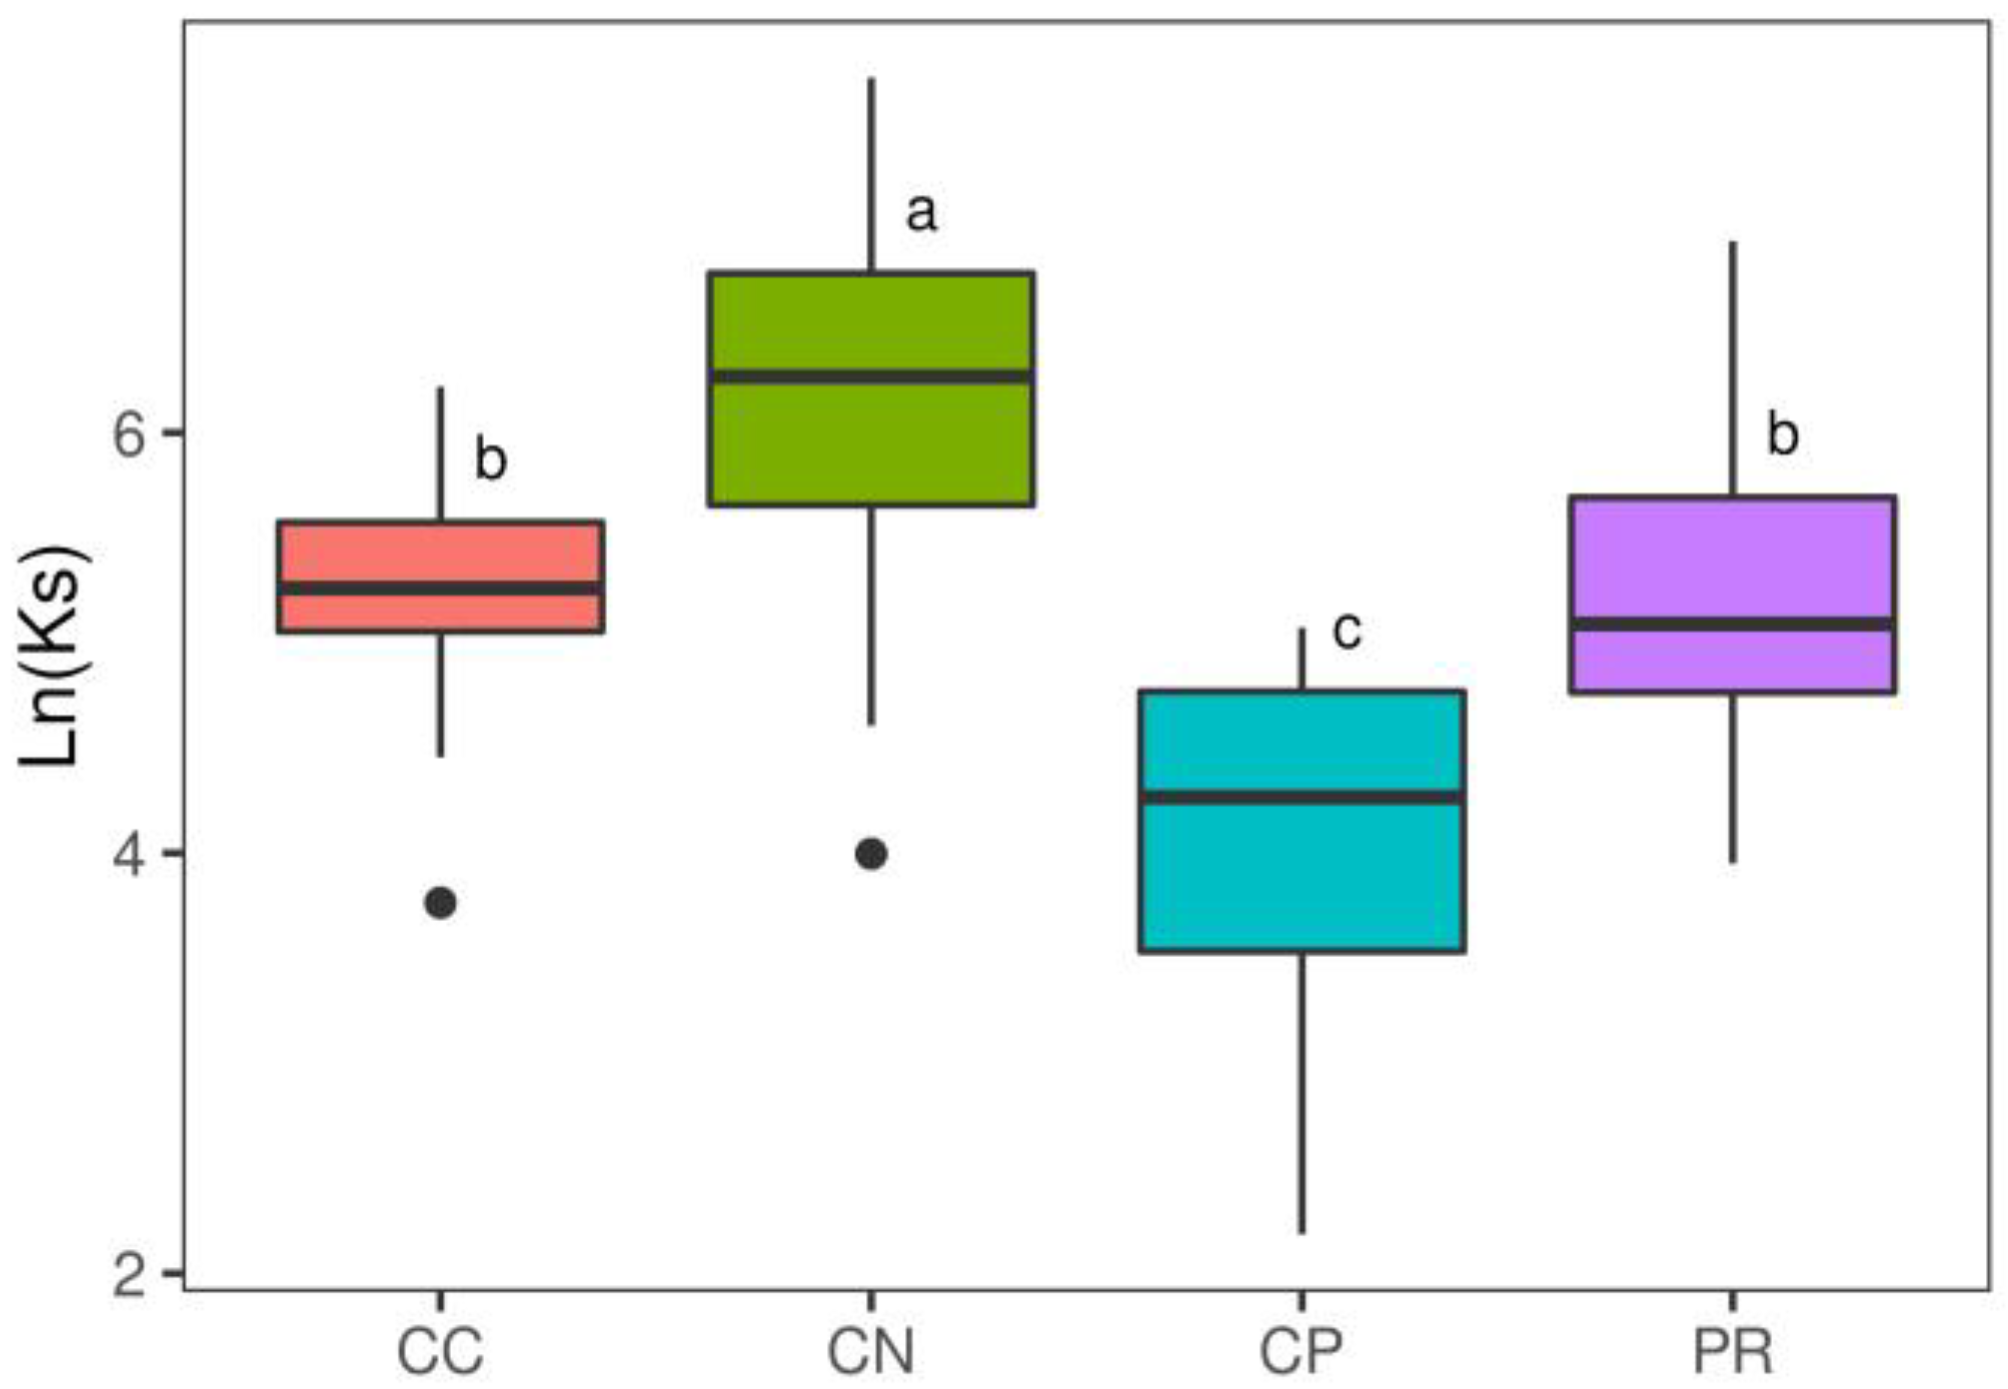
The Ks (Figure 4) is significantly lower for CP (range: 9 to 160 mm h−1) in comparison to the other sites and CN has significantly higher Ks values (range: 54 to 2185 mm h−1). There is no significant difference between CC and PR in terms of Ks (range: 43 to 1004 mm h−1) (Table 5). A higher variability of Ks values is observed for CN, CP, and PR study sites. In contrast, smaller variations are evidenced in CC.
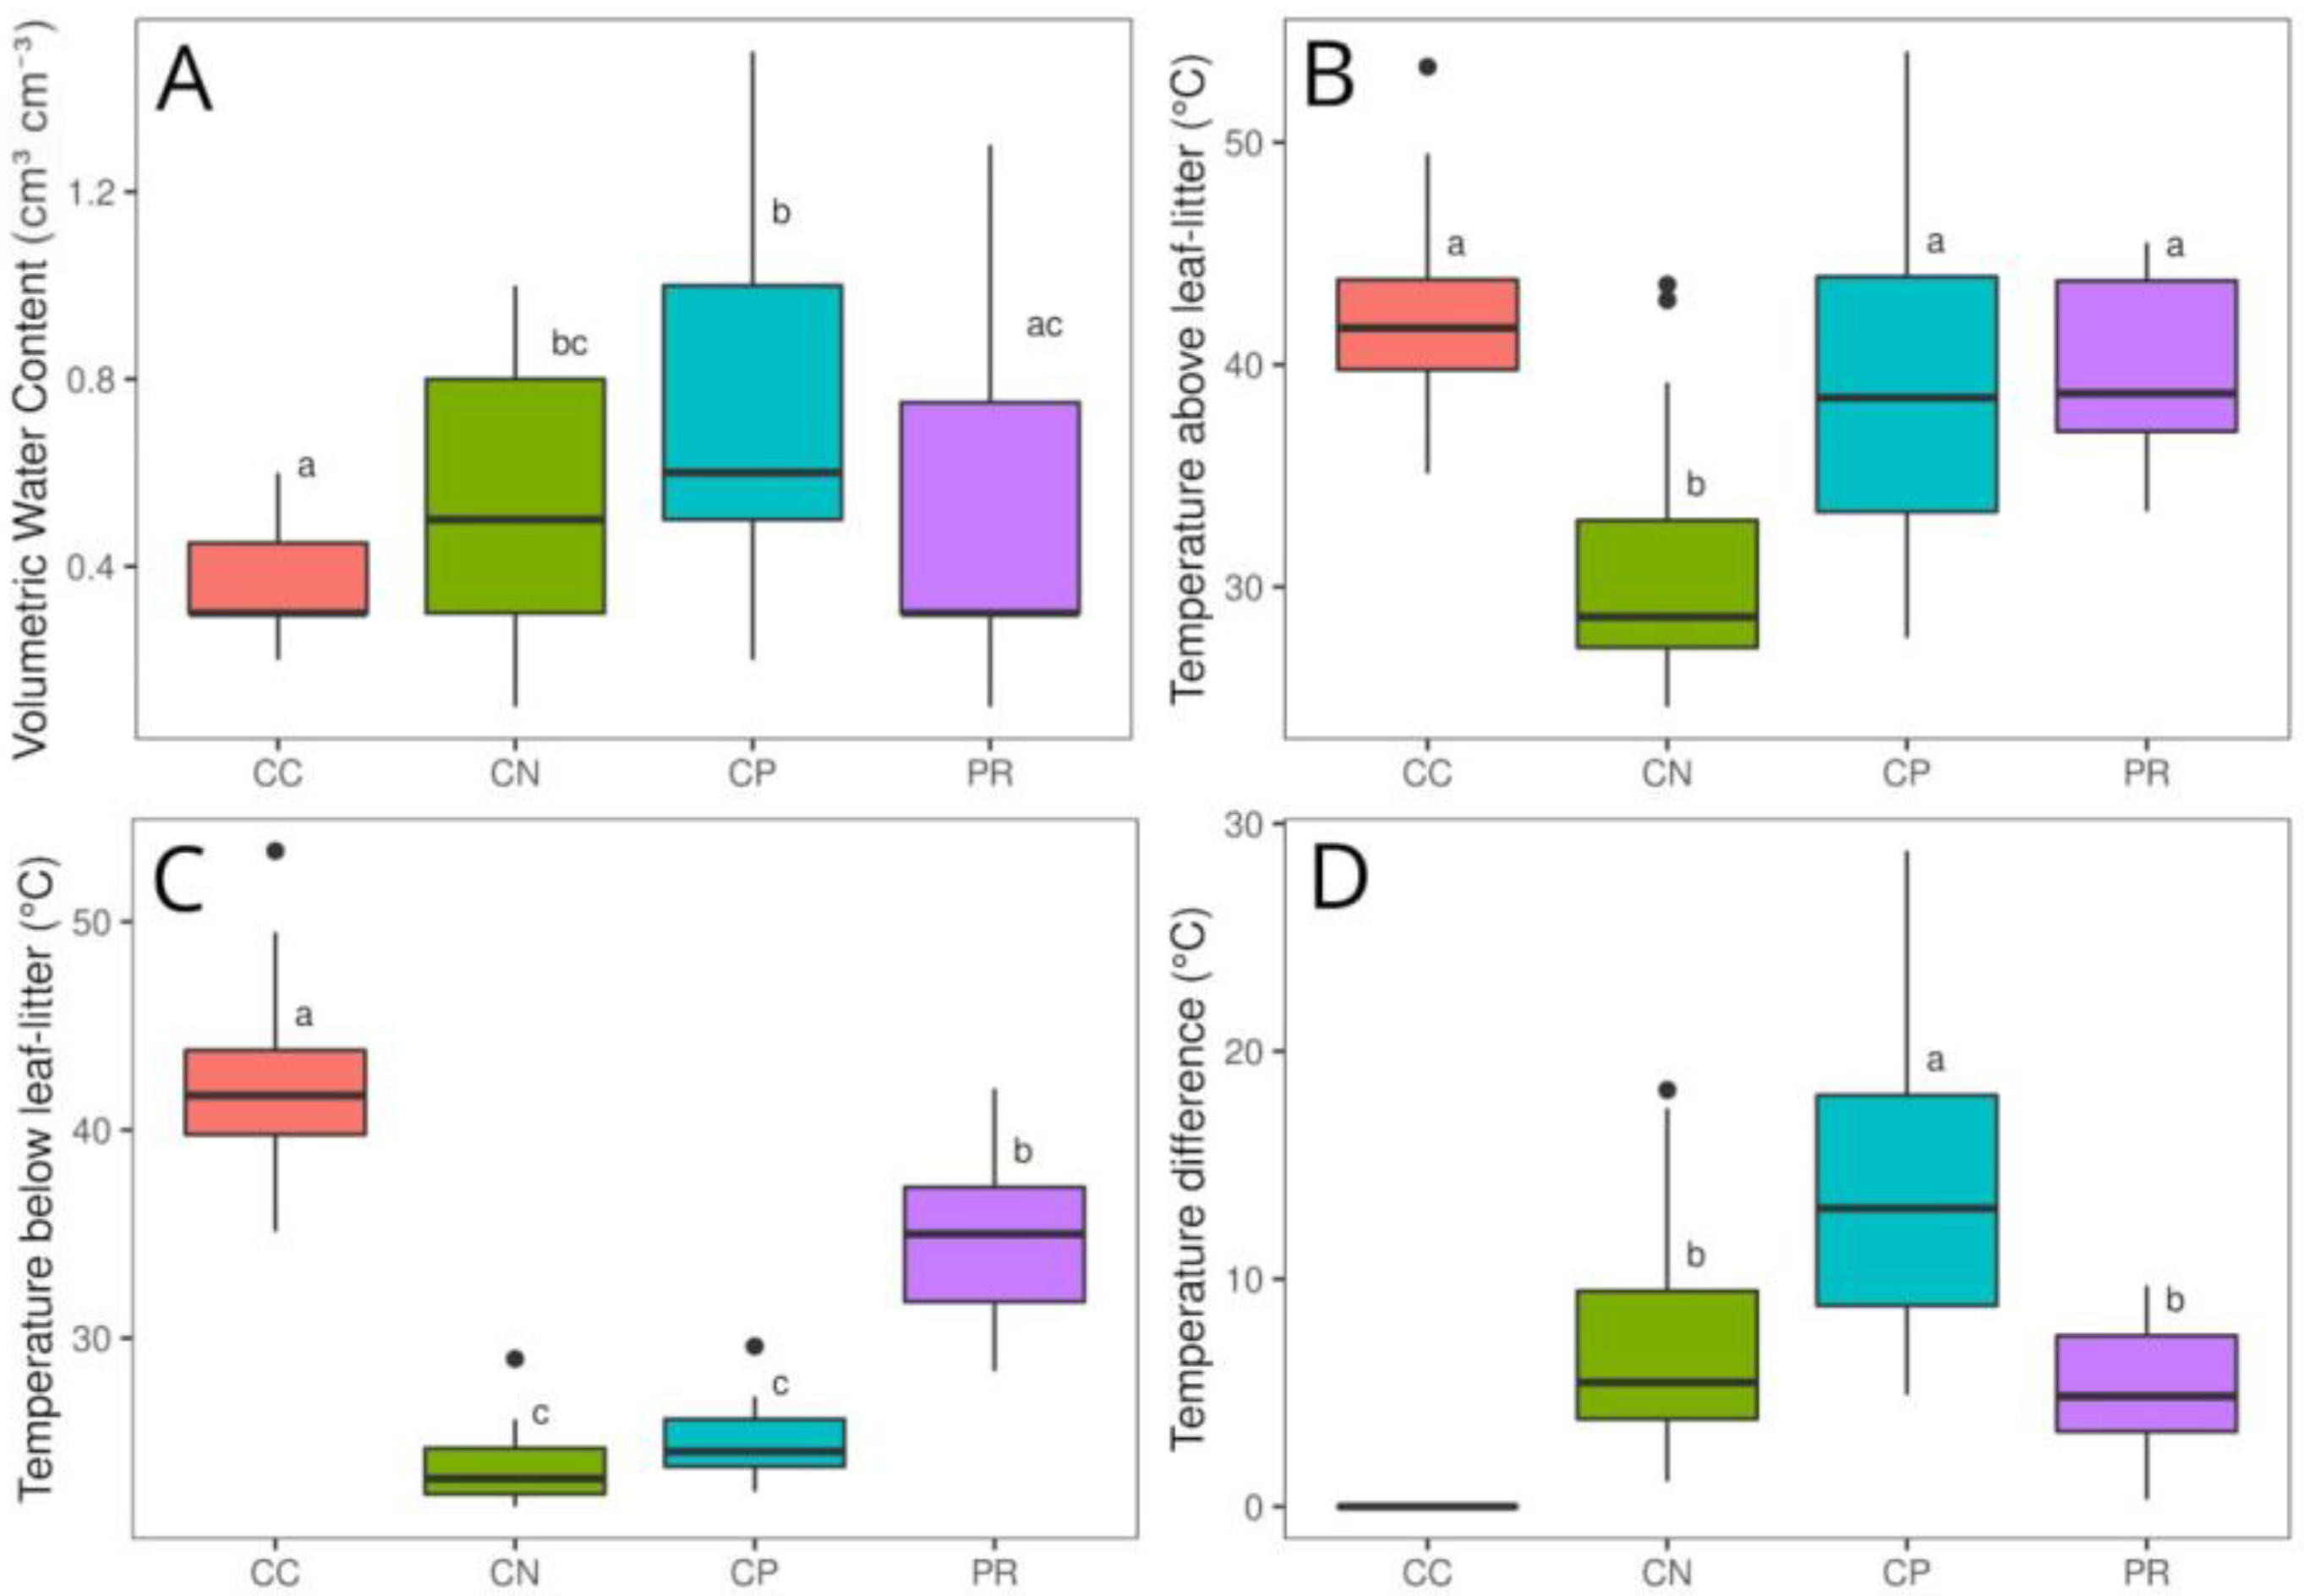
The volumetric water content shows significant higher values for CP and CN than CC and PR. We highlight that CN and PR has no statistically significant difference, as well as PR and CC. Nevertheless, CC has significantly lower values compared to CN (Figure 5A). The temperature above leaf litter (TAL) is significantly lower between CN (range: 24 to 44 in °C) and CC, CP, and PR (range: 27 to 54 in °C). For temperature below soil cover, we observe the higher similarity between CC and PR (range: 28 to 53 in °C), and CN and CP (range: 21 to 29 in °C). The temperature difference ranges between 0.3 °C and 28.9 °C. It shows significant differences in CP with CN and PR.
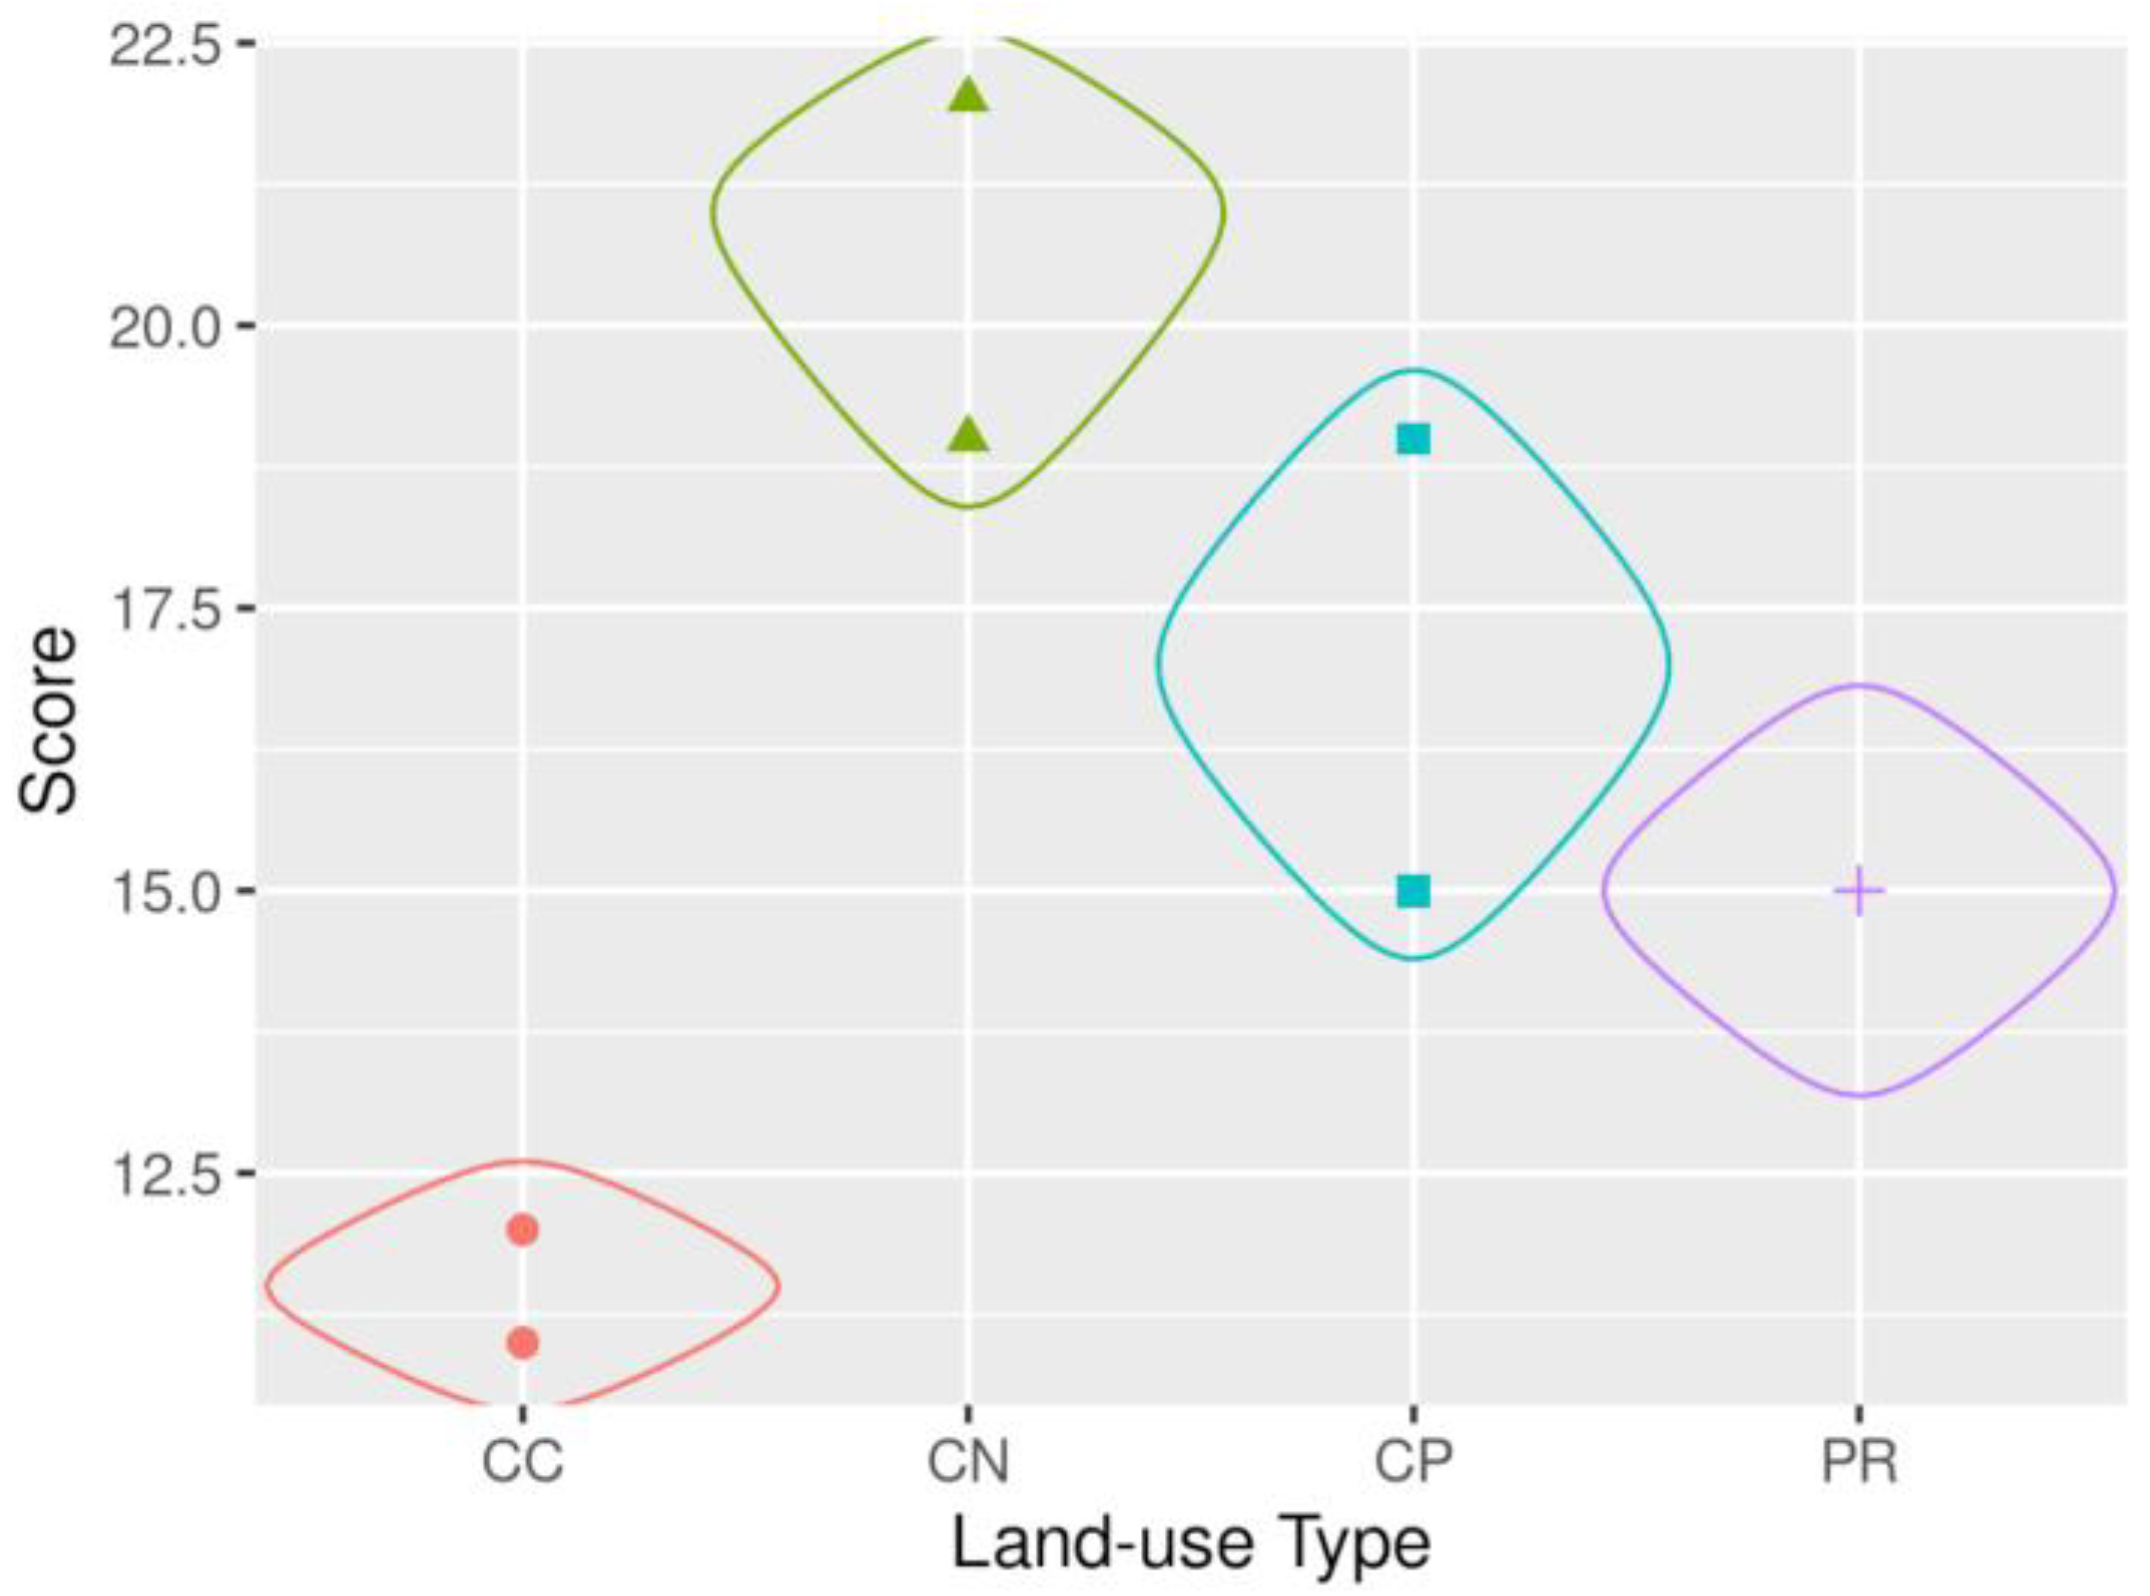
The results of the visual soil assessment are depicted in Figure 6 and shown in detail in Table 6. CN shows the highest scores (19, 22, and 22 points), followed by CP (19 and 15 points). The PR site scores 15 points twice and CC has the lowest scores (11 and 12 points). All plots, according to the three categories elaborated on (poor soil quality, moderate soil quality, and good soil quality) in the soil visual assessment, proposed by the Catholic Relief Services [23], indicate a moderate soil condition. This means the plots score between 10 and 25 points after the evaluation using the corresponding table (Figure A2) and the condition of the soil is assessed as moderate. If the soil scored under 10 points, it would be evaluated as negative soil conditions, and if the soil scored above 25 points, it would be categorized as positive soil conditions.

4. Discussion

The current study aims to use low-cost and easy to implement methodologies to assess the impact of shade-grown coffee agroecosystems on soil hydraulic conductivity over time. Evaluating the environmental impact of soil usage typically necessitates costly and time-consuming experimental efforts, limiting the possibility of estimating the physical and hydraulic properties of soil on a larger scale. Many coffee cooperatives and local research institutes, such as the cooperative Nuevo Sendero in Santa Rosa, Guatemala, lack access to demanding installations or expensive instrumentation. As a result, it is critical to estimate soil physical and hydraulic indicators using low-cost and simple to implement methods that provide a minimum degree of reliability to reach conclusions. Previous research in this area indicates that the SSBI methodology is a good compromise between measurement reliability, applicative simplicity, and the need for repeated sampling in space and time [15,18]. Furthermore, the soil visual soil analysis is even faster and cheaper to implement and can be used as a reference for soil quality in coffee plantations. During the study, we found a strong spatial variation among soil characteristics, even within the selected study sites. A large number of determinations is required to measure soil hydraulic properties properly and to assess the magnitude of the variation within the selected area. This finding thus confirms the need to find reliable methodologies to measure soil hydraulic properties that are not costly and time consuming to guarantee their on-field repeatability and feasibility. The methodologies chosen for this study proved to be relatively low cost and simple to implement for measuring soil hydraulic parameters and soil indicators. With a team of four people, one day of work was needed for each study site. All needed materials cost less than a total of USD 100, apart from the FieldScout Soil Sensor Reader (Spectrum Technologies), which costs around USD 400. This sensor, however, can be used repeatedly after a one-time purchase or rented from other research institutes or organizations.
While soils in the study area varied, this was overcome by selecting sites and landscape positions within the different land uses that have similar soil textural classes in the surface horizon. Due to the time and resource constraints of the research, it was not possible to include further treatments. However, we recommend that future studies include a larger number of treatments and replicates to ensure a more robust data set. A better understanding of the soils in the current area will aid in understanding the relationship between soil physical and hydrological characteristics.
Generally, soil attributes and Ks values show important differences between land-use types. Some differences in Ks values among specific land-cover types are not expected overall. Ks at the CP plantation is statistically lower than CC and PR. The lower Ks at CP does not support our study hypothesis that Ks average values would vary accordingly to the age of the trees in a land-use conversion from grassland to coffee agroforestry systems in time: CN > CP > CC = PR. Instead, the order is CN > CC = PR > CP. As expected, the highest Ks values are observed at the CN site, which also has greater values for the vegetation attributes (i.e., canopy cover, soil cover, vegetation height of tree, DBH, and the total number of trees). Higher Ks values for shade-grown coffee agroecosystems (older than 30 years) over pasture are also reported by Lozano -Baez et al. [5] in the municipality of La Jagua de Ibirico, César department, Colombia, with predominant Entisols. They investigated the saturated hydraulic conductivity (Ks) and some hydrophysical soil attributes in four land-use types: shade-grown coffee; a natural regenerated forest 15 years ago; a pasture; and a reference forest. Their findings show that the Ks values for the coffee and the reference forest are comparable, indicating that trees have a positive effect on soil hydrological functioning in agroforestry systems. The study by Marín-Castro et al. [43] shows that shade coffee plantations derived from tropical montane cloud forest can maintain a high capacity of soil hydraulic conductivity Ks, similar to that of the native forest. Tree species, particularly leguminous trees used in CN and CP (i.e., Inga fissiolyx), in association with coffee, can play an important role for soil water infiltration and support complementary water uptake [5,44,45,46]. Similarly, other authors report that soil compaction after forest conversion led to reduced Ks values and that intense agricultural use can cause a reduction in Ks in soil [11,47]. A systemic review of scientific literature investigating infiltration measurements in forests restored by tree planting in the subtropics and tropics conducted by Lozano-Baez et al. [48] reveals that tree planting in forest restoration has positive effects on infiltration, supporting the higher Ks values found at CN.
The CP site shows lower Ks values as expected. This result may be caused by the young age of the plantation. Prior investigations strengthen the position, that Ks full hydrological recovery of tropical degraded sites may take more than two decades. Ziegler et al. [49] and Leite et al. [
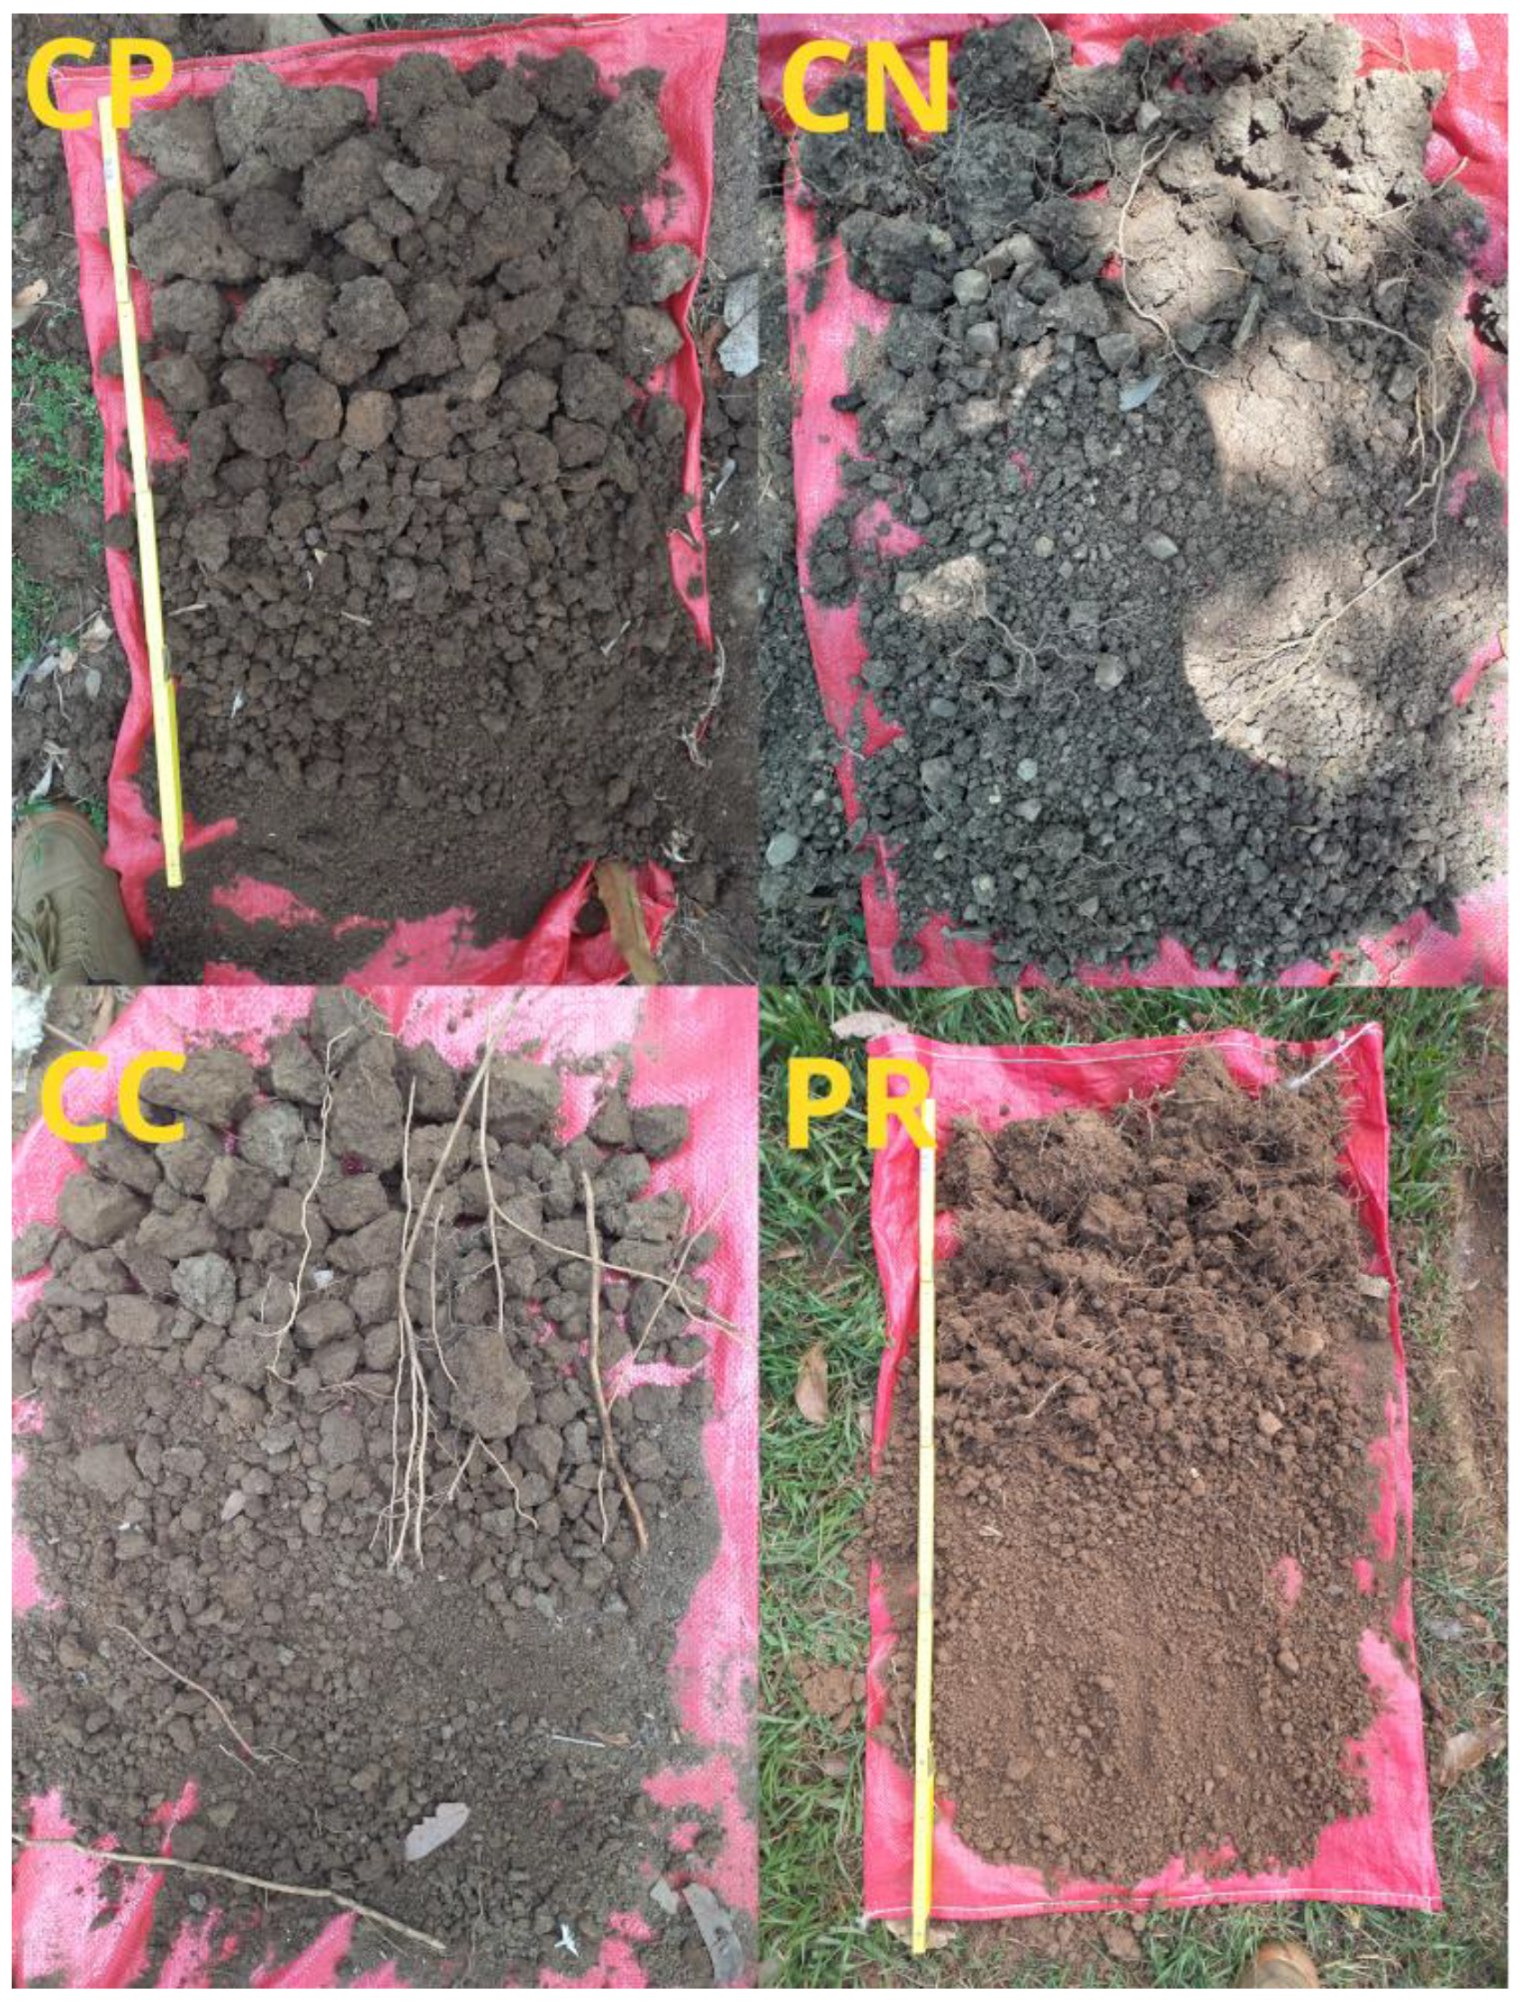
27] suggest that a period of 25 years and 35 years could be enough to restore Ks values after soil degradation in Vietnam and in the Caatinga ecosystem respectively. Moreover, the profile from CP showed a very clear second horizon (at around 30 cm), where color and texture of the soil change drastically (Figure 2). This is not observed on the other sites, were the color stayed constant along the soil horizons (until 70 to 100 cm). This very clear layer could influence the infiltration rate at the CP site. Generally, the PR and CC sites have high Ks values compared to other study sites with soils with similar textural class (sandy clay loam and sandy loam) [22,23]. This could be due to the land-use history of the sites, as both sites were used for non-commercial purposes. Thus, there was no intensive grazing management. The grazing management used by the landowners resembles more a rotational grazing management, which can improve soil degradation [50]. Looking at the soil profile for PR, roots are present at a depth of 60 cm. In contrast, the CP site had no grazing management, and the potato and tobacco plantations could have had a more negative effect on the soil physic and hydrological properties than the non-commercial pastures management. Thus, it would be interesting for future studies to compare Ks values from the CP and PR sites with a land-use type based on other crops such as potato and sugar cane.
Looking more deeply into the study site CP, if plot 1 (CP1) from CP is excluded from the calculation of Ks for CP, Ks values at the plot 2 (CP2) in CP are statistically similar to CC and PR (Table 5). The study site CP shows a high spatial variability of Ks values, and the greatest interquartile range and most extended whiskers of all study sites (Figure 4). Furthermore, the mean Ks values between CP1 and CP2 are statistically significantly different (Table 5). Both observations confirm a high spatial variability of soil hydrological characteristics within the study site CP, although both plots underwent similar land-use changes in the past decades. This shows the high spatial variability of soil characteristics and the importance of low-cost and easy to implement methodologies to cover increase repeatability in space and time of samples. Other study sites show no significant differences between mean Ks values between plots, indicating a more homogeneous distribution of soil physical and hydraulic characteristics.
The VWC values vary considerably between land-cover types. The statistically similar VWC values between the agroforestry coffee sites CP and CN, between the CN and PR land-use types, and the PR and CP sites, do not back up our initial hypothesis, mainly that the average VWC values would be ordered as follows: CN > CP > CC = PR. The actual result from the VWC average values is CP ≥ CN ≥ PR ≥ CC. Our initial hypothesis that TAL would vary at each site with different land-use type accordingly to canopy and soil cover (CC > PR > CP > CN), is not confirmed either. Instead, there is no significant difference between the mean TAL values for CC, PR, and CP, resulting in an average TAL value ordered as follows: CP = CN = PR > CN. Although we formulated these hypotheses based on findings from previous research on the influence of canopy cover, soil cover, and age of the plantation on microclimatic conditions of agroforestry systems, other investigations highlight the opposite, suggesting the importance to carry out further investigations in environments where little data are available.
The CN site has the lowest temperatures, below and above leaf litter, indicating that the higher canopy and soil cover impact greatly microclimatic conditions. Lin et al. [1,24] highlight the capacity of high shade cover (60–80%) coffee agroforestry systems to reduce overall evaporative demand, coffee transpiration, and contribute to the mitigation of variability in microclimate and soil moisture for the crop of interest. The high temperature difference between TAL and TBL for the CP site should not be left without attention. Although TAL is not significantly different between CP, CC, and PR, the CP site shows a taller boxplot, indicating a bigger spread of data. This could be due to the fact that the site has low canopy cover (20–30% shade), influencing the spatial variability of the temperature. Moreover, the high TD for CP indicates that leaf litter has a great positive influence on the soil temperature for young agroforestry systems.
Although CP has the highest VWC, it is not significantly higher than the values in CN. The study of Lin et al. [1] outlines that lower shade cover (30–60% shade) could already contribute to maintain higher levels of soil moisture during the dry season. Additionally, Souza et al. [51] argues that higher plant density and the presence of high trees, leads to a higher soil–water demand in forest and coffee sites, corroborating the slightly lower soil–water content in CN than CP. The study carried out by de Carvalho et al. [28] shows lower soil moisture of shaded areas in contrast to the unshaded areas at different depths, which is also an indicator for improved deep water drainage, where trees in agroforestry systems reduce surface water losses. This research also explains that although water availability can be lower in the older shaded coffee systems during the dry season, such as in CP, it has no effect on coffee physiology because the coffee plant has neglected physiological growth development during this season.
The high TD values for CP show the importance of leaf litter for soil temperature, contributing to the maintenance of soil moisture. VWC was measured during morning hours, and dew was higher in the PR site due to higher temperature difference between night and day than in agroforestry systems. The study by Karki and Godman [52] shows higher mean values for dew point in open pasture than in silvopastoral systems. Thus, morning dew could influence VWC values at the PR site. The low soil cover at the CC could explain the low VWC and the high soil temperature.
The values for the visual soil assessment (VSA) vary between plots and study sites. The hypothesis that the VSA would be ordered following the age of the agroforestry system: CN > CP > PR = CC, cannot be entirely confirmed. The study site PR shows higher results (twice 15 points) than the CC site (11 and 12 points). The repetitions for the soil visual assessment cannot be used for strong statistical statements, as there were too few repetitions. Nevertheless, it can be used as a reference to compare results and assess a visual soil assessment tool. The actual order for the scores for the VSA is CN > CP > PR > CC. All given scores group the state of the soil as moderate (scores between 10 and 25), according to the soil state classification proposed in the soil visual assessment tool developed by the CRS [29]. The CN site scores the highest, reaching the upper scores for moderate soils, corroborating the results for Ks presented before. Soil structure, soil cover and soil depth are the most determining factors, as they have the highest influence on the total score. This contributes to the fact that PR scores better than CC, as CC has very low points for soil cover. It must be considered that the optimal time of the year proposed by the Catholic Relief Services to conduct the VSA is after the first rains. In Santa Rosa, Guatemala, this would be around the mid of Mai. Our study was conducted during the driest period of the year, at the end of the dry season (April). Thus, it must be considered that the soil VSA was carried out during a very dry period, and it should be repeated at different moments during the year (in Table 6 almost every assessment scores zero for earthworms). The study sites score low for soil depth. This could be due to big rocks and very hard soils, which could be caused by the very dry season. Moreover, farmers and technical workers preferred the VSA methodology the most, making it a suitable methodology to be used by coffee farmers themselves.
According to multiple studies, shade trees in coffee agroecosystems can provide multiple benefits such as: (i) improve soil moisture retention and water infiltration [44,53,54], (ii) regulate microclimate control [1,53,55], (iii) regulate pests and diseases [56,57,58,59], (iv) provide a better quality of coffee beans [43], (iv) help nutrient use efficiency [60,61,62], (v) minimize erosion and landslide damage [63,64], and (vi) favor income stability [60,61,62]. A high canopy cover in agroforestry coffee plantations, on the other hand, might decrease yield, resulting in a financial loss for coffee growers [44]. Future studies assessing the advantages and disadvantages of shade-grown coffee in Santa Rosa department will therefore need to gather more empirical data.
The selected methodologies in this study have proven to be low cost and easy to implement, contributing to the development of soil assessment with restricted economic and time resources. This study was realized with low budget, reduced staff, and reduced time to implement the measurements. These conditions correspond to the reality of many research institutes in Guatemala and Latin America, making it vital to be able to carry out studies from this starting point to advance soil studies at local, national, and regional level. This study is a proof of its own applicability, as it was carried out with a very small budget and within a short period of time. In addition, we have managed to use methodologies that are simple and easy to understand for the farmers involved in this study, bringing the approach closer to day-to-day practice. The study participants are able to continue collecting data, contributing to the robustness of the study over time.
Other studies suggest that the SSBI methodology can be as robust as the BEST-steady method [15,17,18,22], making it a rapid, robust, and relatively inexpensive alternative to measuring soil hydraulic properties. Water infiltration techniques are easy to conduct and do not require intensive gears. Low-cost and rapid methodologies such as the ones presented in this study allow repeated measurements in time and space, strengthening the robustness of the data over time. Following the suggestions by Lozano et al. [48], we recommend to monitor infiltration and other soil parameters in tropical and subtropical land-use systems at regular intervals to better understand the temporal variability of infiltration recovery and microclimatic parameters. Although we did not directly quantify variables such as soil macroporosity, soil biological activity, root biomass, plant diversity, organic matter, and topographic variations, these are widely regarded as primary drivers of Ks spatial variability in forest soils [27,48,65,66]. Further factors that contribute to differences in Ks include past land-use intensity as well as spatial and topographic variations in soil depths along the toposequences [22]. Therefore, given the importance of the above mentioned factors, future research may investigate how to integrate low-cost and easy to implement methodologies to assess these factors in tropical and subtropical land-use systems.

5. Conclusions

This study supports the findings that agroforestry systems, such as shade-grown coffee, benefit the hydrophysical soil properties and micro-climatic conditions. The comparative analysis of Ks in coffee agroforestry systems older than 30 years (CN), coffee agroecosystem of seven years (CP), newly planted shade-grown coffee (CP), and non-commercial pasture (PR) show higher Ks values for CN. Comparison with prior studies shows that a period of seven years is too short to see a significant recovery of Ks.
Our study concludes that in seven-year-old coffee agroforestry systems, leaf litter can already improve soil moisture retention through climatic regulation. The soil visual assessment proposed by the Catholic Relief Services for coffee soils in Central America corroborates the presented results, showing the highest scores for CN followed by CP. The methodologies selected for this study were selected considering two main factors: affordability and reproducibility. The simplified method based on a Beerkan Infiltration run (SSBI method), the temperature measurements with an infrared thermometer, the use of a time-domain reflectometry sensor, and the soil visual assessment tool proposed by the Catholic Relief Services prove to be efficient, low cost, and easy to implement.
It must be noted that the available scientific evidence in this area is severely limited and that the use of rapid and inexpensive methodologies may have constraints that should be considered in future research: (1) The effect that plant species, diversity of plants, or tree densities could have on infiltration should be comprehensively considered in future research. (2) The scarcity of long-term studies using similar low-cost methodologies in the area is very limited. When the results of short-term experiments are extrapolated to long-term evaluations, this can be problematic and misleading. To better comprehend the temporal variability of infiltration recovery, we suggest monitoring infiltration in tropical land-use systems at set intervals. (3) The interactions between infiltration and other soil properties are extremely complex and remain poorly studied. More experiments in tropical agroforestry systems should be conducted, considering soil structure and the influence of microporosity and soil biological activity on infiltration. (4) Other factors influencing Ks, such as plant diversity, organic matter, topographic variations, and land-use history, should be considered more in detail to assess the differences in hydrological properties of different land-use systems.

Author Contributions

Conceptualization, M.D.G.; methodology, M.D.G. and S.E.L.-B.; software, M.D.G.; validation, N.G., W.A.G. and B.M.; formal analysis, M.D.G.; investigation, M.D.G.; resources, M.D.G., S.E.L.-B., B.M., N.G. and W.A.G.; data curation, M.D.G.; writing—original draft preparation, M.D.G.; writing—review and editing, S.E.L.-B., M.C., N.G., W.A.G. and B.M.; visualization, M.D.G.; supervision, M.D.G., M.C. and S.E.L.-B.; project administration, M.D.G., Andrés Gomez; funding acquisition, M.D.G. All authors have read and agreed to the published version of the manuscript.

Funding

This research was funded by PUR Projet: 001.

Acknowledgments

We thank Jesus Alvarado and Hilmar Bolaños for helping with the selection of the study sites and facilitating the contact with the Nuevo Sendero Cooperative; the members of the Nuevo Sendero cooperative for their support in the field and for facilitating the contact with the coffee farmers; the coffee farmers for giving us access to the coffee parcels; the Federación de Cooperativas Agrícolas de Productores de Café de Guatemala (FEDECOCAGUA, R.L) for their support during the selection of the study sites; Nery Guzman for organizing and helping with the soil analyses at the San Carlos University in Guatemala; and Josué Donis Escobar, José Vásquez, and Luis Castellanos for the support during data collection.

Conflicts of Interest

The authors declare no conflict of interest. The funders had no role in the design of the study; in the collection, analyses, or interpretation of data; in the writing of the manuscript; or in the decision to publish the results.

Appendix A

Figure A1. Pictures showing 0.2 m3 soil samples for each site after ordering the clods accordingly to size. This methodology was used during the visual soil assessment (VSA). CC, newly shade-grown coffee; CN, 30-year old shade-grown coffee; CP, seven-year old shade-grown coffee; PR, non-commercial pasture.
Land 12 00390 g0a1
Figure A2. Indicator scorecard for soil quality to quantify the visual soil assessment (VSA) proposed by the Catholic Relief Service for coffee soils in Central America.
Land 12 00390 g0a2

References

  1. Lin, B.B. The Role of Agroforestry in Reducing Water Loss through Soil Evaporation and Crop Transpiration in Coffee Agroecosystems. Agric. For. Meteorol. 2010, 150, 510–518. [Google Scholar] [CrossRef]
  2. Muñoz-Villers, L.E.; Geris, J.; Alvarado-Barrientos, M.S.; Holwerda, F.; Dawson, T. Coffee and Shade Trees Show Complementary Use of Soil Water in a Traditional Agroforestry Ecosystem. Hydrol. Earth Syst. Sci. 2020, 24, 1649–1668. [Google Scholar] [CrossRef] [Green Version]
  3. Zhu, X.; Liu, W.; Chen, J.; Bruijnzeel, L.A.; Mao, Z.; Yang, X.; Cardinael, R.; Meng, F.-R.; Sidle, R.C.; Seitz, S.; et al. Reductions in Water, Soil and Nutrient Losses and Pesticide Pollution in Agroforestry Practices: A Review of Evidence and Processes. Plant Soil 2020, 453, 45–86. [Google Scholar] [CrossRef]
  4. Jose, S. Agroforestry for Ecosystem Services and Environmental Benefits: An Overview. Agroforest Syst. 2009, 76, 1–10. [Google Scholar] [CrossRef]
  5. Lozano-Baez, S.E.; Domínguez-Haydar, Y.; Di Prima, S.; Cooper, M.; Castellini, M. Shade-Grown Coffee in Colombia Benefits Soil Hydraulic Conductivity. Sustainability 2021, 13, 7768. [Google Scholar] [CrossRef]
  6. Lyngbæk, A.E.; Muschler, R.G.; Sinclair, F.L. Productivity and Profitability of Multistrata Organic versus Conventional Coffee Farms in Costa Rica. Agrofor. Syst. 2001, 53, 205–213. [Google Scholar] [CrossRef]
  7. Grüter, R.; Trachsel, T.; Laube, P.; Jaisli, I. Expected Global Suitability of Coffee, Cashew and Avocado Due to Climate Change. PLoS ONE 2022, 17, e0261976. [Google Scholar] [CrossRef]
  8. Marín-Castro, B.E.; Geissert, D.; Negrete-Yankelevich, S.; Gómez-Tagle Chávez, A. Spatial Distribution of Hydraulic Conductivity in Soils of Secondary Tropical Montane Cloud Forests and Shade Coffee Agroecosystems. Geoderma 2016, 283, 57–67. [Google Scholar] [CrossRef]
  9. Akdemir, E.; Anderson, S.H.; Udawatta, R.P. Influence of Agroforestry Buffers on Soil Hydraulic Properties Relative to Row Crop Management. Soil Sci. 2016, 181, 368–376. [Google Scholar] [CrossRef]
  10. Bagarello, V.; Di Prima, S.; Iovino, M. Estimating Saturated Soil Hydraulic Conductivity by the near Steady-State Phase of a Beerkan Infiltration Test. Geoderma 2017, 303, 70–77. [Google Scholar] [CrossRef]
  11. Gusli, S.; Sumeni, S.; Sabodin, R.; Muqfi, I.H.; Nur, M.; Hairiah, K.; Useng, D.; van Noordwijk, M. Soil Organic Matter, Mitigation of and Adaptation to Climate Change in Cocoa–Based Agroforestry Systems. Land 2020, 9, 323. [Google Scholar] [CrossRef]
  12. Zimmermann, B.; Elsenbeer, H.; De Moraes, J.M. The Influence of Land-Use Changes on Soil Hydraulic Properties: Implications for Runoff Generation. For. Ecol. Manag. 2006, 222, 29–38. [Google Scholar] [CrossRef]
  13. Logsdon, S.D.; Jaynes, D.B. Spatial Variability of Hydraulic Conductivity in a Cultivated Field at Different Times. Soil Sci. Soc. Am. J. 1996, 60, 703–709. [Google Scholar] [CrossRef]
  14. Lassabatère, L.; Angulo-Jaramillo, R.; Ugalde, J.M.S.; Cuenca, R.; Braud, I.; Haverkamp, R. Beerkan Estimation of Soil Transfer Parameters through Infiltration Experiments—BEST. Soil Sci. Soc. Am. J. 2006, 70, 521. [Google Scholar] [CrossRef]
  15. Castellini, M.; Di Prima, S.; Moret-Fernández, D.; Lassabatere, L. Rapid and Accurate Measurement Methods for Determining Soil Hydraulic Properties: A Review. J. Hydrol. Hydromech. 2021, 69, 121–139. [Google Scholar] [CrossRef]
  16. Bagarello, V.; Di Prima, S.; Iovino, M. Comparing Alternative Algorithms to Analyze the Beerkan Infiltration Experiment. Soil Sci. Soc. Am. J. 2014, 78, 724. [Google Scholar] [CrossRef]
  17. Bagarello, V.; Di Prima, S.; Giordano, G.; Iovino, M. A Test of the Beerkan Estimation of Soil Transfer Parameters (BEST) Procedure. Geoderma 2014, 221–222, 20–27. [Google Scholar] [CrossRef]
  18. Di Prima, S.; Stewart, R.D.; Castellini, M.; Bagarello, V.; Najm, M.R.A.; Pirastru, M.; Giadrossich, F.; Iovino, M.; Angulo-Jaramillo, R.; Lassabatere, L. Estimating the Macroscopic Capillary Length from Beerkan Infiltration Experiments and Its Impact on Saturated Soil Hydraulic Conductivity Predictions. J. Hydrol. 2020, 589, 125159. [Google Scholar] [CrossRef]
  19. Lozano-Baez, S.E.; Domínguez-Haydar, Y.; Zwartendijk, B.W.; Cooper, M.; Tobón, C.; Di Prima, S. Contrasts in Top Soil Infiltration Processes for Degraded vs. Restored Lands. A Case Study at the Perijá Range in Colombia. Forests 2021, 12, 1716. [Google Scholar] [CrossRef]
  20. Di Prima, S.; Concialdi, P.; Lassabatere, L.; Angulo-Jaramillo, R.; Pirastru, M.; Cerdà, A.; Keesstra, S. Laboratory Testing of Beerkan Infiltration Experiments for Assessing the Role of Soil Sealing on Water Infiltration. CATENA 2018, 167, 373–384. [Google Scholar] [CrossRef]
  21. Lozano-Baez, S.E.; Cooper, M.; de Barros Ferraz, S.F.; Rodrigues, R.R.; Lassabatere, L.; Castellini, M.; Di Prima, S. Assessing Water Infiltration and Soil Water Repellency in Brazilian Atlantic Forest Soils. Appl. Sci. 2020, 10, 1950. [Google Scholar] [CrossRef] [Green Version]
  22. Lozano-Baez, S.; Cooper, M.; Ferraz, S.; Rodrigues, R.R.; Pirastru, M.; Di Prima, S. Previous Land Use Affects the Recovery of Soil Hydraulic Properties after Forest Restoration. Water 2018, 10, 453. [Google Scholar] [CrossRef] [Green Version]
  23. Lozano-Baez, S.E.; Cooper, M.; de Barros Ferraz, S.F.; Rodrigues, R.R.; Castellini, M.; Di Prima, S. Recovery of Soil Hydraulic Properties for Assisted Passive and Active Restoration: Assessing Historical Land Use and Forest Structure. Water 2019, 11, 86. [Google Scholar] [CrossRef] [Green Version]
  24. Lin, B.B. Agroforestry Management as an Adaptive Strategy against Potential Microclimate Extremes in Coffee Agriculture. Agric. For. Meteorol. 2007, 144, 85–94. [Google Scholar] [CrossRef]
  25. Alegre, J.C.; Cassel, D.K. Dynamics of Soil Physical Properties under Alternative Systems to Slash-and-Burn. Agric. Ecosyst. Environ. 1996, 58, 39–48. [Google Scholar] [CrossRef]
  26. Rigal, C.; Xu, J.; Vaast, P. Young Shade Trees Improve Soil Quality in Intensively Managed Coffee Systems Recently Converted to Agroforestry in Yunnan Province, China. Plant Soil 2020, 453, 119–137. [Google Scholar] [CrossRef]
  27. Leite, P.A.M.; de Souza, E.S.; dos Santos, E.S.; Gomes, R.J.; Cantalice, J.R.; Wilcox, B.P. The Influence of Forest Regrowth on Soil Hydraulic Properties and Erosion in a Semiarid Region of Brazil. Ecohydrology 2017, 11, 1–12. [Google Scholar] [CrossRef]
  28. De Carvalho, A.F.; Fernandes-Filho, E.I.; Daher, M.; de Gomes, L.C.; Cardoso, I.M.; Fernandes, R.B.A.; Schaefer, C.E.G.R. Microclimate and Soil and Water Loss in Shaded and Unshaded Agroforestry Coffee Systems. Agroforest Syst. 2021, 95, 119–134. [Google Scholar] [CrossRef]
  29. Valdivia, R.; Pilarte, F.; Espinoza, A. Evaluación Visual de Suelos, Instructivo 2; Catholic Relief Service: Baltimore, MD, USA, 2019. [Google Scholar]
  30. Sauvadet, M.; den Meersche, K.V.; Allinne, C.; Gay, F.; de Melo Virginio Filho, E.; Chauvat, M.; Becquer, T.; Tixier, P.; Harmand, J.-M. Shade Trees Have Higher Impact on Soil Nutrient Availability and Food Web in Organic than Conventional Coffee Agroforestry. Sci. Total Environ. 2019, 649, 1065–1074. [Google Scholar] [CrossRef]
  31. Gómez-Delgado, F.; Roupsard, O.; le Maire, G.; Taugourdeau, S.; Pérez, A.; van Oijen, M.; Vaast, P.; Rapidel, B.; Harmand, J.M.; Voltz, M.; et al. Modelling the Hydrological Behaviour of a Coffee Agroforestry Basin in Costa Rica. Hydrol. Earth Syst. Sci. 2011, 15, 369–392. [Google Scholar] [CrossRef] [Green Version]
  32. Peel, M.C.; Finlayson, B.L.; McMahon, T.A. Updated World Map of the Ko¨ppen-Geiger Climate Classification. Hydrol. Earth Syst. Sci. 2007, 12, 1633–1644. [Google Scholar] [CrossRef] [Green Version]
  33. The Global Historical Weather and Climate Data Santa Rosa, GT Climate Zone, Monthly Weather Averages and Historical Data. Available online: https://tcktcktck.org/guatemala/santa-rosa (accessed on 23 May 2022).
  34. Gil Villalba, S. Estudio Hidrológico de la Cuenca del río Los Esclavos; ICC (Instituto Privado de Investigación sobre Cambio Climático): Santa Lucía Cotzumalguapa, Guatemala, 2012; p. 67. [Google Scholar]
  35. Irungaray, G.E.P.; Gándara, G.A.; Monzón, J.C.R.; Ibarra, R.E.M.; Ruano, J.G. Ecosistemas de Guatemala, una aproximación basada en el sistema de clasificación de Holdridge. Revista Eutopía 2016, 44, 25–68. [Google Scholar]
  36. Adhikari, D.; Tiwary, R.; Singh, P.P.; Upadhaya, K.; Singh, B.; Haridasan, K.E.; Bhatt, B.B.; Chettri, A.; Barik, S.K. Ecological Niche Modeling as a Cumulative Environmental Impact Assessment Tool for Biodiversity Assessment and Conservation Planning: A Case Study of Critically Endangered Plant Lagerstroemia Minuticarpa in the Indian Eastern Himalaya. J. Environ. Manag. 2019, 243, 299–307. [Google Scholar] [CrossRef] [PubMed]
  37. Medina, B. Desarrollo de Guía Educativa Dirigida a Docentes para el Mejoramiento del Medio Ambiente, Clima y Sistemas Agroforestales en Plantaciones de café.; PUR Projet, FEDECOCAGUA R.L.: Santa Lucía Cotzumalguapa, Guatemala, 2020. [Google Scholar]
  38. Nagahage, E.A.A.D.; Nagahage, I.S.P.; Fujino, T. Calibration and Validation of a Low-Cost Capacitive Moisture Sensor to Integrate the Automated Soil Moisture Monitoring System. Agriculture 2019, 9, 141. [Google Scholar] [CrossRef] [Green Version]
  39. Rankoth, L.M.; Udawatta, R.P.; Anderson, S.H.; Gantzer, C.J.; Alagele, S. Cover Crop Influence on Soil Water Dynamics for a Corn–Soybean Rotation. Agrosyst. Geosci. Environ. 2021, 4, e20175. [Google Scholar] [CrossRef]
  40. Bermúdez- Flórez, L.N.; Cartagena-Valenzuela, J.R.; Ramírez- Builes, V.H. Soil Humidity and Evapotranspiration under Three Coffee (Coffea Arabica L.) Planting Densities at Naranjal Experimental Station (Chinchiná, Caldas, Colombia). Acta Agron. 2018, 67, 402–413. [Google Scholar] [CrossRef]
  41. Moroizumi, T.; Horino, H. The Effects of Tillage on Soil Temperature and Soil Water. Soil Sci. 2002, 167, 548–559. [Google Scholar] [CrossRef]
  42. Rstudio Team. RStudio: Integrated Development Environment for R. RStudio; RStudio, PBC: Boston, MA, USA, 2020. [Google Scholar]
  43. Marín-Castro, B.E.; Negrete-Yankelevich, S.; Geissert, D. Litter Thickness, but Not Root Biomass, Explains the Average and Spatial Structure of Soil Hydraulic Conductivity in Secondary Forests and Coffee Agroecosystems in Veracruz, Mexico. Sci. Total Environ. 2017, 607–608, 1357–1366. [Google Scholar] [CrossRef]
  44. Cannavo, P.; Sansoulet, J.; Harmand, J.-M.; Siles, P.; Dreyer, E.; Vaast, P. Agroforestry Associating Coffee and Inga Densiflora Results in Complementarity for Water Uptake and Decreases Deep Drainage in Costa Rica. Agric. Ecosyst. Environ. 2011, 140, 1–13. [Google Scholar] [CrossRef]
  45. Ilstedt, U.; Malmer, A.; Verbeeten, E.; Murdiyarso, D. The Effect of Afforestation on Water Infiltration in the Tropics: A Systematic Review and Meta-Analysis. For. Ecol. Manag. 2007, 251, 45–51. [Google Scholar] [CrossRef]
  46. Ilstedt, U.; Tobella, A.B.; Bazié, H.R.; Bayala, J.; Verbeeten, E.; Nyberg, G.; Sanou, J.; Benegas, L.; Murdiyarso, D.; Laudon, H.; et al. Intermediate Tree Cover Can Maximize Groundwater Recharge in the Seasonally Dry Tropics. Sci. Rep. 2016, 6, 1–12. [Google Scholar] [CrossRef] [PubMed] [Green Version]
  47. Bormann, H.; Klaassen, K. Seasonal and Land Use Dependent Variability of Soil Hydraulic and Soil Hydrological Properties of Two Northern German Soils. Geoderma 2008, 145, 295–302. [Google Scholar] [CrossRef]
  48. Lozano-Baez, S.E.; Cooper, M.; Meli, P.; Ferraz, S.F.B.; Rodrigues, R.R.; Sauer, T.J. Land Restoration by Tree Planting in the Tropics and Subtropics Improves Soil Infiltration, but Some Critical Gaps Still Hinder Conclusive Results. For. Ecol. Manag. 2019, 444, 89–95. [Google Scholar] [CrossRef]
  49. Ziegler, A.D.; Giambelluca, T.W.; Tran, L.T.; Vana, T.T.; Nullet, M.A.; Fox, J.; Vien, T.D.; Pinthong, J.; Maxwell, J.F.; Evett, S. Hydrological Consequences of Landscape Fragmentation in Mountainous Northern Vietnam: Evidence of Accelerated Overland Flow Generation. J. Hydrol. 2004, 287, 124–146. [Google Scholar] [CrossRef]
  50. Martínez, L.J.; Zinck, J.A. Temporal Variation of Soil Compaction and Deterioration of Soil Quality in Pasture Areas of Colombian Amazonia. Soil Tillage Res. 2004, 75, 3–18. [Google Scholar] [CrossRef]
  51. De Souza, G.S.; Alves, D.I.; Dan, M.L.; de Souza Lima, J.S.; da Fonseca, A.L.C.C.; Araújo, J.B.S.; de Oliveira Prata Guimarães , L.A. Soil Physico-Hydraulic Properties under Organic Conilon Coffee Intercropped with Tree and Fruit Species. Pesq. Agropec. Bras. 2017, 52, 539–547. [Google Scholar] [CrossRef] [Green Version]
  52. Karki, U.; Goodman, M.S. Microclimatic Differences between Young Longleaf-Pine Silvopasture and Open-Pasture. Agroforest Syst 2013, 87, 303–310. [Google Scholar] [CrossRef]
  53. Camargo, M.B.P. de The Impact of Climatic Variability and Climate Change on Arabic Coffee Crop in Brazil. Bragantia 2010, 69, 239–247. [Google Scholar] [CrossRef]
  54. Tumwebaze, S.B.; Byakagaba, P. Soil Organic Carbon Stocks under Coffee Agroforestry Systems and Coffee Monoculture in Uganda. Agric. Ecosyst. Environ. 2016, 216, 188–193. [Google Scholar] [CrossRef]
  55. Barradas, V.L.; Fanjul, L. Microclimatic Chacterization of Shaded and Open-Grown Coffee (Coffea Arabica L.) Plantations in Mexico. Agric. For. Meteorol. 1986, 38, 101–112. [Google Scholar] [CrossRef]
  56. Siles, G.; Rey, P.J.; Alcántara, J.M.; Bastida, J.M.; Herreros, J.L. Effects of Soil Enrichment, Watering and Seedling Age on Establishment of Mediterranean Woody Species. Acta Oecologica 2010, 36, 357–364. [Google Scholar] [CrossRef]
  57. Avelino, J.; Zelaya, H.; Merlo, A.; Pineda, A.; Ordoñez, M.; Savary, S. The Intensity of a Coffee Rust Epidemic Is Dependent on Production Situations. Ecol. Model. 2006, 197, 431–447. [Google Scholar] [CrossRef]
  58. Jaramillo, J.; Muchugu, E.; Vega, F.E.; Davis, A.; Borgemeister, C.; Chabi-Olaye, A. Some Like It Hot: The Influence and Implications of Climate Change on Coffee Berry Borer (Hypothenemus Hampei) and Coffee Production in East Africa. PLoS ONE 2011, 6, e24528. [Google Scholar] [CrossRef] [PubMed] [Green Version]
  59. do Silva, M.C.; Várzea, V.; Guerra-Guimarães, L.; Azinheira, H.G.; Fernandez, D.; Petitot, A.-S.; Bertrand, B.; Lashermes, P.; Nicole, M. Coffee Resistance to the Main Diseases: Leaf Rust and Coffee Berry Disease. Braz. J. Plant Physiol. 2006, 18, 119–147. [Google Scholar] [CrossRef] [Green Version]
  60. Barham, B.L.; Weber, J.G. The Economic Sustainability of Certified Coffee: Recent Evidence from Mexico and Peru. World Dev. 2012, 40, 1269–1279. [Google Scholar] [CrossRef]
  61. Rahn, E.; Läderach, P.; Baca, M.; Cressy, C.; Schroth, G.; Malin, D.; van Rikxoort, H.; Shriver, J. Climate Change Adaptation, Mitigation and Livelihood Benefits in Coffee Production: Where Are the Synergies? Mitig. Adapt. Strat. Glob Chang. 2014, 19, 1119–1137. [Google Scholar] [CrossRef] [Green Version]
  62. Meza, L.E.R. Adaptive Capacity of Small-Scale Coffee Farmers to Climate Change Impacts in the Soconusco Region of Chiapas, Mexico. Clim. Dev. 2015, 7, 100–109. [Google Scholar] [CrossRef]
  63. Philpott, S.M.; Lin, B.B.; Jha, S.; Brines, S.J. A Multi-Scale Assessment of Hurricane Impacts on Agricultural Landscapes Based on Land Use and Topographic Features. Agric. Ecosyst. Environ. 2008, 128, 12–20. [Google Scholar] [CrossRef]
  64. Sepúlveda, R.B.; Carrillo, A.A. Soil Erosion and Erosion Thresholds in an Agroforestry System of Coffee (Coffea Arabica) and Mixed Shade Trees (Inga Spp and Musa Spp) in Northern Nicaragua. Agric. Ecosyst. Environ. 2015, 210, 25–35. [Google Scholar] [CrossRef]
  65. Zwartendijk, B.W.; van Meerveld, H.J.; Ghimire, C.P.; Bruijnzeel, L.A.; Ravelona, M.; Jones, J.P.G. Rebuilding Soil Hydrological Functioning after Swidden Agriculture in Eastern Madagascar. Agric. Ecosyst. Environ. 2017, 239, 101–111. [Google Scholar] [CrossRef] [Green Version]
  66. Ghimire, C.P.; Bruijnzeel, L.A.; Bonell, M.; Coles, N.; Lubczynski, M.W.; Gilmour, D.A. The Effects of Sustained Forest Use on Hillslope Soil Hydraulic Conductivity in the Middle Mountains of Central Nepal: Sustained Forest Use And Soil Hydraulic Conductivity. Ecohydrology 2014, 7, 478–495. [Google Scholar] [CrossRef]
Figure 1. Map of the study area within the department of Santa Rosa, Guatemala, and the location of the study sites land uses. Coffee Control, newly shade-grown coffee; Coffee Native, 30-year-old shade-grown coffee; Coffee PUR, seven-year-old shade-grown coffee; Pasture, non-commercial pasture.
Land 12 00390 g001
Figure 2. Pictures showing the vegetation and the topsoil for each study site. CC, newly shade-grown coffee; CN, 30-year-old shade-grown coffee; CP, seven-year-old shade-grown coffee; PR, non-commercial pasture.
Land 12 00390 g002
Figure 3. Land-use history of cover types. CC, newly shade-grown coffee; CN, 30-year-old shade-grown coffee; CP, seven-year-old shade-grown coffee; PR, non-commercial pasture.
Land 12 00390 g003
Figure 4. Boxplot of the natural log-transformed saturated soil hydraulic conductivity (Ks), for each land-use type. Different superscript letters (a, b, c) denote statistically significant differences between land-cover types (p < 0.05). CC, newly shade-grown coffee; CN, 30-year-old shade-grown coffee; CP, seven-year-old shade-grown coffee; PR, non-commercial pasture.
Land 12 00390 g004
Figure 5. Boxplot of (A) volumetric water content (cm3 cm−3), (B) temperature above leaf litter (°C), (C) temperature below leaf litter (°C), and (D) temperature difference (°C), for each land-use type. Different superscript letters denote statistically significant differences between land-cover types (p < 0.05). CC, newly shade-grown coffee; CN, 30-year-old shade-grown coffee; CP, seven-year-old shade-grown coffee; PR, non-commercial pasture.
Land 12 00390 g005
Figure 6. Scatterplot showing the scores for the visual soil assessment for each land-use type using the visual assessment guideline developed by the Catholic Relief Service for coffee soils in Guatemala. CC, newly shade-grown coffee; CN, 30-year-old shade-grown coffee; CP, seven-year-old shade-grown coffee; PR, non-commercial pasture.
Land 12 00390 g006
Table 1. Mean monthly temperature and precipitation of Santa Rosa de Lima, Guatemala, for the months of January, February, March, and April of the year 2022. T° max: maximal temperature; T° min: minimum temperature.
MonthT° MaxT° MinRainfall (mm)Solar Radiation Max
January33.19.38.5226.3
February33.1210.820.5323.5
March34.011.823.1278.3
April35.112.028.4292.2
Table 2. Mean vegetation characteristics ± standard error (and standard deviation) of shadow trees. Different superscript letters (a, b) denote statistically significant differences between land-cover types (p < 0.05). CN, 30-year-old shade-grown coffee; CP, seven-year-old shade-grown coffee.
VariableCNCP
Canopy cover (%)63.8 ± 1.10 a (6.97)25.5 ± 0.87 b (5.50)
Vegetation height of tree (m)11.38 ± 1.69 a (4.78)9.93 ± 0.72 a (1.75)
DBH (m)0.53 ± 0.10 a (0.29)0.50 ± 0.45 a (0.11)
Total number of trees86
Table 3. Soil cover distribution in live biomass, dead biomass, and bare soil for each land-use type. CC, newly shade-grown coffee; CN, 30-year-old shade-grown coffee; CP, seven-year-old shade-grown coffee; PR, non-commercial pasture.
Soil CoverLive Biomass (%)Dead Biomass (%)Bare Soil (%)
CC302050
CN28702
CP21709
PR10000
Table 4. Mean values for bulk density (ρb in g cm−3), field capacity (θfc in cm3 cm−3), permanent wilting point (θpm in cm3 cm−3), soil particle size distribution, textural class according to the USDA classification, and pH of the depth 0–30 cm for each land use type. CC, newly shade-grown coffee; CN, 30-year-old shade-grown coffee; CP, seven-year-old shade-grown coffee; PR, non-commercial pasture.
LUSρbθfc θpm Clay (%)Silt (%)Sand (%)pHTextural Class
CC1.110.22270.13596.618.175.24.8Sandy loam
CN1.180.25410.138928.724.445.84.7Sandy clay loam
CP1.110.21960.120321.322.755.94.4Sandy clay loam
PR1.050.32070.200833.930.735.35.0Sandy clay loam
Table 5. Minimum (min), maximum (max), mean and coefficient of variation (CV) of saturated soil hydraulic conductivity (Ks), volumetric water content (VWC), temperature above leaf litter (TAL), temperature below leaf litter (TBL), and temperature difference (TD), for each study site. CC, newly shade-grown coffee; CN, 30-year-old shade-grown coffee; CP, seven-year-old shade-grown coffee; PR, non-commercial pasture. Different superscript letters (a, b, c) denote statistically significant differences.
VariableLand-Use TypeMinMaxMeanCV
Ks (mm h−1)CC43.1502224 b54
CN54.42185688 a87
CP8.916075.5 cd61
CP18.916047.3 d92
CP266.2146103.8 bc27
PR51.91004302 b100
VWC (cm3 cm−3)CC0.20.60.36 b38
CN0.11.00.56 ab52
CP0.21.50.62 a55
PR0.11.30.50 ab63
TAL (°C)CC35.153.441.8 a11
CN24.643.631.0 b19
CP27.754.138.8 a18
PR33.445.539.7 a10
TBL (°C)CC35.153.441.8 a11
CN21.92923.8 c7
CP22.629.625.0 c7
PR28.44234.8 b12
TD (°C)CC----
CN1.118.37.3 b70
CP4.928.813.8 a44
PR0.39.74.9 b55
Table 6. Detailed scores for each parameter in the visual soil assessment elaborated by the Catholic Relief Service, for each land-use type. CC, newly shade-grown coffee; CN, 30-year-old shade-grown coffee; CP, seven-year-old shade-grown coffee; PR, non-commercial pasture.
Land-Use TypePlotStructurePorosityColorMottledEarthwormsCompactionSoil CoverDepthTotal Score
CCi2221013011
ii2321012012
CNi3442016222
i4422223019
ii3432016322
CPi3222015015
ii3223015319
PRi3422013015
ii3422013015
Highest score possible6442426634
Disclaimer/Publisher’s Note: The statements, opinions and data contained in all publications are solely those of the individual author(s) and contributor(s) and not of MDPI and/or the editor(s). MDPI and/or the editor(s) disclaim responsibility for any injury to people or property resulting from any ideas, methods, instructions or products referred to in the content.

