Article

Variation in Soil Aggregate Stability Due to Land Use Changes from Alpine Grassland in a High-Altitude Watershed

1
State Key Laboratory of Plateau Ecology and Agriculture, Qinghai University, Xining 810016, China
2
College of Agriculture and Animal Husbandry, Qinghai University, Xining 810016, China
*
Author to whom correspondence should be addressed.
Land 2023, 12(2), 393; https://doi.org/10.3390/land12020393
Submission received: 26 December 2022 / Revised: 25 January 2023 / Accepted: 29 January 2023 / Published: 1 February 2023

Abstract

:
Land use change affects soil aggregate composition and stability, which impacts soil structure and health. To reveal how land use change impacted soil aggregates of alpine grassland in a high-altitude watershed, soil samples from 161 sites including alpine grassland, cropland and abandoned land were selected to measure and analyze the distribution of aggregate fractions (macro-aggregates, micro-aggregates, silt+clay), soil aggregate stability (mean weight diameter, geometric mean diameter, fractal dimension, etc.) and related soil properties (soil organic carbon content, soil particle composition, etc.) in the Huangshui River watershed of the Qinghai–Tibet Plateau. The results showed: (1) As alpine grasslands were converted to croplands and croplands to abandoned lands, the proportion of macro-aggregates and the aggregate stability index showed a trend of first decreasing and then increasing (p < 0.05), indicating that tillage and abandonment have significant influences on soil aggregate structure. (2) Compared with temperate grassland, alpine grassland had richer soil organic carbon, and a higher ratio of macro-aggregates and aggregate stability. (3) Soil organic carbon and sand content had distinct influences on the fractions and stability of aggregates during land use change. These results suggested that cultivation can substantially reduce the soil aggregate stability in alpine grassland, whereas abandonment can effectively improve soil aggregate structure.

1. Introduction

Soil aggregates are the fundamental structural units that govern the dynamics of soil organic matter (SOM) and nutrient cycling [1,2]. Aggregate stability is a vital index to measure soil structure and physical shape, while evaluation methods mainly include the soil structure stability index (SI), mean weight diameter (MWD), geometric mean diameter (GMD), fractal dimension (D) and the proportion of >0.25 mm aggregates (R0.25) [2]. Soil aggregates and their stability are pivotal for soil carbon storage, soil porosity, compactness, water retention, soil water conductivity and erosion resistance [3,4,5,6]. A robust soil structure can markedly improve soil microbial community structure, enrich biodiversity, promote nutrient cycling and reduce soil carbon emissions [7,8].
Soil aggregate and its stability are closely related to soil particle composition, SOM, land use type and root characteristics [9,10,11]. Specifically, clay can adsorb more organic matter and humus, resist soil microorganisms decomposing organic carbon and accelerate aggregate formation and stabilization [12]. SOM, the main cementing agent of soil aggregates, is positively correlated with soil aggregate stability [13]. For land use types, there were statistically significant differences in aggregate structure characteristics between forest, shrubland, grassland and cropland [9]. In general, the content of macro-aggregates in forest, shrubland and grassland are higher than that in cropland, so the aggregate stability of cropland is lower [14]. Roots make a major contribution to SOM formation and can enhance soil aggregation through physical entanglement or exudates of cementing substances [11]. Previous studies on soil aggregates mainly focused on the effects of land use types on aggregates and their stability, including the conversion of other ecosystems to cropland, cropland to artificial grassland or natural grassland, and cropland to economic forest or secondary forest [9,15,16]. However, there are few reports on soil aggregates and their stability when alpine grassland is converted to cropland or abandoned land.
Alpine grassland is the main vegetation type in high-altitude regions [17,18,19]. Due to the frigid climate, alpine grassland has low soil microbial activity, high root biomass and rich soil organic carbon (SOC) content [20,21], which are closely related to soil aggregates [22,23]. With the development of alpine agriculture, alpine grassland has been converted to cropland and even to abandoned land [17]. So far, studies on soil aggregates in the conversion of grassland to cropland and abandoned land have mainly focused on temperate grassland [24,25,26]. Concretely, the research of Zhu et al. (2017) on the Loess Plateau found that the SOC content in natural grassland was apparently richer than that in forest, and the carbon addition of grassland could promote the soil aggregate stability [26]. Wang et al. (2018) supported the idea that temperate grasslands that succeeded on abandoned land had higher organic matter and more soil macro-aggregates than cropland [24]. Xiao et al. (2020) suggested that plant roots exert the most significant impact on aggregate stability by studying soil aggregates in temperate grasslands that were converted from abandoned land with different secondary succession gradients [25]. Studies on soil aggregates and their stability due to land use changes from alpine grassland are rarely reported, leading to the fact that the impact mechanism of land use changes from alpine grassland on soil aggregate changes has not been clarified.
The study area lies within the Huangshui River watershed of the Qinghai–Tibet Plateau, where the mean altitude was 2831 m, covering an overall area of 1.61 × 10⁴ km2, with cropland accounting for 32.50% and the grassland area accounting for 43.73% [27]. Because of the economy’s development, a large number of alpine grasslands were reclaimed as cropland, but due to the “Grain for Green Project” and other reasons, a certain amount of cropland was abandoned [28,29]. Therefore, this study selected alpine grassland, cropland and abandoned land as the research objectives and compared and analyzed changes in soil aggregate fractions and stability in order to achieve the following goals: (1) reveal the variation characteristics of soil aggregate composition and stability in the process of land use transformation; (2) explore the relationship between soil aggregate characteristics and soil properties; (3) identify the impact of reclamation and abandonment on soil aggregates in alpine grassland. At the same time, this study can provide data support for the rational utilization of land resources in high-altitude watershed scales and deepen the understanding of soil protection mechanisms, which can provide a theoretical basis for local managers to carry out their work effectively.

2. Materials and Methods

2.1. Study Area

The study area falls within the Huangshui River watershed (100°42′–103°40′ E, 36°20′–37°28′ N) on the eastern portion of the Qinghai–Tibet Plateau, generally encompassing 1.61 × 10⁴ km2 (Figure 1). It is a transitional area between the Tibetan and Loess plateaus, with an elevation ranging from 1578 to 4834 m. The annual mean temperature is 0.6–7.9 °C, the annual mean sunshine hours is 2430.8–2666.7 h and the annual precipitation is 30–600 mm. The soil type in the watershed is primarily chestnut soil. Apart from some forests, alpine grassland is the main native vegetation type, accounting for 43.73% of the total watershed area, while cropland is widely distributed on both sides of the river valley, accounting for 32.50% of the study area [27]. The main crops in the watershed are spring wheat (Triticum aestivum Linn.), spring maize (Zea mays L.), potato (Solanum tuberosum L.), spring rape (Brassica campestris L.) and spring beans (Glycine max (Linn.) Merr.). In addition, barley and forage crops are planted in areas with higher altitudes.

2.2. Experimental Design and Field Sampling

In April 2021, the sampling sites were ascertained according to the spatial distribution and relative acreage of alpine grasslands, cropland, and abandoned land in the Huangshui River watershed. Because of the high mountains and gullies in the catchment, it was not possible to collect all the sampling points that were set up; a total of 161 sampling sites were finally selected (Figure 1). There are 30 sampling sites of alpine grassland, 94 sampling sites of cropland and 37 sampling sites of abandoned land. At each sampling site, two unperturbed soil blocks (9 cm in diameter and 20 cm in height) were taken from the 0–20 cm and 20–40 cm soil layers, totaling 322 samples. Land use types were surveyed before sampling, and field management surveys were investigated by interviewing local farmers. All soil samples were stored for further analysis after being air-dried in the laboratory.
The air-dried soil samples were screened through a 7 mm sieve for removing large gravel and removing visible pieces of organically grown matter. From each site, 200 g of air-dried soil samples were taken, which were isolated by wet sieving to obtain macro-aggregates (>0.25 mm), micro-aggregates (0.25–0.053 mm) and silt+clay (0.053 mm), then dried in an oven at 45 °C for more than 24 h and weighed [30]. A small amount of air-dried soil sample was collected from each plot and passed through a 1 mm sieve for measuring total SOC content and soil pH. In addition, a certain volume of soil sample (9 cm in diameter, 20 cm in height) was positioned on a 1 mm sieve and washed with running water to obtain fine roots. These roots were oven-dried at 65 °C for 48 h, and weighed to calculate the dry weight density.
The SOC was determined with a mixture of concentrated sulfuric acid and potassium dichromate (K2Cr2O7–H2SO4) [31]. The soil pH was measured in a 1:2.5 (soil:water) suspension [32]. Soil particle size composition was determined using a Mastersizer 3000 (Malvern Instruments, Malvern, UK).

2.3. Data Analysis

The impacts of land use change on soil stability were evaluated in terms of their MWD, GMD, D, R0.25 and SI values. Equations for the first two are as follows:
MWD = i = 1 n x i × w i
GMD = exp [ i = 1 n w i × l n x i i = 1 n w i ]
where xi is the average diameter of the aggregate class (mm) and wi is the proportion of each aggregate class in relation to the total aggregate weight.
[ d ¯ i d m a x ] 3 D = W ( r < x i ¯ ) W 0
where D is the fractal dimension, d ¯ i is the mean aggregate diameter (mm) of the ith size class, d m a x is the average diameter of the largest aggregate, W ( r < x i ¯ ) is the accumulated mass of aggregates of the ith size less than d m a x and W 0 is the total mass of the aggregates.
SI = 1.274 × S O C s i l t + c l a y × 100
where SI is the soil structure stability index, SOC is the soil organic carbon (g kg−1), silt is the silt content (%) and clay is the clay content (%).

2.4. Statistical Analysis

One-way ANOVA analysis with a follow-up LSD test was performed to determine whether the soil physicochemical properties, aggregate fraction and soil particle composition differed significantly between land use types. The effects of land use type, soil depth and their interaction on soil properties and aggregate stability were tested using two-way ANOVA. A linear model for multiple factors influencing aggregate stability with land use change was established using stepwise multiple regression. The mean and standard error of each land use type were determined using soil from each sampling location as a replicate. All statistical analyses were performed in IBM SPSS Statistics version 25 and plotted with Origin-Pro 2021.

3. Results

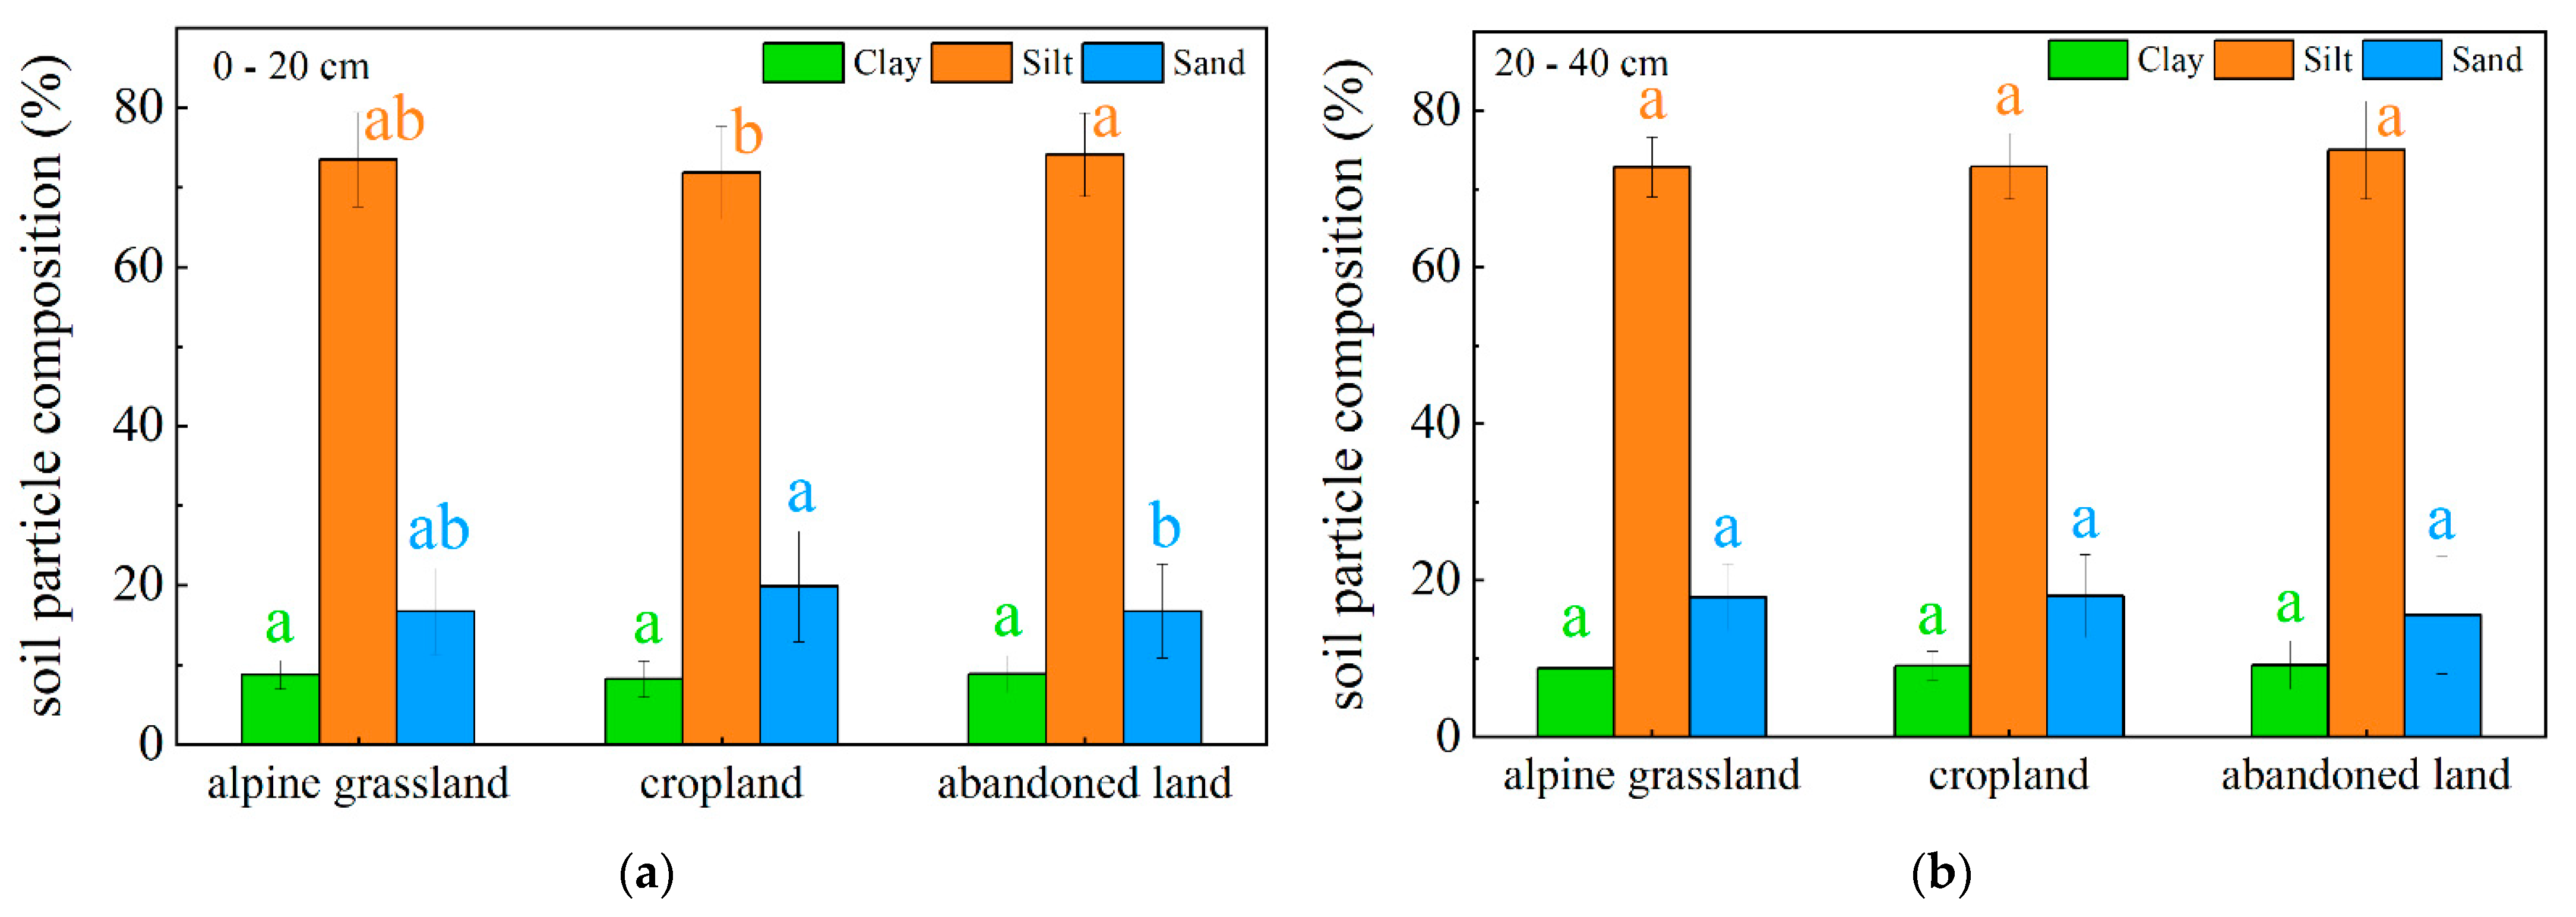
3.1. Soil Characteristics

The differences in soil pH, root dry weight density (RDWD) and SOC content between alpine grassland, cropland and abandoned land were significant (p < 0.05). However, there were no significant differences in median particle size (D50) and volume fractal dimension (Dv) in different land use types (p > 0.05) (Table 1). The soil pH of alpine grassland was significantly lower than that of cropland and abandoned land, and the soil pH of abandoned land was the highest, whether in the 0–20 cm or 20–40 cm layers (p < 0.05) (Table 1). At the same time, the RDWD and SOC of alpine grassland were significantly higher than those of cropland and abandoned land (p < 0.05), and there was no significant difference in SOC and RDWD between cropland and abandoned land (p > 0.05) (Table 1). Two-way ANOVA showed that SOC was significantly affected by land use type, soil depth and their interaction (p < 0.05) (Table 2).
In the 0–20 cm soil layer, silt and sand were significantly different between cropland and abandoned land (p < 0.05) (Figure 2). However, the distribution of clay, silt and sand in the 20–40 cm soil layer showed no remarkable difference (p > 0.05) (Figure 2). In general, silt and sand were significantly affected by land use type (p < 0.05), though clay was not (p > 0.05) (Table 2).

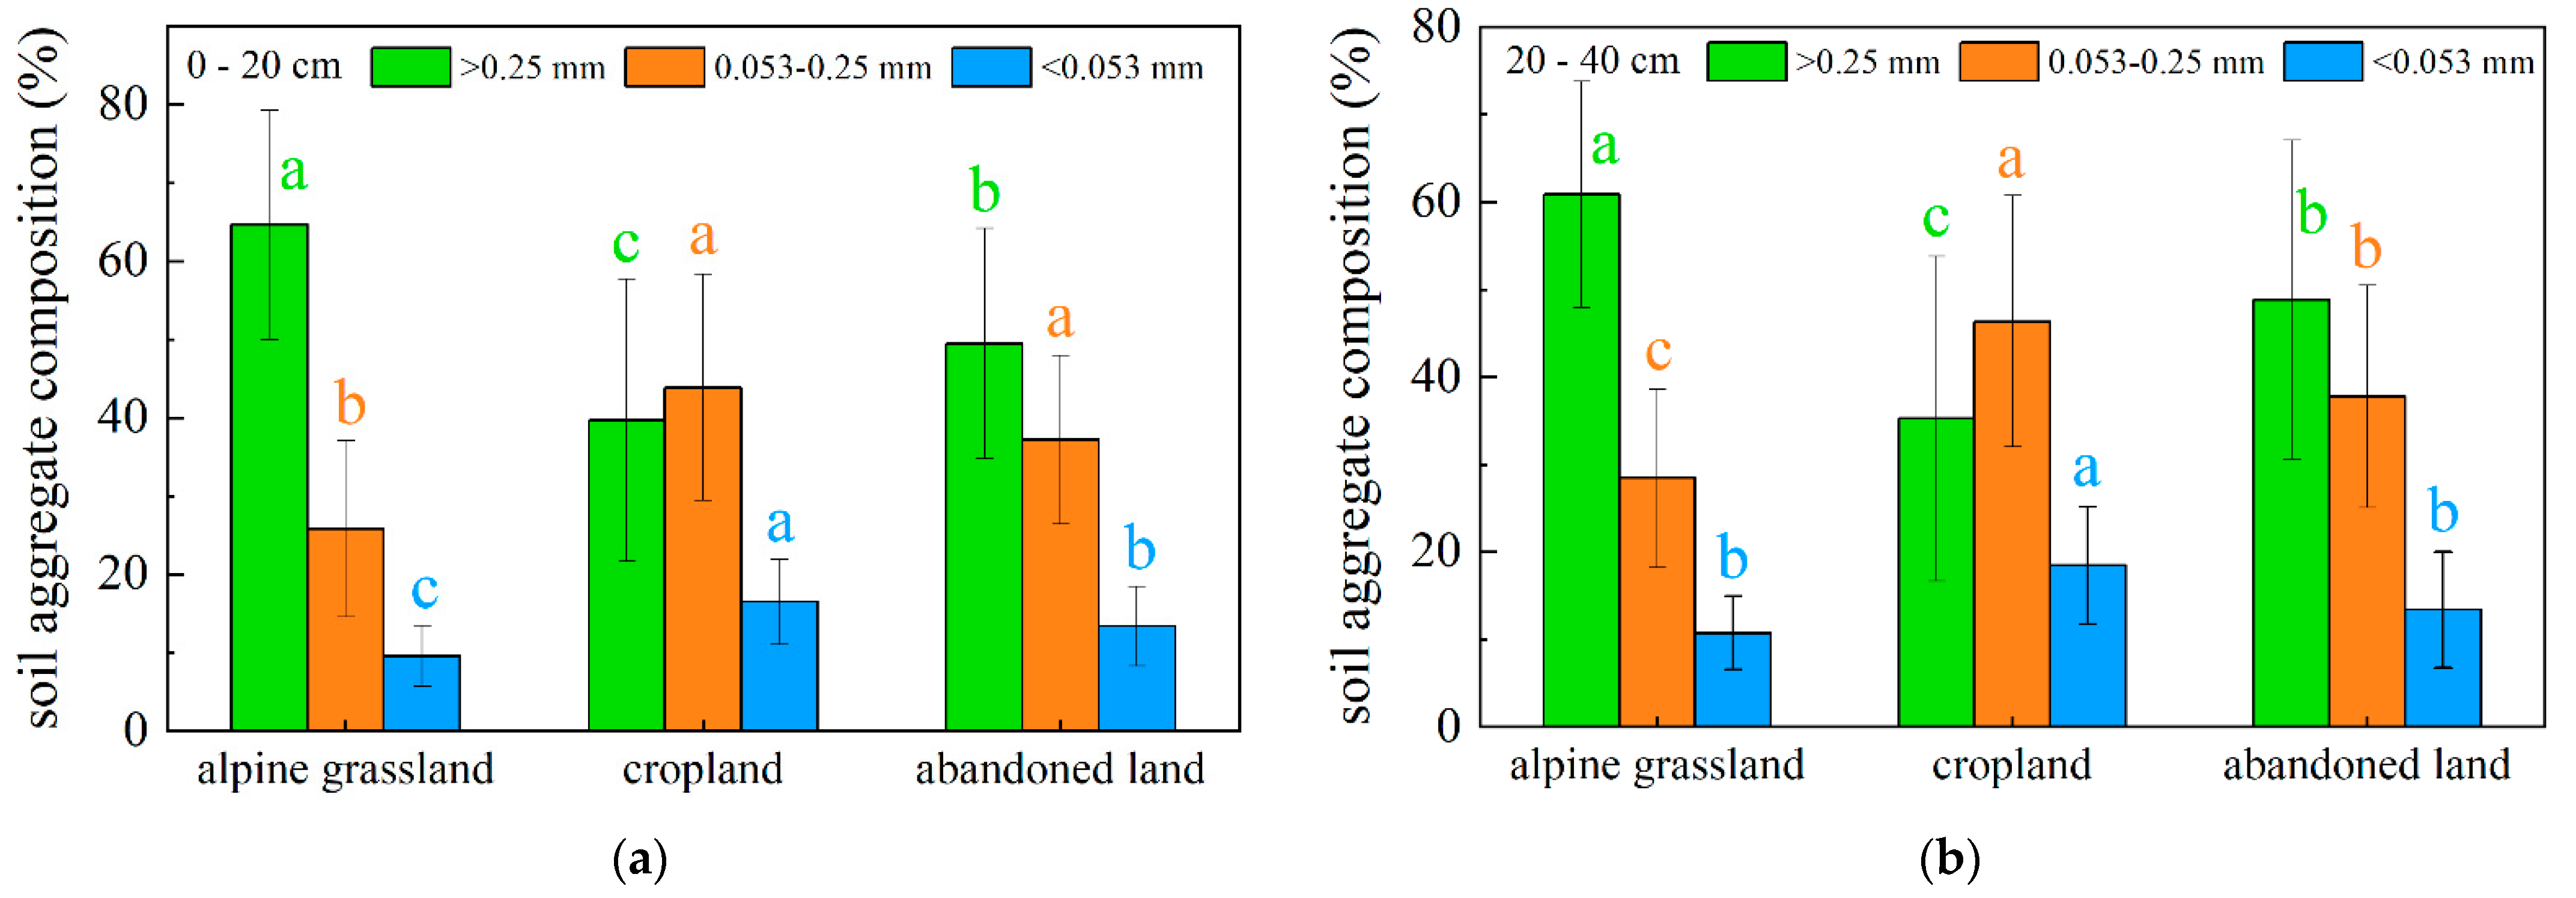
3.2. Variation Characteristics of Soil Aggregates

In this study, the SI index was used to evaluate the accuracy of the wet sieving method. MWD, GMD and D were calculated in light of results from each fraction of soil aggregate size. Because the SI was significantly correlated with the soil aggregate stability index, the wet sieving method was deemed accurate for estimating MWD, GMD, D and R0.25 (Figure 3).
In the 0–20 cm soil layer, the relative abundance of macro-aggregates (>0.25 mm) was the greatest in alpine grassland, followed by abandoned land, and the least in cropland (Figure 4a). The proportions of macro-aggregates in alpine grassland, abandoned land and cropland were 64.62%, 49.48% and 39.69%, respectively. Macro-aggregates were significantly reduced in proportion when the alpine grassland was converted to cropland (p < 0.05), but when the latter was abandoned, macro-aggregates significantly increased (p < 0.05). However, abandoned land still harbored a noticeably lower proportion of macro-aggregates than alpine grassland (p < 0.05) (Figure 4a). Similar patterns were found in the 20–40 cm soil layer for the relative distribution of macro-aggregates.
Micro-aggregates (0.053–0.25 mm) and silt+clay (<0.053 mm) were converted from macro-aggregates after crushing, and had an opposite distribution trend to that of macro-aggregates. The distribution of micro-aggregates and silt+clay in the 0–20 and 20–40 cm soil layers was highest in cropland, followed by abandoned land, and lowest in alpine grassland. In the 0–20 cm soil layer, there was no remarkable difference in the distribution of micro-aggregates between cropland and abandoned land (p > 0.05). In the 20–40 cm soil layer, the proportion of silt+clay in the abandoned land was slightly higher than that in the alpine grassland, but the difference was not significant (p > 0.05) (Figure 4a,b).
Figure 5 shows the stability indices of soil aggregates under various land use types. In the 0–20 cm layer, the MWD differed typically between the three land use types, being highest in alpine grassland and lowest in cropland (p < 0.05) (Figure 5a). The values of GMD and R0.25 exhibited patterns closely resembling that of MWD and were also characterized by significant differences between the land use types (p < 0.05) (Figure 5b,d). The D values in the entire soil layers differed significantly between land use types, with alpine grassland having the lowest, abandoned land having the second lowest, and cropland having the highest (p < 0.05) (Figure 5c). In summary, the soil aggregate stability under different land use types decreased in the order of alpine grassland > abandoned land > cropland.

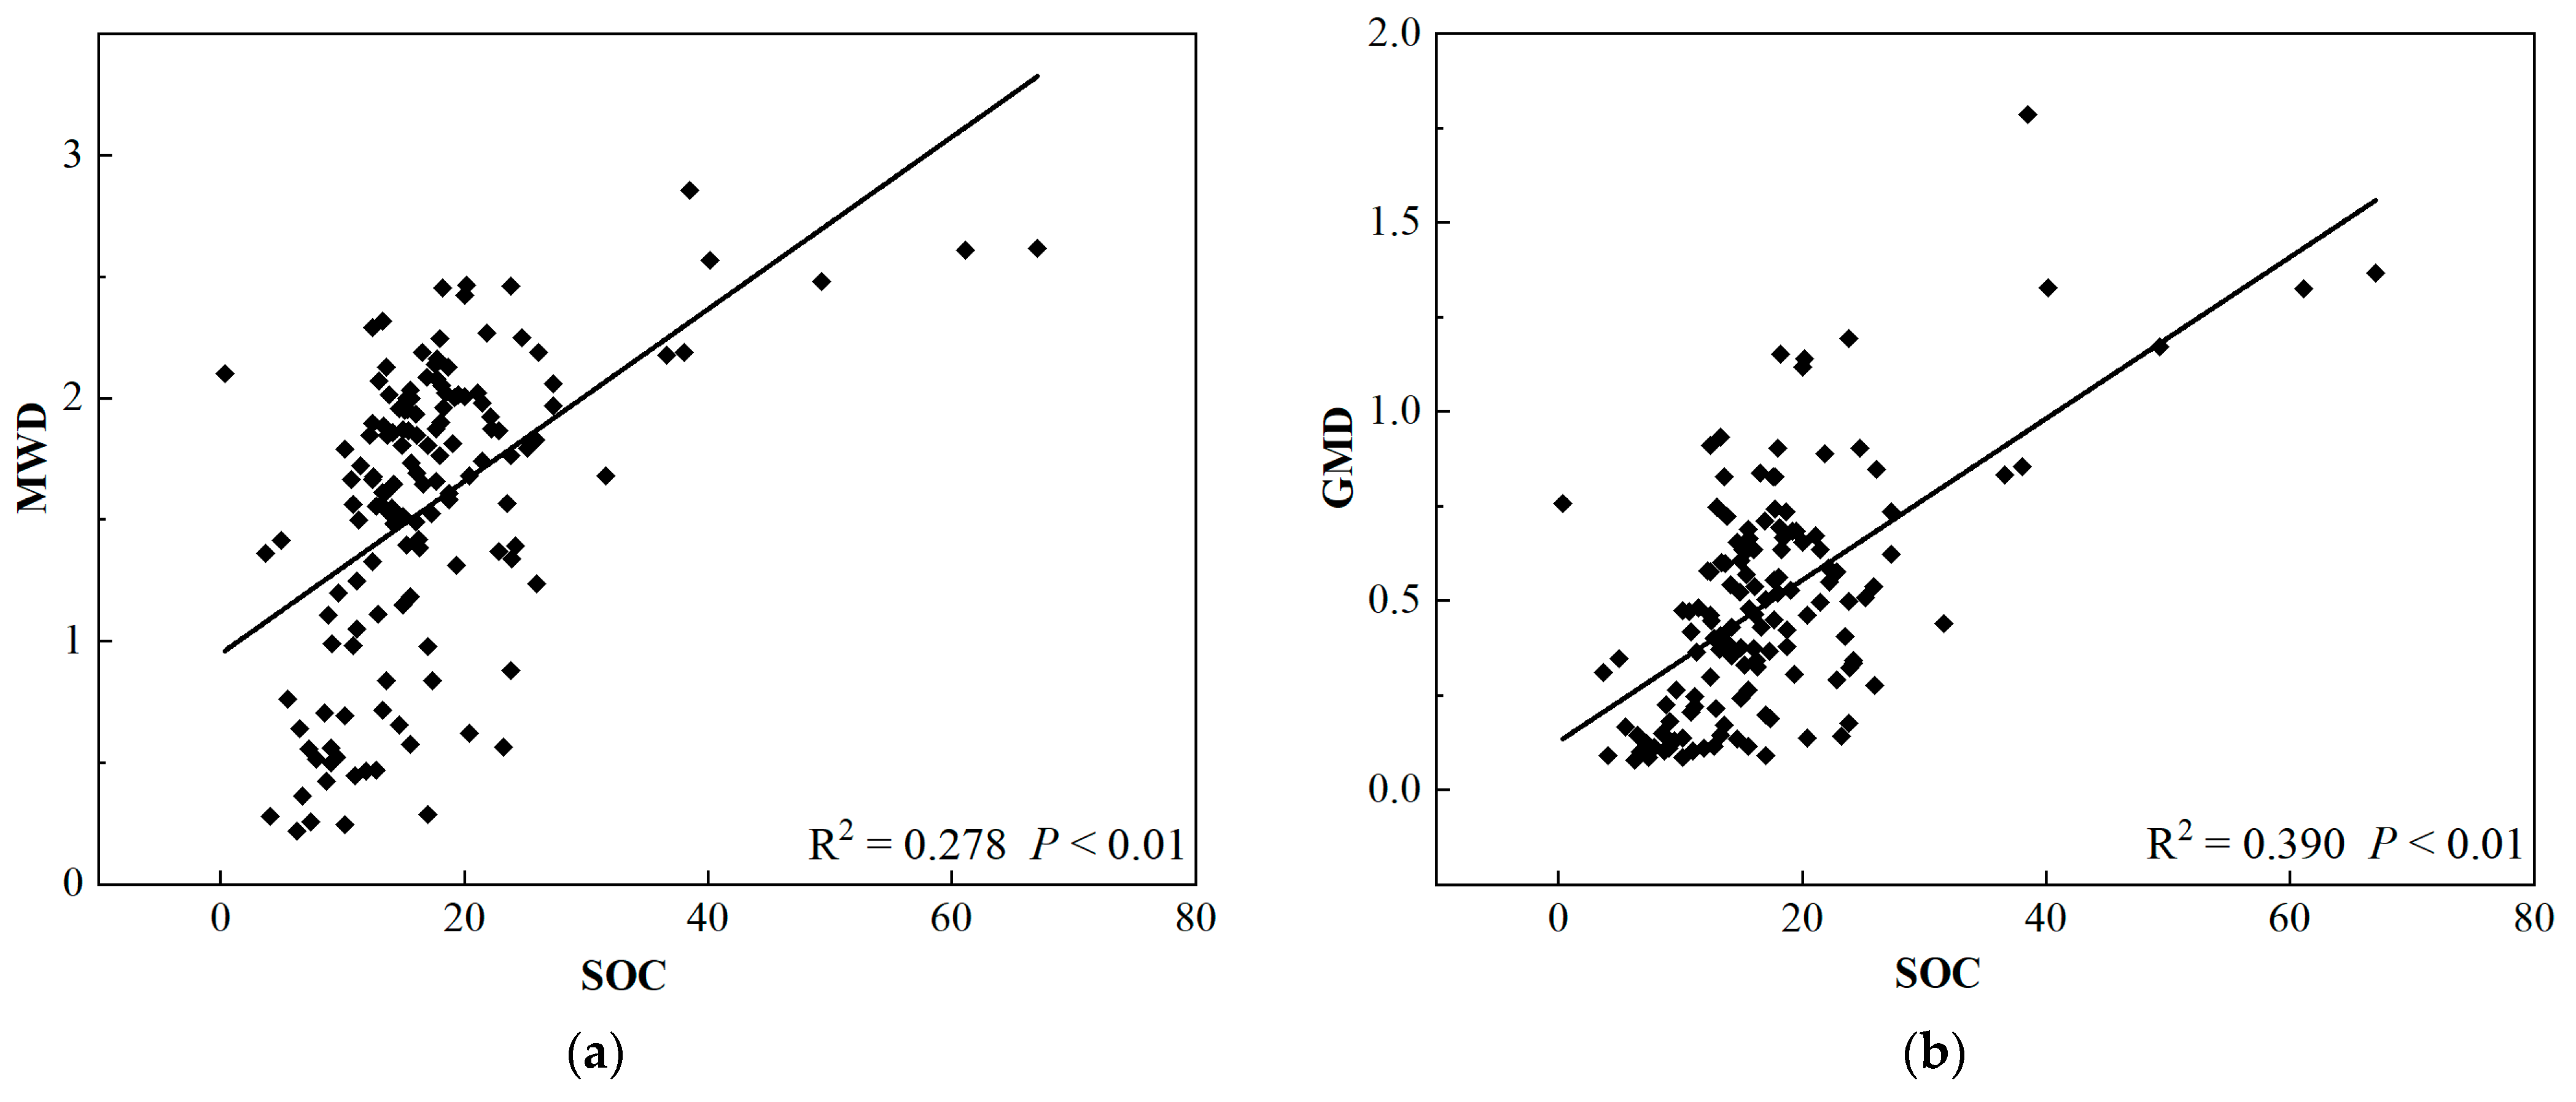
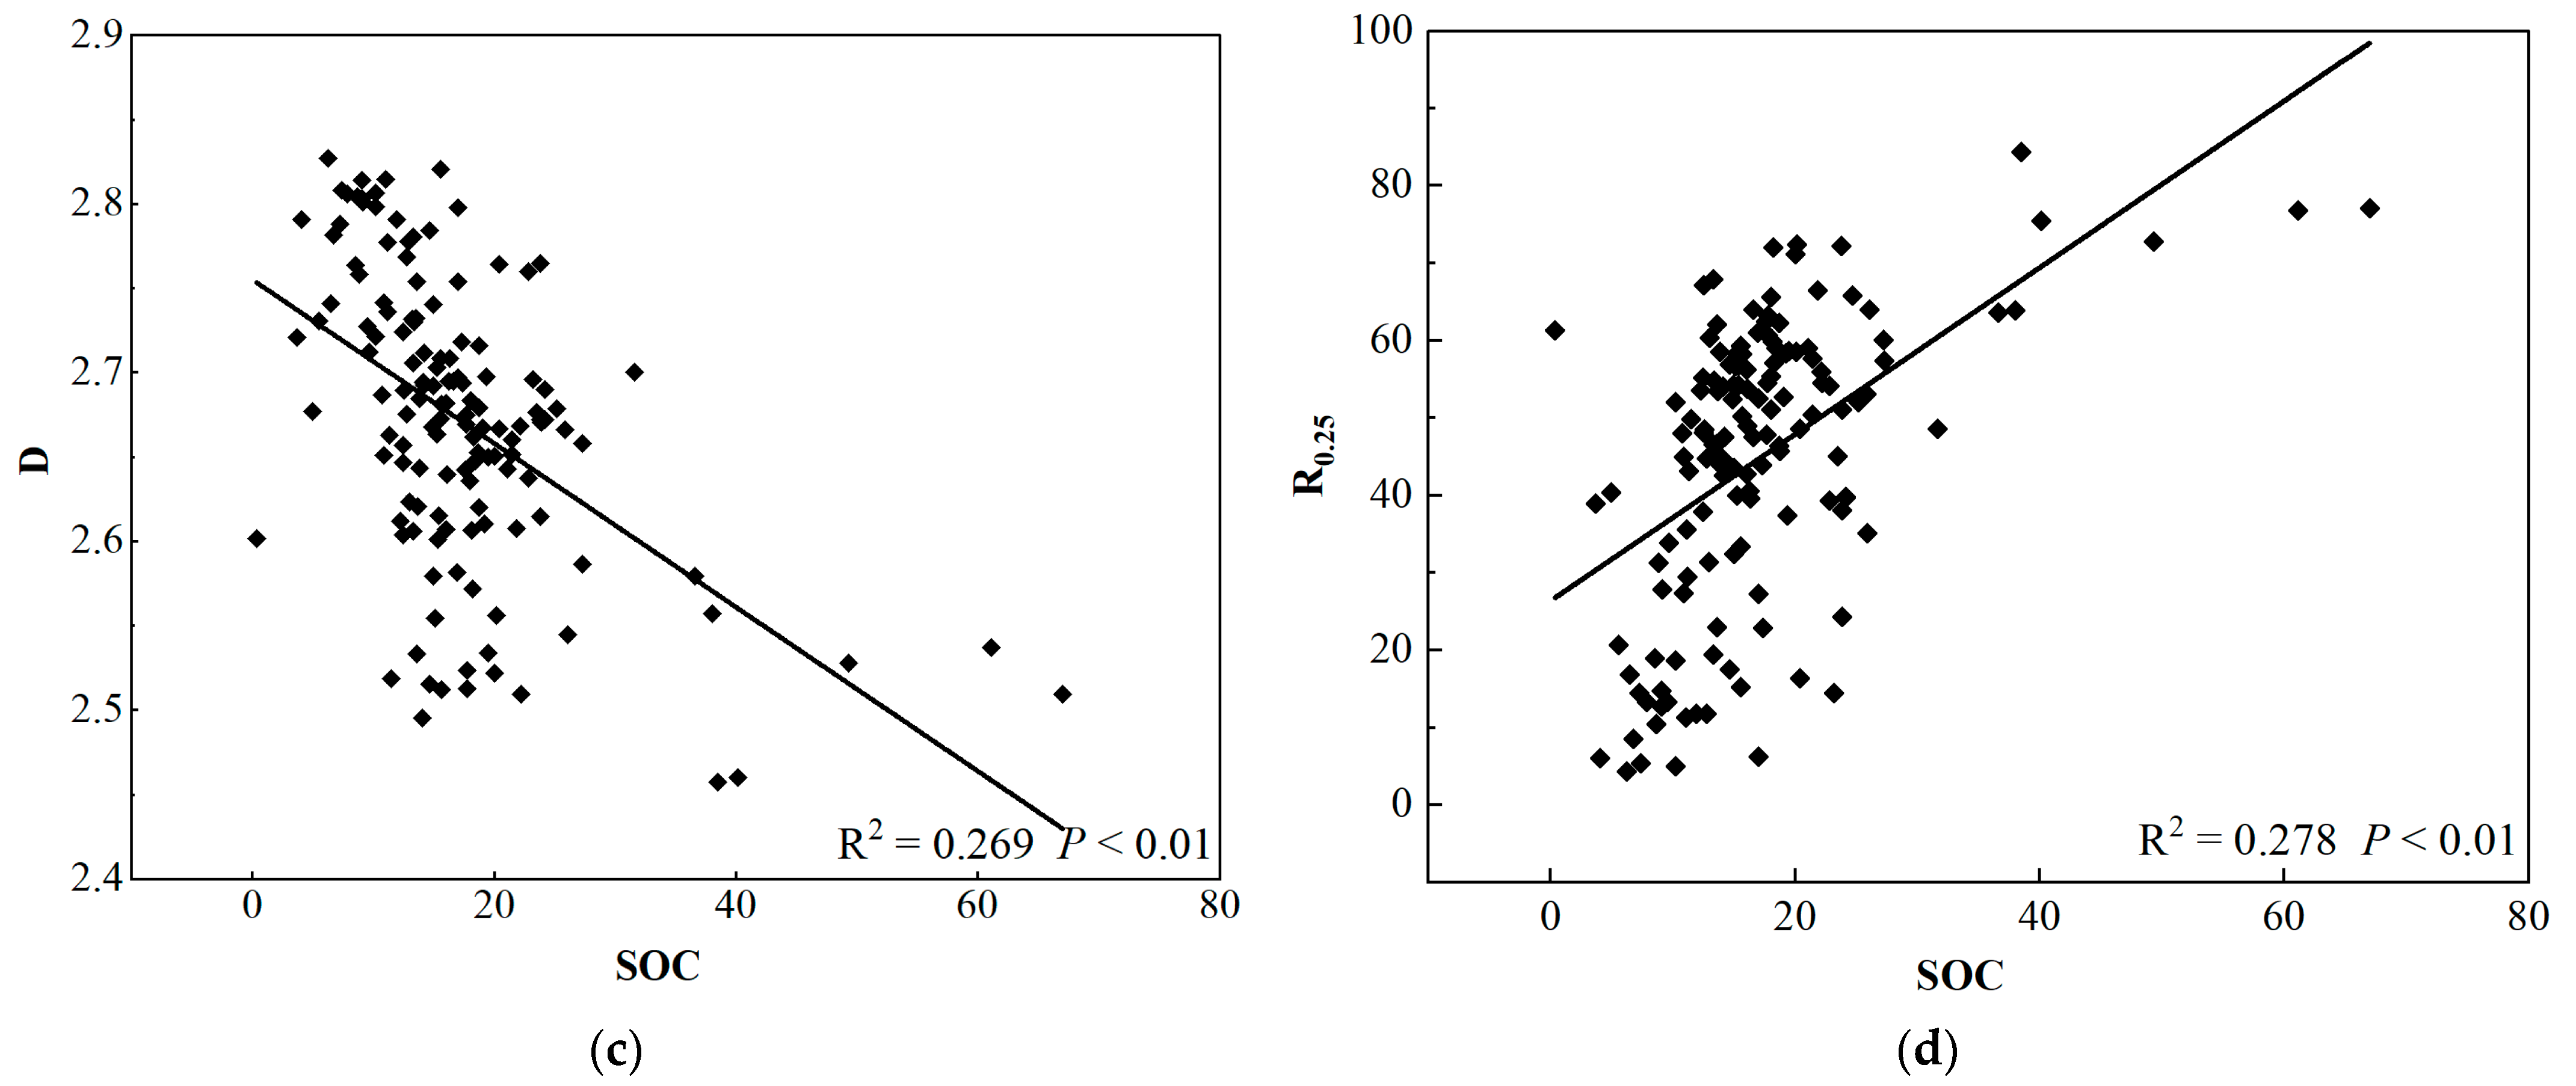
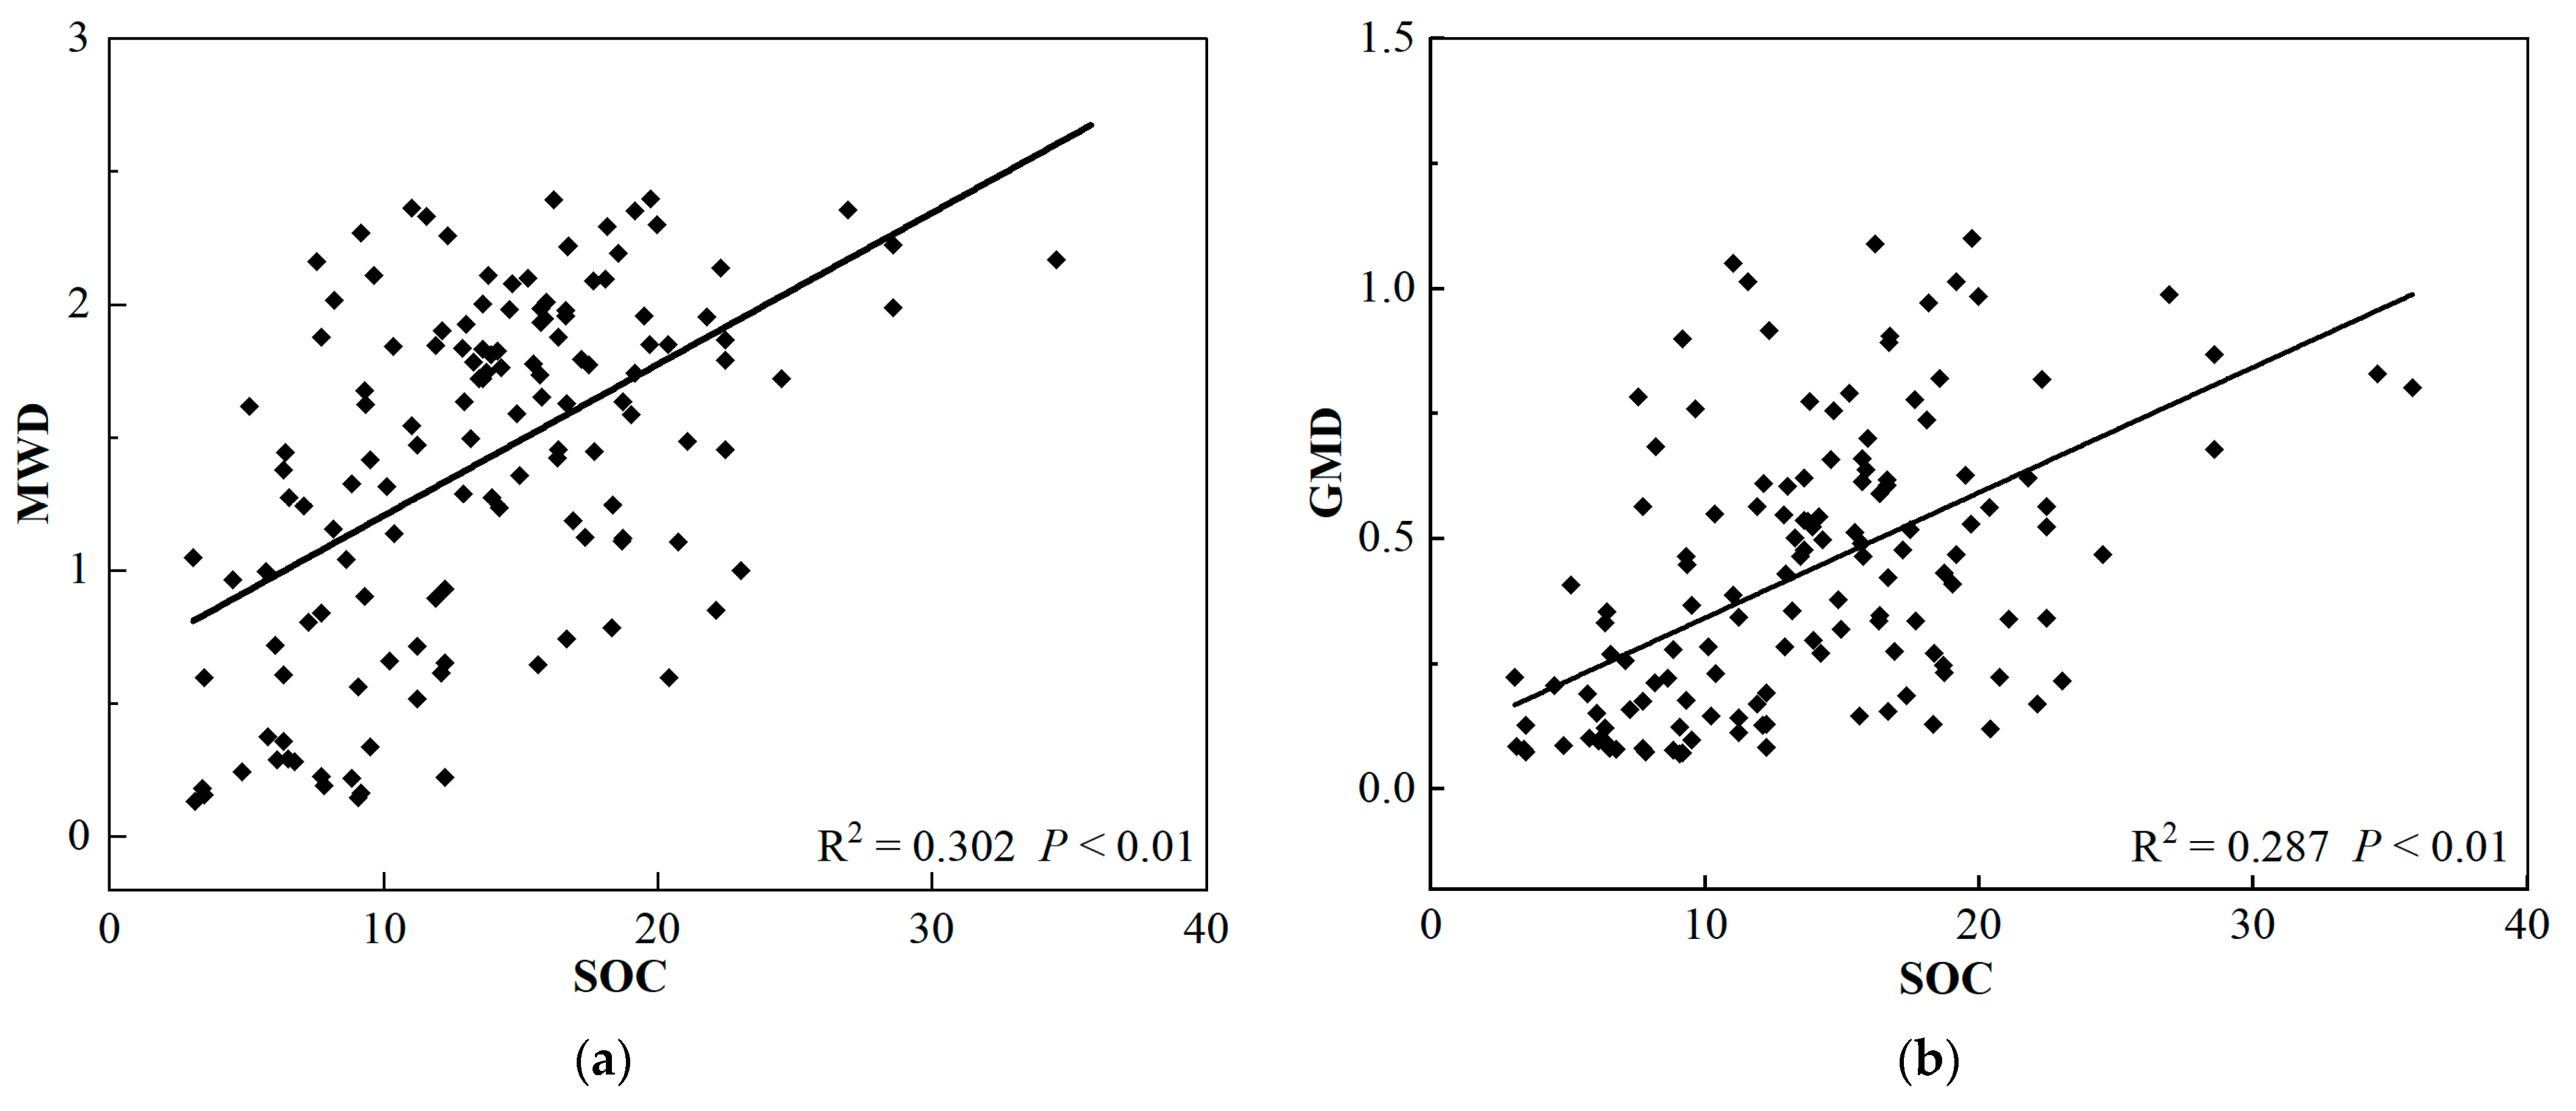
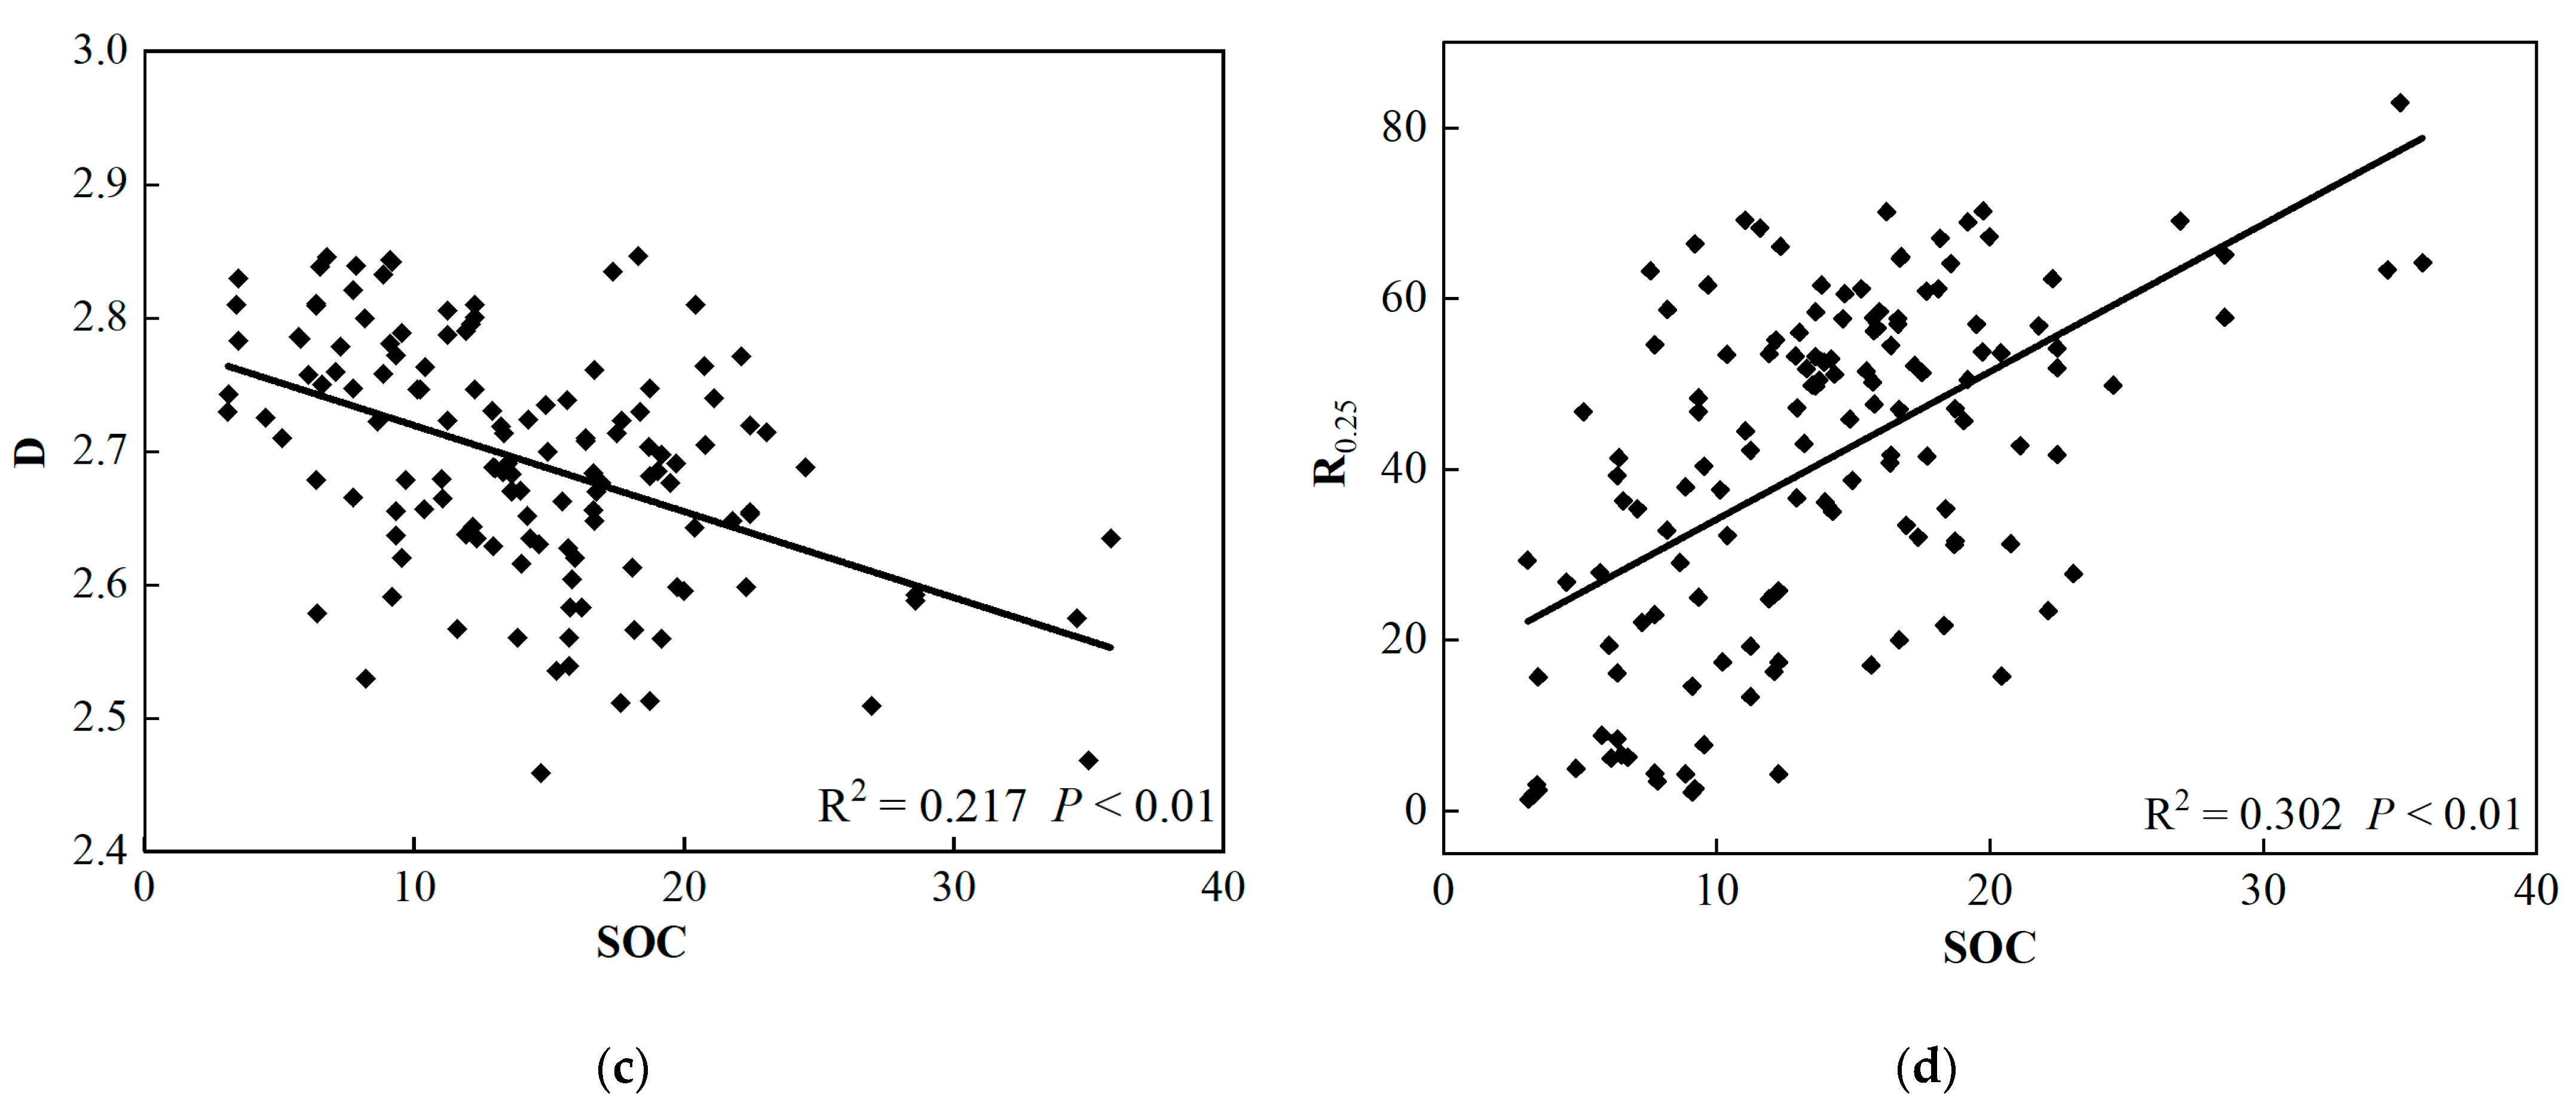
3.3. Correlations of Aggregate Stability with SOC and Soil Particle Composition

Soil aggregate stability was significantly affected by land use type (p < 0.01) (Table 2). In both the 0–20 and 20–40 cm soil layers, the stability indices of soil aggregates (except for D) were ranked alpine grassland > abandoned land > cropland (p < 0.05) (Figure 5). MWD, GMD and R0.25 were all noticeably positively correlated with SOC content, whereas D was significantly negatively correlated and soil aggregate stability was positively correlated with SOC in the 0–20 and 20–40 cm soil layers (p < 0.01) (Figure 6 and Figure 7) (Table 3).
In the 0–20 cm soil layer, clay (<0.002 mm) and silt (0.002–0.05 mm) content were found to be significantly positively correlated with soil aggregate stability, and their R2 was 0.127–0.179 (p < 0.05) (Figure 8). In contrast, sand (0.05–2 mm) content was negatively correlated with soil aggregate stability (p < 0.01), and its R2 was 0.229–0.283 (Figure 8). In the 20–40 cm soil layer, there was no significant correlation between clay content and aggregate stability indices (p > 0.05) (Figure 9). The relationship between the silt and sand content and aggregate stability was the same as in the 0–20 cm layer, and the R2 of these were 0.112–0.226 and 0.129–0.230, respectively (Figure 9). Additionally, sand was more significant in affecting soil aggregate stability in this study (p < 0.05) (Figure 8 and Figure 9) (Table 3).

4. Discussion

4.1. Effects of Land Use Type, Soil Depth and How They Interact on Soil Properties

SOC was significantly affected by land use type, soil depth and their interaction. SOC content decreased significantly after alpine grassland was converted to cropland and abandoned land. This result is consistent with the study of Zhu et al. (2021) in the Nangou watershed of the Loess Plateau [16]. The reasons could be attributed to the following: (1) Due to the high groundcover and extensive root system in grassland, more biomass was returned to the soil, which effectively promotes the accumulation of SOM (Table 1) [33]. (2) Crop straws in cropland rarely return to the soil, and crop growth will consume a large amount of SOM, inducing a decrease in the accumulation of organic matter in the soil [34,35]. In this study, no obvious difference in SOC content was found between cropland and abandoned land, which is in line with the result of Liu and Han. (2020). The reason may be that the restoration years of abandoned land are short, which means it cannot provide sufficient organic matter sources for the soil [24,36]. Reclamation of alpine grassland damaged soil aggregate structure, aggravated soil carbon loss and led to soil quality decline. The protection and management of alpine grassland should be strengthened on the existing basis. The scientific use of cropland resources for long-term abandoned land manual management effectively promotes land quality recovery and accelerates the improvement of soil structure.
Silt and sand were significantly affected by land use type. This finding is consistent with the study of Zhu et al. (2017) [26]. This may be due to the soil particle composition, with silt and sand content accounting for the majority of the proportion, being more easily affected when land use changed. However, Liu et al. (2019) found that soil particles were not impacted by land use type [37], likely because of the short time frame of land use change, and it was difficult to have a significant indigenous impact on soil particle composition.
Compared with temperate grassland, SOC content in alpine grassland was higher in this study. Dou et al. (2020) reported that the SOC content of temperate grassland in the 0–20 and 20–40 cm soil layers (7.52 g kg−1,4.56 g kg−1; 12.70 g kg−1, 5.05 g kg−1) [9,38] was much lower than that of the two soil layers in this study (28.10 g kg−1,18.71 g kg−1) (Table 1). The above findings could be explained by the fact that low soil temperature in alpine grasslands inhibits microbial activity and reduces the microbial decomposition of organic matter, thus effectively preventing the loss of organic carbon [39]. In addition, the alpine grassland accumulated huge root biomass, providing a rich source of organic matter for the soil [40].

4.2. Distributions of Soil Aggregate Stability

Soil aggregate stability was significantly affected by land use type. This is consistent with the findings of Baranian Kabir et al. (2017), who discovered that soil aggregate stability was highest in alpine grassland and lowest in cropland [41]. On the one hand, grassland and abandoned land had more organic matter input, which can improve microbial activity, promote polysaccharide and cementing agent formation, and enhance the stability of soil aggregates [42,43,44]. On the other hand, long-term tillage will disturb the macro-aggregates in the soil, resulting in a decrease in soil aggregate stability [45].
In comparison with temperate grassland, soil aggregate stability in alpine grassland was higher in this study. In the 0–20 and 20–40 cm soil layers, the ratio of R0.25 (60.84–64.62%) in alpine grassland was much higher than that of soil macro-aggregates (20–30%) in Dou et al. (2020) [9]. The reason for the high proportion of macro-aggregates in alpine grassland may be due to the large root biomass accumulated in alpine grassland and the high SOM content, which can be conducive to macro-aggregate formation in soil (Table 1) [46]. Xiao et al. (2020) found MWD (1.12–1.30 mm) in the 0–20 cm soil layer of temperate grassland that was lower than MWD (1.73–2.69 mm) in this study [25]. Otherwise, a large number of plant roots in alpine grasslands can enhance soil aggregation and promote the formation and stability of aggregates by physical entanglement or the secretion of cementing substances [11,47].

4.3. Correlations of Aggregate Stability with SOC and Soil Particle Composition

In this study, SOC was significantly positively correlated with soil aggregate stability. This result is consistent with studies conducted by Liu et al. (2019) [35], and Zhu et al. (2021) [16]. SOC, as the cementing material of aggregates, can effectively increase the number of macro-aggregates, ameliorate aggregate stability and improve soil structure [48]. Moreover, SOC can improve soil aggregate stability by boosting soil hydrophobicity to reduce the aggregates’ destruction by rainwater [49].
Sand content was significantly negatively correlated with the stability of soil aggregates in the 0–40 cm soil layer, indicating that sand was more significant in affecting soil aggregate stability in this study. This result is consistent with Barberis et al. (1991). Sand was very important for the formation of macro-aggregates, and it was the main component of macro-aggregates [50]. Specifically, sand and micro-aggregates are combined to form macro-aggregates through biological methods such as fine root and fungal entanglement [50,51], but their aggregate stability is poor and vulnerable to external interference [52].

5. Conclusions

In this study, we selected alpine grassland, cropland and abandoned land in the Huangshui River watershed of the Qinghai–Tibet Plateau as the research objects to measure and analyze the soil aggregate distribution, aggregate stability and influencing factors of 161 soil samples in 0–20 and 20–40 cm soil layers. It was found that the effects of land use changes on soil aggregate characteristics in high-altitude watersheds mainly include the following aspects:
(1)
Following cropland abandonment, macro-aggregate distribution and aggregate stability increased, while micro-aggregate and silt+clay decreased significantly. This indicates that tillage will destroy the macro-aggregates in the soil, resulting in decreased aggregate stability; abandoning cropland reduced the destruction of aggregates and improve aggregate stability, but there was still a certain disparity compared with natural grassland.
(2)
During the conversion of alpine grassland to cropland and abandoned land, SOC and soil particle composition had significant effects on soil aggregate stability. Among them, SOC content, silt content and clay content were positively correlated with aggregate stability, while sand content was negatively correlated with soil aggregate stability. Clay and silt promoted the formation of macro-aggregates and enhanced aggregate stability, while sand was not conducive to the formation of macro-aggregates and aggregate stability. Additionally, in this study, sand was more likely to affect soil aggregates and their stability.
(3)
Compared with temperate grassland, alpine grassland had higher SOC content, soil aggregate stability and distribution of macro-aggregates. Low soil temperature in alpine grasslands inhibits microbial activity, which can effectively prevent the loss of organic carbon. In addition, the alpine grassland accumulated huge root biomass, providing a rich source of organic matter for the soil. However, this result is not absolute, depending on the specific sampling environment. Microclimates may produce different results.

Author Contributions

Conceptualization, Y.L. (Ying Li) and Y.Z.; Methodology, Y.L. and Y.Z.; Software, Y.L. (Ying Li); Validation, Y.Z.; Formal analysis, Y.L. (Ying Li); Investigation, Y.L., Z.M., Y.L. (Yutao Liu), C.Z., Q.M. and Z.C.; Resources, Y.Z. and H.S.; data curation, Y.L. (Ying Li); Writing—original draft preparation, Y.L. (Ying Li); Writing—review and editing, Y.L. (Ying Li) and Y.Z.; Visualization, Y.L. (Ying Li); Supervision, Y.Z. and W.W.; Project administration, Y.Z. and H.S.; Funding acquisition, Y.Z. and H.S. All authors have read and agreed to the published version of the manuscript.

Funding

This research was funded by the Natural Science Foundation of Qinghai Province, China (grant number 2020-ZJ-967Q), the Thousand High Innovative Talents Program of Qinghai Province (2019) and the National Natural Science Foundation of China (grant number U20A20115, 42207375).

Institutional Review Board Statement

Not applicable.

Informed Consent Statement

Not applicable.

Data Availability Statement

Not applicable.

Acknowledgments

The authors are grateful to the editor and reviewers for their valuable comments and suggestions.

Conflicts of Interest

The authors declare no conflict of interest.

References

  1. Oades, J.M.; Waters, A.G. Aggregate hierarchy in soils. Soil Res. 1991, 29, 815–828. [Google Scholar] [CrossRef]
  2. Six, J.; Bossuyt, H.; Degryze, S.; Denef, K. A history of research on the link between (micro)aggregates, soil biota, and soil organic matter dynamics. Soil Tillage Res. 2004, 79, 7–31. [Google Scholar] [CrossRef]
  3. Cheng, M.; Xiang, Y.; Xue, Z.; An, S.; Darboux, F. Soil aggregation and intra-aggregate carbon fractions in relation to vegetation succession on the Loess Plateau, China. Catena 2015, 124, 77–84. [Google Scholar] [CrossRef]
  4. Elhaja, M.; Ibrahim, I.; Adam, H.; Csaplovics, E. Soil aggregate stability and wind erodible fraction in a semi-arid environment of White Nile State, Sudan. In Proceedings of SPIE—The International Society for Optical Engineering; SPIE: Bellingham, WA, USA, 2014; Volume 9260. [Google Scholar] [CrossRef]
  5. Gallardo-Carrera, A.; Léonard, J.; Duval, Y.; Dürr, C. Effects of seedbed structure and water content at sowing on the development of soil surface crusting under rainfall. Soil Tillage Res. 2007, 95, 207–217. [Google Scholar] [CrossRef]
  6. Rabot, E.; Wiesmeier, M.; Schlüter, S.; Vogel, H.J. Soil structure as an indicator of soil functions: A review. Geoderma 2018, 314, 122–137. [Google Scholar] [CrossRef]
  7. Caplan, J.; Giménez, D.; Subroy, V.; Heck, R.; Prior, S.; Runion, G.B.; Torbert, H. Nitrogen-mediated effects of elevated CO2 on intra-aggregate soil pore structure. Glob. Chang. Biol. 2016, 23, 1585–1597. [Google Scholar] [CrossRef]
  8. Dong, S.; Zhang, J.; Li, Y.; Liu, S.; Dong, Q.; Zhou, H.; Yeomans, J.; Li, Y.; Li, S.; Gao, X. Effect of grassland degradation on aggregate-associated soil organic carbon of alpine grassland ecosystems in the Qinghai-Tibetan Plateau. Eur. J. Soil Sci. 2020, 71, 69–79. [Google Scholar] [CrossRef]
  9. Dou, Y.; Yang, Y.; An, S.; Zhu, Z. Effects of different vegetation restoration measures on soil aggregate stability and erodibility on the Loess Plateau, China. Catena 2020, 185, 104294. [Google Scholar] [CrossRef]
  10. Idowu, O. Relationships Between Aggregate Stability and Selected Soil Properties in Humid Tropical Environment. Commun. Soil Sci. Plant Anal. 2003, 34, 695–708. [Google Scholar] [CrossRef]
  11. Poirier, V.; Roumet, C.; Munson, A.D. The root of the matter: Linking root traits and soil organic matter stabilization processes. Soil Biol. Biochem. 2018, 120, 246–259. [Google Scholar] [CrossRef]
  12. Caravaca, F.; Lax, A.; Albaladejo, J. Soil aggregate stability and organic matter in clay and fine silt fractions in urban refuse-amended semiarid soils. Soil Sci. Soc. Am. J. 2001, 65, 1235–1238. [Google Scholar] [CrossRef]
  13. Razafimbelo, T.M.; Albrecht, A.; Oliver, R.; Chevallier, T.; Chapuis-Lardy, L.; Feller, C. Aggregate associated-C and physical protection in a tropical clayey soil under Malagasy conventional and no-tillage systems. Soil Tillage Res. 2008, 98, 140–149. [Google Scholar] [CrossRef]
  14. Dorji, T.; Field, D.J.; Odeh, I.O.A.; Bhogal, A. Soil aggregate stability and aggregate-associated organic carbon under different land use or land cover types. Soil Use Manag. 2020, 36, 308–319. [Google Scholar] [CrossRef]
  15. Deng, L.; Kim, D.G.; Peng, C.; Shangguan, Z. Controls of soil and aggregate-associated organic carbon variations following natural vegetation restoration on the Loess Plateau in China. Land Degrad. Dev. 2018, 29, 3974–3984. [Google Scholar] [CrossRef]
  16. Zhu, G.-y.; Shangguan, Z.-p.; Deng, L. Variations in soil aggregate stability due to land use changes from agricultural land on the Loess Plateau, China. Catena 2021, 200, 105181. [Google Scholar] [CrossRef]
  17. Li, X.G.; Zhang, P.L.; Yin, P.; Li, Y.K.; Ma, Q.F.; Long, R.J.; Li, F.M. Soil organic carbon and nitrogen fractions and water-stable aggregation as affected by cropping and grassland reclamation in an arid sub-alpine soil. Land Degrad. Dev. 2009, 20, 176–186. [Google Scholar] [CrossRef]
  18. Pan, J.; Wang, J.; Zhang, R.; Tian, D.; Cheng, X.; Wang, S.; Chen, C.; Yang, L.; Niu, S. Microaggregates regulated by edaphic properties determine the soil carbon stock in Tibetan alpine grasslands. CATENA 2021, 206, 105570. [Google Scholar] [CrossRef]
  19. Sherman, R. Enhancing the resilience of coupled human and natural systems of alpine rangelands on the Qinghai-Tibetan Plateau. Rangel. J. 2015, 37. [Google Scholar] [CrossRef]
  20. Leifeld, J.; Zimmermann, M.; Fuhrer, J.; Conen, F. Storage and turnover of carbon in grassland soils along an elevation gradient in the Swiss Alps. Glob. Chang. Biol. 2009, 15, 668–679. [Google Scholar] [CrossRef]
  21. Xu, M.; Li, X.; Cai, X.; Gai, J.; Li, X.; Christie, P.; Zhang, J. Soil microbial community structure and activity along a montane elevational gradient on the Tibetan Plateau. Eur. J. Soil Biol. 2014, 64, 6–14. [Google Scholar] [CrossRef]
  22. Le Bissonnais, Y.; Prieto, I.; Roumet, C.; Nespoulous, J.; Metayer, J.; Huon, S.; Villatoro, M.; Stokes, A. Soil aggregate stability in Mediterranean and tropical agro-ecosystems: Effect of plant roots and soil characteristics. Plant Soil 2017, 424, 303–317. [Google Scholar] [CrossRef]
  23. Smith, J.L.; Halvorson, J.J.; Bolton, H. Soil properties and microbial activity across a 500m elevation gradient in a semi-arid environment. Soil Biol. Biochem. 2002, 34, 1749–1757. [Google Scholar] [CrossRef]
  24. Wang, Y.; Ran, L.; Fang, N.; Shi, Z. Aggregate stability and associated organic carbon and nitrogen as affected by soil erosion and vegetation rehabilitation on the Loess Plateau. CATENA 2018, 167, 257–265. [Google Scholar] [CrossRef]
  25. Xiao, L.; Yao, K.; Li, P.; Liu, Y.; Chang, E.; Zhang, Y.; Zhu, T. Increased soil aggregate stability is strongly correlated with root and soil properties along a gradient of secondary succession on the Loess Plateau. Ecol. Eng. 2020, 143, 105671. [Google Scholar] [CrossRef]
  26. Zhu, G.-y.; Shangguan, Z.-p.; Deng, L. Soil aggregate stability and aggregate-associated carbon and nitrogen in natural restoration grassland and Chinese red pine plantation on the Loess Plateau. Catena 2017, 149, 253–260. [Google Scholar] [CrossRef]
  27. Zhang, L.; Tan, X.; Chen, H.; Liu, Y.; Cui, Z. Effects of Agriculture and Animal Husbandry on Heavy Metal Contamination in the Aquatic Environment and Human Health in Huangshui River Basin. Water 2022, 14, 549. [Google Scholar] [CrossRef]
  28. Chen, Q.; Yang, L.; Luo, J.; Liu, F.; Zhang, Y.; Zhou, Q.; Guo, R.; Gu, X. The 300-year cropland changes reflecting climate impacts and social resilience at the Yellow River-Huangshui River Valley, China. Environ. Res. Lett. 2021, 16, 065006. [Google Scholar] [CrossRef]
  29. Paudel, B.; Wu, X.; Zhang, Y.; Rai, R.; Liu, L.; Zhang, B.; Khanal, N.R.; Koirala, H.L.; Nepal, P. Farmland abandonment and its determinants in the different ecological villages of the Koshi river basin, central Himalayas: Synergy of high-resolution remote sensing and social surveys. Environ. Res. 2020, 188, 109711. [Google Scholar] [CrossRef]
  30. Wei, X.; Shao, M.; Gale, W.J.; Zhang, X.; Li, L. Dynamics of aggregate-associated organic carbon following conversion of forest to cropland. Soil Biol. Biochem. 2013, 57, 876–883. [Google Scholar] [CrossRef]
  31. Nelson, D.W.; Sommers, L.E. Total Carbon, Organic Carbon, and Organic Matter. In Methods of Soil Analysis; Wiley: Hoboken, NJ, USA, 1983; pp. 539–579. [Google Scholar]
  32. Sumner, M.E.; Miller, W.P. Cation Exchange Capacity and Exchange Coefficients. In Methods of Soil Analysis; Wiley: Hoboken, NJ, USA, 1996; pp. 1201–1229. [Google Scholar]
  33. Zhang, J.; Zhao, H.; Zhang, T.; Zhao, X.; Drake, S. Community succession along a chronosequence of vegetation restoration on sand dunes in Horqin Sandy Land. J. Arid. Environ. 2005, 62, 555–566. [Google Scholar] [CrossRef]
  34. An, S.-S.; Darboux, F.; Cheng, M. Revegetation as an efficient means of increasing soil aggregate stability on the Loess Plateau (China). Geoderma 2013, 209, 75–85. [Google Scholar] [CrossRef]
  35. Liu, M.; Han, G.; Li, Z.; Zhang, Q.; Song, Z. Soil organic carbon sequestration in soil aggregates in the karst Critical Zone Observatory, Southwest China. Plant Soil Environ. 2019, 65, 253–259. [Google Scholar] [CrossRef]
  36. Alías, J.C.; Mejías, J.A.; Chaves, N. Effect of Cropland Abandonment on Soil Carbon Stock in an Agroforestry System in Southwestern Spain. Land 2022, 11, 425. [Google Scholar] [CrossRef]
  37. Man, L.; Han, G.; Zhang, Q. Effects of Soil Aggregate Stability on Soil Organic Carbon and Nitrogen under Land Use Change in an Erodible Region in Southwest China. Int. J. Environ. Res. Public Health 2019, 16, 3809. [Google Scholar] [CrossRef]
  38. Zhang, C.; Liu, G.; Xue, S.; Sun, C. Soil organic carbon and total nitrogen storage as affected by land use in a small watershed of the Loess Plateau, China. Eur. J. Soil Biol. 2013, 54, 16–24. [Google Scholar] [CrossRef]
  39. Chen, Y.-L.; Ding, J.-Z.; Peng, Y.-F.; Li, F.; Yang, G.-B.; Liu, L.; Qin, S.-Q.; Fang, K.; Yang, Y.-H. Patterns and drivers of soil microbial communities in Tibetan alpine and global terrestrial ecosystems. J. Biogeogr. 2016, 43, 2027–2039. [Google Scholar] [CrossRef]
  40. Li, X.; Zhang, X.; Wu, J.; Shen, Z.; Zhang, Y.; Xu, X.; Fan, Y.; Zhao, Y.; Yan, W. Root biomass distribution in alpine ecosystems of the northern Tibetan Plateau. Environ. Earth Sci. 2011, 64, 1911–1919. [Google Scholar] [CrossRef]
  41. Baranian Kabir, E.; Bashari, H.; Mosaddeghi, M.R.; Bassiri, M. Soil aggregate stability and organic matter as affected by land use change in central Iran. Arch. Agron. Soil Sci. 2017, 63, 1823–1837. [Google Scholar] [CrossRef]
  42. Ayoubi, S.; Mokhtari Karchegani, P.; Mosaddeghi, M.R.; Honarjoo, N. Soil aggregation and organic carbon as affected by topography and land use change in western Iran. Soil Tillage Res. 2012, 121, 18–26. [Google Scholar] [CrossRef]
  43. Luo, Y.; Zhu, Z.; Liu, S.; Peng, P.; Xu, J.; Brookes, P.; Ge, T.; Wu, J. Nitrogen fertilization increases rice rhizodeposition and its stabilization in soil aggregates and the humus fraction. Plant Soil 2019, 445, 125–135. [Google Scholar] [CrossRef]
  44. Zhao, F.Z.; Fan, X.D.; Ren, C.J.; Zhang, L.; Han, X.H.; Yang, G.H.; Wang, J.; Doughty, R. Changes of the organic carbon content and stability of soil aggregates affected by soil bacterial community after afforestation. Catena 2018, 171, 622–631. [Google Scholar] [CrossRef]
  45. Six, J.; Elliott, E.T.; Paustian, K. Soil macroaggregate turnover and microaggregate formation: A mechanism for C sequestration under no-tillage agriculture. Soil Biol. Biochem. 2000, 32, 2099–2103. [Google Scholar] [CrossRef]
  46. Pohl, M.; Alig, D.; Körner, C.; Rixen, C. Higher plant diversity enhances soil stability in disturbed alpine ecosystems. Plant Soil 2009, 324, 91–102. [Google Scholar] [CrossRef]
  47. Lehmann, A.; Rillig, M.C. Understanding mechanisms of soil biota involvement in soil aggregation: A way forward with saprobic fungi? Soil Biol. Biochem. 2015, 88, 298–302. [Google Scholar] [CrossRef]
  48. Cosentino, D.; Chenu, C.; Le Bissonnais, Y. Aggregate stability and microbial community dynamics under drying–wetting cycles in a silt loam soil. Soil Biol. Biochem. 2006, 38, 2053–2062. [Google Scholar] [CrossRef]
  49. Chenu, C.; Le Bissonnais, Y.; Arrouays, D. Organic Matter Influence on Clay Wettability and Soil Aggregate Stability. Soil Sci. Soc. Am. J. 2000, 64, 1479–1486. [Google Scholar] [CrossRef]
  50. Barberis, E.; Marsan, F.A.; Boero, V.; Arduino, E. Aggregation of soil particles by iron oxides in various size fractions of soil B horizons. J. Soil Sci. 1991, 42, 535–542. [Google Scholar] [CrossRef]
  51. Nichols, K.; Halvorson, J.; Caesar. Roles of biology, chemistry, and physics in soil macroaggregate formation and stabilization. Open Agric. J. 2013, 7, 107–117. [Google Scholar] [CrossRef]
  52. Elliott, E.; Paustian, K. Soil Structure and Soil Organic Matter. Soil Sci. Soc. Am. J. 2000, 64, 681–689. [Google Scholar] [CrossRef]
Figure 1. The study area location (a) and sampling site distribution in Huangshui River watershed (b).
Land 12 00393 g001
Figure 2. Soil particle composition at 0–20 cm (a) and 20–40 cm (b) depths of various land use types. Notes. The values are the mean and standard deviation. Different lower case letters indicate significant differences of soil particle composition in the same soil layers by type of land use (p < 0.05). The values were compared between bar charts of the same color.
Land 12 00393 g002
Figure 3. Relationships between the soil structure stability index (SI) and four indices of soil aggregate stability at 0–40 cm soil depth. Notes. The subfigures (ad) show the relationship between SI and MWD, GMD, D, R0.25, respectively.
Land 12 00393 g003
Figure 4. Soil aggregate composition at 0–20 cm (a) and 20–40 cm (b) depths of various land use types. Notes. The values are the mean and standard deviation. Different lower case letters indicate significant differences of soil aggregate composition in the same soil layers by the type of land use (p < 0.05). The values were compared between bar charts of the same color.
Land 12 00393 g004
Figure 5. Variations of soil aggregate stability indices. Notes. The values are the mean and standard deviation. Different lower case letters indicate significant differences of soil aggregate stability in the same soil layers at the different locations (p < 0.05). The values were compared between bar charts of the same color. The subfigures (ad) show the soil aggregate stability of 0–20 cm and 20–40 cm depths for MWD, GMD, D, and R0.25 under different land use types, respectively.
Land 12 00393 g005aLand 12 00393 g005b
Figure 6. The soil aggregate stability indices as a function of the SOC at 0–20 cm soil depth. Notes. The subfigures (ad) show the relationship between SOC and MWD, GMD, D, R0.25 at 0–20 cm soil depth, respectively.
Land 12 00393 g006aLand 12 00393 g006b
Figure 7. The soil aggregate stability indices as a function of the SOC at 20–40 cm soil depth. Notes. The subfigures (ad) show the relationship between SOC and MWD, GMD, D, R0.25 at 20–40 cm soil depth, respectively.
Land 12 00393 g007aLand 12 00393 g007b
Figure 8. The soil aggregate stability indices as a function of the soil particle composition at 0–20 cm depth. Notes. The subfigures (ac) show the relationship between MWD and the soil particle composition; (df) show the relationship between GMD and the soil particle composition; (gi) show the relationship between D and the soil particle composition; (jl) show the relationship between R0.25 and the soil particle composition.
Land 12 00393 g008
Figure 9. The soil aggregate stability indices as a function of the soil particle composition at 20–40 cm depth. Notes. The subfigures (ac) show the relationship between MWD and the soil particle composition; (df) show the relationship between GMD and the soil particle composition; (gi) show the relationship between D and the soil particle composition; (jl) show the relationship between R0.25 and the soil particle composition.
Land 12 00393 g009
Table 1. Basic characteristics and soil organic carbon content of different land use types.
Land Use TypeSoil Depth
(cm)
pHRDWD
(g cm−3)
SOC
(g kg−1)
D50
(µm)
Dv
(mm)
Alpine grassland0–207.86(0.58) c0.00171
(0.00077) a
28.10(16.45) a18.14(5.18) a2.72(0.02) a
20–408.11(0.46) B0.00117
(0.00093) A
18.71(8.30) A17.52(4.00) A2.71(0.02) A
Cropland0–208.11(0.16) b0.00051
(0.00037) b
16.79(6.84) b20.73(6.82) a2.71(0.02) a
20–408.25(0.26) A0.00023
(0.00023) B
13.98(8.20) B18.88(4.89) A2.71(0.02) A
Abandoned land0–208.28(0.10) a0.00082
(0.00069) b
13.66(4.31) b17.73(5.56) a2.72(0.02) a
20–408.34(0.13) A0.00013
(0.00006) B
13.46(4.92) B16.99(6.64) A2.72(0.03) A
Notes. The values are the mean and standard deviation. RDWD = root dry weight density; SOC = soil organic content; D50 = median particle size; Dv = volume fractal dimension. Different lower and upper cases mean remarkable difference in the same soil layer at different locations (p < 0.05).
Table 2. The impacts of land use type, soil depth and their interaction on soil aggregate stability and properties.
Factor Variable dfF-Valuep-Value
Land use change SOC213.9670.000 **
Clay 20.5990.550
Silt 23.8140.023 *
Sand 24.5570.011 *
Soil depthSOC112.3860.001 **
Clay 11.2140.272
Silt 10.2550.614
Sand 10.4530.501
Land use change
×
Soil depth
SOC23.8700.022 *
Clay 20.6950.500
Silt 20.3430.710
Sand 20.6840.506
Land use change MWD228.5200.000 **
GMD250.8260.000 **
D240.9620.000 **
R0.25234.9320.000 **
Soil depthMWD12.1730.553
GMD14.4100.142
D12.0790.037 *
R0.2510.3540.151
Land use change
×
Soil depth
MWD20.6990.498
GMD20.3120.732
D21.5880.206
R0.2520.1610.851
Notes. * Correlation is significant at p < 0.05. ** Correlation is significant at p < 0.01. SOC = soil organic content; Clay = clay content; Silt = silt content; Sand = sand content; MWD = mean weight diameter; GMD = mean geometric diameter; D = fractal dimension; R0.25 = proportion of macro-aggregates.
Table 3. Multiple regression analysis of soil aggregate stability indices and soil properties.
Soil Depth
(cm)
Dependent
Variable
FormulaR2
0–20MWDMWD = 1.503 + 0.031 × SOC − 0.031 × D500.446 **
GMDGMD = 0.288 + 0.017 × SOC − 0.009 × D500.529 **
DD = 2.781 − 0.005 × SOC0.401 **
R0.25R0.25 = 43.288 + 0.932 × SOC − 0.949 × D500.446 **
20–40MWDMWD = 56.234 + 0.024 × SOC − 0.162 × D50 − 17.712 × Dv − 0.058 × Silt0.492 **
GMDGMD = 0.320 + 0.014 × SOC − 0.009 × D500.459 **
DD = −4.442 − 0.002 × SOC − 0.021 × D50 + 2.278 × Dv + 0.008 × Silt0.377 **
R0.25R0.25 = 1701.850 + 0.715 × SOC − 4.898 × D50 − 536.971 × Dv − 1.178 × Silt0.493 **
0–40MWDMWD = −2.508 + 0.030 × SOC − 0.095 × D50 + 0.096 × Sand + 0.047 × Silt0.472 **
GMDGMD = 0.294 + 0.014 × SOC − 0.009 × D50 + 96.033 × RDWD0.544 **
DD = 2.717 − 0.003 × SOC − 0.003 × D50 − 24.106 × RDWD0.375 **
R0.25R0.25 = −78.937 + 0.907 × SOC − 2.897 × D50 + 2.913 × Sand + 1.442 × Silt0.473 **
Notes. * Correlation is significant at p < 0.05. ** Correlation is significant at p < 0.01. The values of the included variables are significant at p < 0.05. SOC = soil organic content; Clay = clay content; Silt = silt content; Sand = sand content; MWD = mean weight diameter; GMD = mean geometric diameter; D = fractal dimension; R0.25 = water-stable macro-aggregate content; RDWD = root dry weight density; D50 = median particle size; Dv = volume fractal dimension.
Disclaimer/Publisher’s Note: The statements, opinions and data contained in all publications are solely those of the individual author(s) and contributor(s) and not of MDPI and/or the editor(s). MDPI and/or the editor(s) disclaim responsibility for any injury to people or property resulting from any ideas, methods, instructions or products referred to in the content.

