
Object- Versus Pixel-Based Unsupervised Fire Burn Scar Mapping under Different Biogeographical Conditions in Europe
 , , , and
Abstract
:1. Introduction
2. Test Sites and Data
2.1. Satellite Imagery
2.2. Auxiliary Data
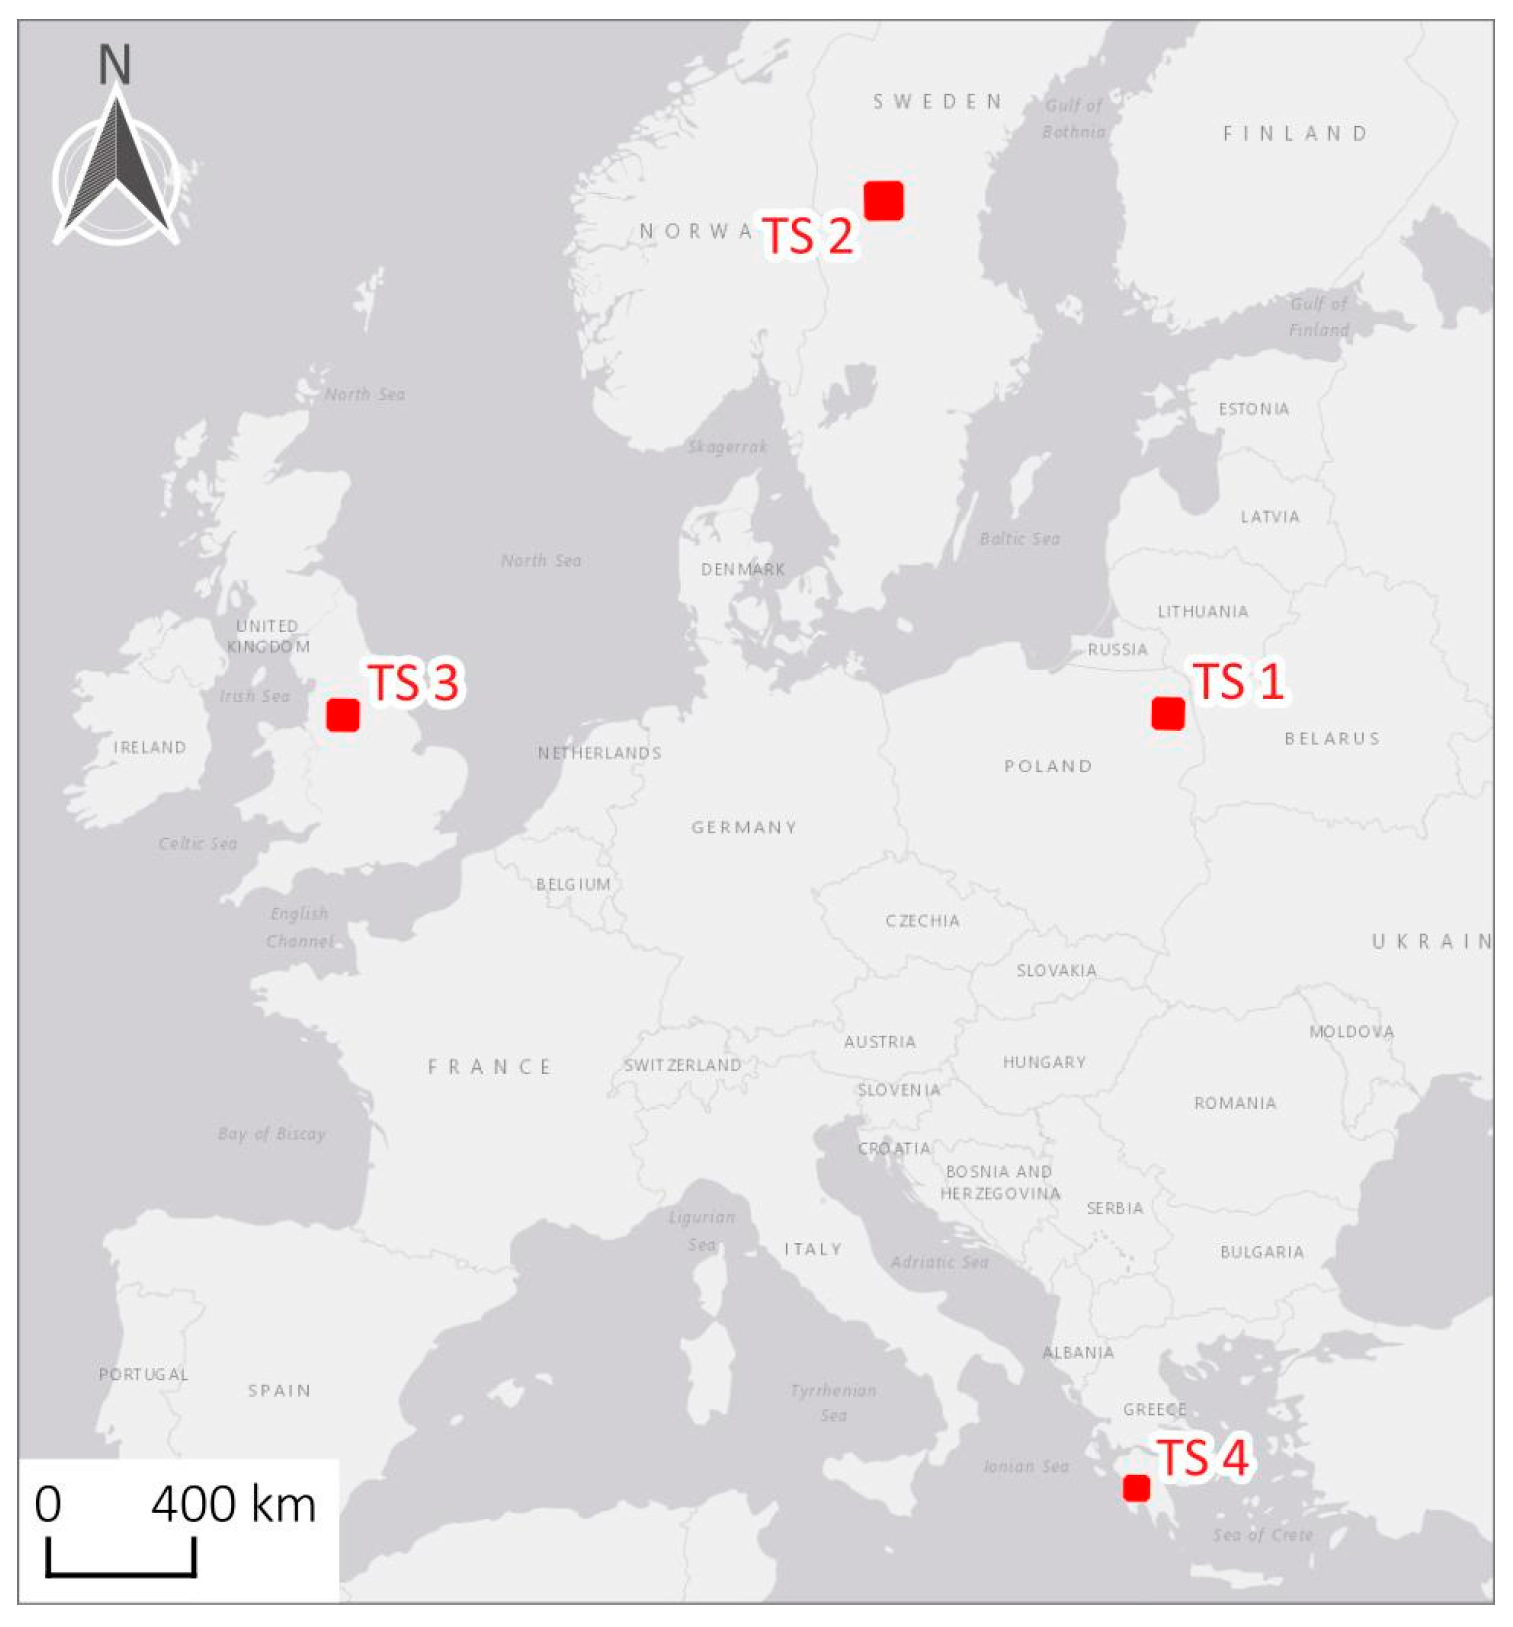
2.3. Test Sites
2.3.1. Poland
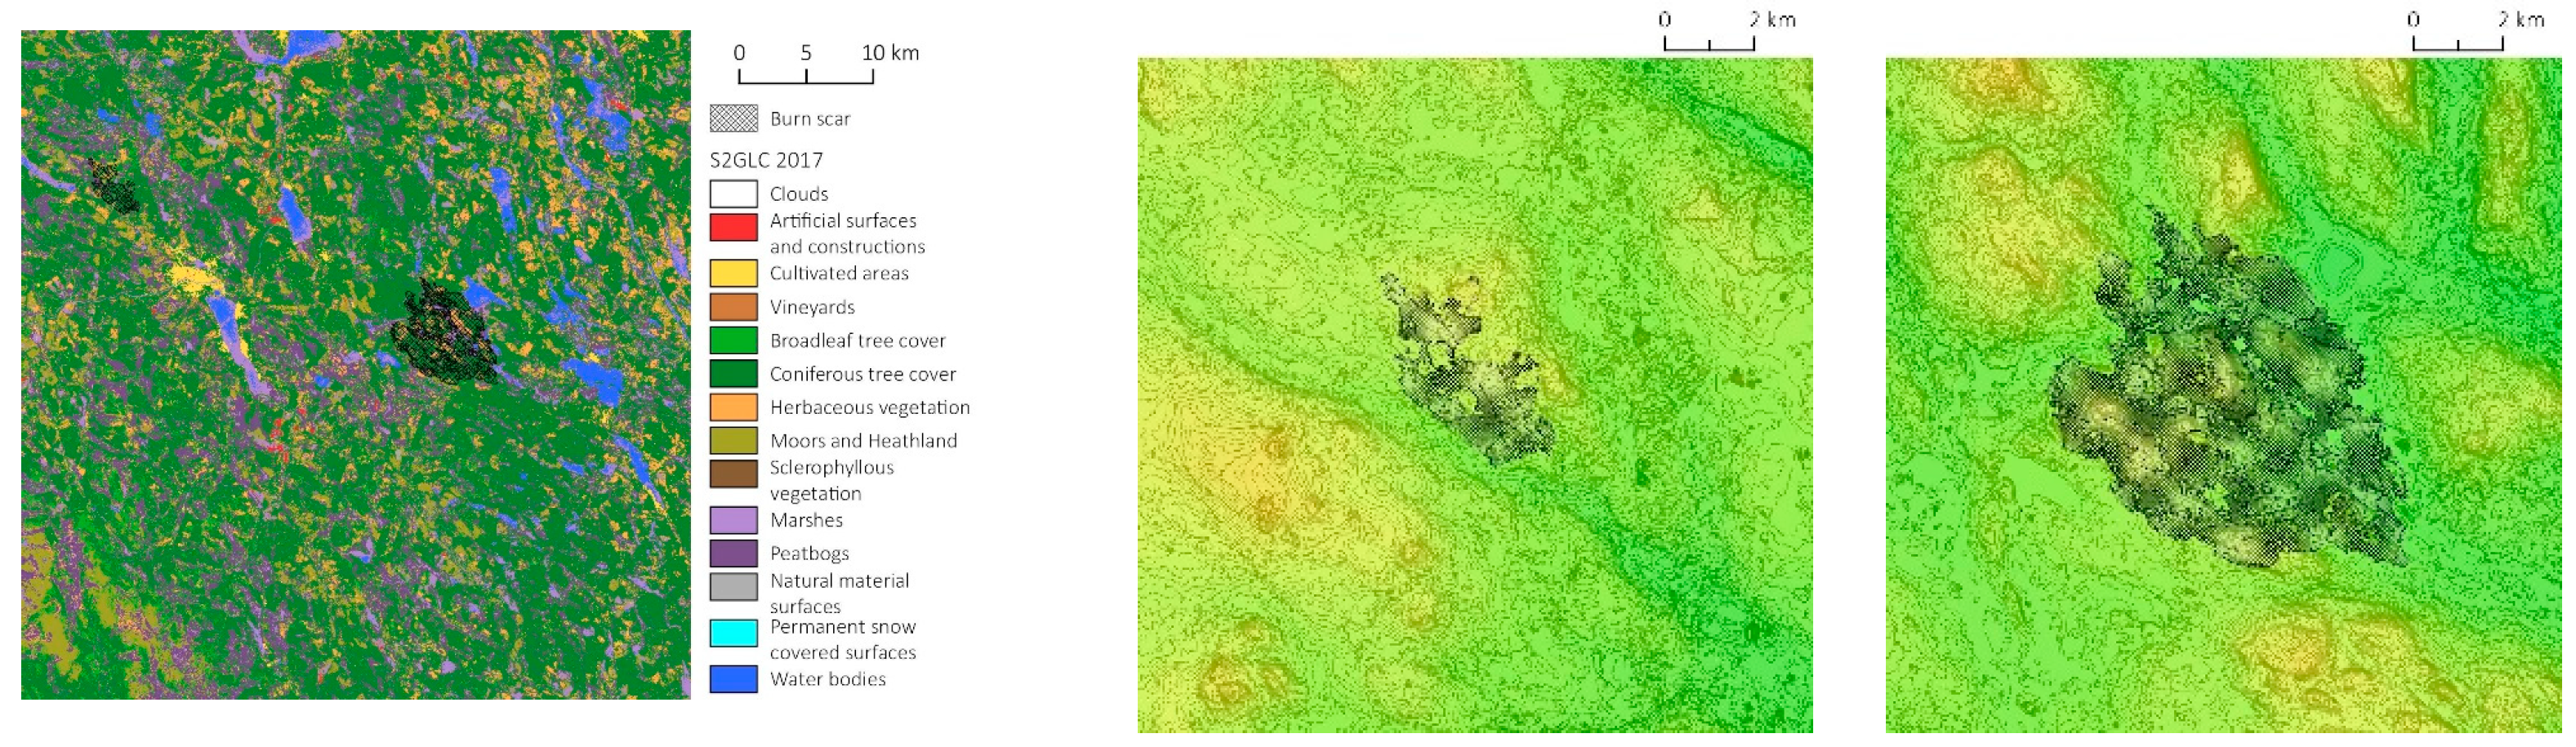
2.3.2. Sweden
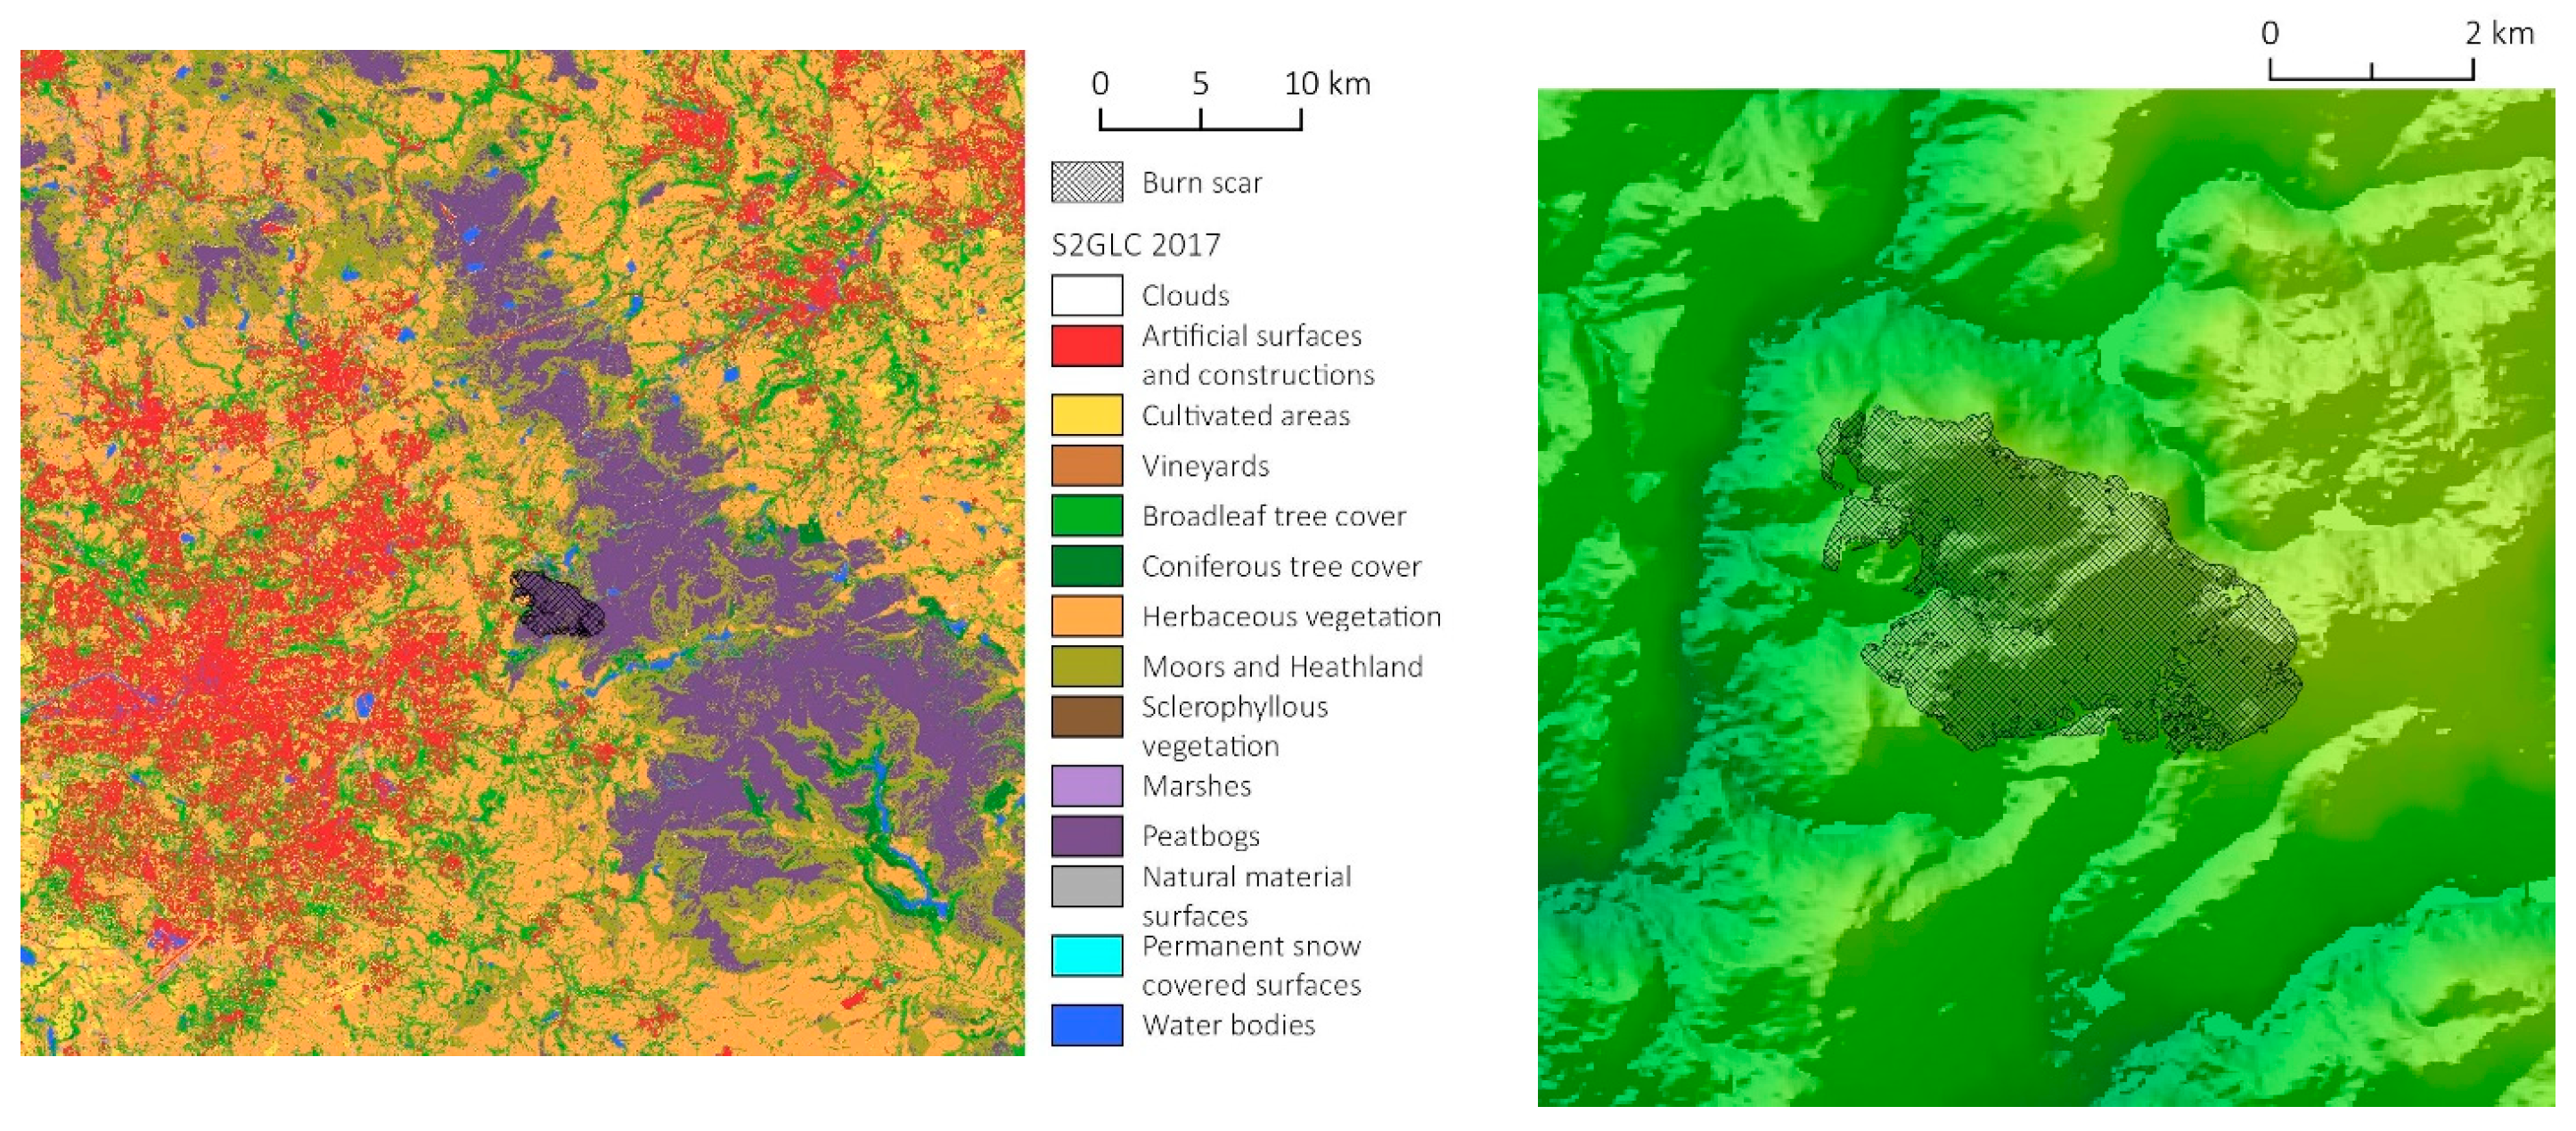
2.3.3. United Kingdom
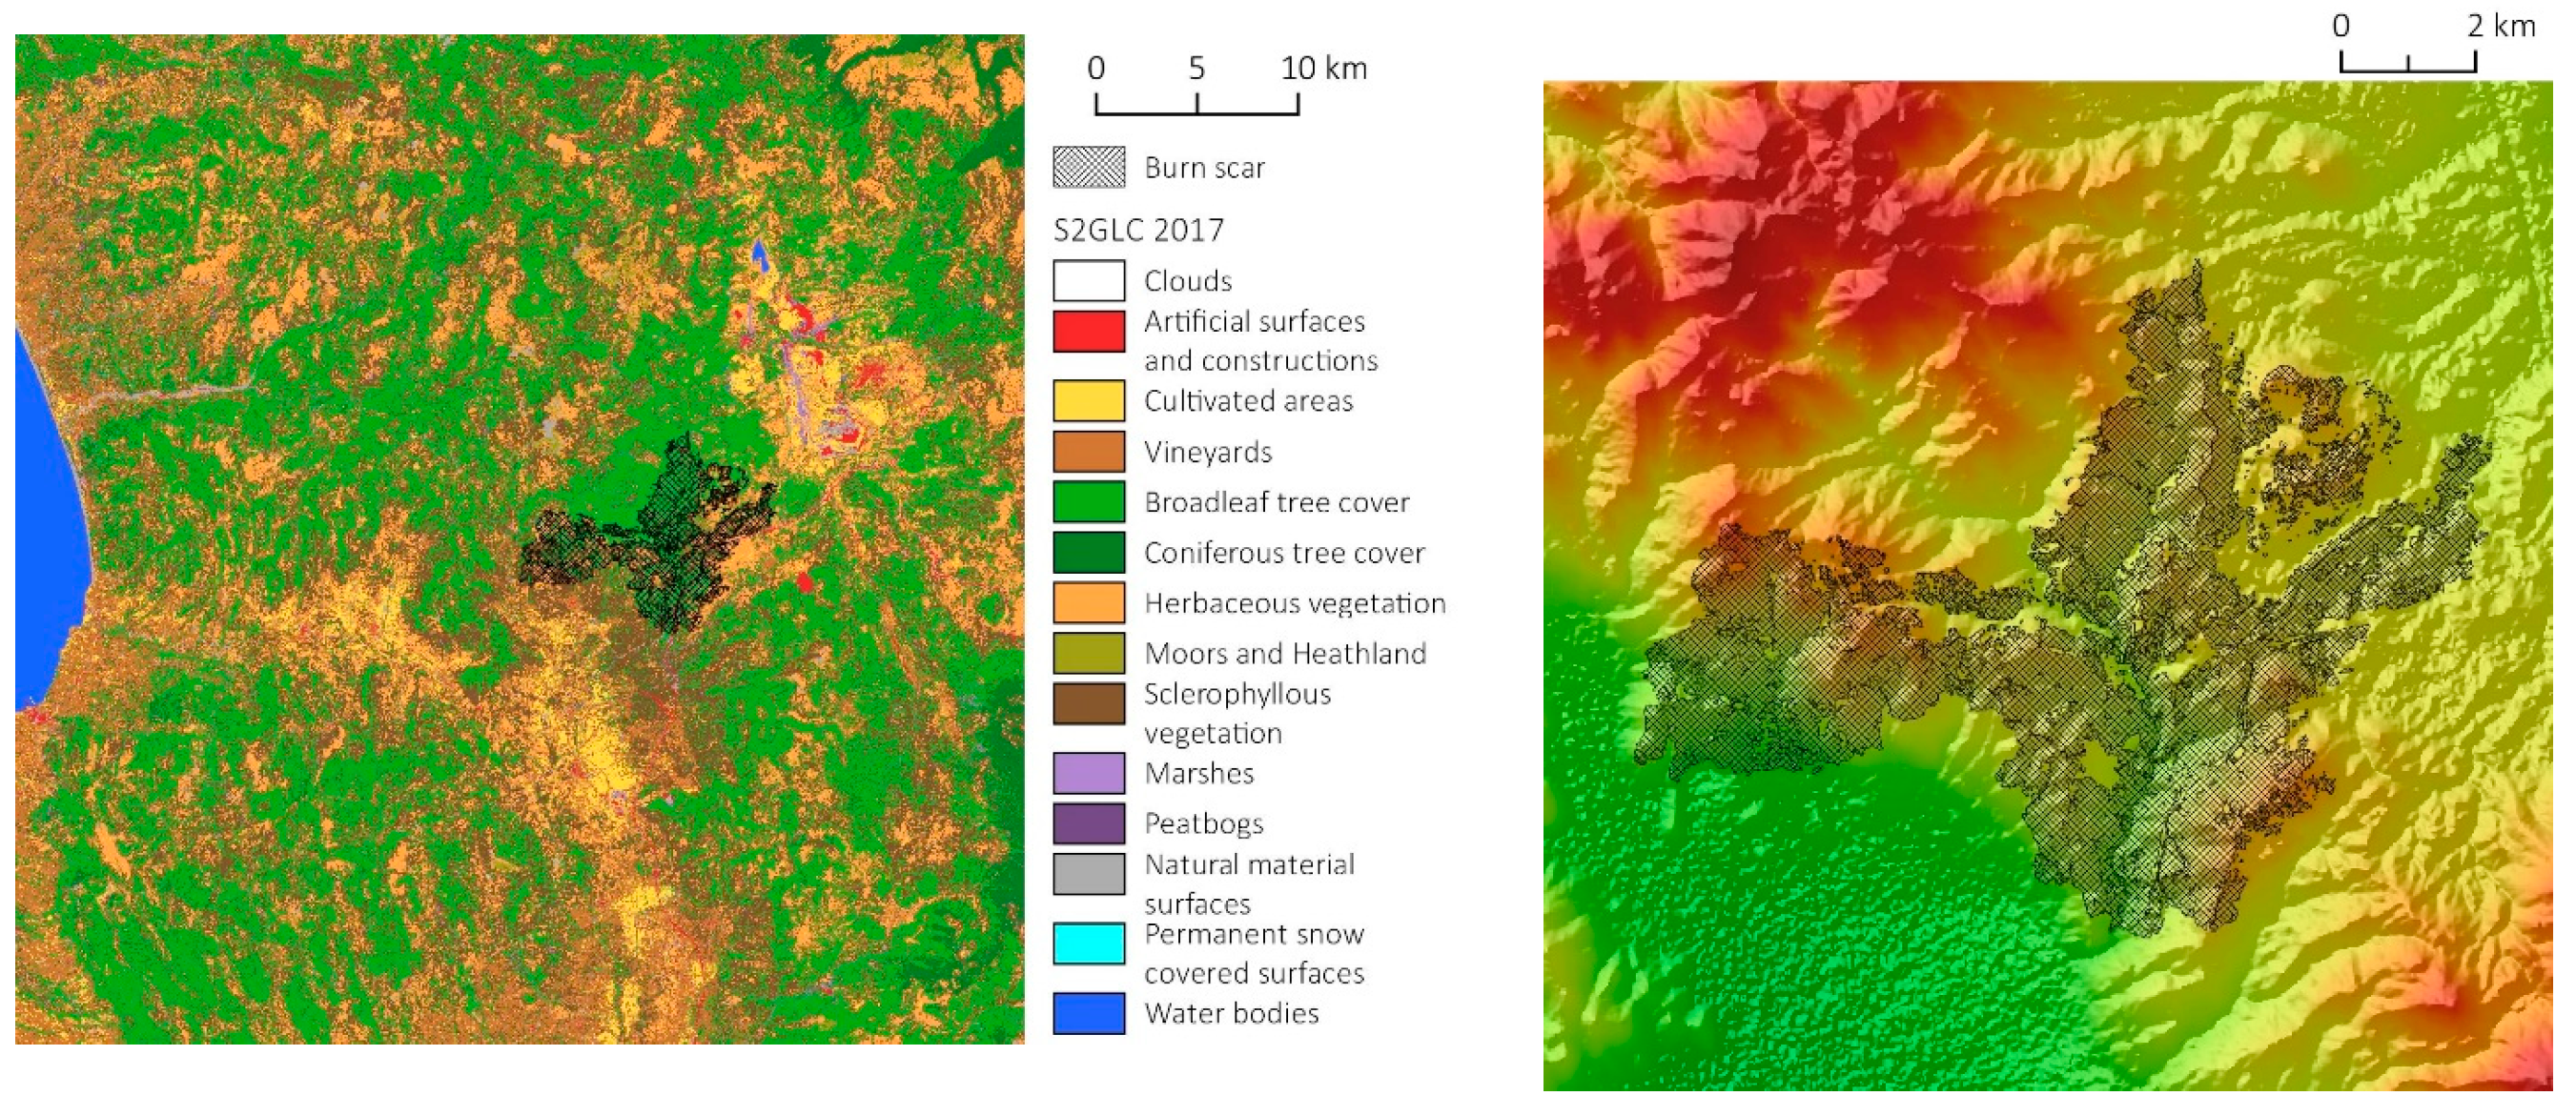
2.3.4. Greece
3. Methods
3.1. Object-Based Algorithm
3.2. Pixel-Based Algorithm
3.3. Validation
3.4. Comparison
4. Results
4.1. Validation of Burn Scars Maps

| Test Site | Method | No. of Burnt Reference Points | No. of Non-burnt Reference Points | TP | FP | FN | Recall | Precision | F1 | OA (%) |
|---|---|---|---|---|---|---|---|---|---|---|
| TS1 PL | pixel-based | 446 | 24,554 | 293 | 212 | 153 | 0.66 | 0.58 | 0.62 | 98.54 |
| object-based | 222 | 24 | 224 | 0.50 | 0.90 | 0.64 | 99.01 | |||
| EMS Copernicus | 445 | 14 | 1 | 1.00 | 0.97 | 0.98 | 99.94 | |||
| TS2 SE | pixel-based | 368 | 24,632 | 268 | 82 | 100 | 0.73 | 0.77 | 0.75 | 99.27 |
| object-based | 232 | 116 | 136 | 0.63 | 0.67 | 0.65 | 98.99 | |||
| EMS Copernicus | 361 | 264 | 7 | 0.98 | 0.58 | 0.73 | 98.92 | |||
| TS3 UK | pixel-based | 94 | 24,906 | 90 | 125 | 4 | 0.96 | 0.42 | 0.58 | 99.48 |
| object-based | 91 | 20 | 3 | 0.97 | 0.82 | 0.89 | 99.91 | |||
| EMS Copernicus | 94 | 20 | 0 | 1.00 | 0.83 | 0.90 | 99.92 | |||
| TS4 GR | pixel-based | 397 | 24,603 | 362 | 45 | 35 | 0.91 | 0.89 | 0.90 | 99.68 |
| object-based | 324 | 25 | 73 | 0.82 | 0.93 | 0.87 | 99.61 | |||
| EMS Copernicus | 395 | 122 | 2 | 1.00 | 0.76 | 0.86 | 99.50 |
4.2. Comparison of the Pixel- Versus Object-Based Approach
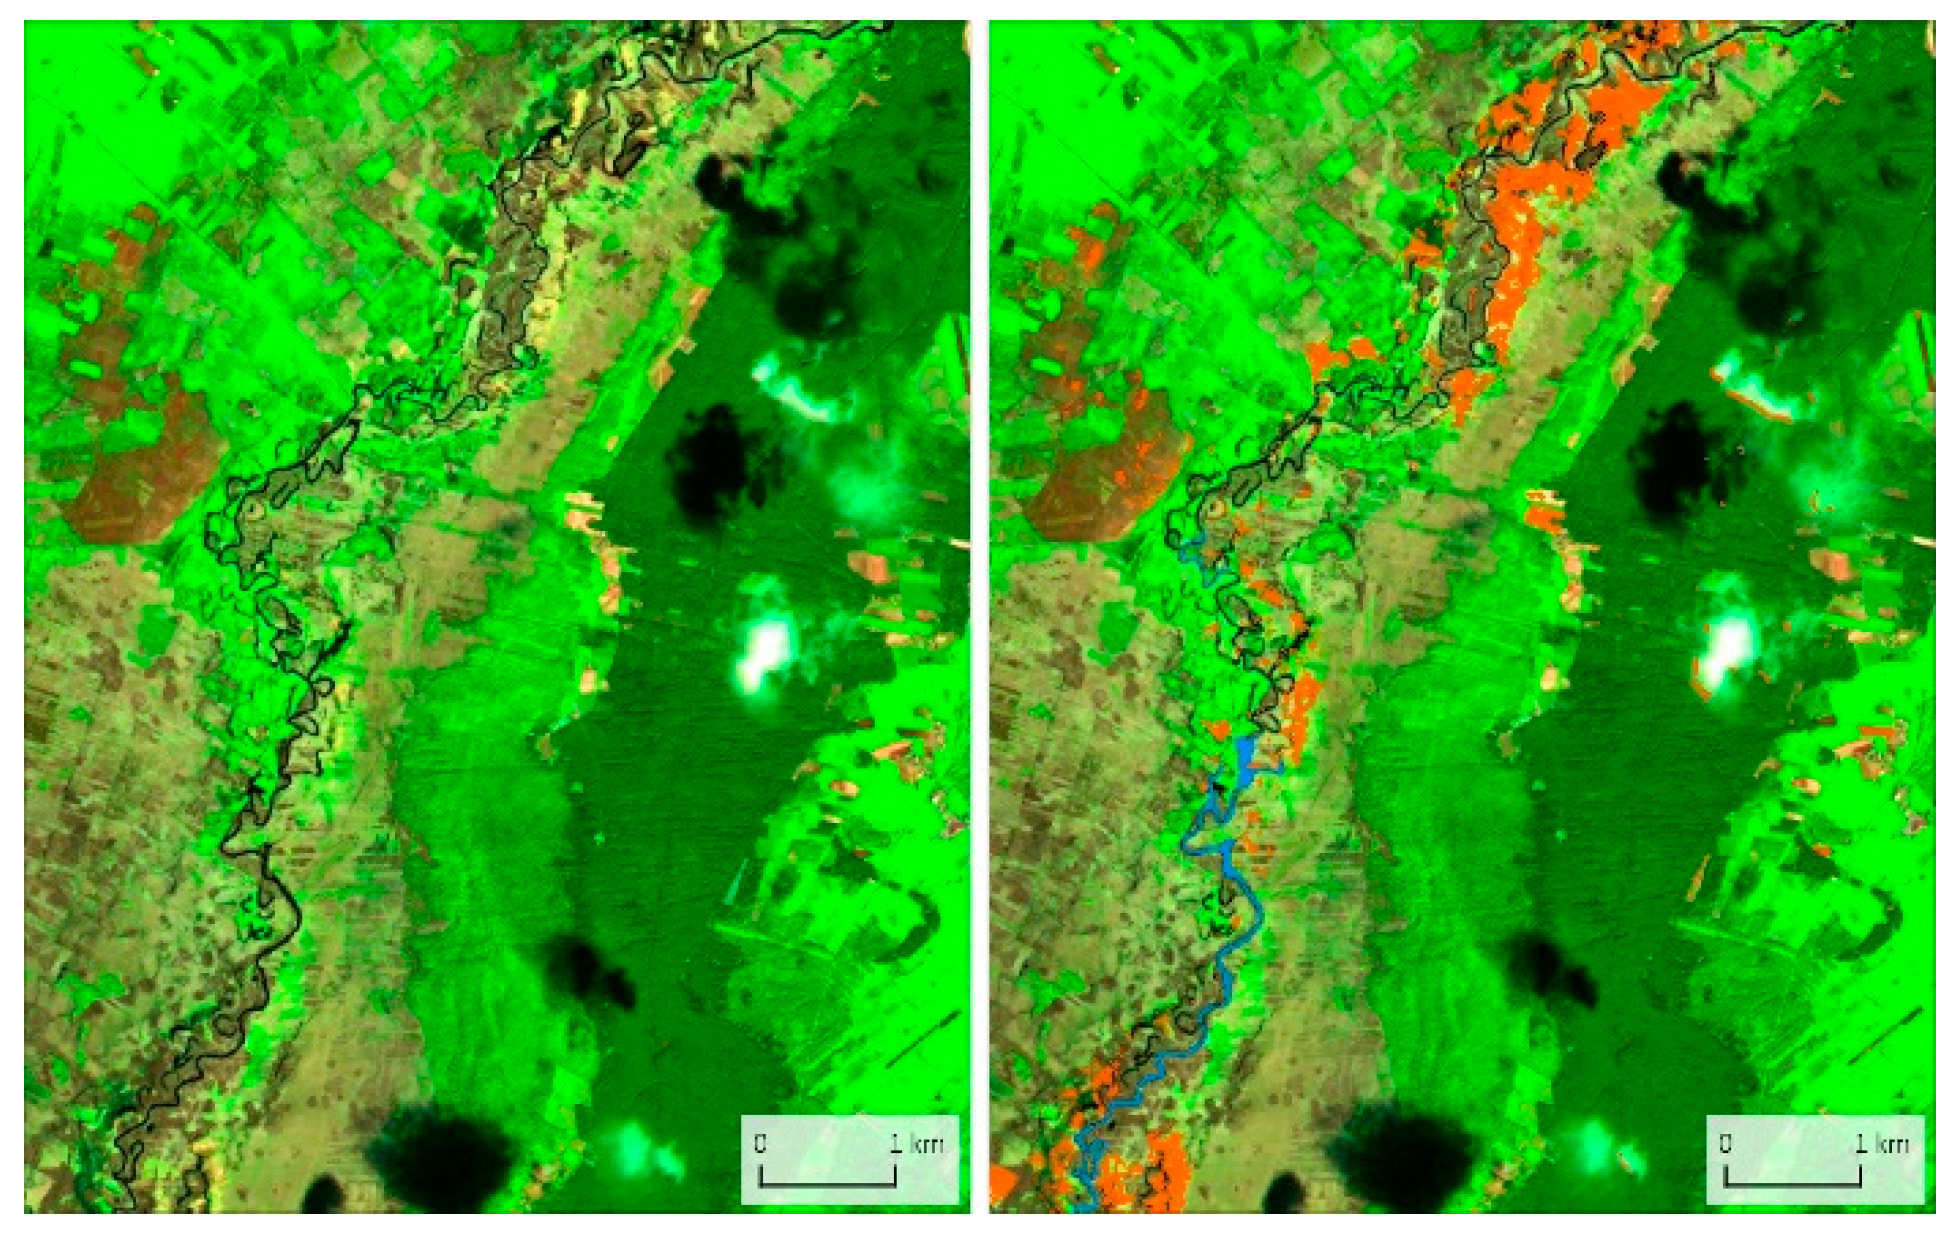
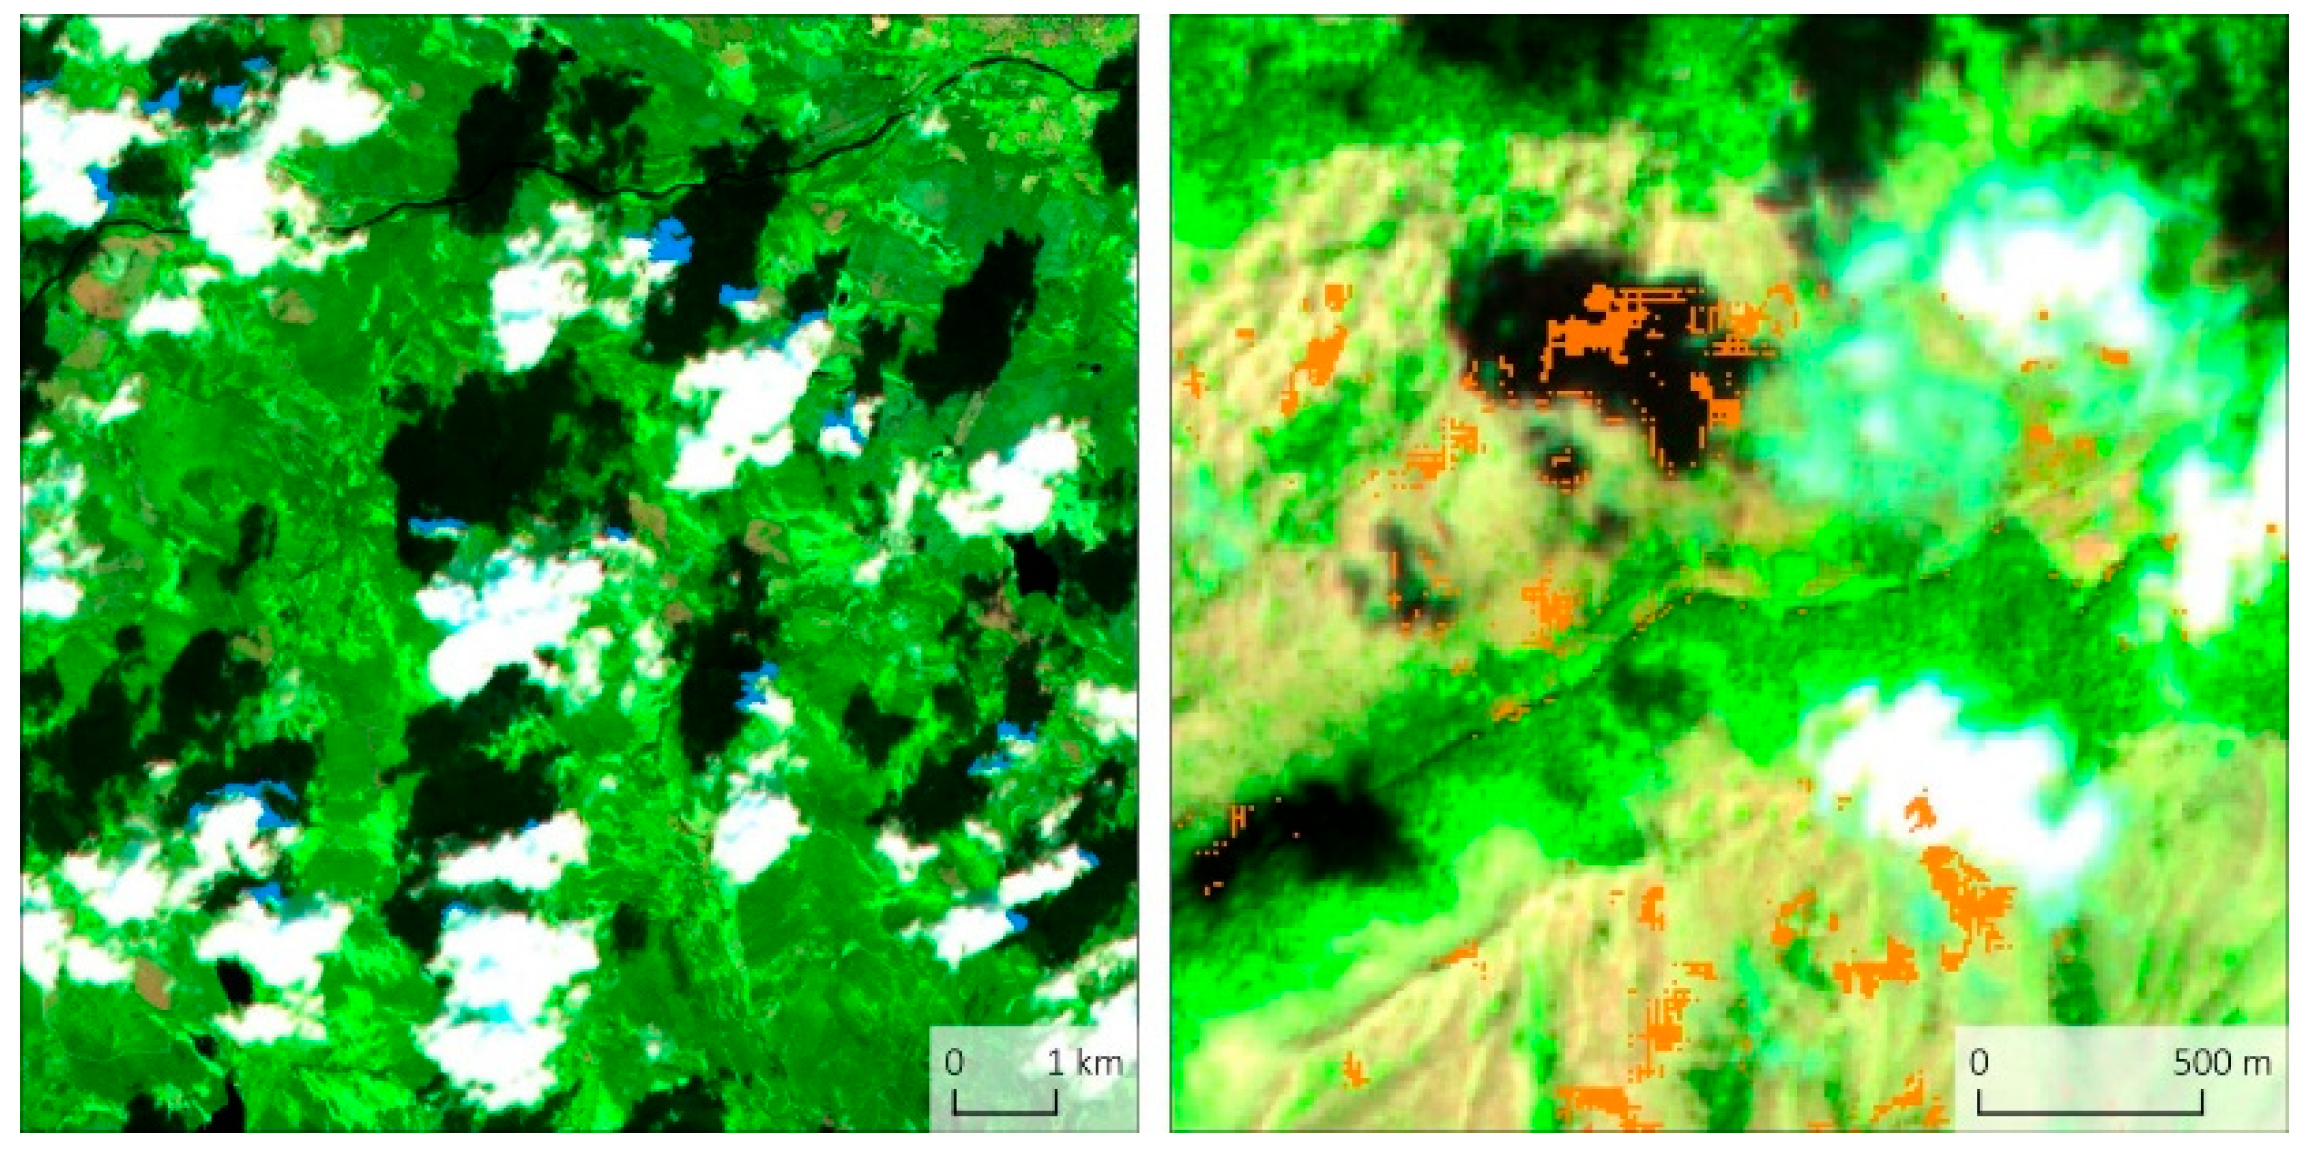
4.2.1. Visual Analysis of the Results
| Object-Based Method | Pixel-Based Method |
|---|---|
| TS 1 Poland | |
| Commission Errors | |
|
|
| Omission Errors | |
| - forest |
| TS 2 Sweden | |
| Commission Errors | |
|
|
| Ommission Errors | |
| - forest | - forest |
| TS 3 United Kingdom | |
| Commission Errors | |
|
|
| Omission Errors | |
| - small areas inside and one bigger at the edge of the main burn scar | none |
| TS 4 Greece | |
| Commission Errors | |
|
|
| Omission Errors | |
| - burnt trees |
| Commission Errors | Omission Errors | |||
|---|---|---|---|---|
| Object-Based | Pixel-Based | Object-Based | Pixel-Based | |
| Cloud or its rim | ++ | +++ | ||
| Cloud shadow or its rim | + | ++ | ||
| Water reservoir | + | |||
| Shore or part of water reservoir | + | ++ | ||
| Part of river or river’s valley (Figure 8) | + | ++ | ||
| Mowed meadow | ++ | |||
| Single pixels or small clusters of pixels with various land cover types | + | ++++ | ||
| Green vegetation inside main burn scar | +++ | |||
| Other land cover inside main burn scar | +++ | + | ||
| Trees or forest | + | ++ | +++ | |
| Meadow | + | |||
| Vineyard | + | |||
| Burnt grass between single trees or bushes | + | |||
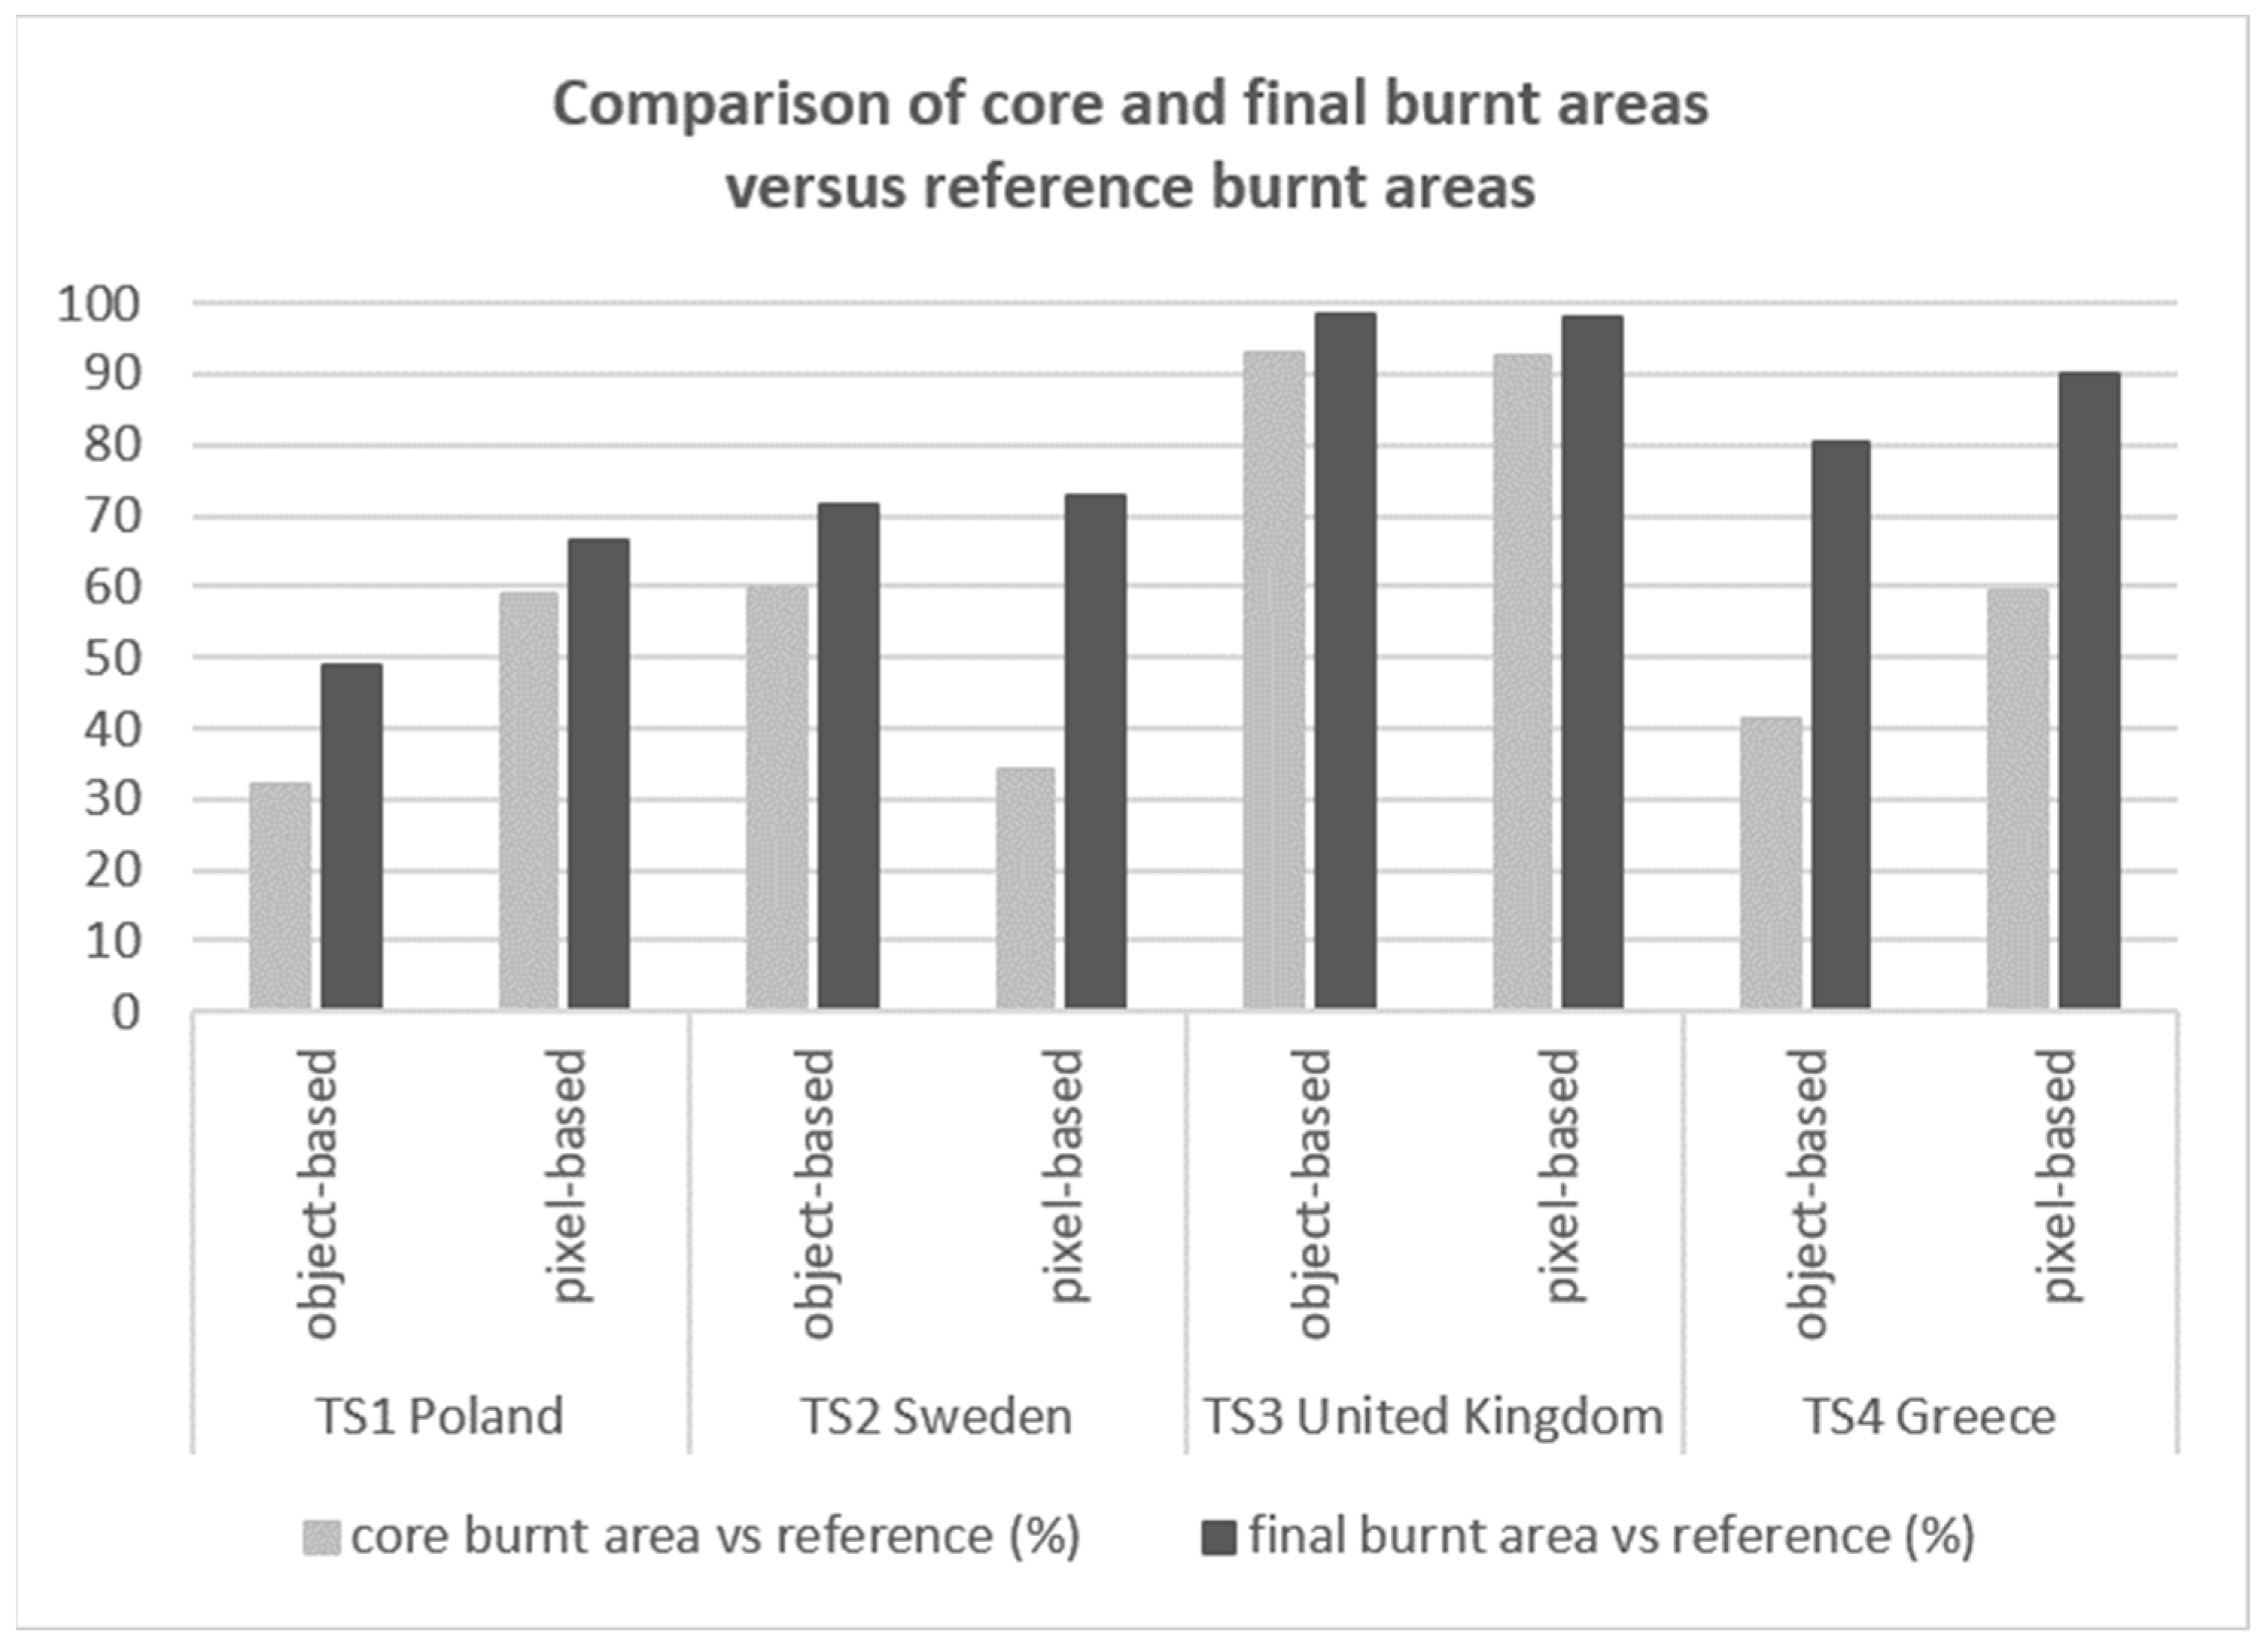
4.2.2. Comparison of Accuracies of Object- and Pixel-Based Approaches
5. Discussion
6. Conclusions
Author Contributions
Funding
Data Availability Statement
Conflicts of Interest
References
- Brushlinsky, N.N.; Ahrens, M.; Sokolov, S.V.; Wagner, P. World Fire Statistics 22; Center of Fire Statistics of International Association of Fire and Rescue Services: Ljubljana, Slovenia, 2017. [Google Scholar]
- Molina-Terrén, D.M.; Xanthopoulos, G.; Diakakis, M.; Ribeiro, L.; Caballero, D.; Delogu, G.M.; Viegas, D.X.; Silva, C.A.; Cardil, A. Analysis of forest fire fatalities in Southern Europe: Spain, Portugal, Greece and Sardinia (Italy). Int. J. Wildland Fire 2019, 28, 85–98. [Google Scholar] [CrossRef]
- Zong, X.; Tian, X.; Yao, Q.; Brown, P.M. An analysis of fatalities from forest fires in China, 1951–2018. Int. J. Wildland Fire 2022, 31, 507–517. [Google Scholar] [CrossRef]
- Andersen, A.N.; Cook, G.D.; Corbett, L.K.; Douglas, M.M.; Eager, R.W.; Russell-Smith, J.; Setterfield, S.A.; Williams, R.J.; Woinarski, J.C. Fire frequency and biodiversity conservation in Australian tropical savannas: Implications from the Kapalga fire experiment. Austral Ecol. 2005, 30, 155–167. [Google Scholar] [CrossRef]
- Certini, G. Effects of fire on properties of forest soils: A review. Oecologia 2005, 143, 1–10. [Google Scholar] [CrossRef] [PubMed]
- Kumar, G.; Kumar, A.; Saikia, P.; Roy, P.S.; Khan, M.L. Ecological impacts of forest fire on composition and structure of tropical deciduous forests of central India. Phys. Chem. Earth 2022, 128, 103240. [Google Scholar] [CrossRef]
- Alcasena, F.J.; Salis, M.; Nauslar, N.J.; Aguinaga, E.A.; Vega-García, C. Quantifying economic losses from wildfires in black pine afforestations of northern Spain. For. Policy Econ. 2016, 73, 153–167. [Google Scholar] [CrossRef]
- Stougiannidou, D.; Zafeiriou, E.; Raftoyannis, Y. Forest Fires in Greece and Their Economic Impacts on Agriculture in Economies of the Balkan and Eastern European Countries. KnE Soc. Sci. 2020, 4, 54–70. [Google Scholar] [CrossRef]
- Bowman, D.M.J.S.; Balch, J.K.; Artaxo, P.; Bond, W.J.; Carlson, J.M.; Cochrane, M.A.; D’Antonio, C.M.; DeFries, R.S.; Doyle, J.C.; Harrison, S.P.; et al. Fire in the Earth System. Science 2009, 324, 481–484. [Google Scholar] [CrossRef]
- Flannigan, M.D.; Stocks, B.J.; Wotton, B.M. Climate change and forest fires. Sci. Total Environ. 2000, 262, 221–229. [Google Scholar] [CrossRef]
- McColl-Gausden, S.C.; Bennett, L.T.; Clarke, H.G.; Ababei, D.A.; Penman, T.D. The fuel–climate–fire conundrum: How will fire regimes change in temperate eucalypt forests under climate change? Glob. Chang. Biol. 2022, 28, 5211–5226. [Google Scholar] [CrossRef]
- Chuvieco, E.; Mouillot, F.; van der Werf, G.R.; San Miguel, J.; Tanase, M.; Koutsias, N.; García, M.; Yebra, M.; Padilla, M.; Gitas, I.; et al. Historical background and current developments for mapping burned area from satellite Earth observation. Remote Sens. Environ. 2019, 225, 45–64. [Google Scholar] [CrossRef]
- Woźniak, E.; Aleksansdrowicz, S. Self-Adjusting Thresholding for Burnt Area Detection Based on Optical Images. Remote Sens. 2019, 11, 2669. [Google Scholar] [CrossRef]
- Malambo, L.; Heatwole, C.D. Automated training sample definition for seasonal burned area mapping. ISPRS J. Photogramm. Remote Sens. 2020, 160, 107–123. [Google Scholar] [CrossRef]
- Hu, X.; Ban, Y.; Nascetti, A. Uni-Temporal Multispectral Imagery for Burned Area Mapping with Deep Learning. Remote Sens. 2021, 13, 1509. [Google Scholar] [CrossRef]
- Lizundia-Loiola, J.; Franquesa, M.; Khairoun, A.; Chuvieco, E. Global burned area mapping from Sentinel-3 Synergy and VIIRS active fires. Remote Sens. Environ. 2022, 282, 113298. [Google Scholar] [CrossRef]
- Cho, A.Y.; Park, S.-E.; Kim, D.-J.; Kim, J.; Li, C.; Song, J. Burned Area Mapping Using Unitemporal PlanetScope Imagery With a Deep Learning Based Approach. IEEE J. Sel. Top. Appl. Earth Obs. Remote Sens. 2023, 16, 242–253. [Google Scholar] [CrossRef]
- Sismanis, M.; Chadoulis, R.-T.; Manakos, I.; Drosou, A. An Unsupervised Burned Area Mapping Approach Using Sentinel-2 Images. Land 2023, 12, 379. [Google Scholar] [CrossRef]
- Rouse, J.W.; Haas, R.H.; Schell, J.A.; Deering, D.W. Monitoring vegetation systems in the Great Plains with ERTS. In Proceedings of the 3rd Earth Resources Technology Satellite-1 Symposium (NASA), Washington, DC, USA, 10–14 December 1974; pp. 309–317. [Google Scholar]
- Chuvieco, E.; Martín, M.P.; Palacios, A. Assessment of different spectral indices in the red-near-infrared spectral domain for burned land discrimination. Int. J. Remote Sens. 2002, 23, 5103–5110. [Google Scholar] [CrossRef]
- Pinty, B.; Verstraete, M.M. GEMI: A non-linear index to monitor global vegetation from satellites. Vegetation 1992, 101, 15–20. [Google Scholar] [CrossRef]
- Martín, M.P. Cartografía e Inventario de Incendios Forestales en la Península Ibérica a Partir de Imágenes NOAA–AVHRR. Ph.D. Thesis, Departamento de Geografía, Universidad de Alcalá, Alcalá de Henares, Madrid, Spain, 1998. [Google Scholar]
- Key, C.H.; Benson, N.C. Measuring and remote sensing of burn severity. In Proceedings of the Joint Fire Science Conference and Workshop: Crossing the Millennium: Integrating Spatial Technologies and Ecological Principles for a New Age in Fire Management, Boise, Idaho, 15–17 June 1999; Volume 2, p. 284. [Google Scholar]
- Miller, J.D.; Thode, A.E. Quantifying burn severity in a heterogeneous landscape with a relative version of the delta Normalized Burn Ratio (dNBR). Remote Sens. Environ. 2007, 109, 66–80. [Google Scholar] [CrossRef]
- Veraverbeke, S.; Lhermitte, S.; Verstraeten, W.W.; Goossens, R. A time-integrated MODIS burn severity assessment using the multi-temporal differenced normalized burn ratio (dNBRMT). Int. J. Appl. Earth Obs. Geoinf. 2001, 13, 52–58. [Google Scholar] [CrossRef]
- Filipponi, F. BAIS2: Burned Area Index for Sentinel-2. Proceedings 2018, 2, 364. [Google Scholar] [CrossRef]
- Bastarrika, A.; Chuvieco, E.; Martín, M.P. Mapping burned areas from Landsat TM/ETM+ data with a two-phase algorithm: Balancing omission and commission errors. Remote Sens. Environ. 2011, 115, 1003–1012. [Google Scholar] [CrossRef]
- Stroppiana, D.; Bordogna, G.; Carrara, P.; Boschetti, M.; Boschetti, L.; Brivio, P.A. A method for extracting burned areas from Landsat TM/ETM+ images by soft aggregation of multiple Spectral Indices and a region growing algorithm. ISPRS J. Photogramm. Remote Sens. 2012, 69, 88–102. [Google Scholar] [CrossRef]
- Stroppiana, D.; Azar, R.; Calò, F.; Pepe, A.; Imperatore, P.; Boschetti, M.; Silva, J.M.N.; Brivio, P.A.; Lanari, R. Integration of Optical and SAR Data for Burned Area Mapping in Mediterranean Regions. Remote Sens. 2015, 7, 1320–1345. [Google Scholar] [CrossRef]
- Hawbaker, T.J.; Vanderhoof, M.K.; Beal, Y.-J.; Takacs, J.D.; Schmidt, G.L.; Falgout, J.T.; Williams, B.; Fairaux, N.M.; Caldwell, M.K.; Picotte, J.J.; et al. Mapping burned areas using dense time-series of Landsat data. Remote Sens. Environ. 2017, 198, 504–522. [Google Scholar] [CrossRef]
- Goodwin, N.R.; Collett, L.J. Development of an automated method for mapping fire history captured in Landsat TM and ETM + time series across Queensland, Australia. Remote Sens. Environ. 2014, 148, 206–221. [Google Scholar] [CrossRef]
- Gitas, I.Z.; Mitri, G.H.; Ventura, G. Object-based image classification for burned area mapping of Creus Cape, Spain, using NOAA-AVHRR imagery. Remote Sens. Environ. 2004, 92, 409–413. [Google Scholar] [CrossRef]
- Mitri, G.H.; Gitas, I.Z. A semi-automated object-oriented model for burned area mapping in the Mediterranean region using Landsat-TM imagery. Int. J. Wildland Fire 2004, 13, 367–376. [Google Scholar] [CrossRef]
- Chen, M.; Su, W.; Li, L.; Zhang, C.; Anzhi, Y.; Li, H. A Comparison of Pixel-based and Object-oriented Classification Using SPOT5 Imagery. Appl. Comput. Math. 2008, 6, 321–326. [Google Scholar]
- Bernardini, A.; Frontoni, E.; Malinverni, E.S.; Mancini, A.; Tassetti, A.; Zingaretti, P. Pixel, object and hybrid classification comparisons. J. Spat. Sci. 2010, 55, 43–54. [Google Scholar] [CrossRef]
- Bhaskaran, S.; Paramananda, S.; Ramnarayan, M. Per-pixel and object-oriented classification methods for mapping urban features using Ikonos satellite data. Appl. Geogr. 2010, 30, 650–665. [Google Scholar] [CrossRef]
- Zoleikani, R.; Zoej, M.J.V.; Mokhtarzadeh, M. Comparison of Pixel and Object Oriented Based Classification of Hyperspectral Pansharpened Images. J. Indian Soc. Remote Sens. 2017, 45, 25–33. [Google Scholar] [CrossRef]
- Moosavi, V.; Talebi, A.; Shirmohammadi, B. Producing a landslide inventory map using pixel-based and object-oriented approaches optimized by Taguchi method. Geomorphology 2014, 204, 646–656. [Google Scholar] [CrossRef]
- Planet, Planet Imagery Product Specifications. 2022. Available online: https://assets.planet.com/docs/Planet_Combined_Imagery_Product_Specs_letter_screen.pdf (accessed on 10 May 2023).
- Burned Area Satellite Product Validation Protocol Page. Available online: https://lpvs.gsfc.nasa.gov/PDF/BurnedAreaValidationProtocol.pdf (accessed on 20 April 2023).
- Farr, T.G.; Rosen, P.A.; Caro, E.; Crippen, R.; Duren, R.; Hensley, S.; Kobrick, M.; Paller, M.; Rodriguez, E.; Roth, L.; et al. The Shuttle Radar Topography Mission. Rev. Geophys. 2007, 45, RG2004. [Google Scholar] [CrossRef]
- Kurczyński, Z. Airborne Laser Scanning in Poland—Between Science and Practice. Arch. Photogramm. Cartogr. Remote Sens. 2019, 31, 105–133. [Google Scholar] [CrossRef]
- Tadono, T.; Nagai, H.; Ishida, H.; Oda, F.; Naito, S.; Minakawa, K.; Iwamoto, H. Initial Validation of the 30 m-mesh Global Digital Surface Model Generated by ALOS PRISM. In Proceedings of the International Archives of the Photogrammetry, Remote Sensing and Spatial Information Sciences, XXIII ISPRS Congress, Prague, Czech Republic, 12–19 July 2016; Volume XLI-B4, pp. 157–162. [Google Scholar]
- Level-2A Algorithm Overview, ESA Page. Available online: https://sentinels.copernicus.eu/web/sentinel/technical-guides/sentinel-2-msi/level-2a/algorithm-overview (accessed on 20 April 2023).
- Malinowski, R.; Lewiński, S.; Rybicki, M.; Gromny, E.; Jenerowicz, M.; Krupiński, M.; Nowakowski, A.; Wojtkowski, C.; Krupiński, M.; Krätzschmar, E.; et al. Automated Production of a Land Cover/Use Map of Europe Based on Sentinel-2 Imagery. Remote Sens. 2020, 12, 3523. [Google Scholar] [CrossRef]
- Rapid Mapping, Copernicus Emergency Management Service Page. Available online: https://emergency.copernicus.eu/mapping/list-of-activations-risk-and-recovery (accessed on 11 May 2023).
- Baatz, M.; Schäpe, A. Object-oriented and multi-scale image analysis in semantic networks. In Proceedings of the 2nd International Symposium: Operationalization of Remote Sensing, Enschede, The Netherlands, 16–20 August 1999; pp. 7–13. [Google Scholar]
- McFeeters, S.K. The use of the Normalized Difference Water Index (NDWI) in the delineation of open water features. Int. J. Remote Sens. 1996, 17, 1425–1432. [Google Scholar] [CrossRef]
- Huete, A.; Didan, K.; Miura, T.; Rodriguez, E.P.; Gao, X.; Ferreira, L.G. Overview of the radiometric and biophysical performance of the MODIS vegetation indices. Remote Sens. Environ. 2002, 83, 195–213. [Google Scholar] [CrossRef]
- Loboda, T.; O’Neal, K.; Csiszar, I. Regionally adaptable dNBR-based algorithm for burned area mapping from MODIS data. Remote Sens. Environ. 2007, 109, 429–442. [Google Scholar] [CrossRef]
- Comaniciu, D.; Meer, P. Mean shift: A robust approach toward feature space analysis. IEEE Trans. Pattern Anal. Mach. Intell. 2002, 24, 603–619. [Google Scholar] [CrossRef]
- Li, C.H.; Lee, C.K. Minimum cross entropy thresholding. Pattern Recognit. 1993, 26, 617–625. [Google Scholar] [CrossRef]
- Congalton, R.G.; Green, K. Assessing the Accuracy of Remotely Sensed Data: Principles and Practices, 2nd ed.; CRC Press: Boca Raton, FL, USA, 2008. [Google Scholar]
- Map of Main Climates in Europe, European Environment Agency Page. Available online: https://www.eea.europa.eu/data-and-maps/figures/climate (accessed on 20 April 2023).
- Cloudy Earth, NASA Earth Observatory Page. Available online: https://earthobservatory.nasa.gov/images/85843/cloudy-earth (accessed on 26 April 2023).
- Coluzzi, R.; Imbrenda, V.; Lanfredi, M.; Simoniello, T. A first assessment of the Sentinel-2 Level 1-C cloud mask product to support informed surface analyses. Remote Sens. Environ. 2018, 217, 426–443. [Google Scholar] [CrossRef]
- Stroppiana, D.; Grégoire, J.-M.; Pereira, J.M.C. The use of SPOT VEGETATION data in a classification tree approach for burnt area mapping in Australian savanna. Int. J. Remote Sens. 2003, 24, 2131–2151. [Google Scholar] [CrossRef]
- Hamilton, D.; Brothers, K.; McCall, C.; Gautier, B.; Shea, T. Mapping Forest Burn Extent from Hyperspatial Imagery Using Machine Learning. Remote Sens. 2021, 13, 3843. [Google Scholar] [CrossRef]


| Test Site (TS) | TS 1 Poland | TS 2 Sweden | TS 3 United Kingdom | TS 4 Greece |
|---|---|---|---|---|
| Pre-event image | Sentinel-2 L2A, 25 March 2020 | Sentinel-2 L2A, 4 July 2018 | Sentinel-2 L2A, 24 June 2018 | Sentinel-2 L2A, 1 August 2021 |
| Post-event image | Sentinel-2 L2A, 14 May 2020 | Sentinel-2 L2A, 27 July 2018 | Sentinel-2 L2A, 14 July 2018 | Sentinel-2 L2A, 16 August 2021 |
| Reference image | PlanetScope, 8 May 2020 | PlanetScope, 27 July 2018 | PlanetScope, 14 July 2018 | PlanetScope, 15 August 2021 |
| Test Site (TS) | TS 1 Poland | TS 2 Sweden | TS 3 United Kingdom | TS 4 Greece |
|---|---|---|---|---|
| Activation no. of Copernicus EMS Rapid Mapping | EMSR 436—Goniadz) | EMSR 436—Lillhardal and Strandasmyrvallen | EMSR 436—Mossley | EMSR 436—Diabolitsi |
| Elevation | DEM SRTM v.3.0 (NASA), DEM LiDAR (GUGiK) | DEM ALOS World 3D (JAXA) | DEM SRTM v.3.0 (NASA) | DEM SRTM v.3.0 (NASA) |
| Clouds and shadows | Sentinel-2 Land Cover band, 15 May 2020 | Sentinel-2 Land Cover band, 27 July 2018 | n/a | n/a |
| Land cover | S2GLC 2017 | S2GLC 2017 | S2GLC 2017 | S2GLC 2017 |
Disclaimer/Publisher’s Note: The statements, opinions and data contained in all publications are solely those of the individual author(s) and contributor(s) and not of MDPI and/or the editor(s). MDPI and/or the editor(s) disclaim responsibility for any injury to people or property resulting from any ideas, methods, instructions or products referred to in the content. |
© 2023 by the authors. Licensee MDPI, Basel, Switzerland. This article is an open access article distributed under the terms and conditions of the Creative Commons Attribution (CC BY) license (https://creativecommons.org/licenses/by/4.0/).
Share and Cite
Milczarek, M.; Aleksandrowicz, S.; Kita, A.; Chadoulis, R.-T.; Manakos, I.; Woźniak, E. Object- Versus Pixel-Based Unsupervised Fire Burn Scar Mapping under Different Biogeographical Conditions in Europe. Land 2023, 12, 1087. https://doi.org/10.3390/land12051087
Milczarek M, Aleksandrowicz S, Kita A, Chadoulis R-T, Manakos I, Woźniak E. Object- Versus Pixel-Based Unsupervised Fire Burn Scar Mapping under Different Biogeographical Conditions in Europe. Land. 2023; 12(5):1087. https://doi.org/10.3390/land12051087
Chicago/Turabian StyleMilczarek, Marta, Sebastian Aleksandrowicz, Afroditi Kita, Rizos-Theodoros Chadoulis, Ioannis Manakos, and Edyta Woźniak. 2023. "Object- Versus Pixel-Based Unsupervised Fire Burn Scar Mapping under Different Biogeographical Conditions in Europe" Land 12, no. 5: 1087. https://doi.org/10.3390/land12051087