
Analysis of the China’s Interprovincial Innovation Connection Network Based on Modified Gravity Model


1
School of Design and Architecture, Zhejiang University of Technology, Hangzhou 310023, China
2
School of Architecture, Southeast University, Nanjing 210096, China
*
Author to whom correspondence should be addressed.
Land 2023, 12(5), 1091; https://doi.org/10.3390/land12051091
Submission received: 16 March 2023
/
Revised: 7 May 2023
/
Accepted: 16 May 2023
/
Published: 18 May 2023
(This article belongs to the Special Issue Sustainable Development in Urban and Regional Planning: New Findings, New Tools and New Perspectives)
Abstract
:With the arrival of the era of innovative economy, innovation is of great significance for the development of China, and even the world. Based on statistical data and taking 2009, 2014, and 2019 as node years, this study uses the entropy weight method and a modified gravity model to study the pattern and evolution characteristics of China’s interprovincial innovation network. The results showed that: 1. The weights of innovation output, innovation input, and innovation environment were 0.253, 0.340, and 0.407, respectively. Currently, innovation output is the most representative of the interprovincial innovation connections, but the weight of innovation environment has been increasing year by year, and its importance is constantly highlighted. 2. The overall spatial structure of China’s interprovincial innovation network shows a “core periphery” feature, radiating from coastal provinces such as Jiangsu, Beijing, and Zhejiang to inland provinces, and exhibiting an overall pattern of “strong in the east and weak in the west”. 3. In terms of evolutionary characteristics, Guangdong and Jiangsu ranked in the top two in terms of outward innovation scale from 2009 to 2019. The combined total innovation connections of the top five provinces in 2009, 2014, and 2019 accounted for 70.79%, 64.29%, and 64.24%, respectively. Although the phenomenon of uneven innovation connections exists, it has slowed down. In addition, China’s interprovincial innovation network is gradually becoming enriched, with the most significant change being the number of innovation links, with a gravity level increasing from four in 2009 to twenty-six in 2019. The interprovincial innovation links continue to strengthen, but the focus has not changed significantly; it is still concentrated in the Bohai Rim region and the Yangtze River Delta region. 4. In terms of maximum gravitational lines, Guangdong Province had the highest number of maximum gravitational lines in 2009, 2014, and 2019, with a total of six. The maximum gravitational line change from 2009 to 2019 took place from 2014 to 2019, transitioning from “Jilin-Liaoning” to “Jilin-Heilongjiang”.
1. Introduction
Against the backdrop of deepening supply side structural reform, China’s economic development has shifted from traditionally factor-driven and investment-driven to innovation-driven [1]. In 2018, the “Opinions of the State Council on Promoting the High Quality Development of Innovation and Entrepreneurship and Creating an Upgraded Version of “Mass Entrepreneurship” proposed to promote mass innovation. With the arrival of the era of innovative economy, the flow of innovative elements such as knowledge, technology, patents, and talents has strengthened the innovation connections between cities, regions, and even countries.
The research on innovation connections at home and abroad mainly includes three aspects: 1. Research on the diffusion of innovation space. Hägerstrand put forward the three stage theory of innovation space diffusion in the 1950s [2]. Relevant studies believe that the ability of regions to absorb new technologies and the transfer of tacit knowledge through face-to-face exchanges are the main reasons for the diffusion of new technologies from “core” regions to “marginal” regions [3]. Due to the fact that large cities have more high-quality human resources and higher absorption rates of new technologies, their innovation competitiveness is stronger than ordinary cities, thus occupying a circular advantage in the diffusion of innovation levels in the urban system [4,5]. In addition, relevant studies have shown that due to the advantages of infrastructure, transportation, and cultural atmosphere in large cities, new economic industries are more likely to emerge, which accelerates the agglomeration of innovative enterprises in the center of large cities, increases the growth space of enterprises, and further accelerates the diffusion of innovation space [6,7,8]. 2. Research on innovation cooperation. Most scholars mainly use data such as patent cooperation [9], paper cooperation [10], R&D activities [11], and high-tech enterprise information [12] to conduct research on innovation cooperation between cities and regions. 3. Research on Regional Innovation Networks. Freeman proposed the concept of innovation networks earlier, believing that the connection of innovation networks is based on innovation cooperation between enterprises [13]. Tong Xin et al. further believed that regional innovation networks refer to relatively stable systems formed by different entities such as enterprises, research institutions, local government organizations, and individuals on the basis of cooperation and exchange [14,15]. Most scholars have conducted research on the evolution of regional innovation networks, and relevant studies have shown that innovation networks have structural and proximity characteristics [16]. During the evolution process of innovation networks, they are influenced by cumulative and selection mechanisms [17] as well as dynamic evolution due to changes in factors such as innovation sources, innovation services, innovation environment, industrial foundation, and policy systems [18,19,20,21].
Through the literature review, it was found that significant progress has been made in research on innovation connection both domestically and internationally, but there are still the following issues. For China, which is rapidly developing in innovation, relevant research on the research scale is mostly focused on cities and urban agglomerations [22], with less attention paid to the interprovincial innovation connections at the national level as a whole. In terms of research methods, many methods such as kernel density analysis, geographical weighted regression model, spatial cluster analysis, and spatial autocorrelation analysis are used to analyze the spatial pattern of innovation [23,24,25], and the gravity model is usually used to quantitatively analyze the innovation links between urban areas [26]. However, the measurement indicators of the classic gravity model are usually too isolated, and the distance in the model is often interfered with by other factors, making it unable to reflect its innovation ability. Therefore, in order to explore the future development of interprovincial innovation connections in China, this study analyzes the pattern and evolution characteristics of China’s interprovincial innovation connection by building evaluation indicators of China’s interprovincial innovation connection, using the entropy weight method to determine the indicator weights, and revising the gravity model, with a view to proposing more perfect planning responses and providing references for China to implement innovation development strategies, optimize innovation resource allocation, and improve regional innovation efficiency.
2. Research Scope and Data Source
Innovation competition has gradually become the focus of global competition. At the 19th National Congress, China clearly proposed to implement an innovation-driven development strategy, build an innovative country, and vigorously improve regional innovation capabilities. At present, China has entered a stage of high-quality development. As important nodes in the spatial innovation network, provinces and cities have built bridges for the circulation of funds, talents, and technology, which is of great significance for building an innovative country [27]. Therefore, this study takes China as an example, using the first level administrative regions of China as the research unit, and takes 2009, 2014, and 2019 as the node years to explore the pattern and evolution characteristics of China’s interprovincial innovation connection network. The research subjects mainly include three types: 1. Municipalities directly under the central government: Beijing, Tianjin, Shanghai, and Chongqing. 2. Provinces: Hebei, Shanxi, Liaoning, Jilin, Heilongjiang, Jiangsu, Zhejiang, Anhui, Fujian, Jiangxi, Shandong, Henan, Hubei, Hunan, Guangdong, Hainan, Sichuan, Guizhou, Yunnan, Shaanxi, Gansu, and Qinghai. 3. Autonomous regions: Inner Mongolia Autonomous Region, Guangxi Zhuang Autonomous Region, Tibet Autonomous Region, Ningxia Hui Autonomous Region, and Xinjiang Uygur Autonomous Region. Due to data acquisition issues, this study does not include Taiwan Province, Hong Kong Special Administrative Region, and Macau Special Administrative Region.
The data in the paper are all sourced from the corresponding year’s “China Urban Statistical Yearbook” and “China Science and Technology Statistical Yearbook”, as well as statistical data from various provincial science and technology statistical websites and science and technology departments. The distance data come from the geographic distance and time distance between cities, retrieved using Baidu Maps with the shortest driving distance and the shortest train (high-speed rail) time as constraints. Partial missing data are filled in using methods such as replacing adjacent year data and mean interpolation.
3. Methods
3.1. Entropy Weight Method
The evaluation indicators for interprovincial innovation connection in China established in this article involve multiple evaluation dimensions; the dimensions of different indicators are also different, and the importance of each indicator cannot be objectively and accurately given. The entropy weight method only relies on the discreteness of the data, and is an objective weighting method suitable for calculating the weights of the above indicators. The steps taken to calculate weights using the entropy weight method are as follows [28]:
Standardize the data using the sum normalization method, and then use the entropy weight method to determine the weight of the index .
Standardization treatment:
Information entropy:
Value:
Weight:
is the original data of under index of the research year, is the entropy of the index, and is the weight of the indicator.
3.2. Modified Gravity Model
Regional innovation spatial connection refers to the geographical spatial connection formed by the dynamic flow of innovation factors among different innovation entities [29]. The current research mostly uses the classical gravity model to quantitatively measure the strength of regional innovation connection, but the classical gravity model also has some limitations. Influenced by modern information technology and transportation, simple direct geographical distance cannot accurately reflect the distance between regions in real space [30,31,32,33]. Research suggests that the flow of innovative elements today is not only influenced by geographical distance, but also by temporal and spatial factors [34,35]. “Spatiotemporal contraction” or “spatiotemporal convergence” describes the gradual reduction in travel time between two locations [36]. In order to obtain more realistic measurement results, time and spatial factors must be considered. Therefore, by making up for the defects of the classical gravity model and optimizing the inaccurate distance between regions, the modified gravity model is obtained.
Scale of outward innovation:
Interprovincial innovation links:
represents the strength of interprovincial innovation links, represents the gravitational constant, usually taken as 1000, and represent the outward innovation scale of province and province , respectively, and represents the comprehensive distance from province and province , where represent the weight of time distance and geographical distance , both of which are 0.5 [37].
Total external innovation links:
is the total external innovation connection of province .
The maximum gravity line of a province represents the strength of its innovation influence within the region; that is, the importance of the province as an innovation node province (municipality, autonomous region). Existing research often uses maximum gravity lines to reflect the central position of the province in the region.
Maximum gravitational line:
is the maximum gravity of province in the region, and is the gravitational force between 1st to nth province, respectively.
4. Analysis of the Pattern and Evolution of Interprovincial Innovation Connection in China
4.1. Construction of China’s Interprovincial Innovation Connection Index System
To quantitatively measure the scale of innovation and innovation connection between provinces, this study follows the principles of scientificity, systematicity, and operability. Referring to the research results of Lachang Lyu et al. [31], Tianying Jiang et al. [38], and Weidong Zhu et al. [28], an evaluation index system was constructed including the target layer, criterion layer, and indicator layer (Table 1). Among them, the innovation environment mainly reflects the economic foundation of the province (municipality directly under the central government, autonomous region) and the innovative manpower and scale of innovation connections between provinces; innovation investment mainly reflects the level of innovation investment in the province (municipality, autonomous region); and innovation output mainly reflects the level of innovation output in the province (municipality, autonomous region).
In the indicator table, the higher the weight ratio, the greater the contribution of the indicator to interprovincial innovation connection. An analysis was conducted on the weights of China’s interprovincial innovation network indicators in 2009, 2014, and 2019 (Table 2, Table 3 and Table 4), and the results showed that:
- From 2009 to 2019, in the criteria layer, the weight of innovation output was the highest, while the weight of innovation environment was the lowest. Additionally, the weight of the innovation environment continued to rise, while the weight of innovation output continued to decline.
- From 2009 to 2019, in the index layer, the weight of per capita GDP (CNY) was the lowest, and the weight of output value of new products of high-tech industry (CNY 10,000) was the highest. Among them, in terms of innovation environment, the total postal business (CNY 10,000) and the weight of the number of students in adult higher education (people) increased, while the total telecommunications services (CNY 10,000), the number of Internet users (10,000 households), and the weight of per capita GDP (CNY) decreased. In terms of innovation investment, the weight of research and experimental development (R&D) personnel (person/year), financial education expenditure (CNY 10,000), research and experimental development (R&D) expenditure (CNY 10,000), and new product development expenditure of industrial enterprises above designated size (CNY 10,000) increased year by year. In terms of innovation output, the weight of the number of patent applications (pieces), the number of patents granted (pieces), and the number of scientific and technological works published (article) decreased year by year.
4.2. Analysis of China’s Interprovincial Innovation Connection
4.2.1. Characteristics of China’s Interprovincial Innovation Connection Pattern
The revised gravity model was used to calculate the innovation connection intensity of each province (municipality directly under the Central Government, autonomous region), and ArcGIS10.6 was used to conduct a visual analysis of China’s interprovincial innovation connection (Figure 1). According to the gravity intensity, it was divided into five intensity levels by using the natural breakpoint grading method: extremely weak gravity, weak gravity, general gravity, strong gravity, the gravitational force is extremely strong (the extremely weak gravitational force grade was not represented in the figure). The results show that:
- The overall spatial structure of China’s interprovincial innovation network shows a “core periphery” feature, radiating from coastal provinces such as Jiangsu, Beijing, and Zhejiang to inland provinces, and exhibiting an overall pattern of “strong in the east and weak in the west” (Figure 2).
- From a regional perspective, the economically developed coastal areas of China, such as the Bohai Rim region and the Yangtze River Delta region, have extremely strong or strong innovation connections in local areas, but their innovation connections with other provinces outside the region are average, indicating that the innovation impact of regions with strong innovation is insufficient. In addition, the innovation connections between Guangdong Province and other provinces are mostly average, with only strong innovation connections existing with Hunan Province (Figure 2).
- The innovation connections between western provinces such as Xinjiang, Tibet, Qinghai, Gansu, and other provinces are generally extremely weak, belonging to the “depression” of innovation connections.
4.2.2. Evolution Characteristics of China’s Interprovincial Innovation Connection
- (1)
- The Evolution of the Center of China’s Interprovincial Innovation Connection
ArcGIS 10.6 was used to visually analyze China’s interprovincial innovation network in 2009, 2014, and 2019 (Figure 3). The results showed that:
- From 2009 to 2019, the center of gravity of China’s interprovincial innovation network did not change significantly, and the center of gravity was still distributed in the eastern coastal areas of China, mainly concentrated in the Bohai Rim region and the Yangtze River Delta region.
- From 2009 to 2014, the changes in interprovincial innovation connections in China were mainly reflected in the strengthening of existing interprovincial innovation connections, with most innovation connections in coastal provinces changing from weak to average (Table 5, Figure 3). From 2014 to 2019, the changes in interprovincial innovation connections in China were reflected in the further strengthening of innovation connections between provinces, and the diffusion of innovation connection networks from the eastern coastal areas to inland areas mainly manifested in the strengthening of innovation connections between Guangdong Province and surrounding provinces.
- (2)
- The Evolution of China’s Interprovincial Outward Innovation Scale and Total Innovation Connection
The revised gravity model was used to calculate the outward innovation scale and total innovation connections of provinces (municipalities and autonomous regions) in 2009, 2014, and 2019 (Table 6 and Table 7). The results showed that:
- In terms of outward innovation scale, from 2009 to 2019 there was little change in the top five provinces (municipalities directly under the central government, autonomous regions) with outward innovation scale, including Guangdong Province, Jiangsu Province, Zhejiang Province, and Beijing. Guangdong Province and Jiangsu Province both ranked in the top two, indicating that Guangdong Province and Jiangsu Province have strong innovation capabilities. In terms of scale, from 2009 to 2019 the scale of outward innovation in Guangdong Province continued to rise, while the scale of outward innovation in other provinces (municipalities directly under the central government, autonomous regions) decreased over the decade. This indicates that the innovation capacity of other provinces continued to improve, and the gap in innovation capacity between provinces was constantly shrinking.
- In terms of total innovation connection, in 2009 the top five provinces (municipalities directly under the central government and autonomous regions) in terms of total innovation connection were Jiangsu Province, Zhejiang Province, Shanghai City, Beijing City, and Tianjin City, respectively, accounting for 18.30%, 16.27%, 15.09%, 11.99%, and 9.14% of the country’s total innovation connections. The combined total innovation connections reached 70.79% in 2014 and 2019, respectively. The top five provinces (municipalities directly under the central government, autonomous regions) in terms of total innovation connection added up to 64.29% and 64.24%, respectively. This indicates that the number of innovation connection in the top innovation strong provinces (municipalities directly under the central government, autonomous regions) decreased, and the phenomenon of uneven innovation connection still existed, but had slowed down to some extent. From 2009 to 2019, there was little change in the top five provinces (municipalities directly under the central government, autonomous regions) in terms of total innovation connection, including Jiangsu Province, Zhejiang Province, Beijing, and Shanghai. This also reflects, to some extent, that the Bohai Rim region and the Yangtze River Delta region are the focus of China’s interprovincial innovation network. Jiangsu Province and Zhejiang Province were both ranked in the top two, and since 2014, among the top five provinces (municipalities directly under the central government, autonomous regions) in terms of total innovation connection, there have been four provinces in the Yangtze River Delta region (Jiangsu Province, Zhejiang Province, Anhui Province, and Shanghai City), indicating that the Yangtze River Delta region not only has close connections within the region, but also has close innovation connection with other provinces outside the region.
4.3. Node Province Analysis of China’s Interprovincial Innovation Connection
This article introduces the “maximum gravity line” and combines it with the total number of innovation connection to determine the national interprovincial innovation output connection node provinces. Generally speaking, the more times a province (municipality, autonomous region) is connected in the maximum gravity line graph, the greater the gravity and the higher the central position.
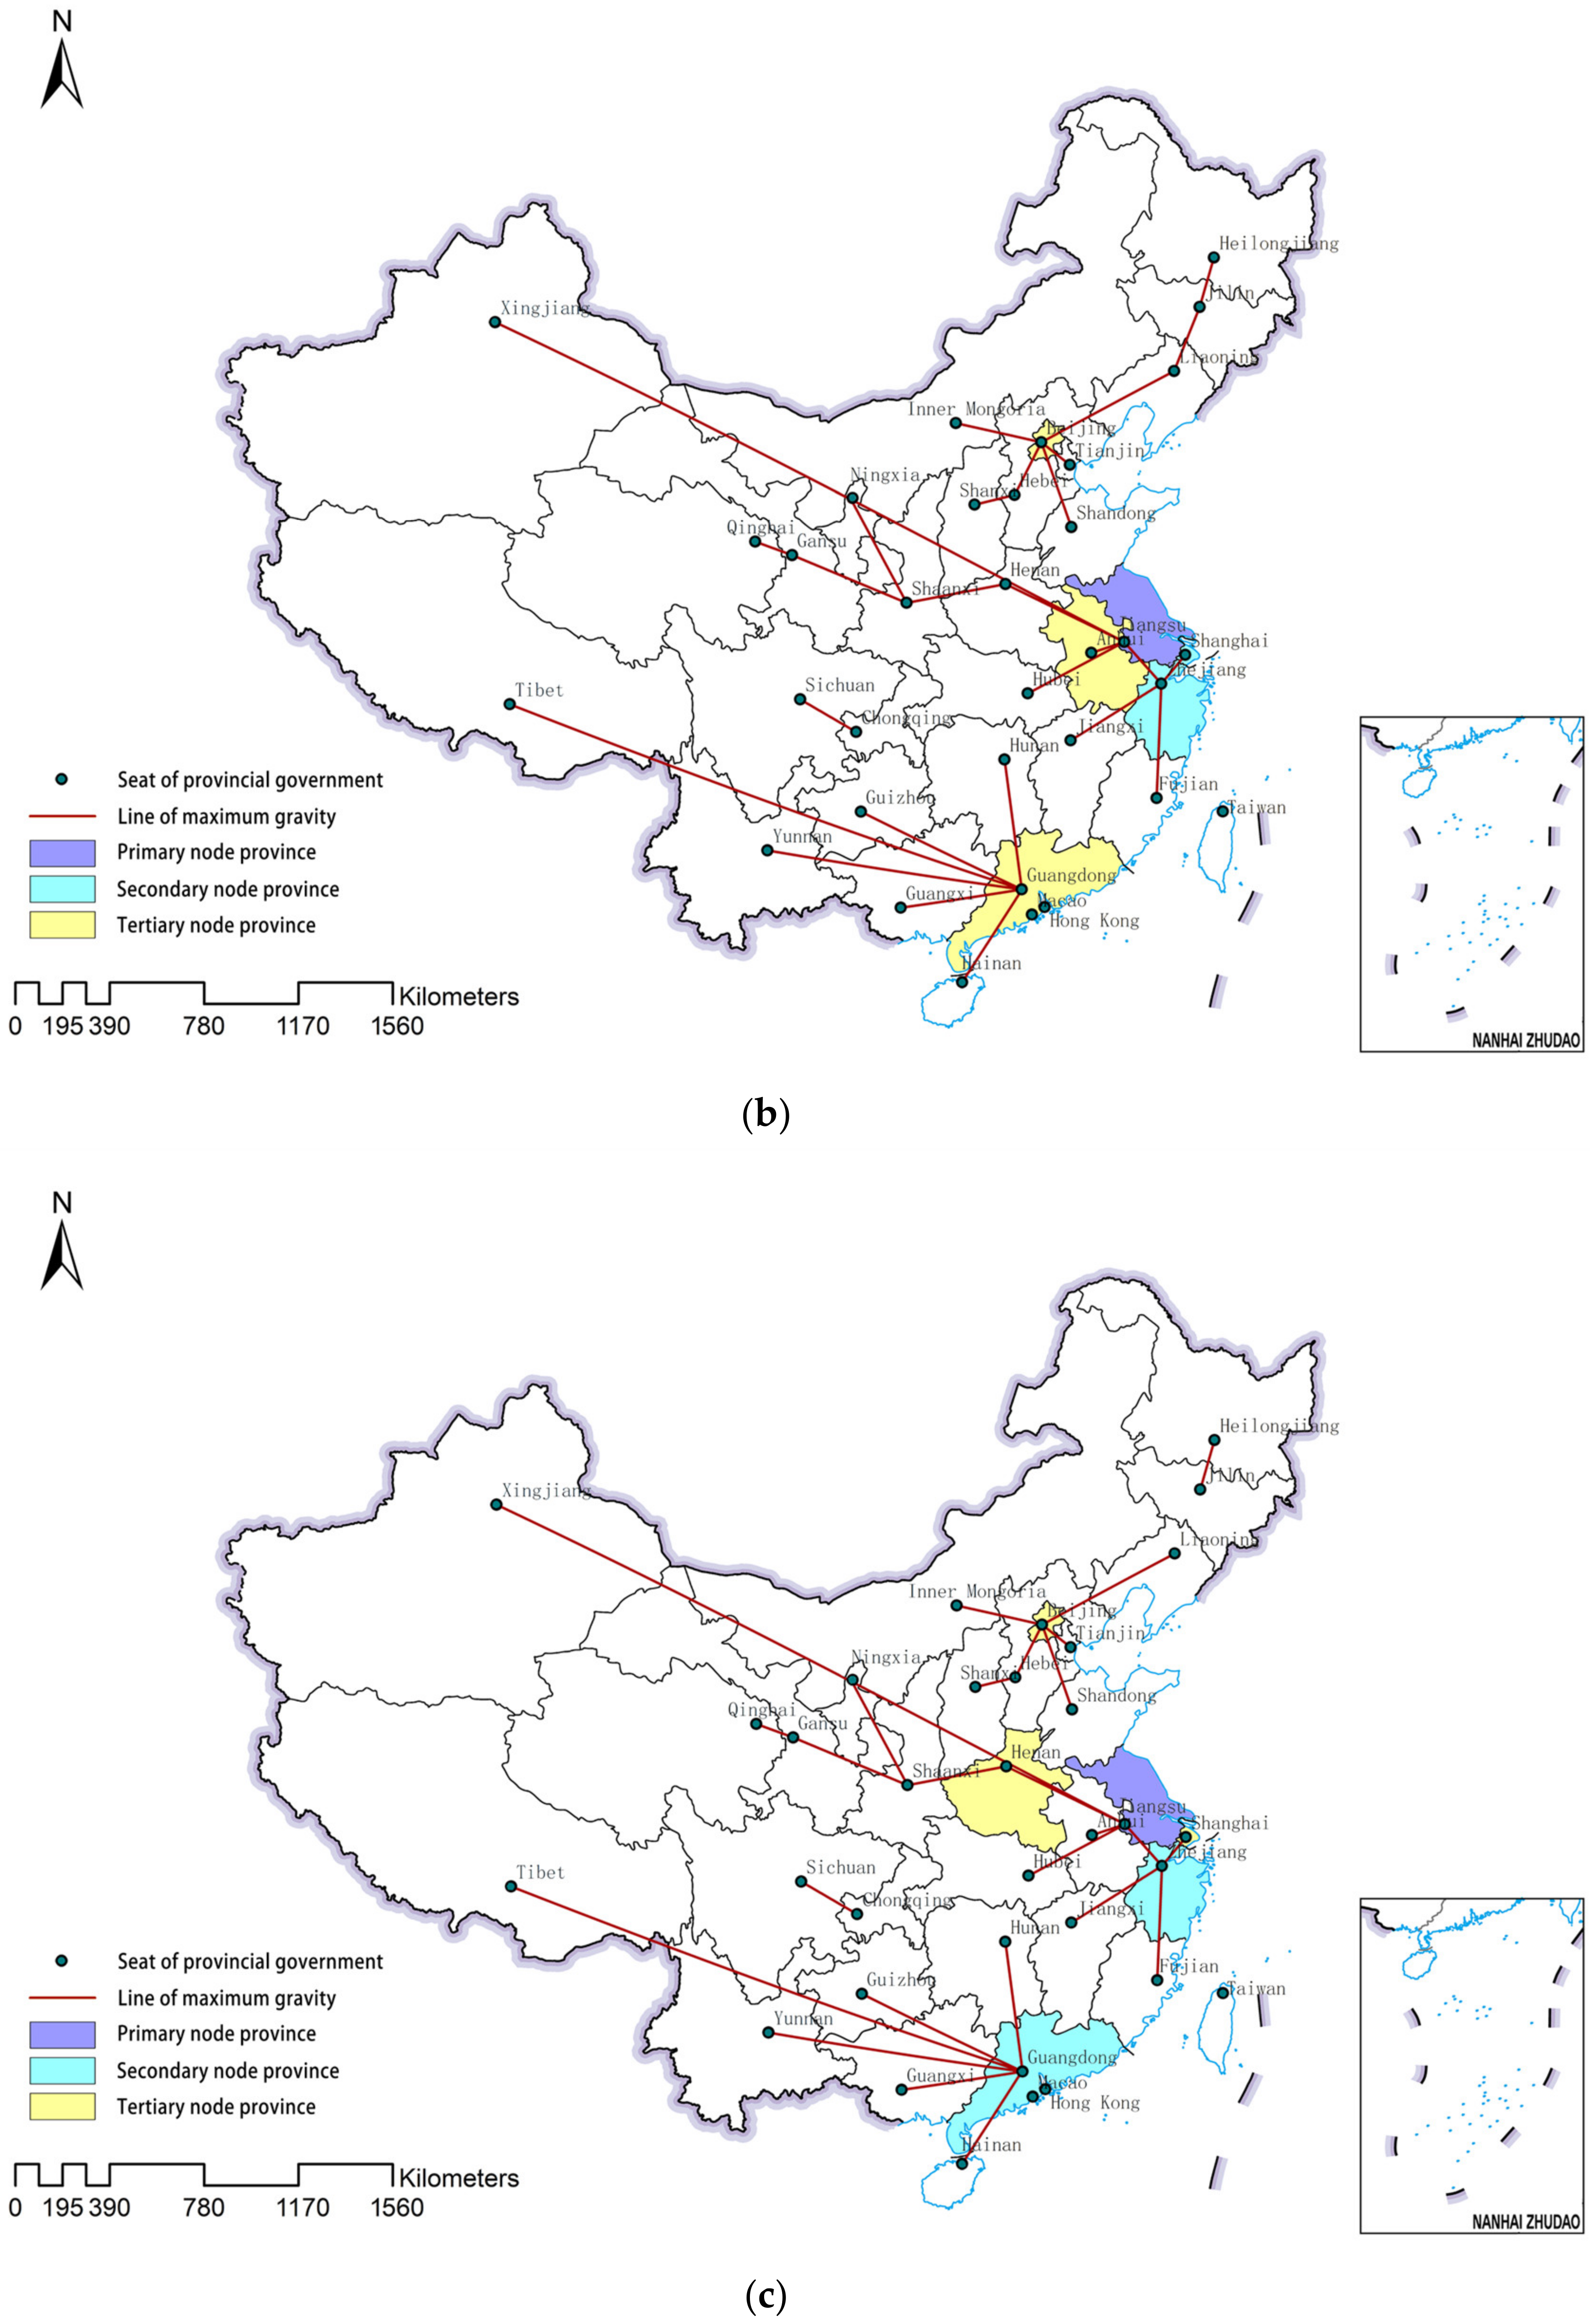
In this study, the maximum number of gravity lines () and the total number of innovation links () were combined to judge the level of node provinces. In combination with the actual situation of China’s interprovincial innovation, this study classified the node provinces as follows: ≥ 5 and > M + 2S or > M + 3S are the primary node province, where M and S are, respectively, the mean and standard deviation of ; ≥ 5 and > M or ≥ 3 and > M + S or > M + 2S are the secondary node province; and ≥ 5 or ≥ 2 and > M or > M + S are the third level node province. According to the above classification method, this study obtained the classification of China’s interprovincial innovation connection in 2009, 2014, and 2019 (Figure 4). The results showed that:
- In terms of the maximum gravity line, there was no change from 2009 to 2014. From 2014 to 2019, the maximum gravity line between Jilin Province and other provinces changed from “Jilin-Liaoning” to “Jilin-Heilongjiang”, indicating that China’s interprovincial innovation connections were centered around the Bohai Rim region, the Yangtze River Delta region, and Guangdong Province. The provinces with the highest number of gravitational lines in 2009, 2014, and 2019 were all Guangdong Province, with a total number of six. However, due to their small total number of innovative connections, they have not become a primary node province.
- In terms of innovation connection node provinces, Jiangsu Province was a primary node province from 2009 to 2019, indicating that since 2009, Jiangsu Province has had the highest spatial dominance and the strongest regional centrality in China’s interprovincial innovation connection. Therefore, it can be inferred that Jiangsu Province was the central province of China’s interprovincial innovation connection in 2009, 2014, and 2019. From 2009 to 2014, Beijing changed from a secondary node to a third level system node, Tianjin from a third level node to a non node, and Anhui Province became a third level node province, indicating an increase in innovation influence in the Yangtze River Delta region and a decrease in innovation influence in the Bohai Rim region. From 2014 to 2019, Shanghai changed from a secondary node to a tertiary node, Anhui Province was replaced by Henan Province as a tertiary node province, and Guangdong Province changed from a tertiary node province to a secondary node province, indicating that the innovation influence of the Yangtze River Delta region was weakening. Some inland provinces improved, and Guangdong’s innovation influence was no longer limited to the Pearl River Delta region. Its external innovation influence has continued to increase.
5. Conclusions and Discussion
This paper used the entropy weight method and modified gravity model to study China’s interprovincial innovation network from 2009 to 2019. The main conclusions are as follows:
- The study measured the scale of innovation using innovation output, innovation investment, and innovation environment, and constructed a multi-level indicator system. From 2009 to 2019 the weight of innovation output was the highest, but the weight decreased year by year. The weight of innovation environment was the lowest, but the weight increased year by year. In the indicator layer, the weight of per capita GDP (CNY) was the lowest, while the weight of high-tech industry new product output value (CNY 10,000) was the highest. At present, China’s interprovincial innovation connections are most affected by innovation output, which can intuitively reflect the interprovincial innovation connections. Over time, the impact of the innovation environment on China’s interprovincial innovation connections will become increasingly significant. However, there is still a big gap between the level of innovation environment in freight, education, information circulation, and economy in the central and western inland provinces and the coastal areas. China has also proposed implementing an innovation driven development strategy, stimulating and mobilizing the innovation passion of the whole society, and creating a good innovation environment. Meanwhile, due to the importance of enterprises and high-tech industries in China’s interprovincial innovation connections, provinces need to further support high-tech industries and encourage independent innovation through enterprise.
- In terms of the characteristics of the interprovincial innovation connection pattern, due to geographical and technological proximity, China’s interprovincial innovation network radiates from coastal provinces such as Jiangsu, Beijing, and Zhejiang to inland provinces, exhibiting an overall pattern of “strong in the east and weak in the west” and presenting a spatial structure characteristic of “core periphery”, forming some regional spatial characteristics of “strong–strong” cooperation and “weak–weak” cooperation. Among them, regarding China’s economically developed coastal areas, the innovation connections between the Bohai Rim region and the Yangtze River Delta region are extremely strong or strong locally, but they are generally weak with other provinces outside the region. However, the innovation connection level of provinces in western China, such as Tibet and Xinjiang, is generally weak, indicating that there is a certain correlation between the interprovincial innovation connection pattern and the development level of provinces (municipalities directly under the central government, autonomous regions) in China. At present, China has regions with strong innovation links, such as the Yangtze River Delta region and the Bohai Bay Rim region. In addition, the innovation links between Guangdong Province and other provinces are mostly of moderate intensity. It can be inferred that the regional innovation links of Guangdong Province are mainly concentrated in the Pearl River Delta.
- In terms of the evolution characteristics of interprovincial innovation connections, the top five provinces (municipalities directly under the central government, autonomous regions) with outward innovation scale did not change much, including Guangdong Province, Jiangsu Province, Zhejiang Province, Beijing, with both Guangdong Province and Jiangsu Province in the top two. From 2009 to 2019, the scale of outward innovation in Guangdong Province continued to rise, while the scale of outward innovation in other provinces (municipalities, autonomous regions) decreased over the past decade. In terms of total innovation connections, the top five provinces (municipalities directly under the central government, autonomous regions) always included Jiangsu Province, Zhejiang Province, Beijing City, and Shanghai City. In 2009, 2014, and 2019, the combined total innovation connections of the top five provinces accounted for 70.79%, 64.29%, and 64.24%, respectively. Overall, from 2009 to 2019, China’s interprovincial innovation network was gradually enriched, and interprovincial innovation connections continued to strengthen. Specifically, from 2009 to 2014, innovation connections in coastal areas were strengthened. From 2014 to 2019, the innovation connections in coastal areas continued to strengthen, and the innovation connection network expanded from coastal areas to inland provinces, with Guangdong Province particularly significantly strengthening its innovation connections with other provinces. Technological proximity makes it easier for provinces with higher innovation levels to choose provinces that are closer to their level when making innovation connections. Institutional proximity makes regional innovation connections develop better within the region, without too many connections to provinces outside the region. As a result, the center of gravity of China’s interprovincial innovation network has not changed significantly, and the center of gravity is still distributed in the eastern coastal areas of China, mainly concentrated in the Bohai Rim region and the Yangtze River Delta region.
- In terms of maximum gravitational lines, Guangdong Province had the highest number of maximum gravitational lines in 2009, 2014, and 2019, with a total of six. The maximum gravity line change from 2009 to 2019 was only between Jilin Province and other provinces. From 2014 to 2019, the maximum gravity line changed from “Jilin-Liaoning” to “Jilin-Heilongjiang”. In terms of innovation connection node provinces, due to the high innovation level of each province in the Yangtze River Delta region and the certain technological proximity of each province in the region, Jiangsu Province had a relatively close innovation connection with other provinces. From 2009 to 2019, Jiangsu Province was a node province of interprovincial innovation contact centers. Although Guangdong had the largest number of gravity lines between 2009 and 2019, due to its small total number of innovative links, it did not become a primary node province. In the past ten years, it has only changed from a tertiary node province to a secondary node province, indicating that although Guangdong’s innovation links with other provinces have increased year by year, their innovation links are mainly concentrated in the Pearl River Delta region, and there is no outstanding advantage in interprovincial innovation links. We can also reflect that the inland provinces and coastal areas in central and southern China, especially the Yangtze River Delta region, have not formed relatively close innovative connections. In addition, from 2009 to 2019, the innovation connection nodes of the three municipalities (Beijing, Shanghai, and Tianjin) were downgraded, which was related to the size of the provinces and municipalities. Over time, the development of the economy, education, transportation, technology, and other aspects in each province has widened the gap in development volume between the municipalities and the provinces, while narrowing the gap in innovation connection levels between the provinces and municipalities. This eliminates the advantages of municipalities in interprovincial innovation connections, reflecting the increasingly important role that the innovation environment will play in China’s interprovincial innovation network.
The innovation connections between provinces are influenced by various factors such as local policies and systems. Therefore, the content of this study can only reflect the basic pattern of China’s interprovincial innovation connection network. Overall, the enhancement of the strength of interprovincial innovation connections mainly lies in increasing the scale of outward innovation and shortening the comprehensive distance between provinces. In combination with the above conclusions, in terms of innovation and development, China needs to further improve the scale of outward innovation in each province, put forward innovative development policies, and define the overall goals of development at the overall level, and form an innovation network radiating outward, with the Yangtze River Delta, Bohai Bay Rim, and the Pearl River Delta as the innovation core at the regional level. To further strengthen and gradually radiate the innovation and development of the central and western regions of China, it is necessary to form relevant policy guidance at the provincial level based on the overall development goals, improve the level of scientific and technological innovation in each province, and strengthen regional innovation exchanges to create a good innovation environment. In addition, shortening the comprehensive distance between provinces is also quite important. Affected by the comprehensive distance, provinces in the central and western regions have been improving their innovation connections year by year, but the improvement is relatively slow compared to the eastern region. The comprehensive distance between provinces includes the influence of geographical distance, cultural distance, social distance, etc. It is necessary to improve the construction of highways and railways between cities, counties, and cities, vigorously promote the development of internet and communication technology, enhance cultural and social exchanges between provinces, and shorten the comprehensive distance between provinces. Through this, we can develop the innovation core of the central and western regions and gradually build a nationwide innovation network.
Author Contributions
Conceptualization, K.Z.; Methodology, K.Z., Z.G. and J.L.; Software, Z.G.; Validation, K.Z., Z.G. and J.L.; Formal Analysis, Z.G.; Resources, Z.G.; Data Curation, Z.G.; Writing—Original Draft Preparation, Z.G.; Writing—Review and Editing, K.Z. and J.L.; Visualization, Z.G.; Supervision, K.Z. and J.L. All authors have read and agreed to the published version of the manuscript.
Funding
This research received no external funding.
Institutional Review Board Statement
Not applicable.
Informed Consent Statement
Not applicable.
Data Availability Statement
The data in the paper are all from the statistical data from the China Urban Statistical Yearbook and China Science and Technology Statistical Yearbook from 2010, 2015, and 2020, as well as the websites of provincial science and technology statistics websites and science and technology departments.
Conflicts of Interest
The authors declare no conflict of interest.
References
- Qiu, Z. Research on Inter-provincial Innovation Connection Network Features and Its Impact on Economic Growth. Master’s Thesis, Jiangxi University of Finance and Economics, Nanchang, China, 2018. Available online: https://kns.cnki.net/KCMS/detail/detail.aspx?dbname=CMFD201802&filename=1018161720.nh (accessed on 11 January 2022).
- Hägerstrand, T. The propagation of innovation waves. Neuro Psychobiol. 2000, 42, 172–174. [Google Scholar]
- Hawthorn, G. Innovation Diffusion as a Spatial Process. Sociology 1969, 3, 270. [Google Scholar] [CrossRef]
- Pred, A.R. City Systems in Advanced Economies: Past Growth, Present Processes and Future Development Options; Hutchinson: London, UK, 1977. [Google Scholar]
- Benhabib, J.; Spiegel, M.M. The role of human capital in economic development evidence from aggregate cross-country data. J. Monet. Econ. 1994, 34, 143–173. [Google Scholar] [CrossRef]
- Guan, M.; Sun, S. Agglomeration Characteristics and Influencing Factors of Urban Innovation Space: A Case Study of Nanjing Main City. In City Planning Review; Urban Planning Society of China: Beijing, China, 2023; pp. 1–11. Available online: https://kns.cnki.net/kcms/detail//11.2378.TU.20230224.1601.006.html (accessed on 4 May 2023).
- Li, Y.; Rigby, D. Relatedness, Complexity, and Economic Growth in Chinese Cities. Int. Reg. Sci. Rev. 2023, 46, 3–37. [Google Scholar] [CrossRef]
- Li, Y.; Du, R. Polycentric Urban Structure and Innovation: Evidence from a Panel of Chinese Cities. Reg. Stud. 2022, 56, 113–127. [Google Scholar] [CrossRef]
- Fischer, M.M.; Griffith, D.D. Modeling Spatial Autocorrelation in Spatial Interaction Data: An Application to Patent Citation Data in the European Union. J. Reg. Sci. 2008, 48, 969–989. [Google Scholar] [CrossRef]
- Lyu, L.; Li, Y. A Research on Chinese Renovation Urban System Based on Urban Renovation Function. Acta Geogr. Sin. 2010, 65, 177–190. [Google Scholar] [CrossRef]
- Wang, X.; Xie, S. R&D Input, Industry University Research Cooperation and Enterprise Technological Innovation Output: A Study Based on China’s Provincial Panel Data. Mod. Manag. Sci. 2015, 4, 30–32. [Google Scholar] [CrossRef]
- Zeng, G.; Ingo, L.; Fan, J. Comparison of Regional Innovation System of High-tech Enterprises Cluster in Beijing and Shanghai. City Plan. Rev. 2006, 30, 32–38. [Google Scholar] [CrossRef]
- Freeman, C. Networks of Innovators: A Synthesis of Research Issues. Res. Policy 1991, 20, 499–514. [Google Scholar] [CrossRef]
- Tong, X.; Wang, J. An Analysis of Global—Local Innovation Networks. China Soft Sci. 2000, 9, 80–83. [Google Scholar] [CrossRef]
- Li, Y.; Xiong, W.; Hu, X. The Geography of Intercity Technological Proximity: Evidence from China. Int. J. Urban Sci. 2021, 1–16. [Google Scholar] [CrossRef]
- Balland, P.A. Proximity and the Evolution of Collaboration Networks: Evidence from Research and Development Projects within the Global Navigation Satellite System Industry. Reg. Stud. 2011, 46, 741–756. [Google Scholar] [CrossRef]
- Glückler, J. Economic Geography and the Evolution of Networks. J. Econ. Geogr. 2007, 7, 619–634. [Google Scholar] [CrossRef]
- Sun, C.; Pei, X.; Liu, C.; Bu, Q. The Spatial Network Characteristics and Driving Mechanism of Logistics Innovation in Chinese Cities. Geogr. Res. 2021, 5, 1354–1371. [Google Scholar]
- Shao, X.; Zhu, J.; Liu, Y. Spatial-temporal Evolution and Influencing Factors of Industrial Technological Innovation Spatial Correlation: Based on Data of Industrial Enterprises above Scale. Areal Res. Dev. 2021, 2, 7–12+19. [Google Scholar]
- Katz, B.; Wagner, J. The Rise of Innovation Districts: A New Geography of Innovation in America.; Brookings Institution: Washington, DC, USA, 2014. [Google Scholar]
- Li, Y.; Zhang, X.; Phelps, N.; Tu, M. Closed or Connected? The Economic Geography of Technological Collaboration between Special Economic Zones in China’s Suzhou-Wuxi-Changzhou Metropolitan Area. Urban Geogr. 2022, 1–21. [Google Scholar] [CrossRef]
- Lyu, G.; Zeng, G.; Gu, N. Literature Review of Regional Innovation Network: An Economic Geographical Perspective. Econ. Geogr. 2014, 34, 1–8. [Google Scholar] [CrossRef]
- Chen, Q.; Qian, Q.; Yao, Z. Spatial Patterns and Regionl Organizational Modes of Urban Innovation: Case Studies of Beijing, Shenzhen, and Shanghai. City Plan. Rev. 2022, 46, 25–38. [Google Scholar]
- Lu, J.; Luo, X.; Wang, Y. Evolution Mechanism of Innovation Space in Metropolitan Areas from the Perspective of Institutional Change: An Example of Hangzhou. Econ. Geogr. 2022, 42, 50–59. [Google Scholar] [CrossRef]
- Gui, J.; Xiangzheng, D.; Xiaodong, Z.; Baishu, G.; Jun, Y. Spatiotemporal patterns in urbanization efficiency within the yangtze river economic belt between 2005 and 2014. J. Geogr. Sci. 2018, 28, 1113–1126. [Google Scholar]
- Zhou, Z.; Yang, J.; Zhang, Z. On the Spatiotemporal Evolution of the Innovation Linkage Network of the Urban Agglomeration in the Yangtze River Delt. J. Jiangsu Univ. 2022, 24, 85–96. [Google Scholar] [CrossRef]
- Cheng, G.; Zhao, C.; Li, Y. Spatial Agglomeration and Convergence Testing of Comprehensive Innovative Development in Chinese Cities. Urban Probl. 2018, 8, 14–23. [Google Scholar] [CrossRef]
- Zhu, W.; Yue, Z.; He, N.; Luan, K.; Ye, L.; Qian, C. Analysis of China’s Urban Innovation Connection Network Evolution: A Case Study of Henan Province. Sustainability 2022, 14, 1089. [Google Scholar] [CrossRef]
- Li, L.; Niu, T. The Spatial Connection Network Structure of Regional Innovation Output—Based on the Social Network Analysis. Econ. Geogr. 2017, 37, 19–25+61. [Google Scholar] [CrossRef]
- Liu, J.; Li, W. Analysis of the Innovation Spatial Connection in Central Plains Urban Agglomeration Based on Modified Gravity Model. Areal Res. Dev. 2019, 38, 63–68+90. [Google Scholar]
- Lyu, L.; Liang, Z.; Huang, R. The Innovation Connection Among Chinese Major Cities. Sci. Geogr. Sin. 2015, 35, 30–37. [Google Scholar] [CrossRef]
- Wang, Y.; Wang, C. Urban Innovation Connection Network and Radiation Ability in Yangtze River Delta. Econ. Geogr. 2018, 38, 130–137. [Google Scholar] [CrossRef]
- Brax, P.; Davis, A.C. Distinguishing modified gravity models. J. Cosmol. Astropart. Phys. 2015, 10, 42. [Google Scholar] [CrossRef]
- Chen, Y. Urban gravity model based on cross-correlation function and Fourier analyses of spatiotemporal process. Chaos Solitons Fractals 2009, 41, 603–614. [Google Scholar] [CrossRef]
- Hua, C.; Porell, F. A critical review of the development of the gravity model. Int. Reg. Sci. Rev. 1979, 4, 97–126. [Google Scholar] [CrossRef]
- Bretagnolle, A.; Daudé, E.; Pumain, D. From theory to modelling: Urban systems as complex systems. Cybergeo Eur. J. Geogr. 2006, 335, 1–17. Available online: https://halshs.archives-ouvertes.fr/halshs-00156778 (accessed on 29 March 2022). [CrossRef]
- Han, R.; Cao, H.; Liu, Z. Studying the urban hierarchical pattern and spatial structure of China using a synthesized gravity model. Sci. China Earth Sci. 2018, 61, 1818–1831. [Google Scholar] [CrossRef]
- Jiang, T.; Xie, M.; Liu, G. Spatial Connection of Regional Innovation Output Based on Gravity Model: A Case Study in Zhejiang Province. Sci. Geogr. Sin. 2014, 34, 1320–1326. [Google Scholar] [CrossRef]
Figure 1.
China’s interprovincial innovation links in 2019. Note: this figure is based on the standard map of the standard map service system of the Ministry of Natural Resources (Drawing Review No.: GS (2019) No. 1673), and the base drawing has not been modified (same as below).
Figure 1.
China’s interprovincial innovation links in 2019. Note: this figure is based on the standard map of the standard map service system of the Ministry of Natural Resources (Drawing Review No.: GS (2019) No. 1673), and the base drawing has not been modified (same as below).
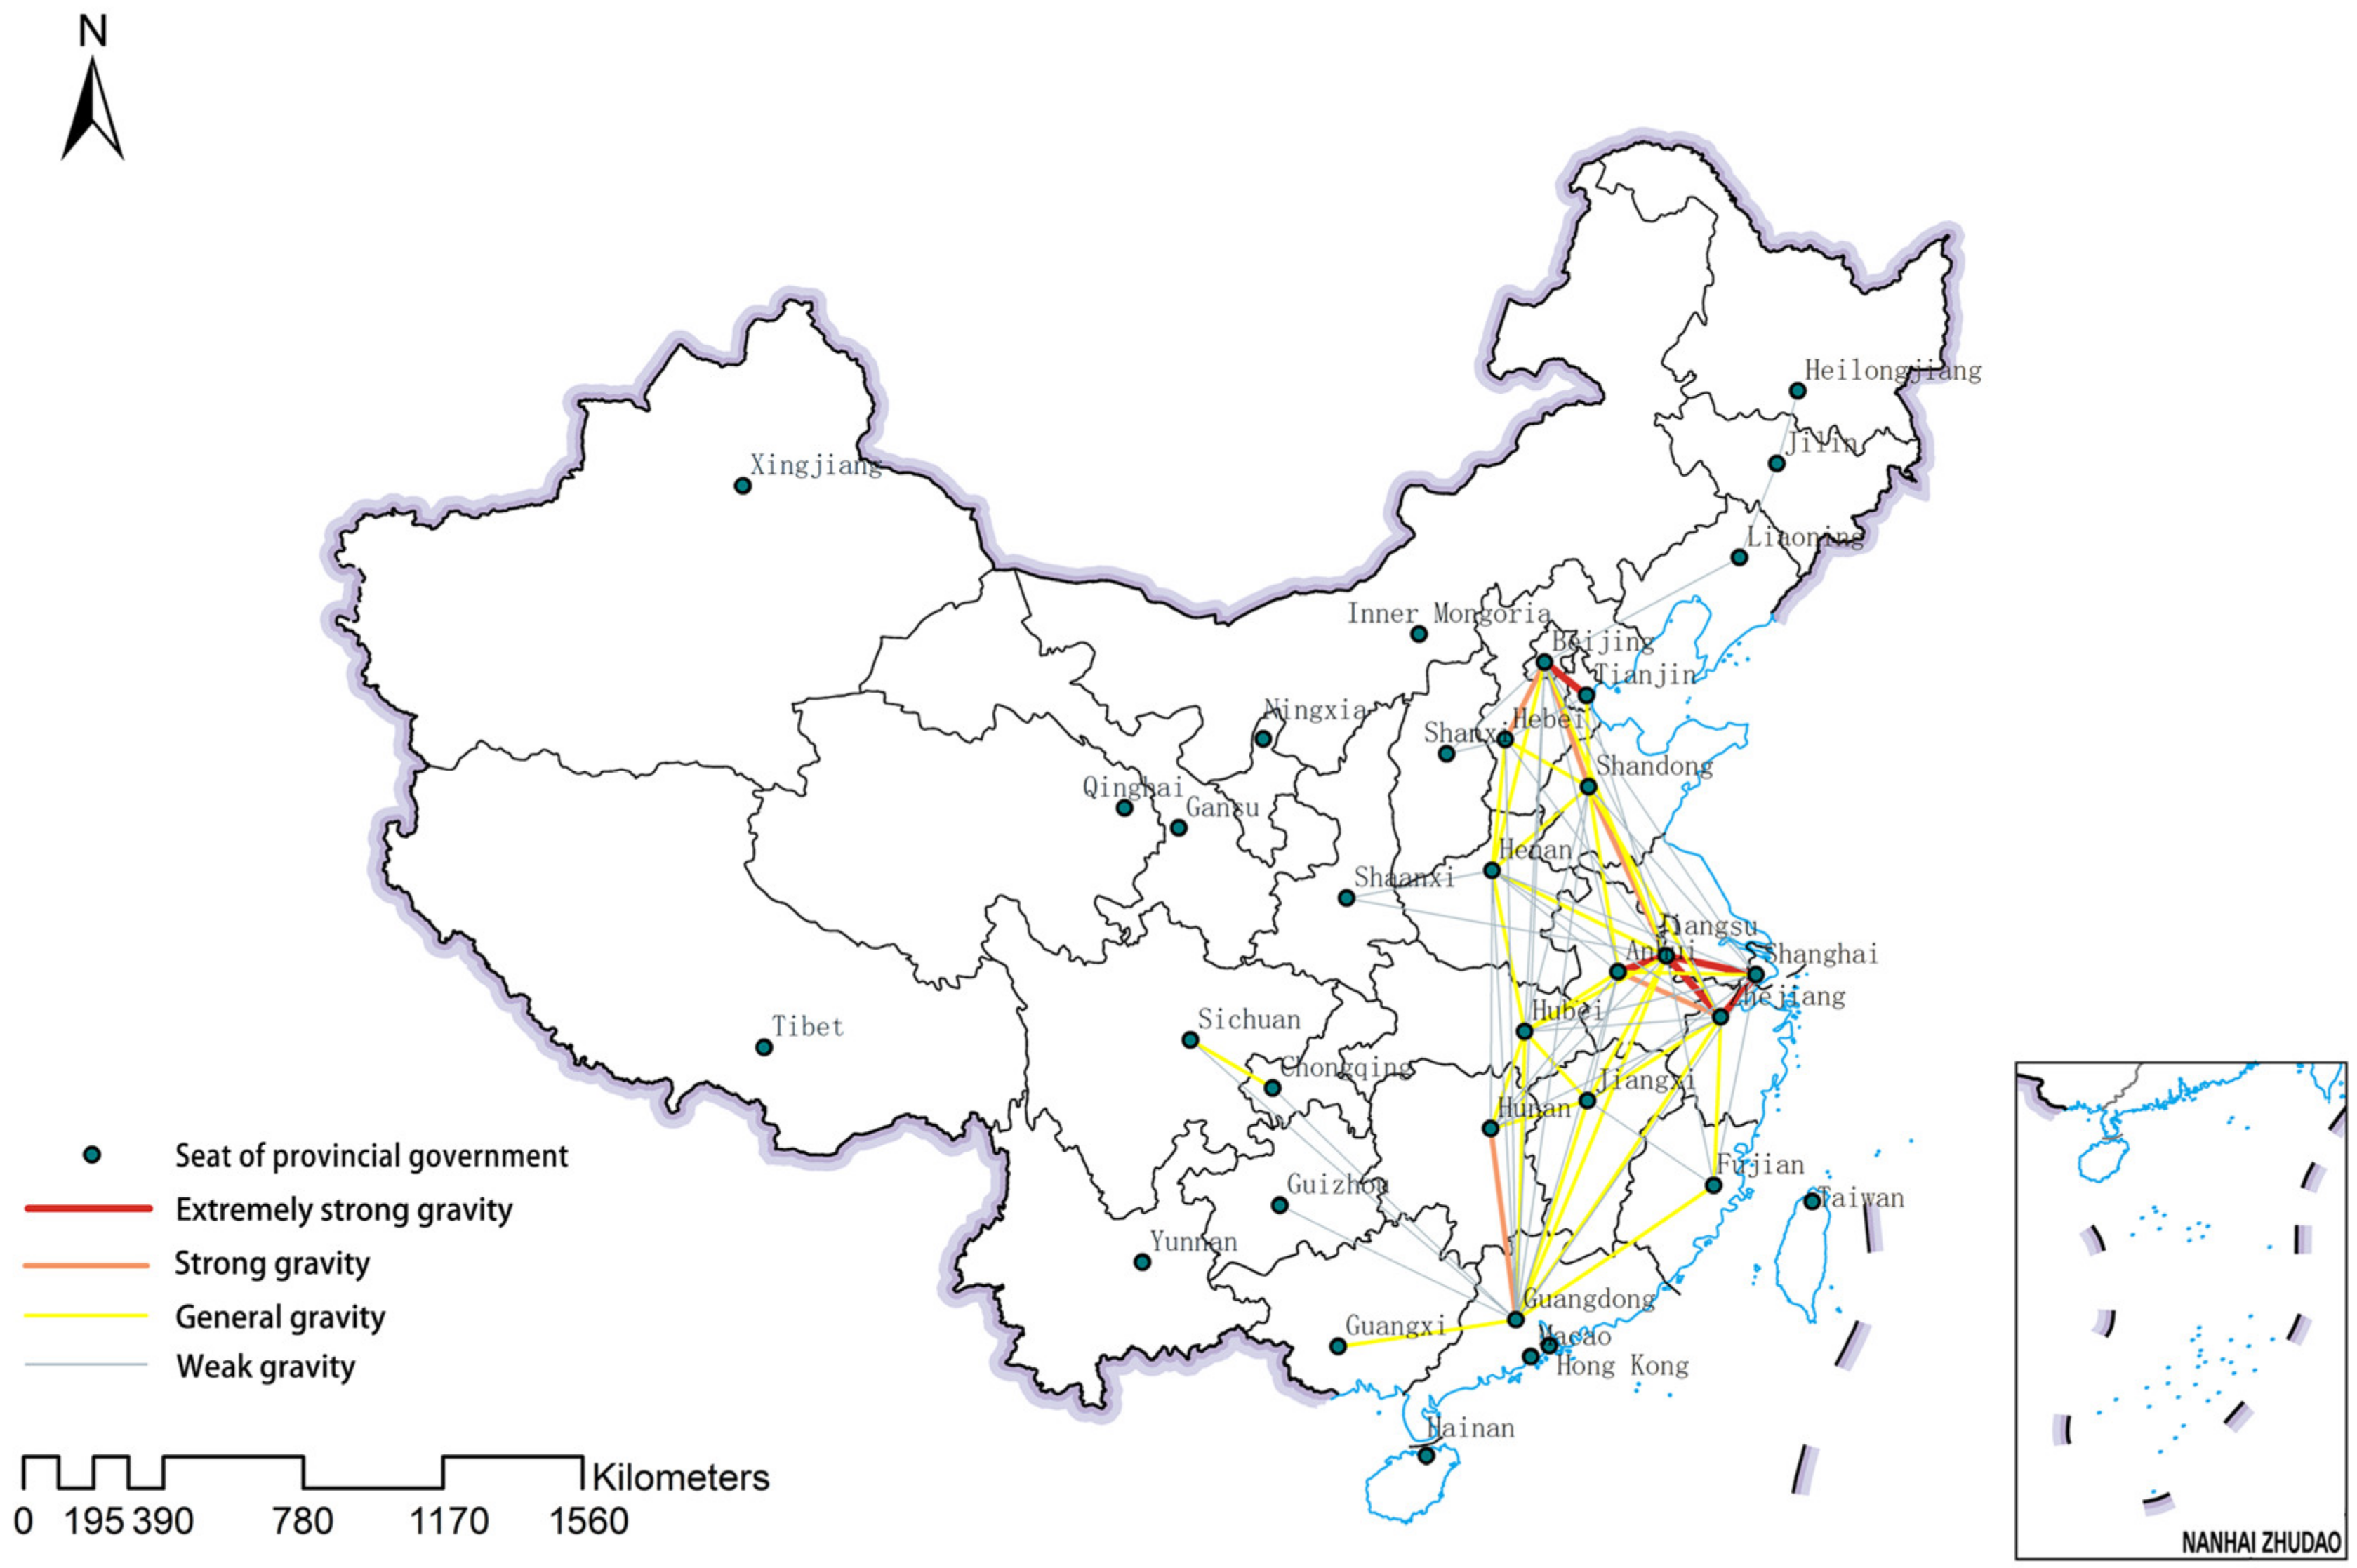
Figure 2.
China’s interprovincial innovation links in 2019. (a) Extremely strong gravity, (b) strong gravity, (c) general gravity, (d) weak gravity.
Figure 2.
China’s interprovincial innovation links in 2019. (a) Extremely strong gravity, (b) strong gravity, (c) general gravity, (d) weak gravity.
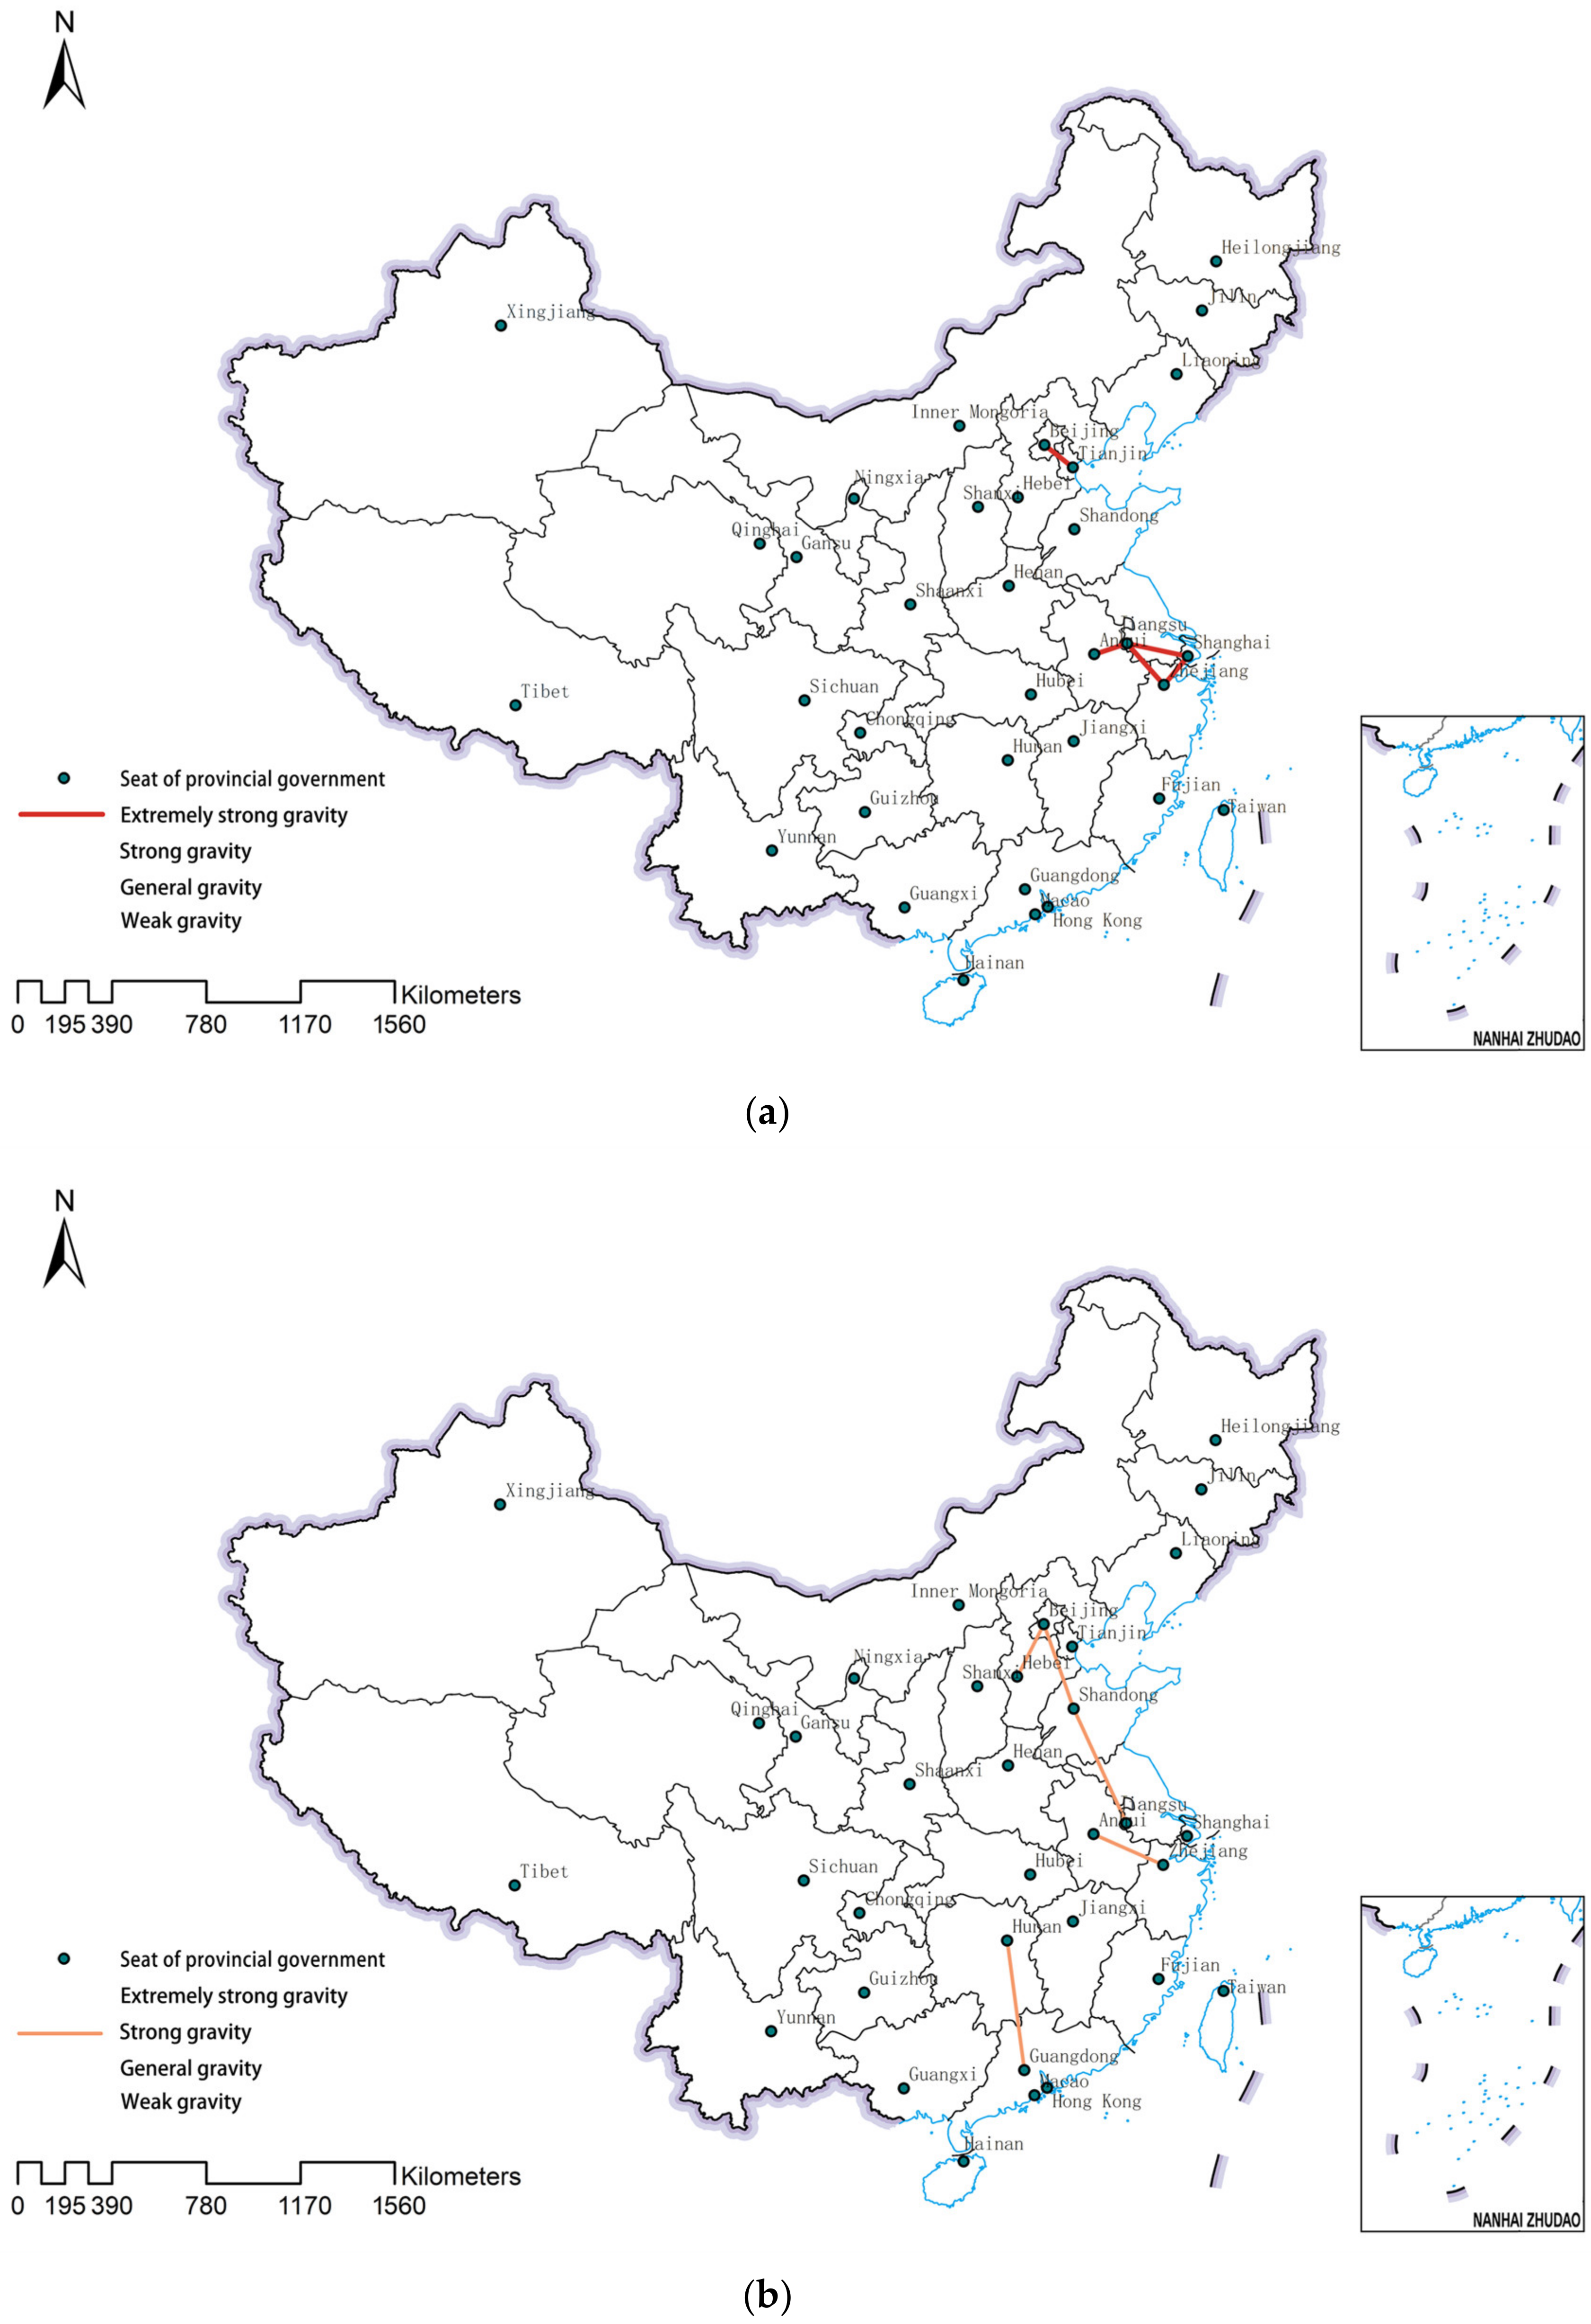
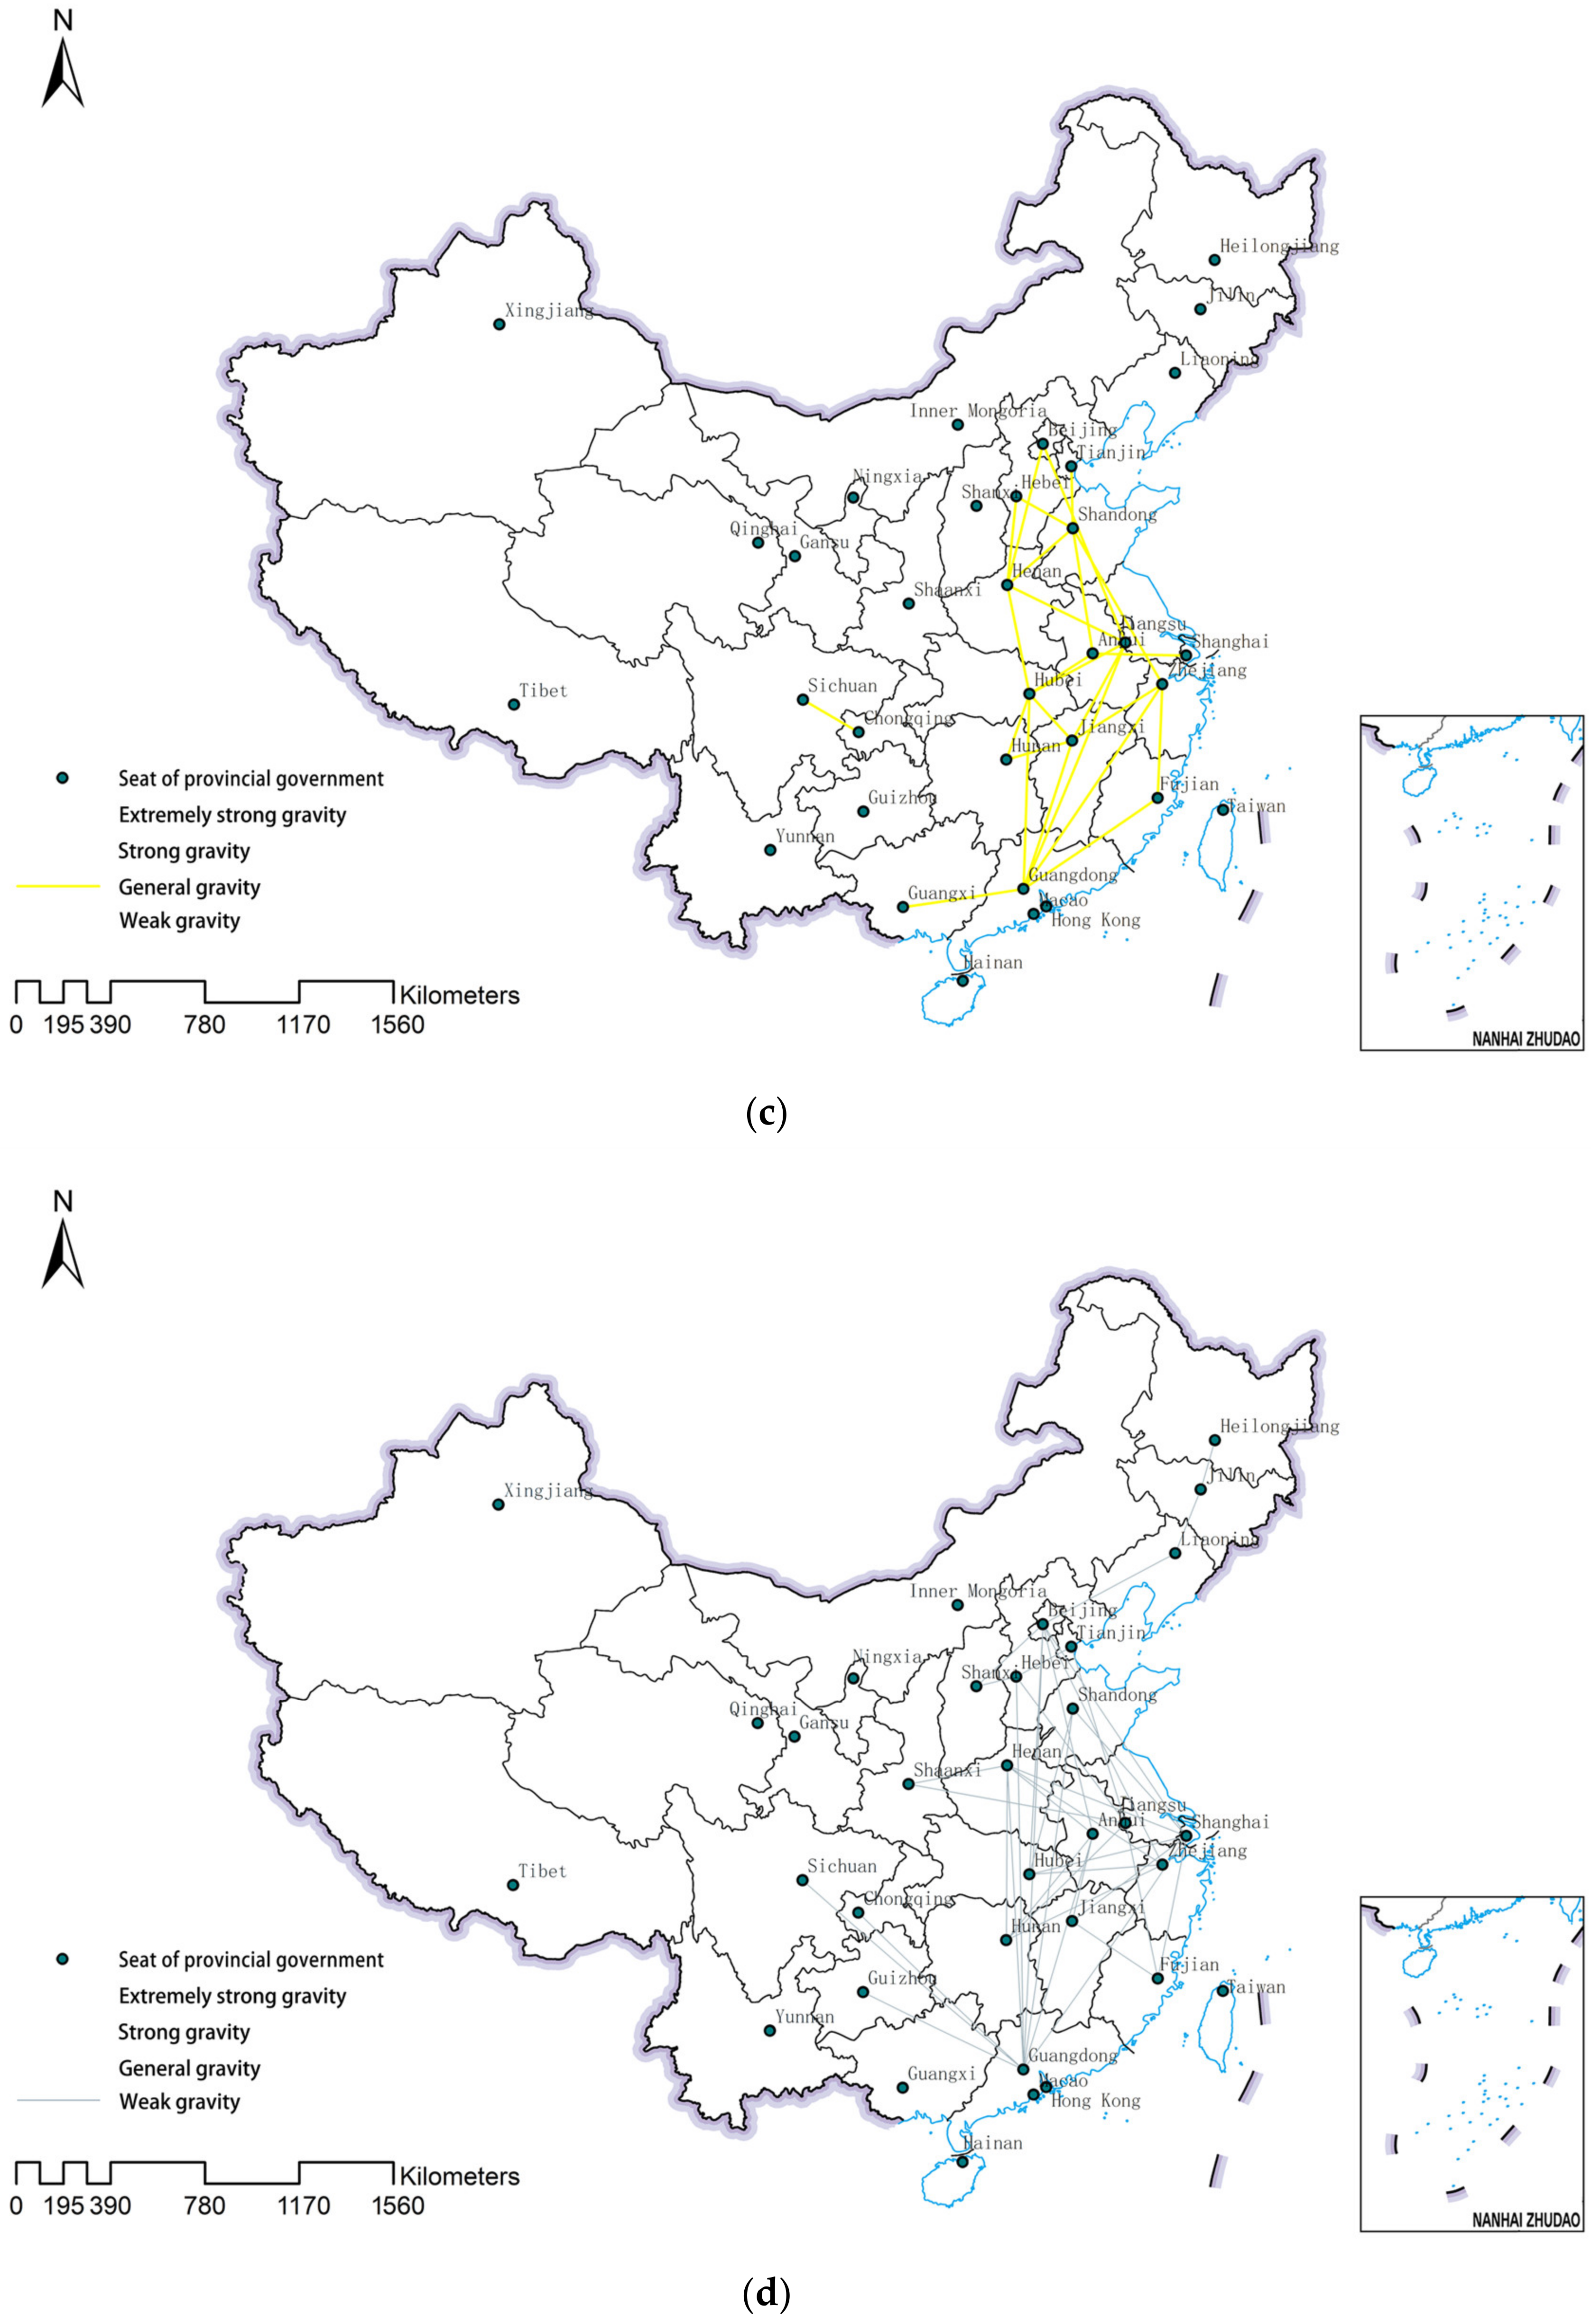
Figure 3.
China’s interprovincial innovation connections in (a) 2009, (b) 2014, and (c) 2019.

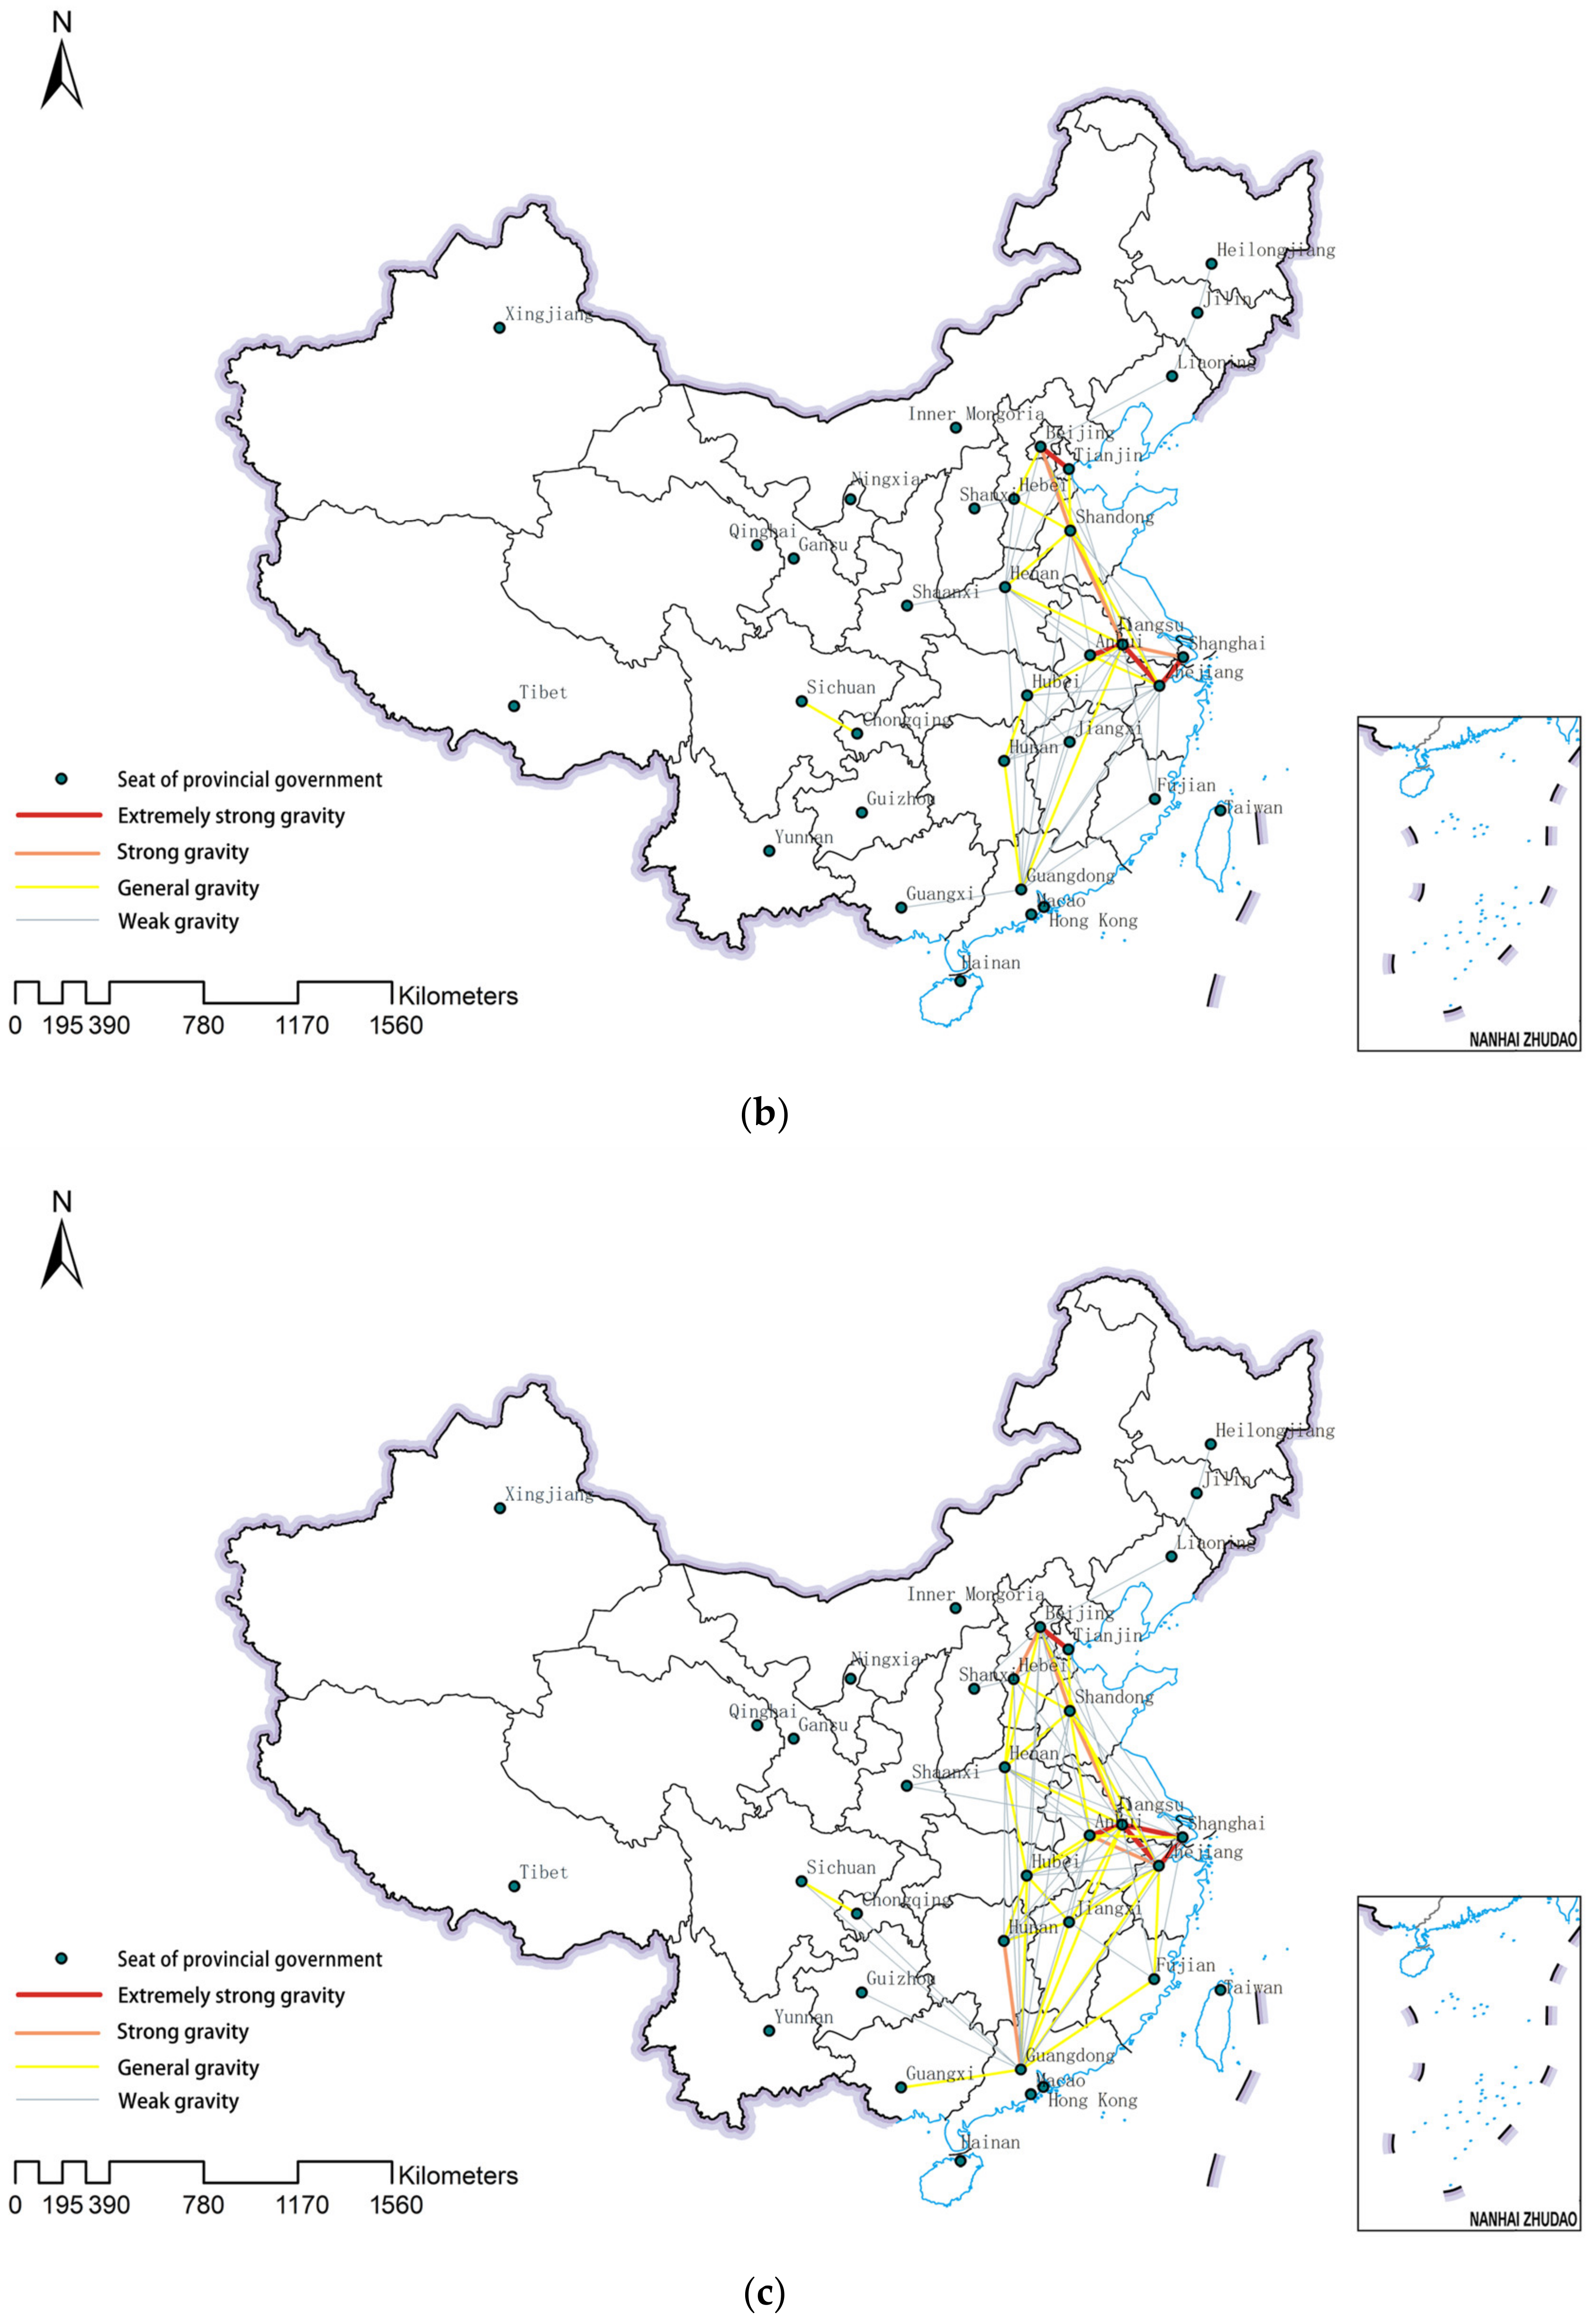
Figure 4.
China’s interprovincial innovation connection node province in (a) 2009, (b) 2014, and (c) 2019.
Figure 4.
China’s interprovincial innovation connection node province in (a) 2009, (b) 2014, and (c) 2019.


Table 1.
China’s interprovincial innovation connection indicators.
| Target Layer | Criterion Layer | Index Layer | |
|---|---|---|---|
| Scale of Outward Innovation | Innovation Environment | Public revenue Per capita GDP | CNY 10,000 CNY |
| Total postal business | CNY 10,000 | ||
| Total telecommunication services | CNY 10,000 | ||
| Number of Internet users | 10,000 households | ||
| Number of students in adult higher education | People | ||
| Innovation Input | Financial expenditure on education | CNY 10,000 | |
| Financial expenditure on science | CNY 10,000 | ||
| Number of legal entities in the scientific research and technology service industry | 10,000 People | ||
| Research and experimental development (R&D) personnel | Person/year | ||
| Research and experimental development (R&D) external expenditure | CNY 10,000 | ||
| Expenditure for new product development of industrial enterprises above designated size | CNY 10,000 | ||
| Innovation Output | Number of patent applications | Piece | |
| Number of patents granted | Piece | ||
| New product sales revenue of industrial enterprises above designated size | CNY 10,000 | ||
| Output value of new products of high-tech industry | CNY 10,000 | ||
| Number of scientific papers published | Article | ||
| Number of scientific and technological works | Article |
Table 2.
Index weight of China’s interprovincial innovation connection network in 2009.
| Criterion Layer | Weight | Index Layer | Weight |
|---|---|---|---|
| Innovation Environment | 0.223 | Public revenue (CNY 10,000) Per capita GDP (CNY) | 0.046 |
| 0.017 | |||
| Total postal business (CNY 10,000) | 0.037 | ||
| Total telecommunication services (CNY 10,000) | 0.050 | ||
| Number of Internet users (10,000 households) | 0.041 | ||
| Number of students in adult higher education (People) | 0.032 | ||
| Innovation Input | 0.321 | Financial expenditure on education (CNY 10,000) | 0.025 |
| Financial expenditure on science (CNY 10,000) | 0.081 | ||
| Number of legal entities in science (10,000 People) | 0.038 | ||
| Research and experimental development (R&D) personnel (Person/year) | 0.047 | ||
| Research and experimental development (R&D) external expenditure (CNY 10,000) | 0.060 | ||
| Expenditure for new product development of industrial enterprises above designated size (CNY 10,000) | 0.070 | ||
| Innovation Output | 0.455 | Number of patent applications (piece) | 0.090 |
| Number of patents granted (piece) | 0.096 | ||
| New product sales revenue of industry (CNY 10,000) | 0.068 | ||
| Enterprises above designated size (CNY 10,000) | 0.124 | ||
| Number of scientific papers published (article) | 0.033 | ||
| Number of scientific and technological works (article) | 0.044 |
Table 3.
Index weight of China’s interprovincial innovation connection network in 2014.
| Criterion Layer | Weight | Index Layer | Weight |
|---|---|---|---|
| Innovation Environment | 0.247 | Public revenue (CNY 10,000) Per capita GDP (CNY) | 0.038 |
| 0.010 | |||
| Total postal business (CNY 10,000) | 0.084 | ||
| Total telecommunication services (CNY 10,000) | 0.044 | ||
| Number of Internet users (10,000 households) | 0.040 | ||
| Number of students in adult higher education (People) | 0.031 | ||
| Innovation Input | 0.318 | Financial expenditure on education (CNY 10,000) | 0.026 |
| Financial expenditure on science (CNY 10,000) | 0.063 | ||
| Number of legal entities in the scientific (10,000 People) | 0.036 | ||
| Research and experimental development (R&D) personnel (Person/year) | 0.052 | ||
| Research and experimental development (R&D) external expenditure (CNY 10,000) | 0.062 | ||
| Expenditure for new product development of industrial enterprises above designated size (CNY 10,000) | 0.079 | ||
| Innovation Output | 0.435 | Number of patent applications (Piece) | 0.076 |
| Number of patents granted (Piece) | 0.082 | ||
| New product sales revenue of industrial (CNY 10,000) | 0.080 | ||
| Enterprises above designated size (CNY 10,000) | 0.127 | ||
| Number of scientific papers published (Article) | 0.032 | ||
| Number of scientific and technological works (Article) | 0.038 |
Table 4.
Index weight of China’s interprovincial innovation connection network in 2019.
| Criterion Layer | Weight | Index Layer | Weight |
|---|---|---|---|
| Innovation Environment | 0.253 | Public revenue (CNY 10,000) Per capita GDP (CNY) | 0.041 |
| 0.010 | |||
| Total postal business (CNY 10,000) | 0.083 | ||
| Total telecommunication services (CNY 10,000) | 0.042 | ||
| Number of Internet users (10,000 households) | 0.032 | ||
| Number of students in adult higher education (People) | 0.045 | ||
| Innovation Input | 0.340 | Financial expenditure on education (CNY 10,000) | 0.026 |
| Financial expenditure on science (CNY 10,000) | 0.070 | ||
| Number of legal entities in the scientific (10,000 People) | 0.045 | ||
| Research and experimental development (R&D) personnel (Person/year) | 0.056 | ||
| Research and experimental development (R&D) external expenditure (CNY 10,000) | 0.062 | ||
| Expenditure for new product development of industrial enterprises above designated size (CNY 10,000) | 0.081 | ||
| Innovation Output | 0.407 | Number of patent applications (Piece) | 0.069 |
| Number of patents granted (Piece) | 0.073 | ||
| New product sales revenue of industrial (CNY 10,000) | 0.078 | ||
| Enterprises above designated size (CNY 10,000) | 0.124 | ||
| Number of scientific papers published (Article) | 0.033 | ||
| Number of scientific and technological works (Article) | 0.030 |
Table 5.
Changes in the number of different innovation connection levels in 2009, 2014, and 2019.
| Innovation Connection Level | In 2009 | In 2014 | In 2019 |
|---|---|---|---|
| Extremely strong gravity | 2 | 4 | 5 |
| Strong gravity | 3 | 3 | 5 |
| General gravity | 4 | 13 | 26 |
| Weak gravity | 38 | 45 | 39 |
Table 6.
Changes in the scale of outward innovation in 2009, 2014, and 2019.
| In 2009 | In 2014 | In 2019 | |||
|---|---|---|---|---|---|
| Scale of outward innovation Top 5 | Scale of outward innovation | Scale of outward innovation Top 5 | Scale of outward innovation | Scale of outward innovation Top 5 | Scale of outward innovation |
| Guangdong | 0.1383 | Guangdong | 0.1564 | Guangdong | 0.1913 |
| Jiangsu | 0.1223 | Jiangsu | 0.1355 | Jiangsu | 0.1129 |
| Shanghai | 0.0854 | Zhejiang | 0.0815 | Zhejiang | 0.0804 |
| Zhejiang | 0.0813 | Shandong | 0.0717 | Shanghai | 0.0562 |
| Beijing | 0.0801 | Beijing | 0.0628 | Beijing | 0.0552 |
Table 7.
Changes in total innovation connection in 2009, 2014, and 2019.
| In 2009 | In 2014 | In 2019 | |||
|---|---|---|---|---|---|
| Scale of outward innovation Top 5 | Proportion in China (%) | Scale of outward innovation Top 5 | Proportion in China (%) | Scale of outward innovation Top 5 | Proportion in China (%) |
| Jiangsu | 18.30 | Jiangsu | 21.15 | Jiangsu | 20.38 |
| Zhejiang | 16.27 | Zhejiang | 14.71 | Zhejiang | 16.01 |
| Shanghai | 15.09 | Beijing | 10.19 | Shanghai | 11.83 |
| Beijing | 11.99 | Shanghai | 9.85 | Anhui | 8.87 |
| Tianjin | 9.14 | Anhui | 8.39 | Beijing | 7.15 |
Disclaimer/Publisher’s Note: The statements, opinions and data contained in all publications are solely those of the individual author(s) and contributor(s) and not of MDPI and/or the editor(s). MDPI and/or the editor(s) disclaim responsibility for any injury to people or property resulting from any ideas, methods, instructions or products referred to in the content. |
© 2023 by the authors. Licensee MDPI, Basel, Switzerland. This article is an open access article distributed under the terms and conditions of the Creative Commons Attribution (CC BY) license (https://creativecommons.org/licenses/by/4.0/).
Share and Cite
MDPI and ACS Style
Zhu, K.; Gu, Z.; Li, J. Analysis of the China’s Interprovincial Innovation Connection Network Based on Modified Gravity Model. Land 2023, 12, 1091. https://doi.org/10.3390/land12051091
AMA Style
Zhu K, Gu Z, Li J. Analysis of the China’s Interprovincial Innovation Connection Network Based on Modified Gravity Model. Land. 2023; 12(5):1091. https://doi.org/10.3390/land12051091
Chicago/Turabian StyleZhu, Kai, Zhiling Gu, and Jingang Li. 2023. "Analysis of the China’s Interprovincial Innovation Connection Network Based on Modified Gravity Model" Land 12, no. 5: 1091. https://doi.org/10.3390/land12051091
Note that from the first issue of 2016, this journal uses article numbers instead of page numbers. See further details here.