

Land Use/Land Cover Change Analysis Using Multi-Temporal Remote Sensing Data: A Case Study of Tigris and Euphrates Rivers Basin


Abstract
:1. Introduction
2. Materials and Methods
2.1. Study Area
2.2. Dataset
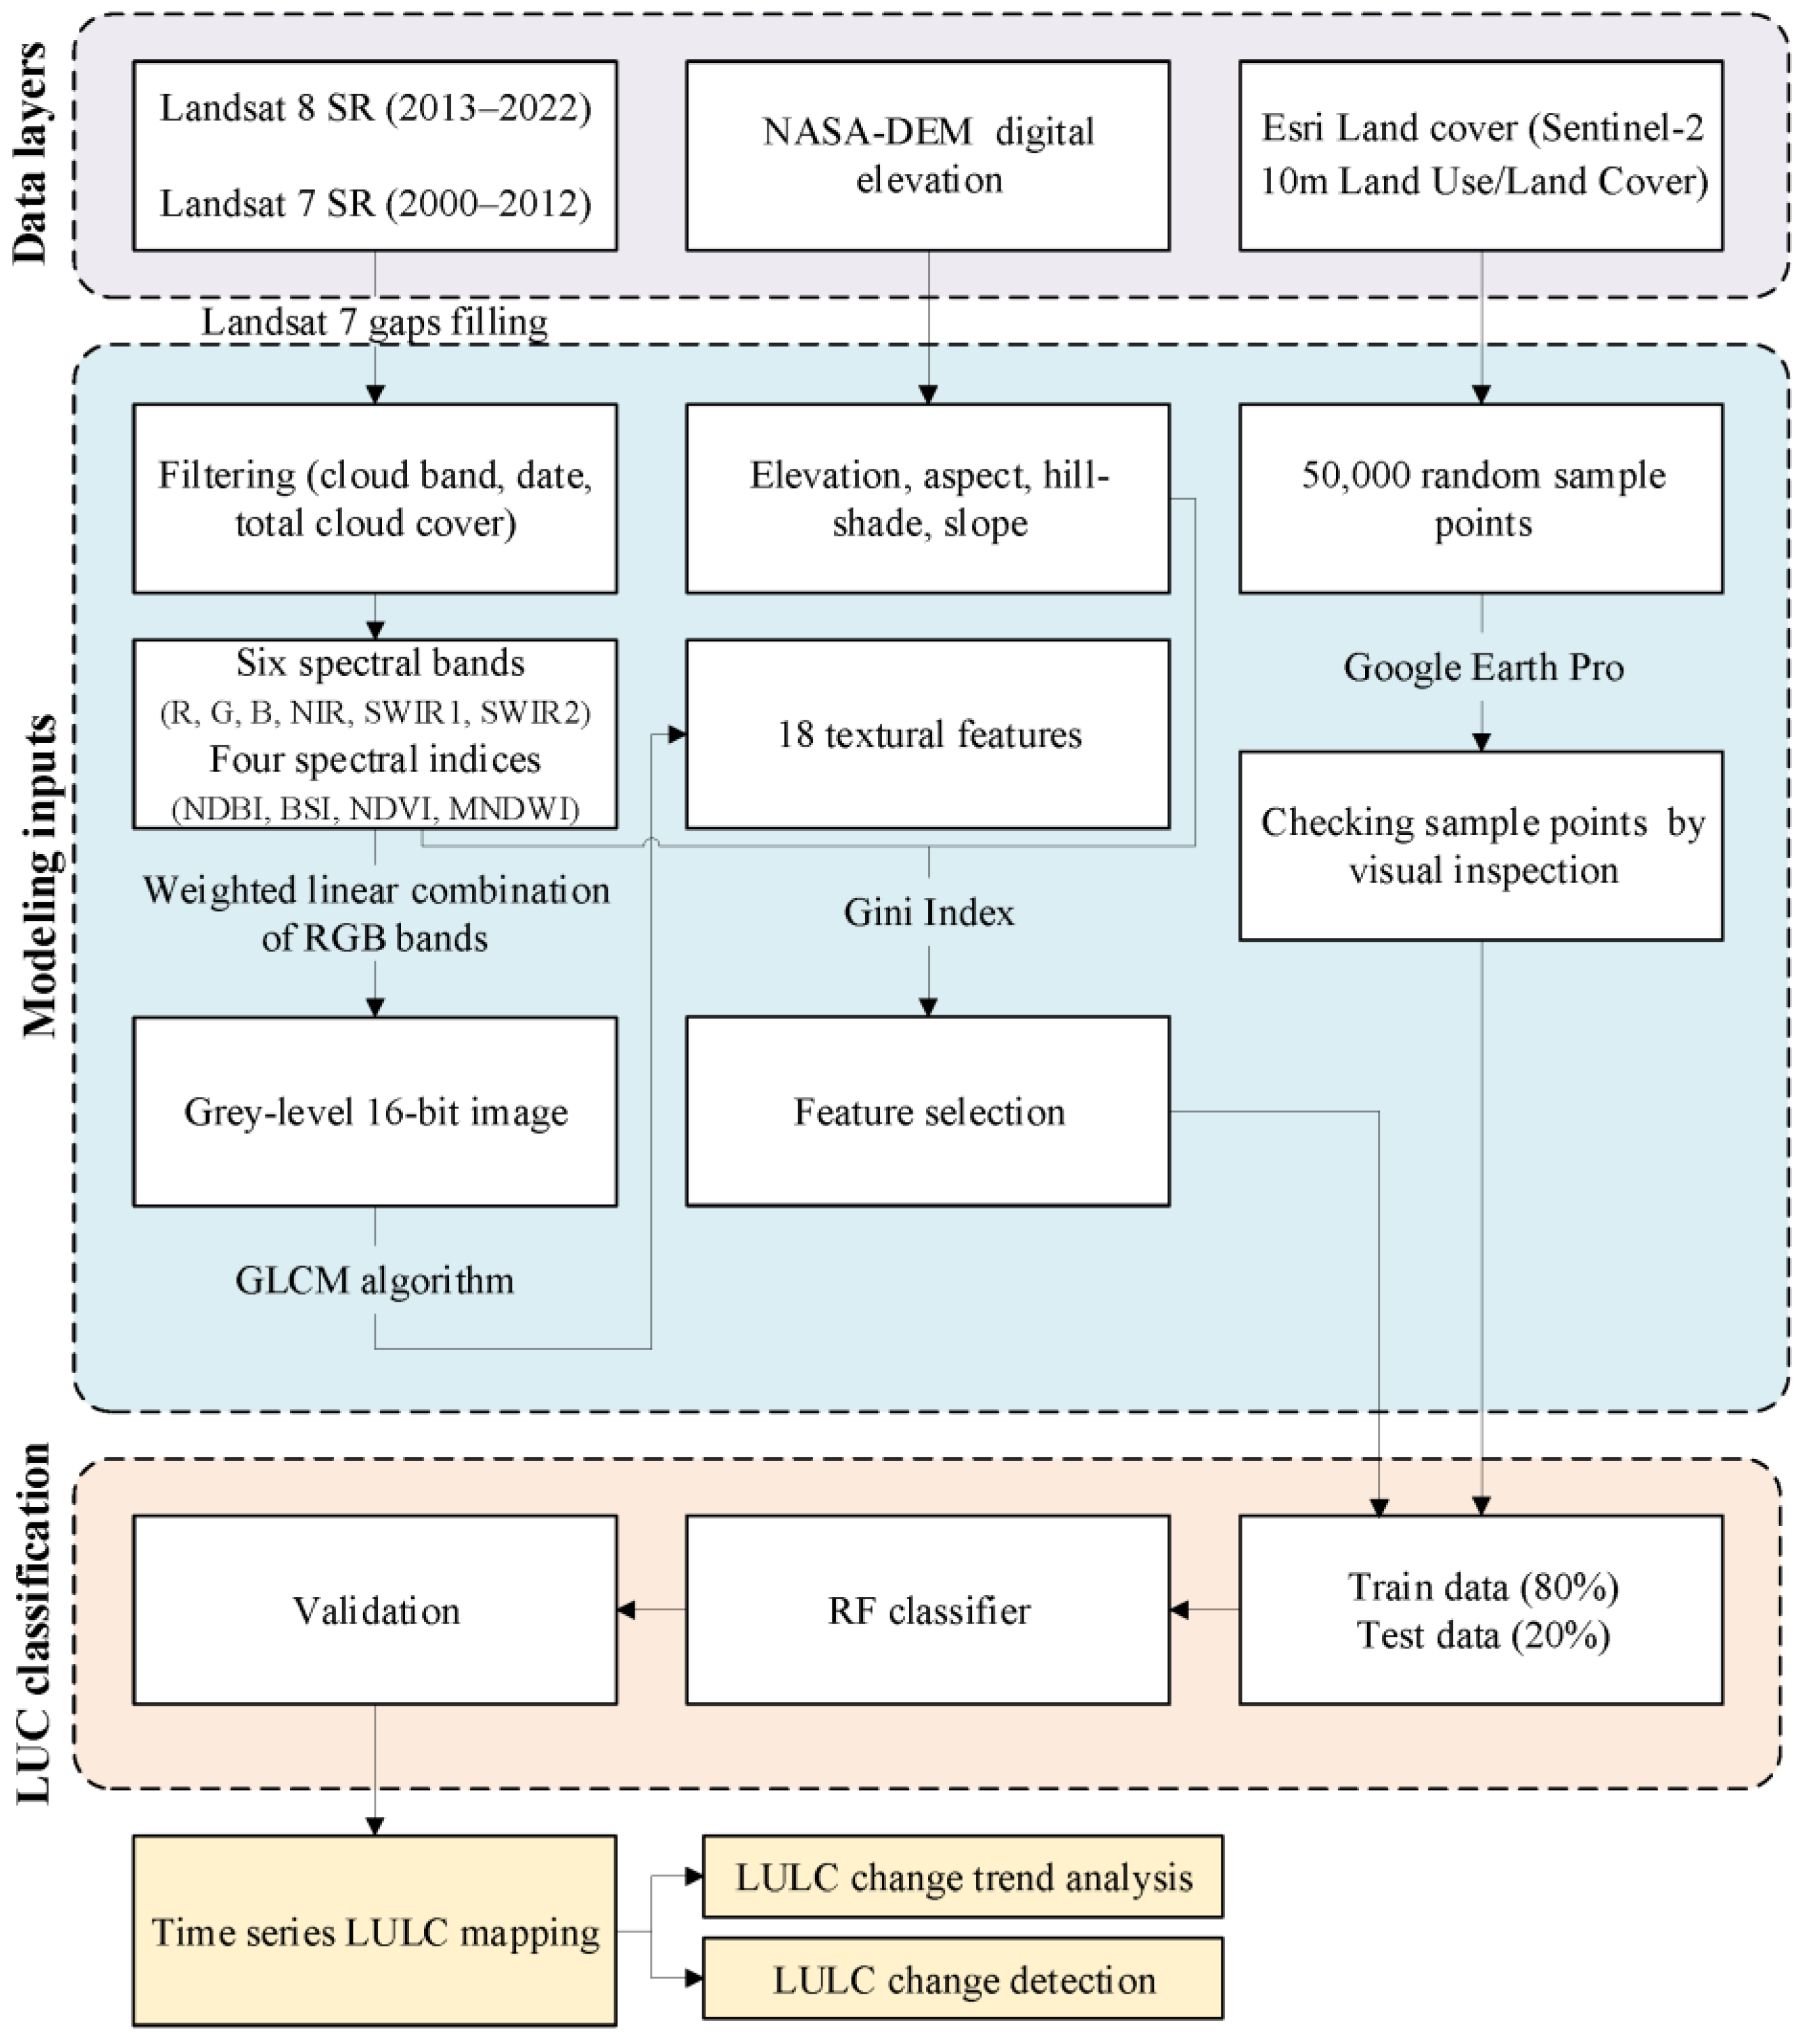
2.3. Methodology
- Preparation of data layers, including Landsat 8 (2013–2022) and Landsat 7 (2000–2012) images and the NASA-DEM.
- After filtering the cloud band, dates, and total cloud cover, six spectral bands, four spectral indices, and 18 textural features were extracted from the annual Landsat images. Each year, the median of Landsat images with a total cloud cover of less than 50% taken from April to September and considered the annual image. Landsat 7 gap filling was performed before feature extraction. To extract the textural features, the images were converted into gray-level 16-bit images with a linear weighted combination (0.3 × R + 0.59 × G + 0.11 × B) [20]. The gray-level co-occurrence matrix (GLCM) algorithm was applied to extract their textural features. Elevation, aspect, hill-shade, and slope features were extracted from the NASA-DEM.
- Feature selection was performed using the Gini index.
- A total of 50,000 random sample points were selected and labeled in the study area by visual inspection using Google Earth Pro.
- The RF classifier was trained using 80% of the dataset. The remaining 20% of the dataset was used to assess the accuracy of the results using the confusion matrix.
- After accuracy assessment, the multi-temporal LULC maps were created. The LULC map for each year was estimated using training the model with samples from that year.
- The Modified Mann–Kendall (MMK) test was applied to determine the LULC classes change uniform trend, and a fifth polynomial was fitted to the LULC classes’ data series to plot the LULC change trend.
- LULC maps were temporary analyzed to calculate the LULC changes.
2.4. Land Use/Land Cover (LULC) Classification
2.5. Classification Accuracy Assessment
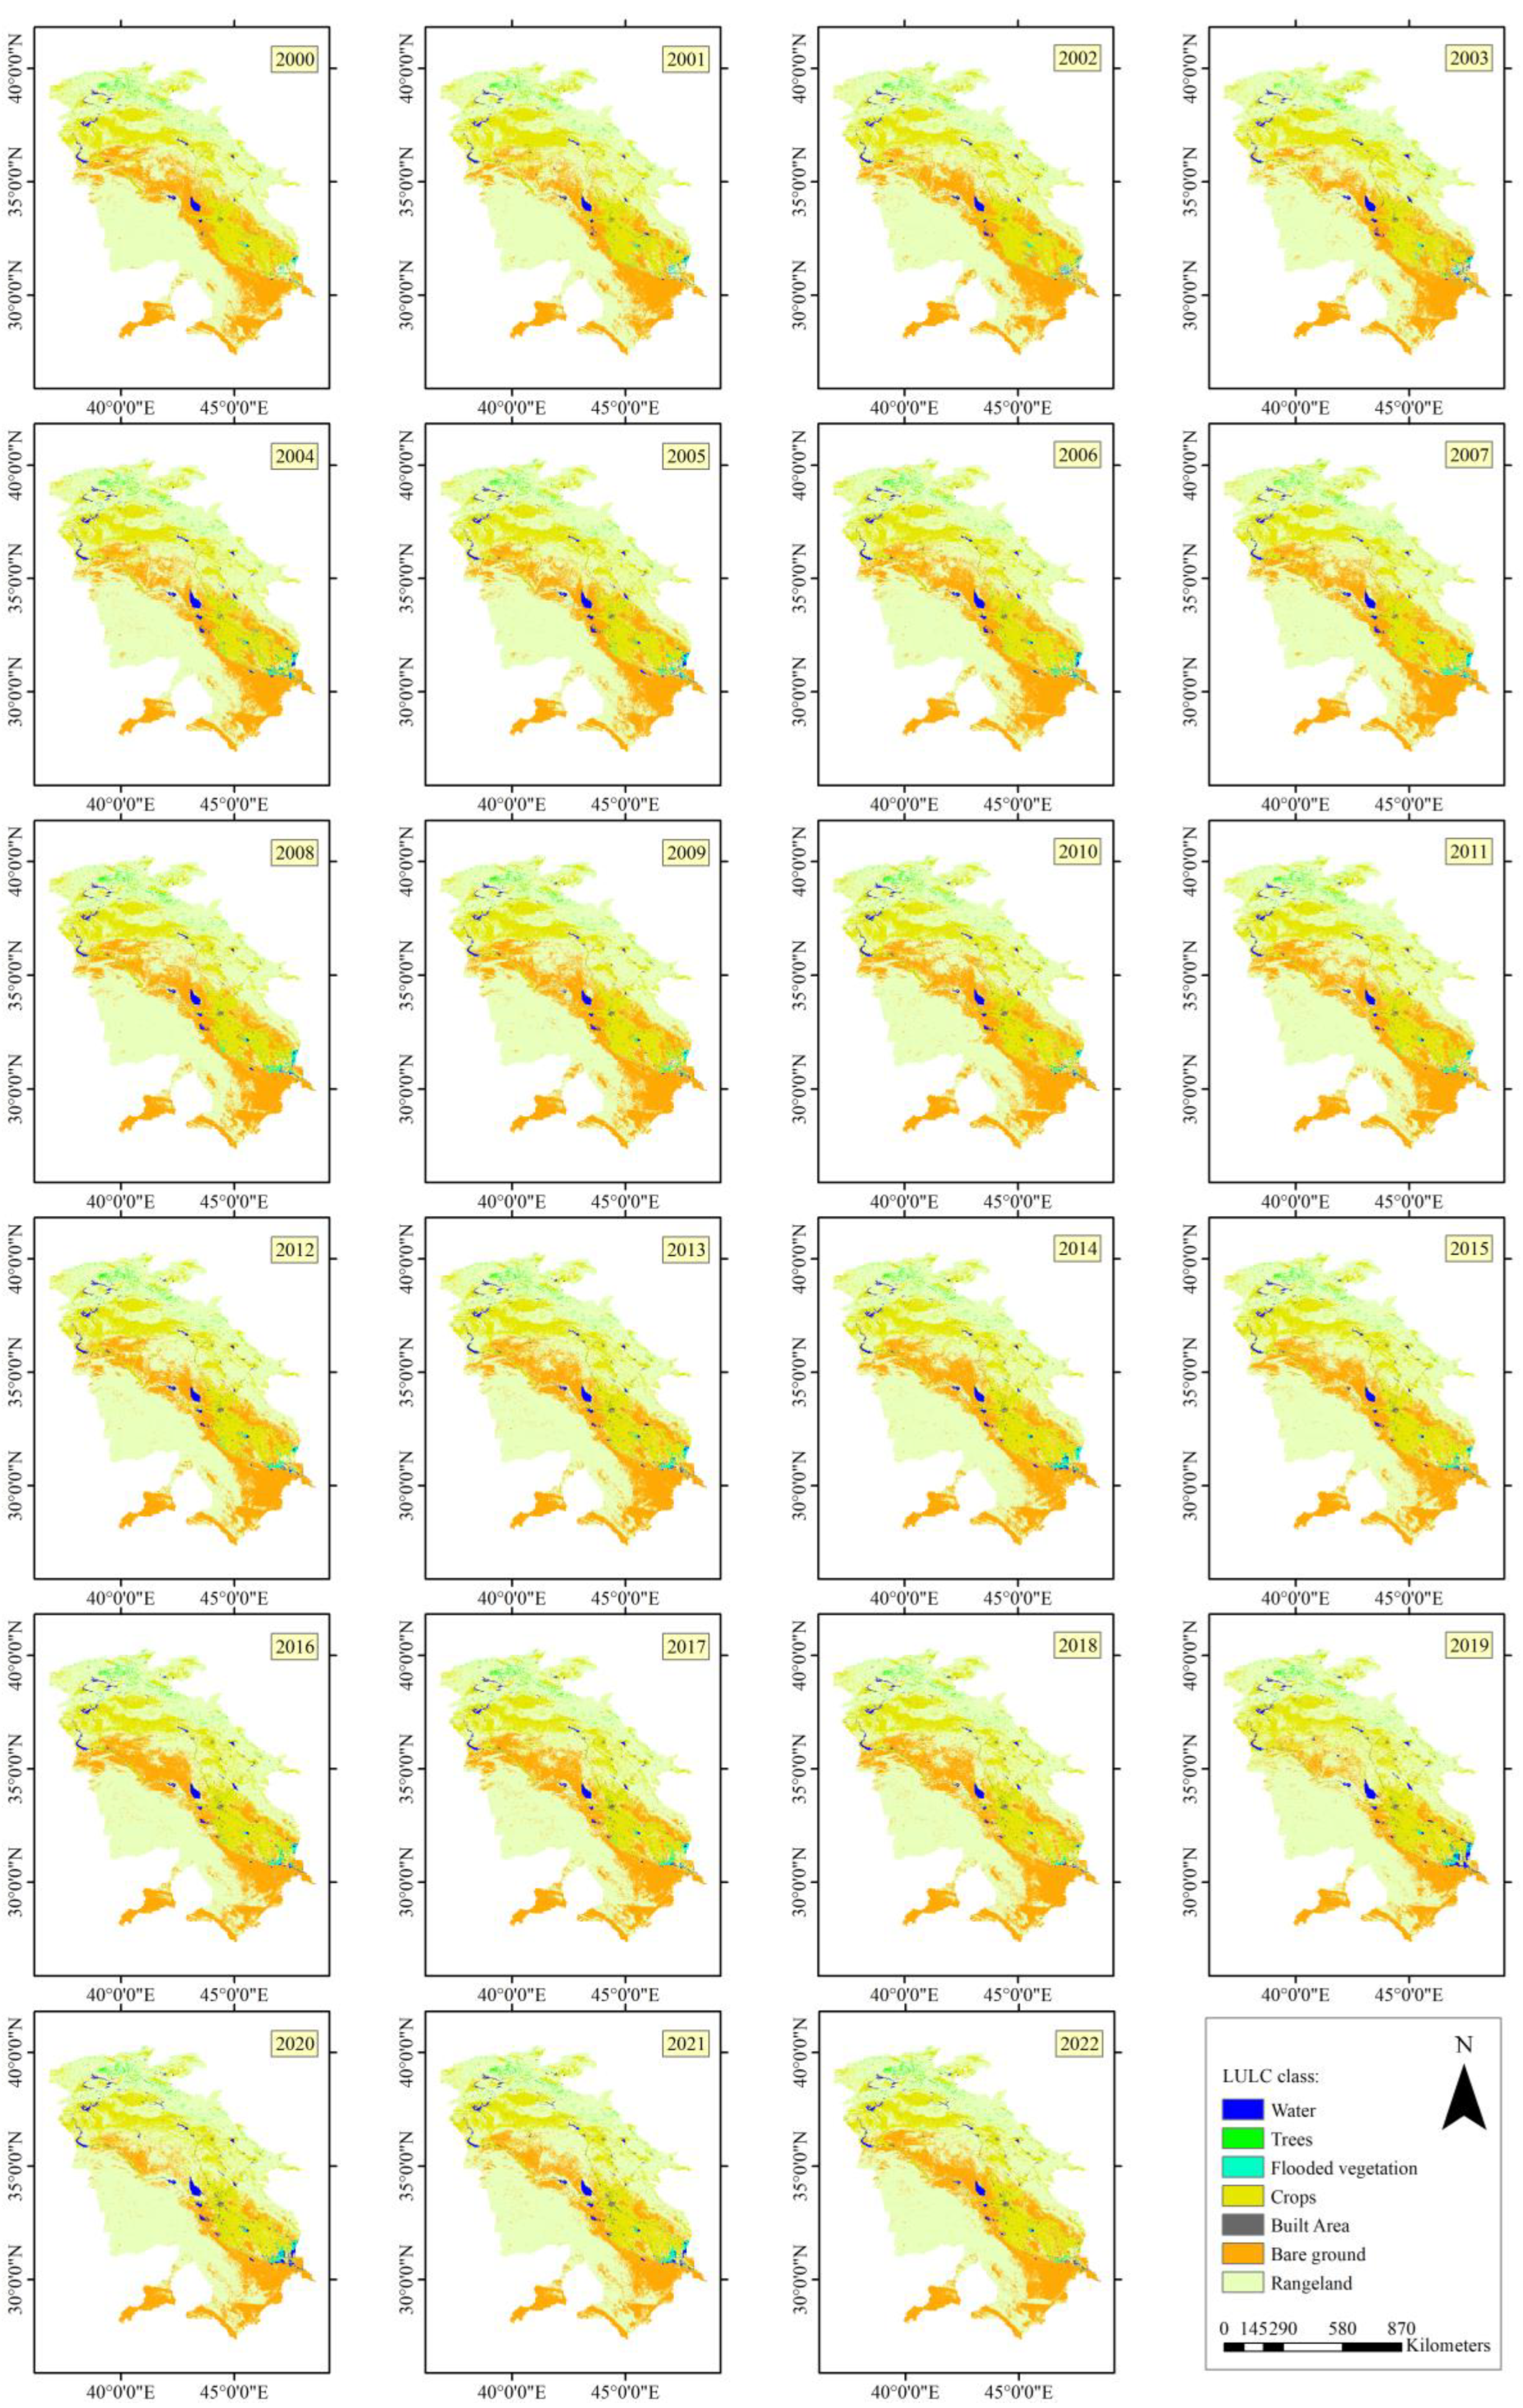
3. Results
3.1. Classification Results
- Water: areas where water was mainly present throughout the year.
- Trees: notable areas of tall, dense vegetation.
- Flooded vegetation: areas where vegetation and water are mixed mainly throughout the year.
- Crops: crops, cereals, and grasses planted by humans at lower tree height.
- Built area: impervious surfaces and structures made by humans.
- Bare ground: areas of rock or soil containing very poor vegetation.
- Rangeland: areas that are covered by homogenous grasses.
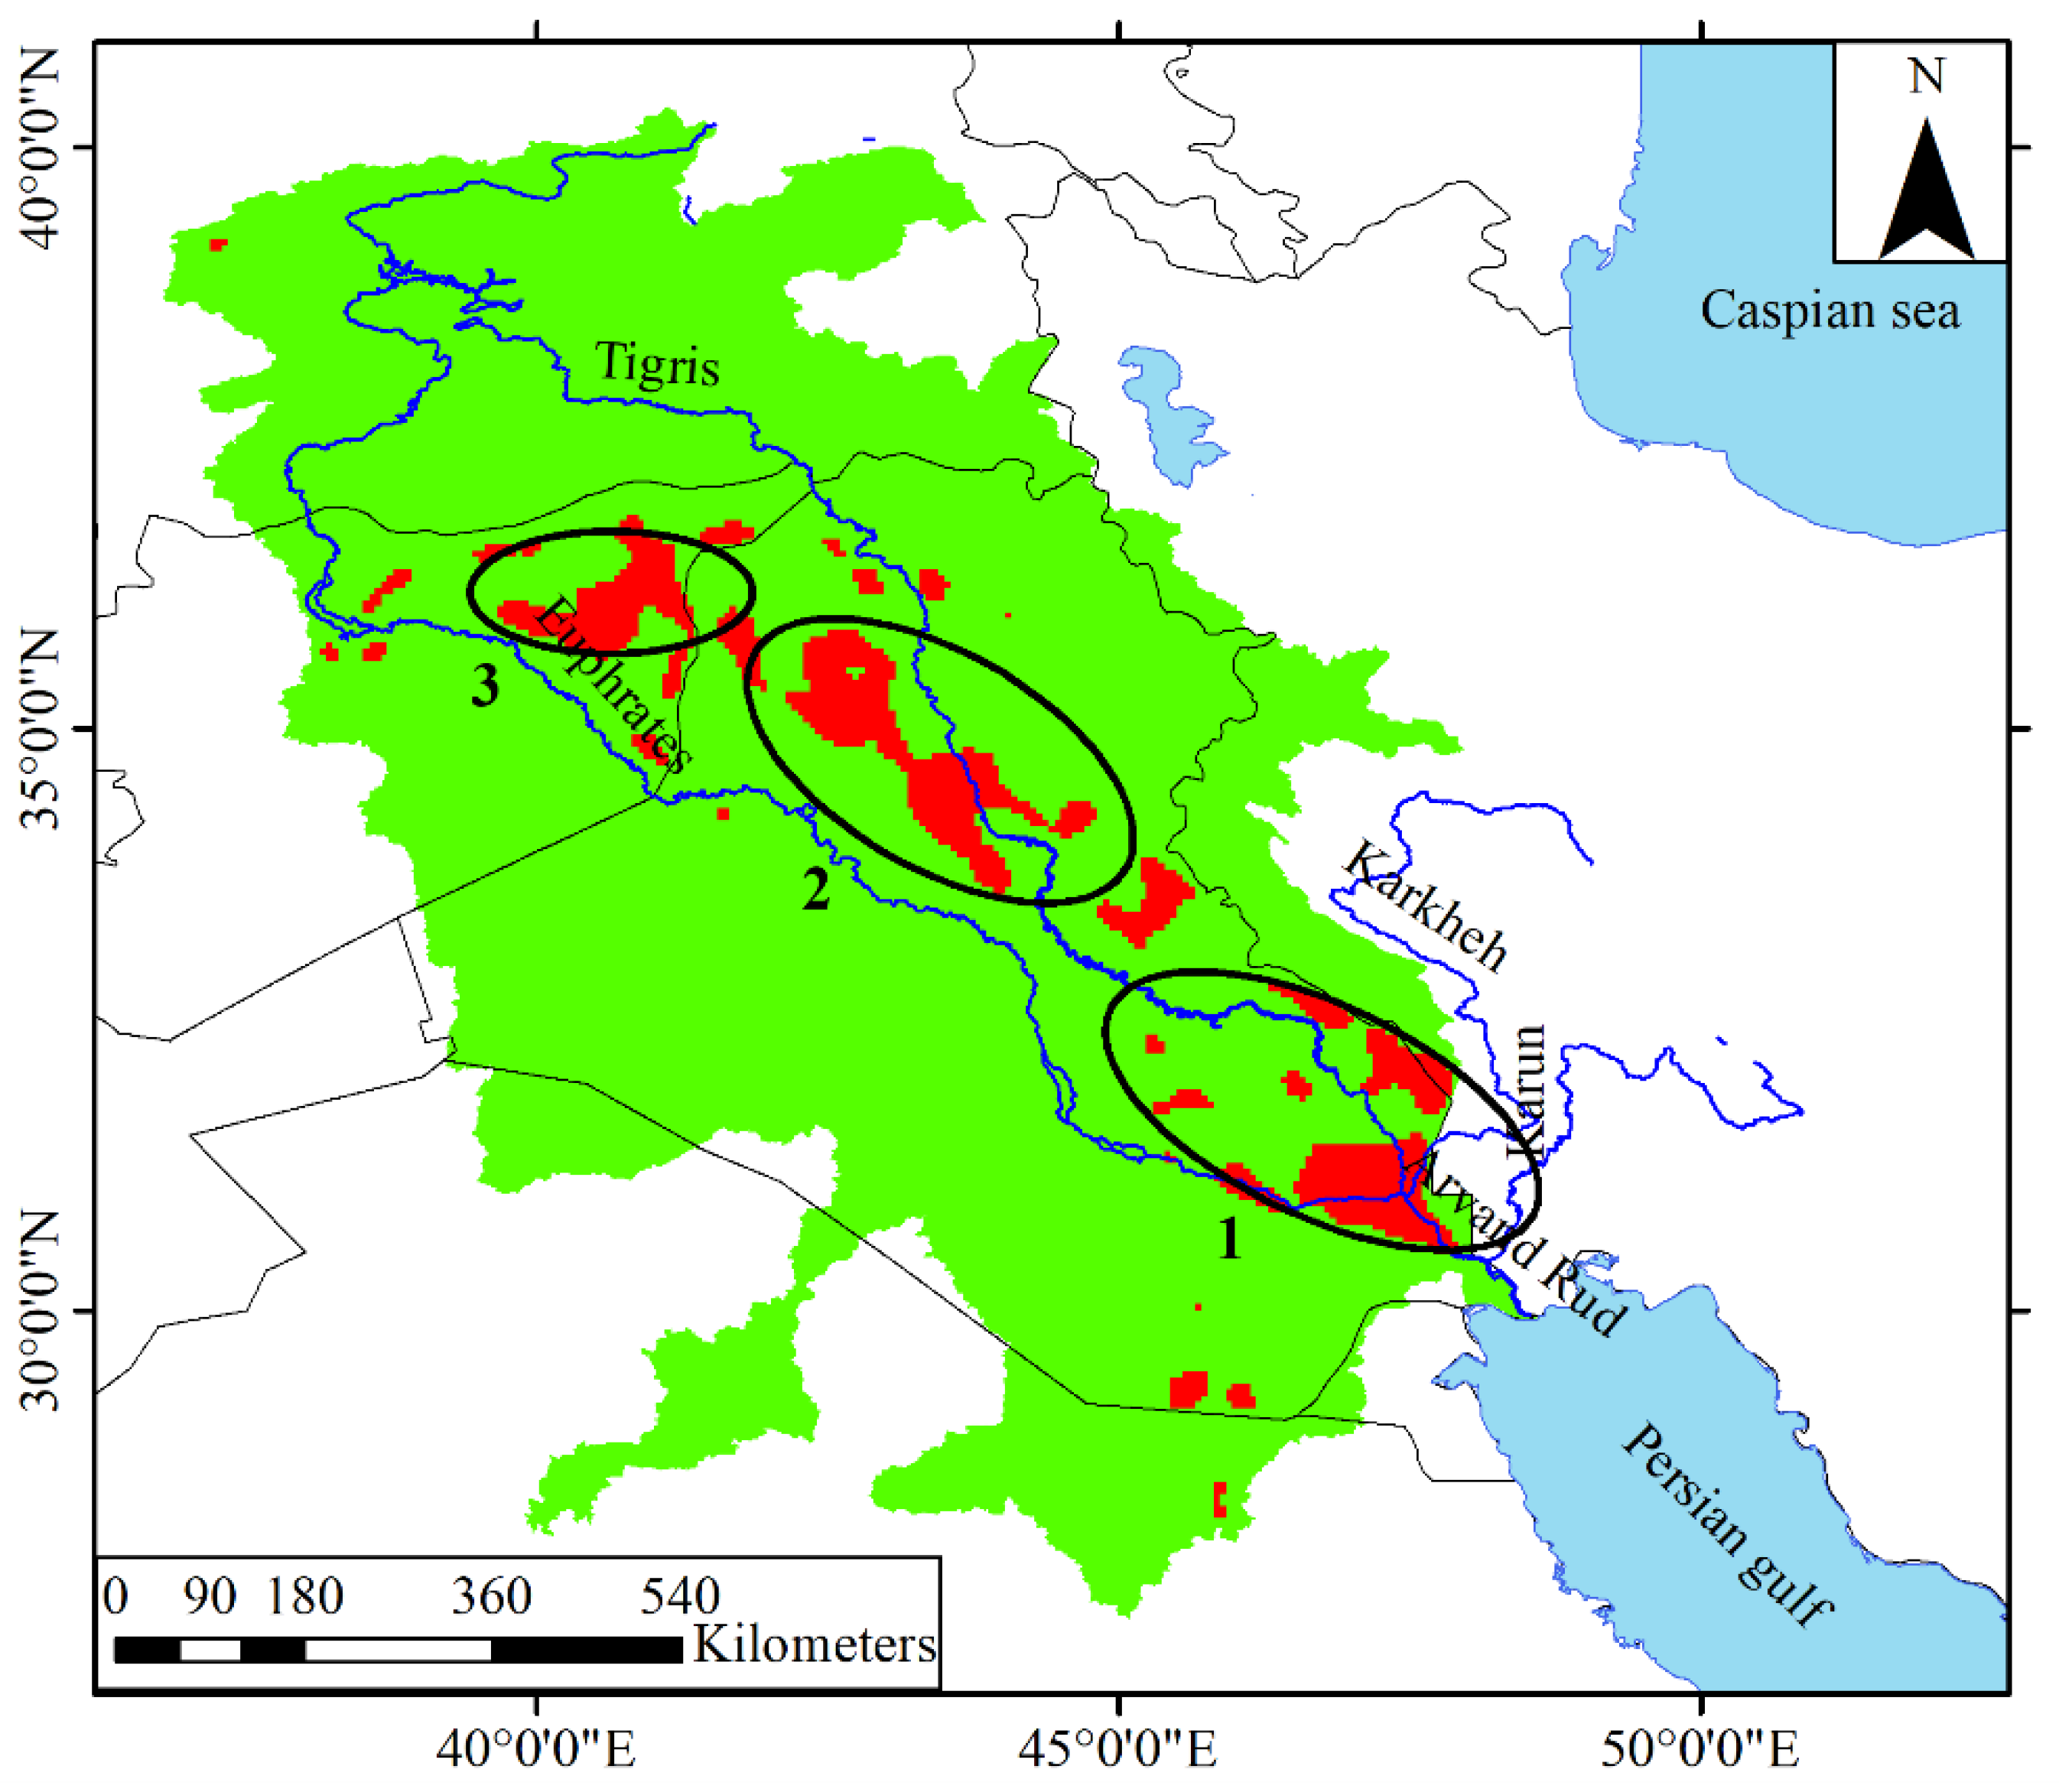
3.2. Land Use Land Cover (LULC) Change Analysis
4. Discussion and Conclusions
Author Contributions
Funding
Data Availability Statement
Acknowledgments
Conflicts of Interest
References
- Singh, G.; Pandey, A. Evaluation of classification algorithms for land use land cover mapping in the snow-fed Alaknanda River Basin of the Northwest Himalayan Region. Appl. Geomat. 2021, 13, 863–875. [Google Scholar] [CrossRef]
- Talukdar, S.; Singha, P.; Mahato, S.; Pal, S.; Liou, Y.-A.; Rahman, A. Land-use land-cover classification by machine learning classifiers for satellite observations—A review. Remote Sens. 2020, 12, 1135. [Google Scholar] [CrossRef]
- Yeneneh, N.; Elias, E.; Feyisa, G.L. Detection of land use/land cover and land surface temperature change in the Suha Watershed, North-Western highlands of Ethiopia. Environ. Chall. 2022, 7, 100523. [Google Scholar] [CrossRef]
- Singh, R.K.; Singh, P.; Drews, M.; Kumar, P.; Singh, H.; Gupta, A.K.; Govil, H.; Kaur, A.; Kumar, M. A machine learning-based classification of LANDSAT images to map land use and land cover of India. Remote Sens. Appl. Soc. Environ. 2021, 24, 100624. [Google Scholar] [CrossRef]
- Militino, A.F.; Ugarte, M.; Pérez-Goya, U. An introduction to the spatio-temporal analysis of satellite remote sensing data for geostatisticians. In Handbook of Mathematical Geosciences; Springer: Cham, Switzerland, 2018; pp. 239–253. [Google Scholar]
- Faruque, M.J.; Vekerdy, Z.; Hasan, M.Y.; Islam, K.Z.; Young, B.; Ahmed, M.T.; Monir, M.U.; Shovon, S.M.; Kakon, J.F.; Kundu, P. Monitoring of land use and land cover changes by using remote sensing and GIS techniques at human-induced mangrove forests areas in Bangladesh. Remote Sens. Appl. Soc. Environ. 2022, 25, 100699. [Google Scholar] [CrossRef]
- Wang, J.; Bretz, M.; Dewan, M.A.A.; Delavar, M.A. Machine learning in modelling land-use and land cover-change (LULCC): Current status, challenges and prospects. Sci. Total Environ. 2022, 822, 153559. [Google Scholar] [CrossRef]
- Ghayour, L.; Neshat, A.; Paryani, S.; Shahabi, H.; Shirzadi, A.; Chen, W.; Al-Ansari, N.; Geertsema, M.; Pourmehdi Amiri, M.; Gholamnia, M. Performance evaluation of sentinel-2 and landsat 8 OLI data for land cover/use classification using a comparison between machine learning algorithms. Remote Sens. 2021, 13, 1349. [Google Scholar] [CrossRef]
- Loukika, K.N.; Keesara, V.R.; Sridhar, V. Analysis of land use and land cover using machine learning algorithms on google earth engine for Munneru River Basin, India. Sustainability 2021, 13, 13758. [Google Scholar] [CrossRef]
- Pan, X.; Wang, Z.; Gao, Y.; Dang, X.; Han, Y. Detailed and automated classification of land use/land cover using machine learning algorithms in Google Earth Engine. Geocarto Int. 2021, 37, 5415–5432. [Google Scholar] [CrossRef]
- Roy, B. A machine learning approach to monitoring and forecasting spatio-temporal dynamics of land cover in Cox’s Bazar district, Bangladesh from 2001 to 2019. Environ. Chall. 2021, 5, 100237. [Google Scholar] [CrossRef]
- Zhong, B.; Yang, A.; Jue, K.; Wu, J. Long Time Series High-Quality and High-Consistency Land Cover Mapping Based on Machine Learning Method at Heihe River Basin. Remote Sens. 2021, 13, 1596. [Google Scholar] [CrossRef]
- Abdi, A.M. Land cover and land use classification performance of machine learning algorithms in a boreal landscape using Sentinel-2 data. GIScience Remote Sens. 2020, 57, 1–20. [Google Scholar] [CrossRef]
- Jamali, A. Land use land cover mapping using advanced machine learning classifiers: A case study of Shiraz city, Iran. Earth Sci. Inform. 2020, 13, 1015–1030. [Google Scholar] [CrossRef]
- Kordi, F.; Yousefi, H.; Ghasemi, L.; Tajrishy, M. Investigation and comparison of land use map database in the Urmia lake basin. Iran. J. Ecohydrol. 2022, 8, 891–905. [Google Scholar]
- Brown, C.F.; Brumby, S.P.; Guzder-Williams, B.; Birch, T.; Hyde, S.B.; Mazzariello, J.; Czerwinski, W.; Pasquarella, V.J.; Haertel, R.; Ilyushchenko, S. Dynamic World, Near real-time global 10 m land use land cover mapping. Sci. Data 2022, 9, 251. [Google Scholar] [CrossRef]
- Al-Muqdadi, S.W. Developing strategy for water conflict management and transformation at Euphrates–Tigris basin. Water 2019, 11, 2037. [Google Scholar] [CrossRef]
- Giovanis, E.; Ozdamar, O. The Transboundary Effects of Climate Change and Global Adaptation: The Case of the Euphrates-Tigris Water Basin in Turkey and Iraq; SSRN: New York, NY, USA, 2021. [Google Scholar] [CrossRef]
- Adamo, N.; Al-Ansari, N.; Sissakian, V.K. Global climate change impacts on Tigris-Euphrates Rivers basins. J. Earth Sci. Geotech. Eng. 2020, 10, 49–98. [Google Scholar]
- Tassi, A.; Gigante, D.; Modica, G.; Di Martino, L.; Vizzari, M. Pixel-vs. Object-based landsat 8 data classification in google earth engine using random forest: The case study of maiella national park. Remote Sens. 2021, 13, 2299. [Google Scholar] [CrossRef]
- Singh, R.P.; Singh, N.; Singh, S.; Mukherjee, S. Normalized difference vegetation index (NDVI) based classification to assess the change in land use/land cover (LULC) in Lower Assam, India. Int. J. Adv. Remote Sens. GIS 2016, 5, 1963–1970. [Google Scholar] [CrossRef]
- Capolupo, A.; Monterisi, C.; Tarantino, E. Landsat images classification algorithm (LICA) to automatically extract land cover information in Google Earth Engine environment. Remote Sens. 2020, 12, 1201. [Google Scholar] [CrossRef]
- Diek, S.; Fornallaz, F.; Schaepman, M.E.; De Jong, R. Barest pixel composite for agricultural areas using landsat time series. Remote Sens. 2017, 9, 1245. [Google Scholar] [CrossRef]
- Chen, W.; Liu, L.; Zhang, C.; Wang, J.; Wang, J.; Pan, Y. Monitoring the seasonal bare soil areas in Beijing using multitemporal TM images. In Proceedings of the 2004 IEEE International Geoscience and Remote Sensing Symposium (IGARSS 2004), Anchorage, AK, USA, 20–24 September 2004; pp. 3379–3382. [Google Scholar]
- Kordi, F.; Yousefi, H. Crop classification based on phenology information by using time series of optical and synthetic-aperture radar images. Remote Sens. Appl. Soc. Environ. 2022, 27, 100812. [Google Scholar] [CrossRef]
- Xu, H. Modification of normalised difference water index (NDWI) to enhance open water features in remotely sensed imagery. Int. J. Remote Sens. 2006, 27, 3025–3033. [Google Scholar] [CrossRef]
- Kulkarni, V.Y.; Sinha, P.K. Pruning of random forest classifiers: A survey and future directions. In Proceedings of the 2012 International Conference on Data Science & Engineering (ICDSE), Cochin, India, 18–20 July 2012; pp. 64–68. [Google Scholar]
- Khorrami, M.; Khorrami, M.; Farhangi, F. Evaluation of tree-based ensemble algorithms for predicting the big five personality traits based on social media photos: Evidence from an Iranian sample. Personal. Individ. Differ. 2022, 188, 111479. [Google Scholar] [CrossRef]
- Demir, F. 14—Deep autoencoder-based automated brain tumor detection from MRI data. In Artificial Intelligence-Based Brain-Computer Interface; Bajaj, V., Sinha, G.R., Eds.; Academic Press: Cambridge, MA, USA, 2022; pp. 317–351. [Google Scholar]
- Maxwell, A.E.; Warner, T.A.; Guillén, L.A. Accuracy assessment in convolutional neural network-based deep learning remote sensing studies—Part 2: Recommendations and best practices. Remote Sens. 2021, 13, 2591. [Google Scholar] [CrossRef]
- Kerdprasop, N.; Kerdprasop, K. A Heuristic-Based Decision Tree Induction Method for Noisy Data. In Database Theory and Application, Bio-Science and Bio-Technology; Springer: Berlin/Heidelberg, Germany, 2011; pp. 1–10. [Google Scholar]
- Yue, S.; Wang, C. The Mann-Kendall test modified by effective sample size to detect trend in serially correlated hydrological series. Water Resour. Manag. 2004, 18, 201–218. [Google Scholar] [CrossRef]
- Khamchiangta, D.; Dhakal, S. Time series analysis of land use and land cover changes related to urban heat island intensity: Case of Bangkok Metropolitan Area in Thailand. J. Urban Manag. 2020, 9, 383–395. [Google Scholar] [CrossRef]
- Kang, C.S.; Kanniah, K.D. Land use and land cover change and its impact on river morphology in Johor River Basin, Malaysia. J. Hydrol. Reg. Stud. 2022, 41, 101072. [Google Scholar] [CrossRef]
- Farhangi, F. Investigating the role of data preprocessing, hyperparameters tuning, and type of machine learning algorithm in the improvement of drowsy EEG signal modeling. Intell. Syst. Appl. 2022, 15, 200100. [Google Scholar] [CrossRef]
- Chang, K.-T.; Merghadi, A.; Yunus, A.P.; Pham, B.T.; Dou, J. Evaluating scale effects of topographic variables in landslide susceptibility models using GIS-based machine learning techniques. Sci. Rep. 2019, 9, 12296. [Google Scholar] [CrossRef]
- Farhangi, F.; Sadeghi-Niaraki, A.; Razavi-Termeh, S.V.; Choi, S.-M. Evaluation of Tree-Based Machine Learning Algorithms for Accident Risk Mapping Caused by Driver Lack of Alertness at a National Scale. Sustainability 2021, 13, 10239. [Google Scholar] [CrossRef]
- Kavzoglu, T.; Bilucan, F. Effects of auxiliary and ancillary data on LULC classification in a heterogeneous environment using optimized random forest algorithm. Earth Sci. Inform. 2022, 16, 415–435. [Google Scholar] [CrossRef]
- Jia, K.; Wei, X.; Gu, X.; Yao, Y.; Xie, X.; Li, B. Land cover classification using Landsat 8 operational land imager data in Beijing, China. Geocarto Int. 2014, 29, 941–951. [Google Scholar] [CrossRef]
- Kwan, C.; Ayhan, B.; Budavari, B.; Lu, Y.; Perez, D.; Li, J.; Bernabe, S.; Plaza, A. Deep learning for land cover classification using only a few bands. Remote Sens. 2020, 12, 2000. [Google Scholar] [CrossRef]
- Yu, Z.; Di, L.; Yang, R.; Tang, J.; Lin, L.; Zhang, C.; Rahman, M.S.; Zhao, H.; Gaigalas, J.; Yu, E.G. Selection of landsat 8 OLI band combinations for land use and land cover classification. In Proceedings of the 2019 8th International Conference on Agro-Geoinformatics, Istanbul, Turkey, 16–19 July 2019; pp. 1–5. [Google Scholar]
- Jarah, S.H.A.; Zhou, B.; Abdullah, R.J.; Lu, Y.; Yu, W. Urbanization and urban sprawl issues in city structure: A case of the Sulaymaniah Iraqi Kurdistan Region. Sustainability 2019, 11, 485. [Google Scholar] [CrossRef]
- Razzaq, B.K.A. Contrast of the spatial distribution of the problem of random housing in the Baghdad Governorate” Baghdad Al gadeeda district”. J. Iraqi Univ. 2019, 43, 304–316. [Google Scholar]
- Hameed, A.H. Future predicted dynamic model urban growth for baqubah city: Civil. Diyala J. Eng. Sci. 2015, 8, 157–171. [Google Scholar]
- Mindeel, S.M.A. Urban Sprawl housing in Orchards and Agricultural lands in Baquba city. J. Res. Diyala Humanit. 2019, 2, 1–27. [Google Scholar]
- Hamad, R. A remote sensing and GIS-based analysis of urban sprawl in Soran District, Iraqi Kurdistan. SN Appl. Sci. 2020, 2, 24. [Google Scholar] [CrossRef]
- Eulewi, H.K.; Hasan, A. Monitoring of the temporal changes in the forests of northern Iraq through the directed classification and the index of natural vegetative difference. Plant Arch. 2020, 20, 5745–5750. [Google Scholar]
- Qader, W.M. Urbanization and Change Detection of Kirkuk City, Iraq for Developmental Planning Through Integrated Geoinformatics Techniques. Int. J. Sci. Eng. Res. 2016, 7, 1261–1269. [Google Scholar]
- Salman Aal-shamkhi, A.D.; Mojaddadi, H.; Pradhan, B.; Abdullahi, S. Extraction and modeling of urban sprawl development in Karbala City using VHR satellite imagery. In Spatial Modeling and Assessment of Urban Form: Analysis of Urban Growth: From Sprawl to Compact Using Geospatial Data; Springer: Cham, Switzerland, 2017; pp. 281–296. [Google Scholar]
- Kadhim, A.A.; Abbas, L.Z. Unplanned Urbanization and Agricultural Land Degradation in Baghdad City from 2003 to 2017. J. Coll. Educ. Women 2021, 32, 1–17. [Google Scholar] [CrossRef]
- Ahmed, A.R.; Al-Zewar, J.M.; Fawzi, N.A.-M.; Abulhasan, A.A. Culture of common carp (Cyprinus carpio L.) in Basrah Governorate, southern Iraq; Current status and suggestions for development. Ecol. Environ. Conserv. 2020, 26, 824–831. [Google Scholar]
- Mohamed, M.A.; Anders, J.; Schneider, C. Monitoring of changes in land use/land cover in Syria from 2010 to 2018 using multitemporal Landsat imagery and GIS. Land 2020, 9, 226. [Google Scholar] [CrossRef]
- Mohamed, M.A. Spatiotemporal Impacts of Urban Land Use/Land Cover Changes on Land Surface Temperature: A Comparative Study of Damascus and Aleppo (Syria). Atmosphere 2021, 12, 1037. [Google Scholar] [CrossRef]
- Al-Muhyi, A.H.A.; Aleedani, F.Y.K. Impacts of Global Climate Change on Temperature and Precipitation in Basra City, Iraq. Basrah J. Sci. 2022, 40, 215–230. [Google Scholar] [CrossRef]
- Rahi, K.A.; Al-Madhhachi, A.-S.T.; Al-Hussaini, S.N. Assessment of surface water resources of eastern Iraq. Hydrology 2019, 6, 57. [Google Scholar] [CrossRef]
- Naqi, N.M.; Al-Jiboori, M.H.; Al-Madhhachi, A.-S.T. Statistical analysis of extreme weather events in the Diyala River basin, Iraq. J. Water Clim. Chang. 2021, 12, 3770–3785. [Google Scholar] [CrossRef]
- World Bank Group. Available online: https://climateknowledgeportal.worldbank.org (accessed on 25 December 2022).
- Darvishi Boloorani, A.; Kazemi, Y.; Sadeghi, A.; Nadizadeh Shorabeh, S.; Argany, M. Identification of dust sources using long term satellite and climatic data: A case study of Tigris and Euphrates basin. Atmos. Environ. 2020, 224, 117299. [Google Scholar] [CrossRef]
- Whitehead, P.G.; Wilby, R.L.; Battarbee, R.W.; Kernan, M.; Wade, A.J. A review of the potential impacts of climate change on surface water quality. Hydrol. Sci. J. 2009, 54, 101–123. [Google Scholar] [CrossRef]
- Zou, X.K.; Zhai, P.M. Relationship between vegetation coverage and spring dust storms over northern China. J. Geophys. Res. Atmos. 2004, 109. [Google Scholar] [CrossRef]
- Zhang, H.; Wu, C.; Chen, W.; Huang, G. Effect of urban expansion on summer rainfall in the Pearl River Delta, South China. J. Hydrol. 2019, 568, 747–757. [Google Scholar] [CrossRef]
- Dado, J.M.; Narisma, G.T. The effect of urban expansion in metro Manila on the southwest monsoon rainfall. Asia-Pac. J. Atmos. Sci. 2019, 58, 1–12. [Google Scholar] [CrossRef]
- Luo, M.; Lau, N.C. Urban expansion and drying climate in an urban agglomeration of East China. Geophys. Res. Lett. 2019, 46, 6868–6877. [Google Scholar] [CrossRef]


| Reference | Objectives | Data Sources | Algorithms | Results |
|---|---|---|---|---|
| [3] | Spatiotemporal change analysis of LULC and land surface temperature in the Suha watershed, north-western highlands of Ethiopia | Landsat 5 | SVM | Obtained high accurate LULC maps show the expansion of agricultural lands, barren lands, and built areas and the reduction of grazing and shrublands. |
| Landsat 7 | ||||
| Landsat 8 | ||||
| [8] | Performance evaluation of ML algorithms for LULC mapping | Landsat 8 | SVM | The outcomes indicated that SVM had the most accurate performance, and Sentinel 2 data was slightly more accurate than Landsat 8. |
| ANN | ||||
| Sentinel-2 | MLC | |||
| MD | ||||
| [9] | Monitoring LULC maps using different ML algorithms in the Munneru River basin, India | Landsat 8 Sentinel-2 | SVM | All classifiers performed with high accuracy, but RF outperformed both SVM and CART. |
| RF | ||||
| CART | ||||
| [10] | Detailed and automated classification of LULC using ML algorithms | MCD12Q1 Landsat 5 | RF | Classifiers were validated using data from US and Australia, and RF outperformed CART in both validations. |
| CART | ||||
| [11] | Quantifying spatiotemporal dynamics of LULC in Cox’s Bazar district, Bangladesh | Landsat 4 | RF | RF had highly accurate predictions. Vegetation cover and urban settlements expanded. Water bodies and bare lands were decreased. |
| Landsat 5 | ||||
| Landsat 8 | ||||
| [1] | Evaluation of ML classifiers for LULC mapping in the snow-fed Alaknanda River basin, north-west Himalayan region, India | Landsat 8 | RT | Validation results indicated that both RT and SVM algorithms generated good overall accuracy and performed more precisely than the MLC algorithm. |
| SVM | ||||
| MLC | ||||
| [12] | Long-time series high-quality and high-consistency land cover mapping based in the Hihe River basin | Landsat | RF | RF achieved an average precision of about 90% for estimating a long-time series LULC dataset. |
| ASTER | ||||
| [13] | Assessing the performance of ML algorithms for classifying LULC in a boreal landscape in south-central Sweden | Sentinel-2 | SVM | The highest accuracy was produced by SVM, closely followed by Xgboost, RF, and DNN. |
| RF | ||||
| Xgboost | ||||
| DNN | ||||
| [14] | LULC mapping with advanced ML classifiers in Shiraz City, Iran | Landsat 8 | SVM | DFMLP outperformed the other two algorithms for pixel-based and object-based Landsat 8 imagery classification. |
| CTree | ||||
| DFMLP | ||||
| [2] | Evaluation of ML algorithms for LULC classification for satellite observations | Landsat 4 | SVM | The accuracy assessment showed that all classifiers had similar accuracy levels with minor variation, but RF was the most accurate algorithm. |
| RF | ||||
| Landsat 5 | ANN | |||
| fuzzy ARTMAP | ||||
| Landsat 8 | SAM | |||
| MHD |
| Feature | Type | Mean Importance Weight | Selection | Feature | Type | Mean Importance Weight | Selection |
|---|---|---|---|---|---|---|---|
| Slope | M | 43.111 | True | Texture_shade | T | 25.838 | True |
| B | SB | 36.914 | True | SWIR 1 | SB | 25.776 | True |
| NDBI | SI | 35.369 | True | Aspect | M | 24.216 | False |
| BSI | SI | 34.832 | True | Texture_contrast | T | 24.025 | False |
| MNDWI | SI | 34.322 | True | Texture_dvar | T | 22.383 | False |
| NDVI | SI | 32.167 | True | Texture_corr | T | 21.882 | False |
| Texture_savg | T | 32.111 | True | Texture_idm | T | 21.824 | False |
| NIR | SB | 31.928 | True | Hillshade | M | 21.798 | False |
| Elevation | M | 31.610 | True | Texture_var | T | 21.129 | False |
| SWIR 2 | SB | 29.811 | True | Texture_imcorr1 | T | 17.162 | False |
| Texture_svar | T | 28.954 | True | Texture_dent | T | 10.376 | False |
| Texture_inertia | T | 28.890 | True | Texture_sent | T | 10.343 | False |
| Texture_diss | T | 27.843 | True | Texture_imcorr2 | T | 8.945 | False |
| R | SB | 27.032 | True | Texture_ent | T | 7.484 | False |
| G | SB | 26.987 | True | Texture_asm | T | 6.696 | False |
| Texture_prom | T | 26.973 | True | Texture_maxcorr | T | 0.000 | False |
| LULC Class | H0 | H1 | Trend Type | p Value |
|---|---|---|---|---|
| Water | Rejected | Accepted | No trend | 0.291 |
| Trees | Rejected | Accepted | Decreasing | 0.006 |
| Flooded vegetation | Accepted | Rejected | No trend | 0.291 |
| Crops | Accepted | Rejected | No trend | 0.117 |
| Built Area | Rejected | Accepted | Increasing | 0.000 |
| Bare ground | Accepted | Rejected | No trend | 0.908 |
| Rangeland | Accepted | Rejected | No trend | 0.422 |
Disclaimer/Publisher’s Note: The statements, opinions and data contained in all publications are solely those of the individual author(s) and contributor(s) and not of MDPI and/or the editor(s). MDPI and/or the editor(s) disclaim responsibility for any injury to people or property resulting from any ideas, methods, instructions or products referred to in the content. |
© 2023 by the authors. Licensee MDPI, Basel, Switzerland. This article is an open access article distributed under the terms and conditions of the Creative Commons Attribution (CC BY) license (https://creativecommons.org/licenses/by/4.0/).
Share and Cite
Al-Taei, A.I.; Alesheikh, A.A.; Darvishi Boloorani, A. Land Use/Land Cover Change Analysis Using Multi-Temporal Remote Sensing Data: A Case Study of Tigris and Euphrates Rivers Basin. Land 2023, 12, 1101. https://doi.org/10.3390/land12051101
Al-Taei AI, Alesheikh AA, Darvishi Boloorani A. Land Use/Land Cover Change Analysis Using Multi-Temporal Remote Sensing Data: A Case Study of Tigris and Euphrates Rivers Basin. Land. 2023; 12(5):1101. https://doi.org/10.3390/land12051101
Chicago/Turabian StyleAl-Taei, Azher Ibrahim, Ali Asghar Alesheikh, and Ali Darvishi Boloorani. 2023. "Land Use/Land Cover Change Analysis Using Multi-Temporal Remote Sensing Data: A Case Study of Tigris and Euphrates Rivers Basin" Land 12, no. 5: 1101. https://doi.org/10.3390/land12051101