Article

Geographically and Ontologically Oriented Scoping of a Dry Valley and Its Spatial Characteristics Analysis: The Case of the Three Parallel Rivers Region

1
School of Natural Resources, Faculty of Geographical Science, Beijing Normal University, Beijing 100875, China
2
State Key Laboratory of Earth Surface Processes and Resource Ecology, Faculty of Geographical Science, Beijing Normal University, Beijing 100875, China
3
Academy of Plateau Science and Sustainability, Qinghai Normal University, Xining 810008, China
4
School of Geographical Science, Qinghai Normal University, Xining 810008, China
*
Author to whom correspondence should be addressed.
Land 2023, 12(6), 1235; https://doi.org/10.3390/land12061235
Submission received: 12 May 2023 / Revised: 13 June 2023 / Accepted: 13 June 2023 / Published: 16 June 2023

Abstract

:
A dry valley is a special landscape type that is formed by the combined effect of climate and topography. Accurately defining the scope of a dry valley and knowledge of its spatial distribution characteristics can provide data support for relevant studies in the region. Starting from natural ontological characteristics and formation mechanisms, we constructed a geographical ontological model of dry valleys through an analysis of concepts related to the dry valley and combined GIS technology and methods to accurately define the scope and analyze the spatial characteristics of the dry valleys in the Three Parallel Rivers Region (DVT). Our results show that: (1) The geographically and ontologically oriented method developed to define the scope of the dry valley has a high accuracy, with an overall accuracy of 92.3% and a kappa coefficient of 0.84, therefore it can provide a better mechanism for defining the scope of a dry valley on a large scale. (2) The total area and total length of the DVT are 6147.1 km2 and 2125.3 km, respectively. The dry valleys in this region are mainly located in the Tibet Autonomous Region and in the Sichuan and Yunnan provinces in China. (3) The terrain in the DVT is precipitous, and areas with slopes greater than 25° account for 70% of the total area of the dry valleys. The DVT area of sunny aspects (north, northeast, and northwest aspects) is larger than that of shady aspects (south, southeast, and southwest aspects), and the land cover is mainly grassland with a desert substrate. The result of our study can provide data support for further in-depth research in related fields of dry valleys.

1. Introduction

A dry valley refers to a dry and warm valley ecosystem that occurs in the lower parts of certain deep valleys in longitudinal valley regions surrounded by a relatively humid environment [1]. The long and narrow arid lots along the big rivers comprise the center of the regional society, economy, and culture in Southwest China and are important channels and chokepoints for regional transportation and information [2]. With continuous socioeconomic development, the limited land area of dry valleys cannot support concentrated population growth [2,3,4]. The relative concentration of the population and inappropriate land use have exacerbated issues among the population, resources, and the environment [5]. In addition, the ecosystems of dry valleys are sensitive to small changes in climate [6], and the aridification that accompanies global warming has exacerbated problems such as environmental degradation and resource depletion [7]. The sensitive and fragile ecological environments of dry valleys seriously affect the development of local society and livelihood [8]. In recent years, soil quality assessment [9], soil and water conservation [10], and regional ecosystem restoration [11] have been the foci of research in these dry valleys. Despite the importance of ecosystems in the dry valleys, there is a lack of accurate data regarding the scope of dry valleys.
In the early days of dry valley research, fieldwork was the primary method for defining the scope of dry valleys; however, this was limited by the level of technological development. For instance, Zhang et al. [8] drew firsthand the scope of dry valleys in the Hengduan Mountains after the first comprehensive survey to the Qinghai–Tibetan Plateau. However, traditional two-dimensional flat maps and two-dimensional geographical information are not sufficient to meet today’s needs. Remote sensing can provide stable and accurate simultaneous observations of large areas and has been widely used in research related to land use and vegetation monitoring; moreover, it can provide new opportunities to define the scope of dry valleys. Recently, visual interpretation based on remote sensing images has become the main method for defining the scope of dry valleys in small and even large regions, and scholars have mostly outlined the scope of dry valleys based on a priori knowledge or field surveys. Yang et al. [7] and Yuan et al. [12] mapped the scope of dry valleys in the upper Minjiang River and Sichuan Province, respectively, based on thematic map data; Fan et al. [13] delineated the extent of arid river valleys in Southwest China based on multi-year Google Earth images taken during autumn and winter. However, this method has a number of disadvantages, such as being time consuming, having low operational efficiency, and relying on human subjectivity. To prevent the abovementioned limitations, supervised classification based on machine learning has been applied in research on the scope of dry valleys, which uses the spectral information of pixels. For instance, Ding et al. [14] extracted the dry valley boundaries in the upper Minjiang River based on the supervised classification method and quantitatively determined the scope of its boundary. Nevertheless, the researchers have ignored the geographical factors of dry valleys and, coupled with the “same object with different spectra, different spectrum with the same spectrum” phenomenon, the problem of misclassifying dry valleys is common. Some scholars have also tried to begin with relevant geographical environment factors, such as the combination of rule-based delineations such as the digital elevation model (DEM), climate, and soil conditions [15], or have defined the scope of dry valleys based on hydrological conditions by comparing changes in the vegetation areas before and after the wet season [16].
There is no uniform method for defining the scope of a dry valley. In the upper Minjiang River basin, the area measurements calculated by Yang et al. [7], Ding et al. [14], and Zheng et al. [15] at relatively concentrated time points were 1230.8 km2, 1389.2 km2, and 705.6 km2, respectively, with a difference of 525.2 km2 in area between the maximum and minimum values of the areas. The uncertainty of these types of research results could be due to the use of different technical methods. Therefore, it is crucial to construct a standard scientific and methodological system for scoping dry valleys in order to ensure the accuracy and comparability of the research results.
The Three Parallel Rivers Region (TPRR) is located in the core area of the longitudinal valley zone of the Hengduan Mountains on the southeastern edge of the Qinghai–Tibetan Plateau [16]; many dry valleys are located here. The area can be regarded as being representative of the dry valleys in the Hengduan Mountains in terms of topography, geomorphology, and climate conditions. Extensive studies have been carried out on the dry valley boundaries of the Minjiang and Dadu River in the Hengduan Mountains in the past; however, few have focused on the dry valleys in the Sallween, Lancang, and Jinshajiang basins. Based on the current lack of accurate data on dry valleys in the Three Parallel Rivers Region (DVT), this project chose the TPRR as the study area with the following principal objectives: (1) Starting from the natural ontological characteristics and formation mechanism, we analyzed the concepts related to dry valleys in order to construct a geographical ontological model of dry valleys and combined the technology and methods of GIS to accurately define the scope of dry valleys. (2) We aimed to understand the spatial distribution of DVT. (3) We compared and analyzed the topography and land cover characteristics of dry valleys in different basins. Our results are intended to provide basic data to support research on dry valleys and other related fields.

2. Materials and Methodology
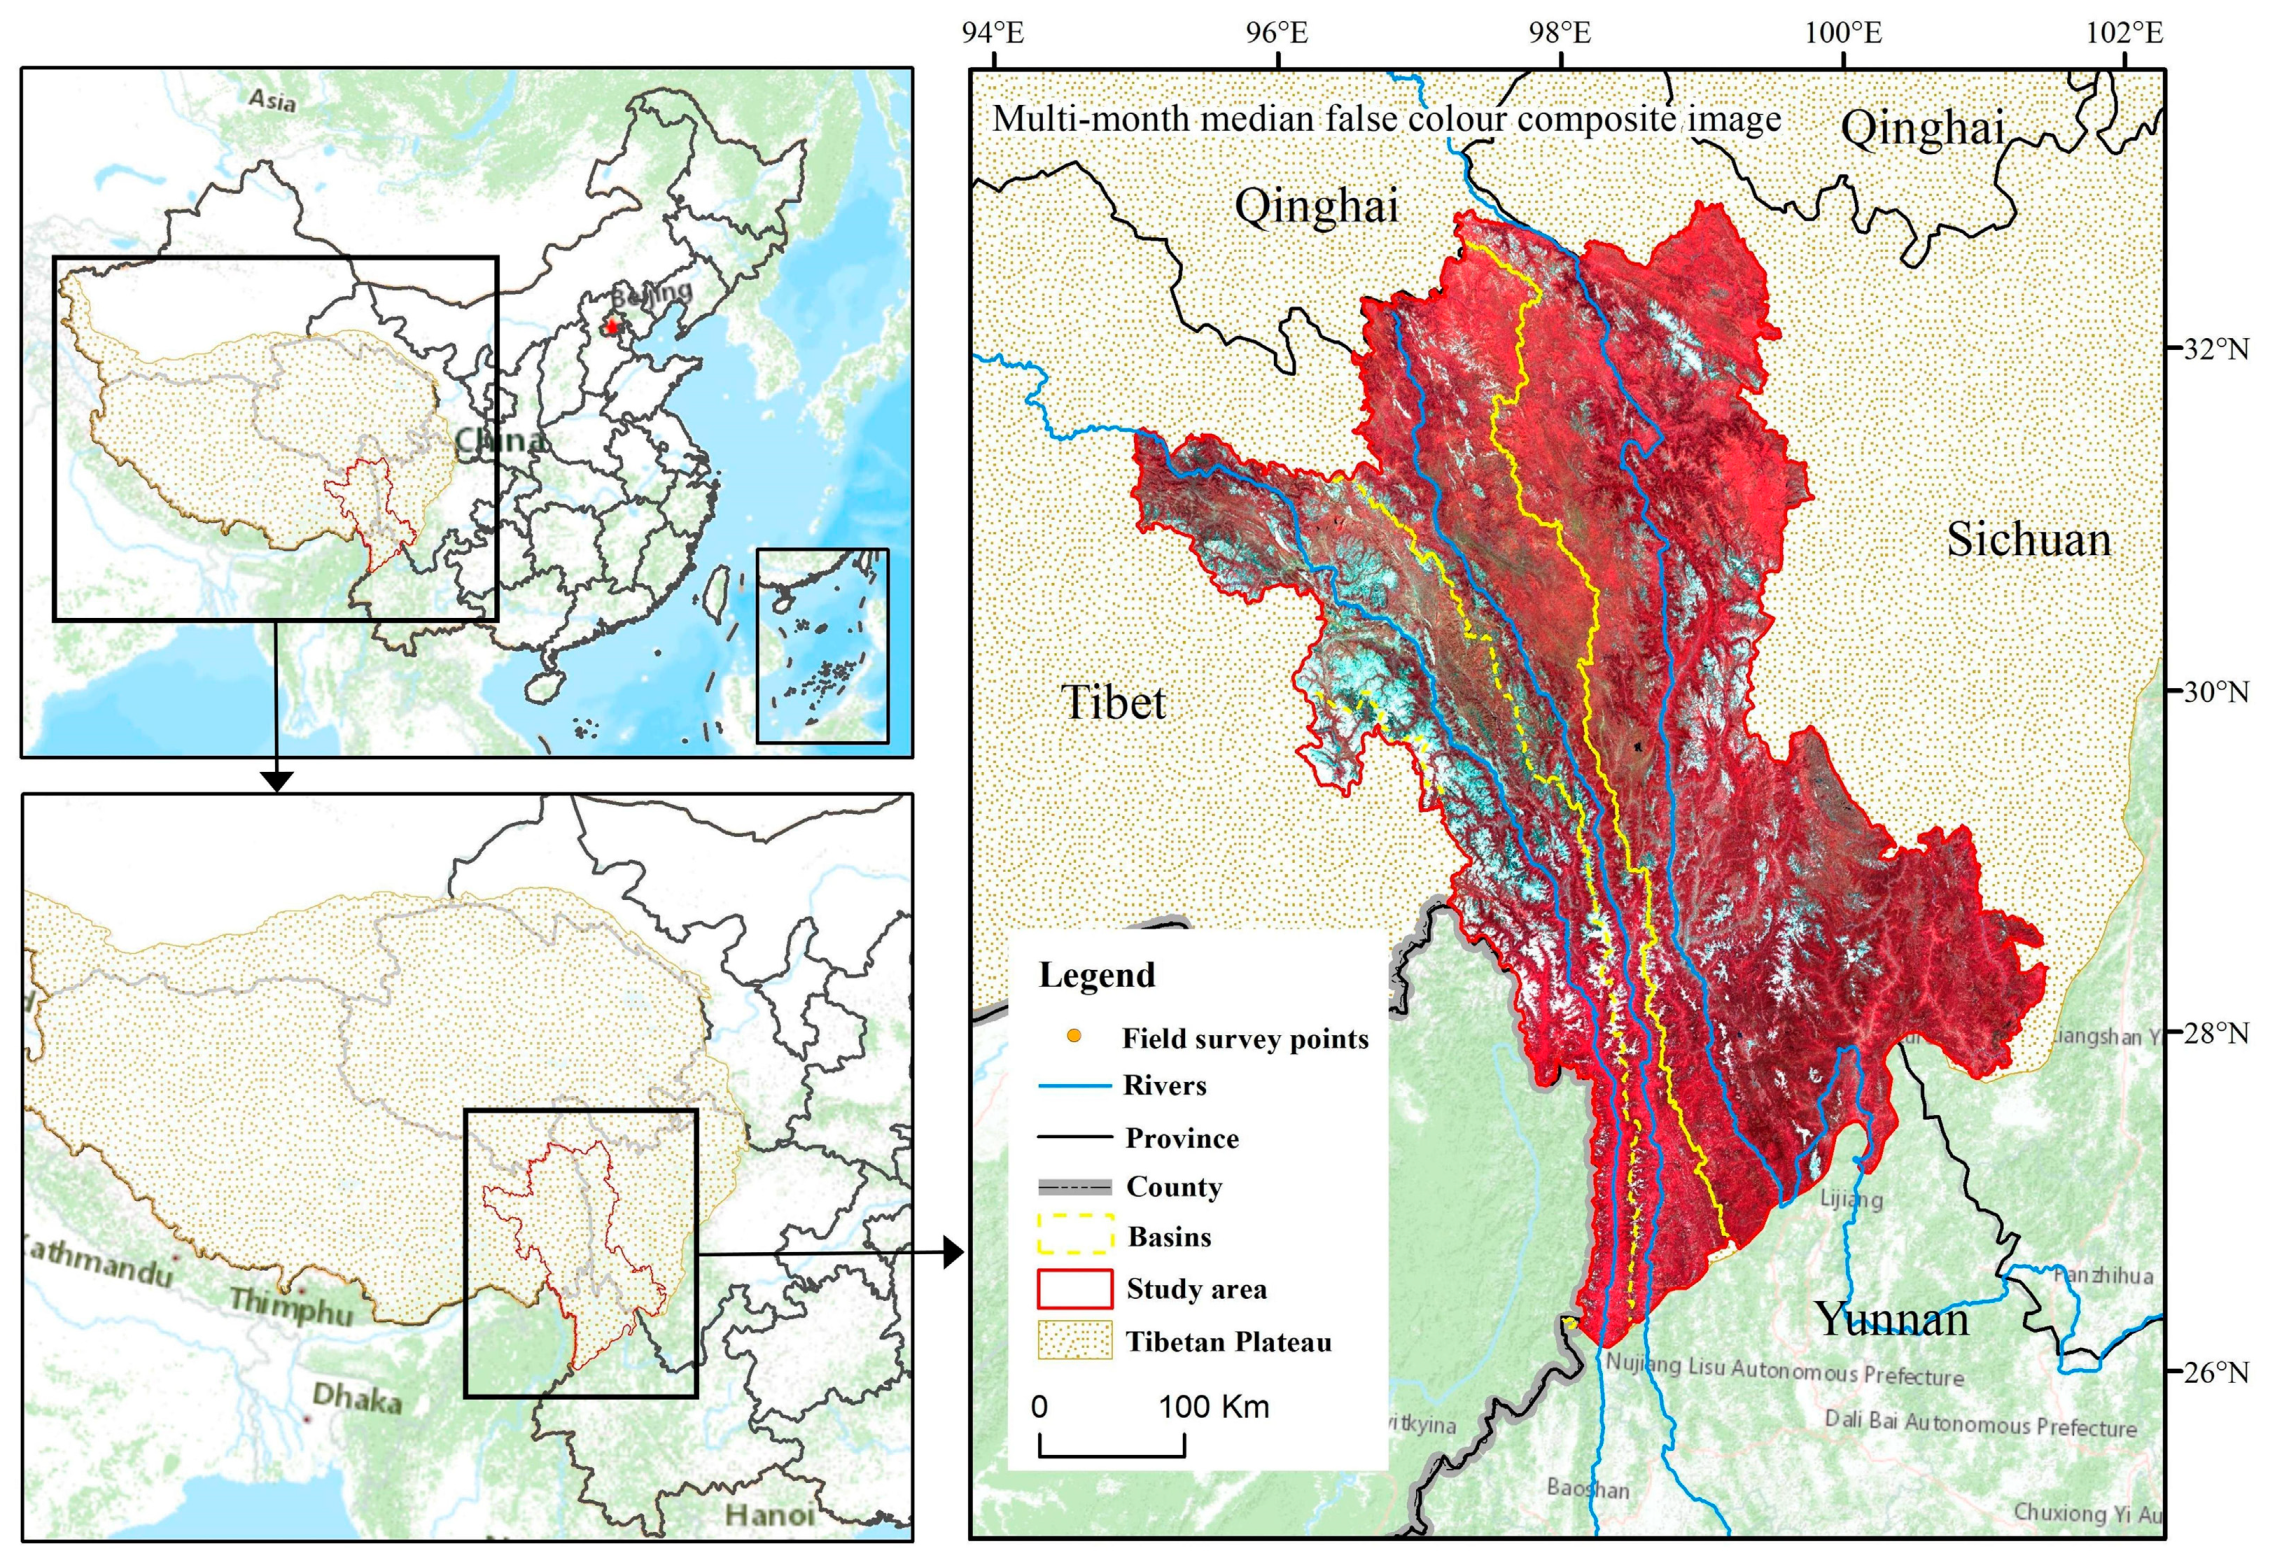
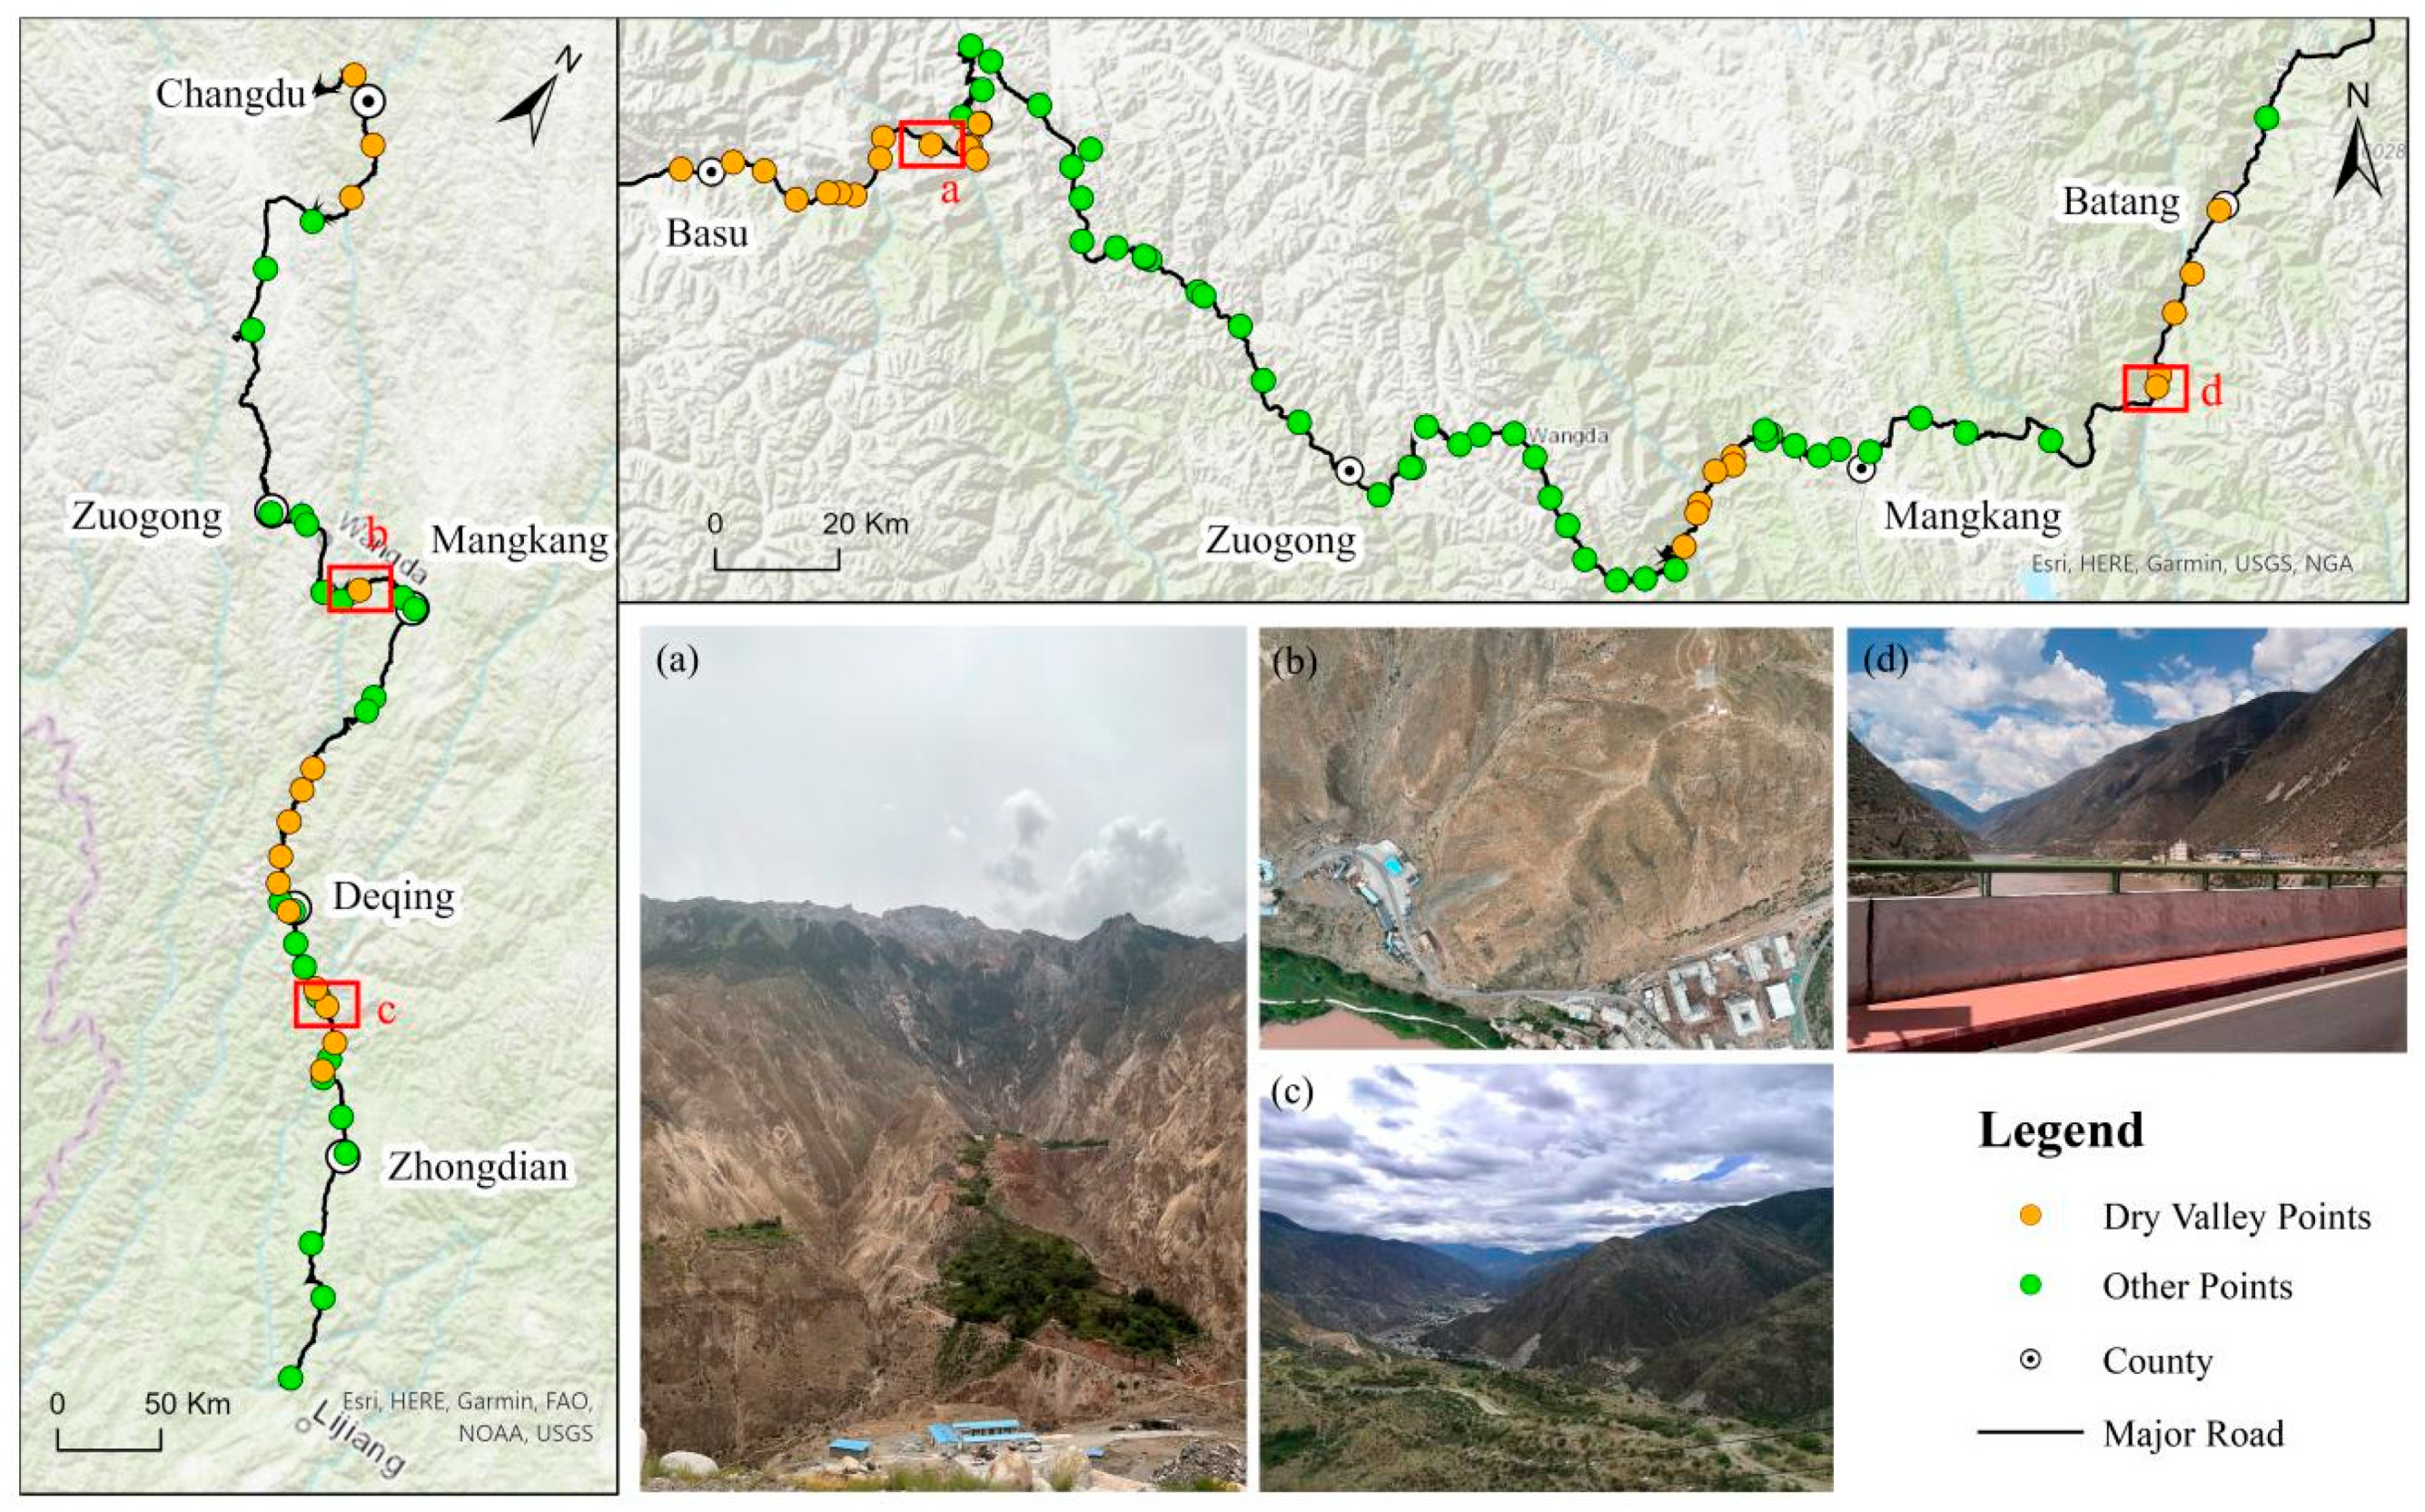
2.1. Study Area

The TPRR is located in the southwestern part of the Qinghai–Tibet Plateau, bordering the Qinghai provincial boundary in the north; Muli, Sichuan in the east; Lijiang, Yunnan in the south; and the China–Myanmar border in the west (Figure 1). In this work, the division of the study area was conducted based on Chinese county boundary data, watershed data, and Qinghai–Tibet Plateau boundary data provided by the National Qinghai–Tibet Plateau Data Center (https://data.tpdc.ac.cn/zh-hans, accessed on 6 October 2022). Coupled with the existing references, we ultimately determined the extent of the TPRR [17,18].
Influenced by the southwest and southeast monsoons, the regional climate environment is complex and diverse, with cold, temperate, and subtropical climate zones from north to south. Summers are rainy, and winters are dry. There is a clear distinction between dry and rainy season climates. There are parallel mountains, rivers, and valleys, and the vertical elevation difference is nearly 6000 m [19]. The alignment of the Hengduan Mountains minimizes the influence of monsoons, which, combined with the “burning wind effect”—a strong, dry, and warm wind blowing downslope from the mountains—causes the region’s valleys to be extremely hot and dry [20]. The complex climate types and geographical environment cause the vegetation distribution to exhibit obvious vertical zonality.

2.2. Data Source and Processing

2.2.1. Remote Sensing Data

During the study, all remote sensing data were collected and processed online through the Google Earth Engine (GEE) platform, including: the Landsat-8 satellite carrying the Operational Land Imager (OLI), the Sentinel-2 A/B satellite carrying the Multi-Spectral Instrument (MSI); and the Sentinel-1 satellite’s C-band, providing radar echo information to extract surface features. Each band of the three remote sensing data sources is shown in Table 1.
The Landsat-8 and Sentinel-2 images we used were geometrically corrected and atmospherically corrected using Collection-2 Level-2 and Sentinel-2 Level-2A surface reflectance products, respectively. With the GEE platform’s computing and data management mechanisms, users did not have to be overly concerned about resolution matching between different data sources [21]. Sentinel series data had a spatial resolution of 10 m. Therefore, Landsat data were automatically resampled to 10 m in the GEE backend to match this resolution.
“QA_PIXEL” and “QA60” represented the pixel quality assessment bands in the Landsat-8 and Sentinel-2 surface reflectance products, respectively. The QA_PIXEL mask band of Landsat-8 in GEE [22] was used to label the pixels of the clouded image and thus to perform the masking operations. For Sentinel-2 data, the QA60 mask band [23] was used to shield cirrus and other types of clouds. None of the image elements labeled as clouds were involved in the subsequent calculations. All quality-qualified pixels were uniformly rectified to calculate the explanatory variables required in the subsequent classification. After vertical polarization, online Sentinel-1 data were used to call the preprocessing module to complete the calibration of orbital parameters, thermal noise removal, radiation calibration, and surface geometry correction [24]. In addition, we applied a smoothing filter to reduce the scattering effect of the SAR images.

2.2.2. Topographic and Geographical Environment Factor Data

The DEM data were obtained from the NASADEM dataset with a spatial resolution of 30 m. The NASADEM dataset (https://cmr.earthdata.nasa.gov, accessed on 12 March 2023) was spliced, clipped, and calculated using the GEE cloud platform to obtain the elevation, slope, and aspect data of the study area. The river data were obtained from the Chinese watershed and river network dataset provided by the Resource and Environmental Science and Data Center of the Chinese Academy of Sciences (https://www.resdc.cn, accessed on 5 January 2023).
The climate data, with a spatial resolution of 1 km, were based on the monthly average temperature dataset of China and provided by the National Geoscience Data Center (http://www.geodata.cn, accessed on 3 January 2023). The annual precipitation and annual potential evapotranspiration data of China, with a spatial resolution of 30 m, were provided by the Digital Mountain and Remote Sensing Application Center, Institute of Mountain Research, Chinese Academy of Sciences (http://www.imde.ac.cn, accessed on 3 January 2023).
Soil data with a spatial resolution of 1 km were obtained from the spatial distribution of soil type data from China provided by the Resource and Environmental Science and Data Center of the Chinese Academy of Sciences (https://www.resdc.cn, accessed on 3 January 2023).

2.2.3. Other Data

Land cover data were obtained from the annual dataset of land use and cover (CLCD; https://doi.org/10.5194/essd-2021-7, accessed on 15 March 2023) for 2020, hosted by Wuhan University, based on the GEE [25]. The spatial resolution of this dataset is 30 m, and it has an overall classification accuracy of 79.31%, which has achieved good auxiliary effects in other research [26,27].
The field survey points were sampled during the field work along the G214–Yunnan–Tibet route and the G318–Sichuan–Tibet route in July 2020–2021. The major sampling process included obtaining the latitude and longitude of each sampling point with a handheld high-precision GPS. We also measured the temperature and humidity at each point and obtained information on vegetation types and took photographs of the nearby landscape for subsequent verification. The distribution of field survey sites is shown in Figure 2.

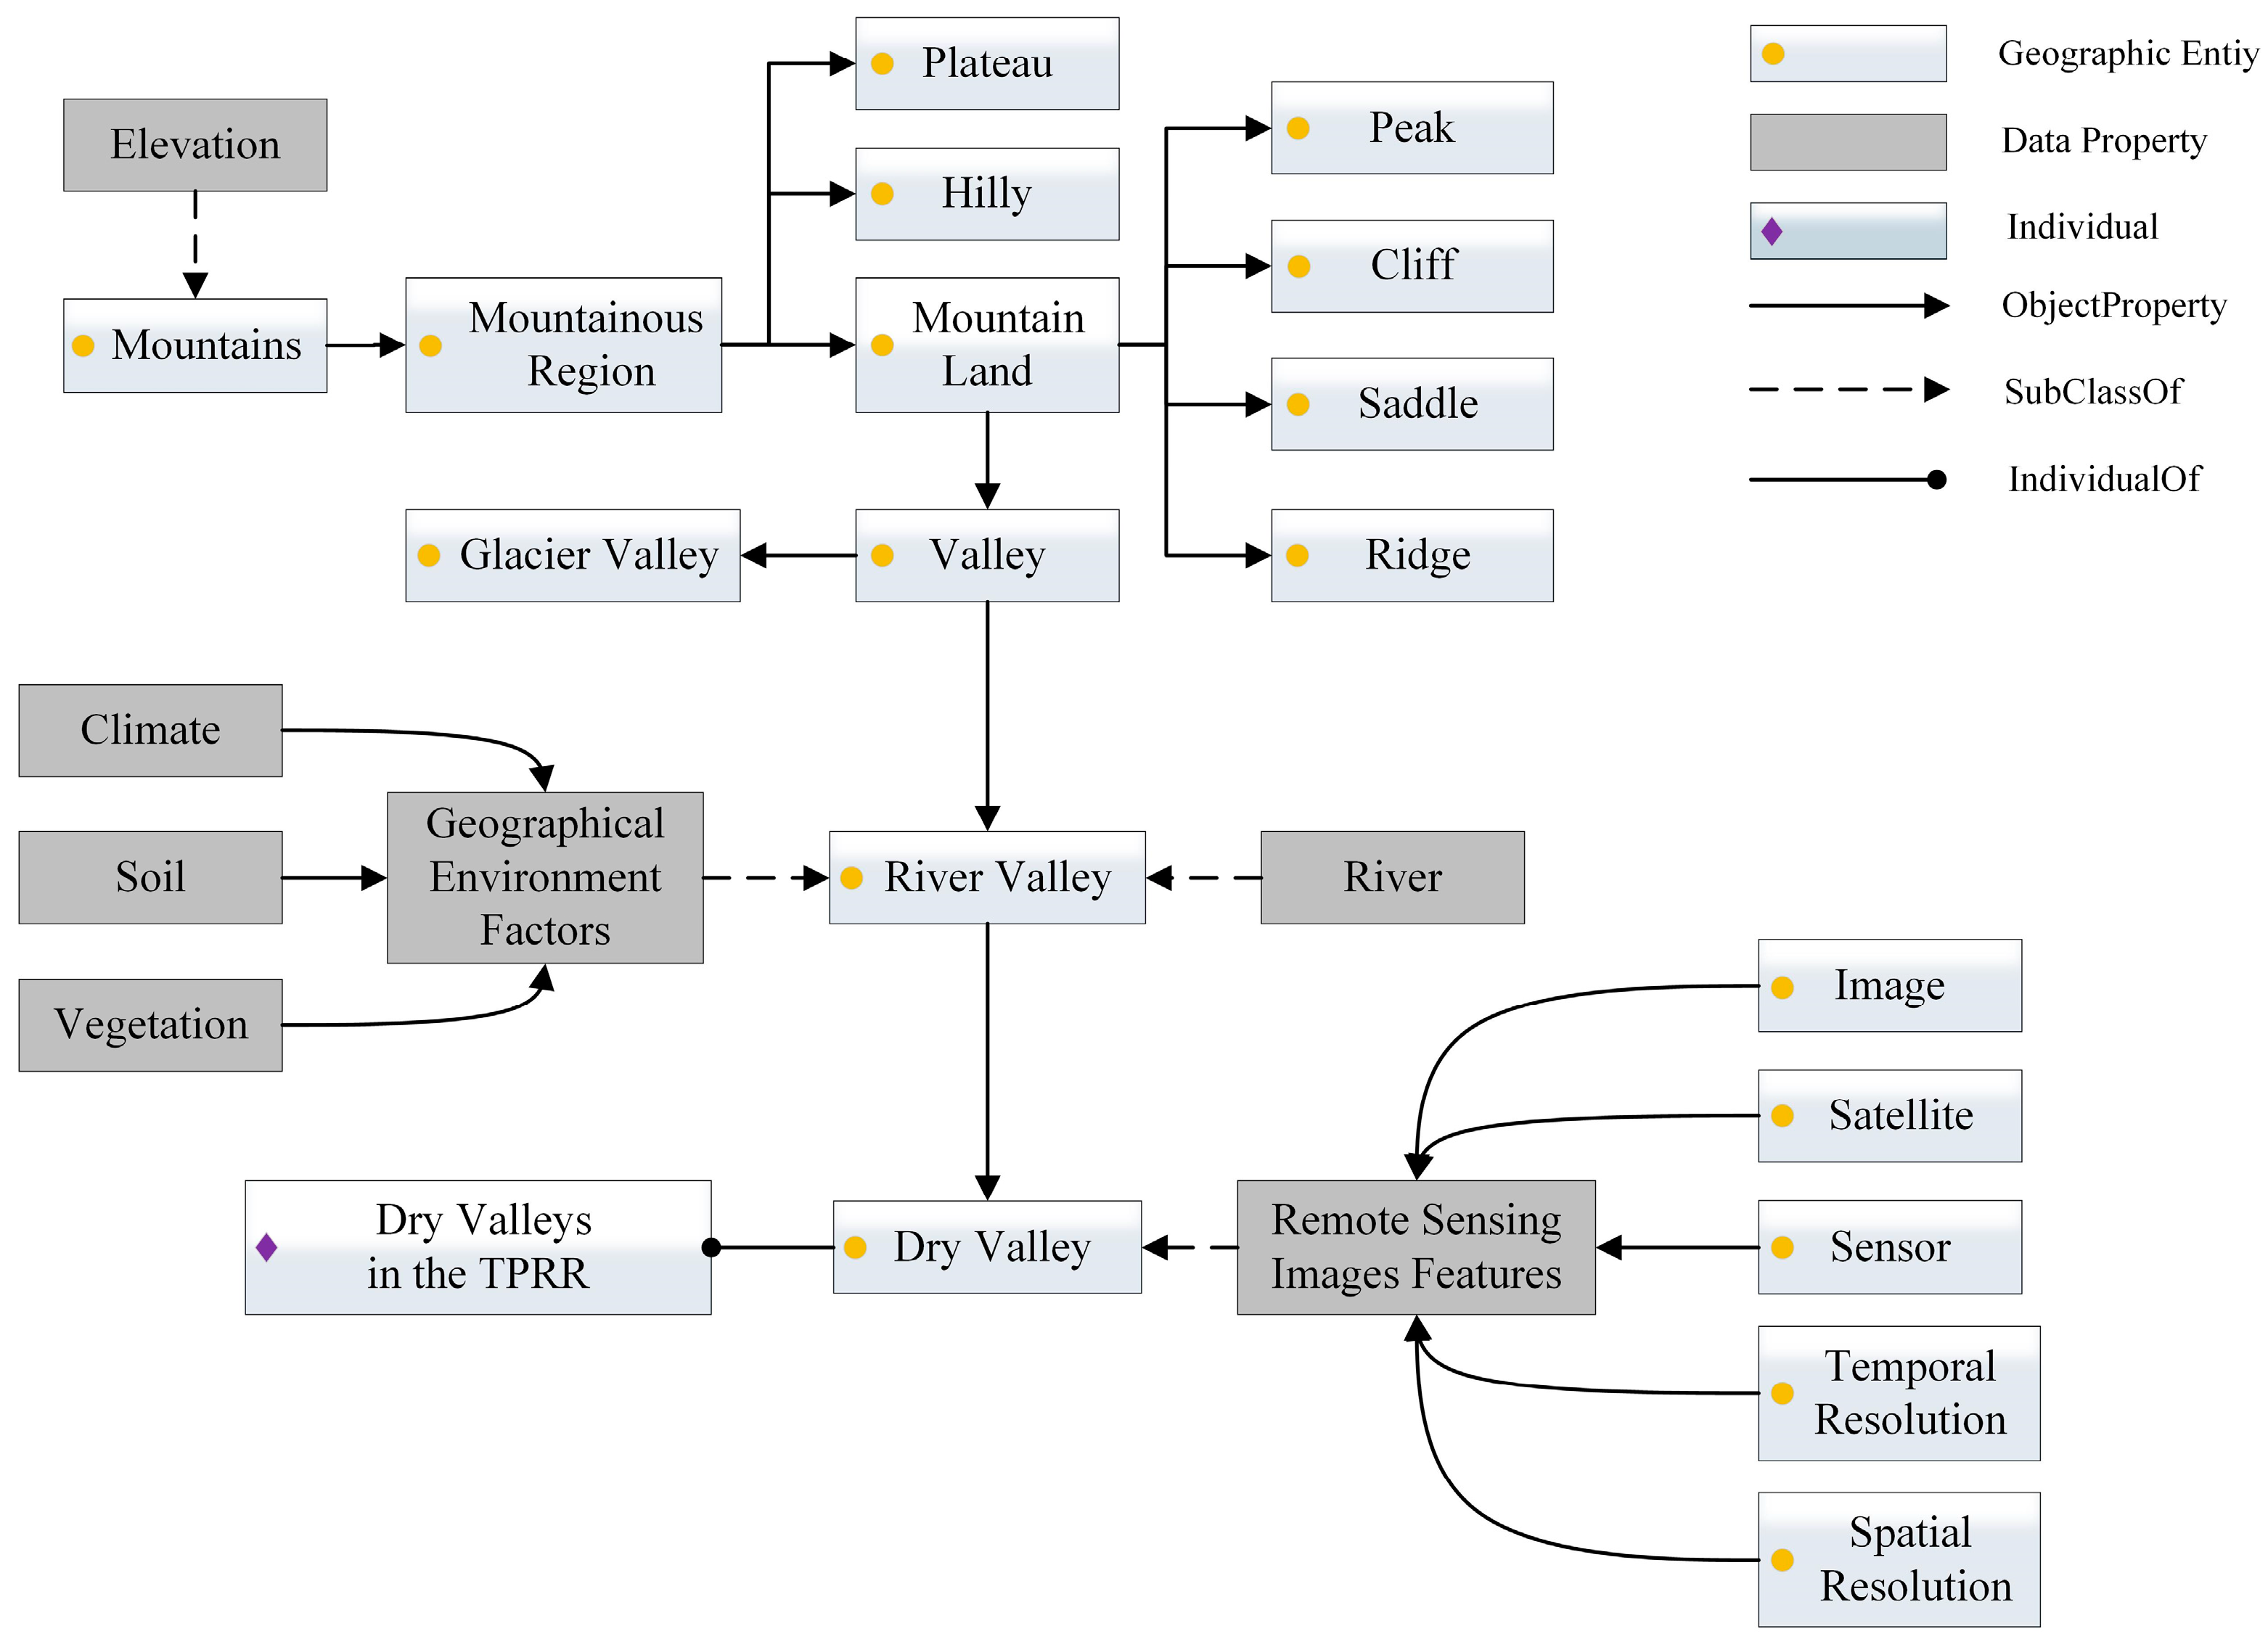
2.3. Construction of a Dry Valley Ontology

2.3.1. Ontology Logical Structure Selection

Previous studies of dry valley mapping have lacked clear concepts and definitions [8]. To overcome this limitation, unified subject-specific language is needed to effectively organize and normatively express dry valley concepts [28]. Geographical ontology is a theory and method of applying ontology to geographical entities, abstracting relevant knowledge, information, and data in the field of geography into objects, composing systems according to certain semantic relationships, and establishing conceptual models for formal expression through conceptual processing and clear definitions [29]. In different study areas and research directions, geographical ontologies may have different logical structures. We followed the quintuple structure proposed by Zhan et al. [30] to represent the dry valley ontology (O):
O = < C, R, P, PR, I >
where C is the concept set, which represents the set of relevant geographical entity concepts in the dry valley domain; R is the relationship set, which represents the semantic relationships between relevant geographical entities; P represents properties, which are the properties characteristic of the dry valley ontology; PR represents the constraints of the properties, which are the types and value ranges of the properties; I is individual, which is the number of instances in the geographical ontology model.

2.3.2. Dry Valley Ontology Modeling

The difficulty in constructing a dry valley ontology is how to determine the geographical relationships between multiple complex factors in the domain and the semantic relationships between concepts [31]. Geographical ontology provides a more rigorous logic and mechanism for geographical cognition and conceptual expression [32]; therefore, the principles and methods of geographical ontology can be used to construct a dry valley ontology. Based on the identification and analysis of dry valley concepts, we used Protege 5.5.0 to complete the semantic analysis and logical reasoning of dry valley concepts using the OWL language and obtained the dry valley ontology model (Figure 3).

2.4. Determination of Dry Valley Properties

The dry valley ontology model shows that the geographical entities “mountains”, “mountainous region”, “mountain land”, “valley”, “river valley”, and “dry valley” exist with respective father–child relationships. This means that dry valleys inherit the properties and spatial characteristics of their father entities and have properties such as topography that are relevant to geographical environmental factors and remote sensing image features.

2.4.1. Arid Landscape Extraction

Acquiring high-resolution satellite imagery of the study area is challenging due to the persistent cloud cover in the TPRR. A combination of synthetic aperture radar (SAR) has shown promising results in cloudy areas because of its excellent penetration of clouds, haze, and dust [33,34]. Currently, Landsat and Sentinel-2 A/B are the most widely used medium–high spatial resolution optical products. The synergistic use of these two sources significantly increases the opportunity for timely and cloud-free surface observations [24]. Thus, we reduced the impact of cloud pollution in the TPRR through the fusion of optical and microwave data. Optical images from Landsat-8, Sentinel-2, and SAR images from Sentinel-1 were combined into an image stack from which we created optical pseudo-color composite images and SAR images, both of which were multi-month median composites for the annual vegetation growing season (from May to September). Based on the field experience, we collected as many training samples as possible using visual interpretation. Subsequently, a sufficient number of pixels was randomly selected from the sample set to construct feature matrices according to a 1:1 ratio of arid region to non-arid region samples. It should be emphasized that, since rivers are part of river valleys, the classification process also categorized water bodies such as rivers as arid landscapes. We used a total of 14 explanatory variables, including six optical bands from Landsat-8 and Sentinel-2, two multi-month composite SAR bands, four spectral indices, and auxiliary variables such as elevation and slope (Table 2).
The random forest classifier constructs mutually independent decision trees to efficiently process a large number of input indicators by iteratively selecting a finite subset of conditions during the training process [35,36]. This method allows for faster and more reliable classification results without significantly increasing the computational complexity [37]. For the high-dimensional indicator scenario presented by the multiple remote sensing data, in this study, random forest was more suitable than other remote sensing classifiers; thus, we adopted this classifier based on the GEE platform to complete the extraction of arid landscapes in the TPRR.

2.4.2. Terrain and Geographical Environment Factor Indicator Extraction

Data from the Sallween, Lancang, and Jinsha rivers and their major tributaries were collected through the watershed and river network dataset. We then generated buffer zones extending 1, 1.5, 3, 3.5, and 5 km from the center of the river. After comparison, we found that a buffer zone of 3.5 km could cover the distribution range of the dry river valleys.
We calculated the average temperature in January and July from 1991 to 2020 based on the monthly average temperature dataset of China to obtain the average temperature indicators of the coldest and warmest months in the TPRR, respectively.
The aridity index (AI) is a comprehensive index for evaluating the dryness of a region. We used the inverse of the wetness index proposed by Mao et al. [38]. to express the dry and wet climate division of the Qinghai–Tibetan Plateau. The formula to calculate the AI is as follows:
A I = E T 0 P
where P is the annual precipitation (mm) and ET0 is the annual potential evapotranspiration (mm).
The spatial distribution of soil type data of China was clipped to obtain the soil type data in the TPRR. Then, we merged the soil subtypes into soil macrotypes to characterize the soils of the dry valleys.
The normalized difference vegetation index (NDVI) is one of the most important indicators for measuring the quality of vegetation growth [39], which is significantly and positively correlated with fractional vegetation cover (FVC) [40]. Here, we used the NDVI combined with the dimidiate pixel model to estimate the FVC. The formula for calculating FVC is as follows:
F V C = N D V I N D V I s o i l N D V I v e g N D V I s o i l
where N D V I s o i l is the NDVI value of a bare soil area and N D V I v e g is the NDVI value of an area with vegetation coverage. N D V I v e g and N D V I s o i l take the maximum and minimum values within the confidence interval for a given confidence level; the values of N D V I v e g and N D V I s o i l correspond to cumulative frequencies of 95% and 5%, respectively [41]. Referring to the relevant standards of the FVC classification of the Qinghai–Tibet Plateau [42], the vegetation cover of the TPRR is classified into five classes: low vegetation cover (<30% of the total), medium–low vegetation cover (30–45%), medium vegetation cover (45–60%), medium–high vegetation cover (60–75%), and high vegetation cover (>75%).

2.5. Determination of Dry Valley Constraints

As an individual dry valley area, the DVTs have a constraint axiom that distinguishes them from other geographic entities. That is, their range of distribution is determined by the attribute value range. Some scholars have conducted research on dry valleys in the Hengduan Mountains and have obtained results related to their formation, climate, vegetation, and soil [2,8,15,17,30,43,44,45,46]. Based on expert knowledge, we determined the constraints on the relevant properties of the DVT, as shown in Table 3.

2.6. Accuracy Verification

In the binary classification task, the verification samples were divided into true positive (TP), true negative (TN), false positive (FP), and false negative (FN) categories. This study used a confusion matrix to measure the accuracy of the results according to overall accuracy (OA), producer accuracy (PA), user accuracy (UA), and kappa coefficient (Kappa) [47,48] (Equations (4)–(7)).
O A = T P + T N T P + E P + T N + F N
P A = T P T P + F N
UA = T P T P + F P
Kappa = p 0 p e 1 p e
p 0 = O A
p e = ( T P + F P ) × ( T P + F N ) + ( T N + F N ) × ( F P + T N ) ( T P + F P + T N + F N ) 2

2.7. Define the Scope of DVT

According to the determined property constraints of the DVT, all data were unified into a raster format and normalized, namely, 1 for compliance and 0 for non-compliance. In this study, all raster data were resampled to 30 m × 30 m in resolution.
Based on the dry valley ontological model and the related spatial analysis function of ArcGIS10.6, we overlayed the DEM, geographical environmental factors, and image features to obtain the scope of the DVT. Since the overlay analysis was based on the calculation of pixels, it was inevitable that there would be abnormal plaques. To ensure the accuracy of the extent of the DVT, we masked the outcome raster using distance-to-river data to reduce the influence from anomalous plaques. Figure 4 shows the main steps taken in defining the scope of dry valleys in this study.

3. Results

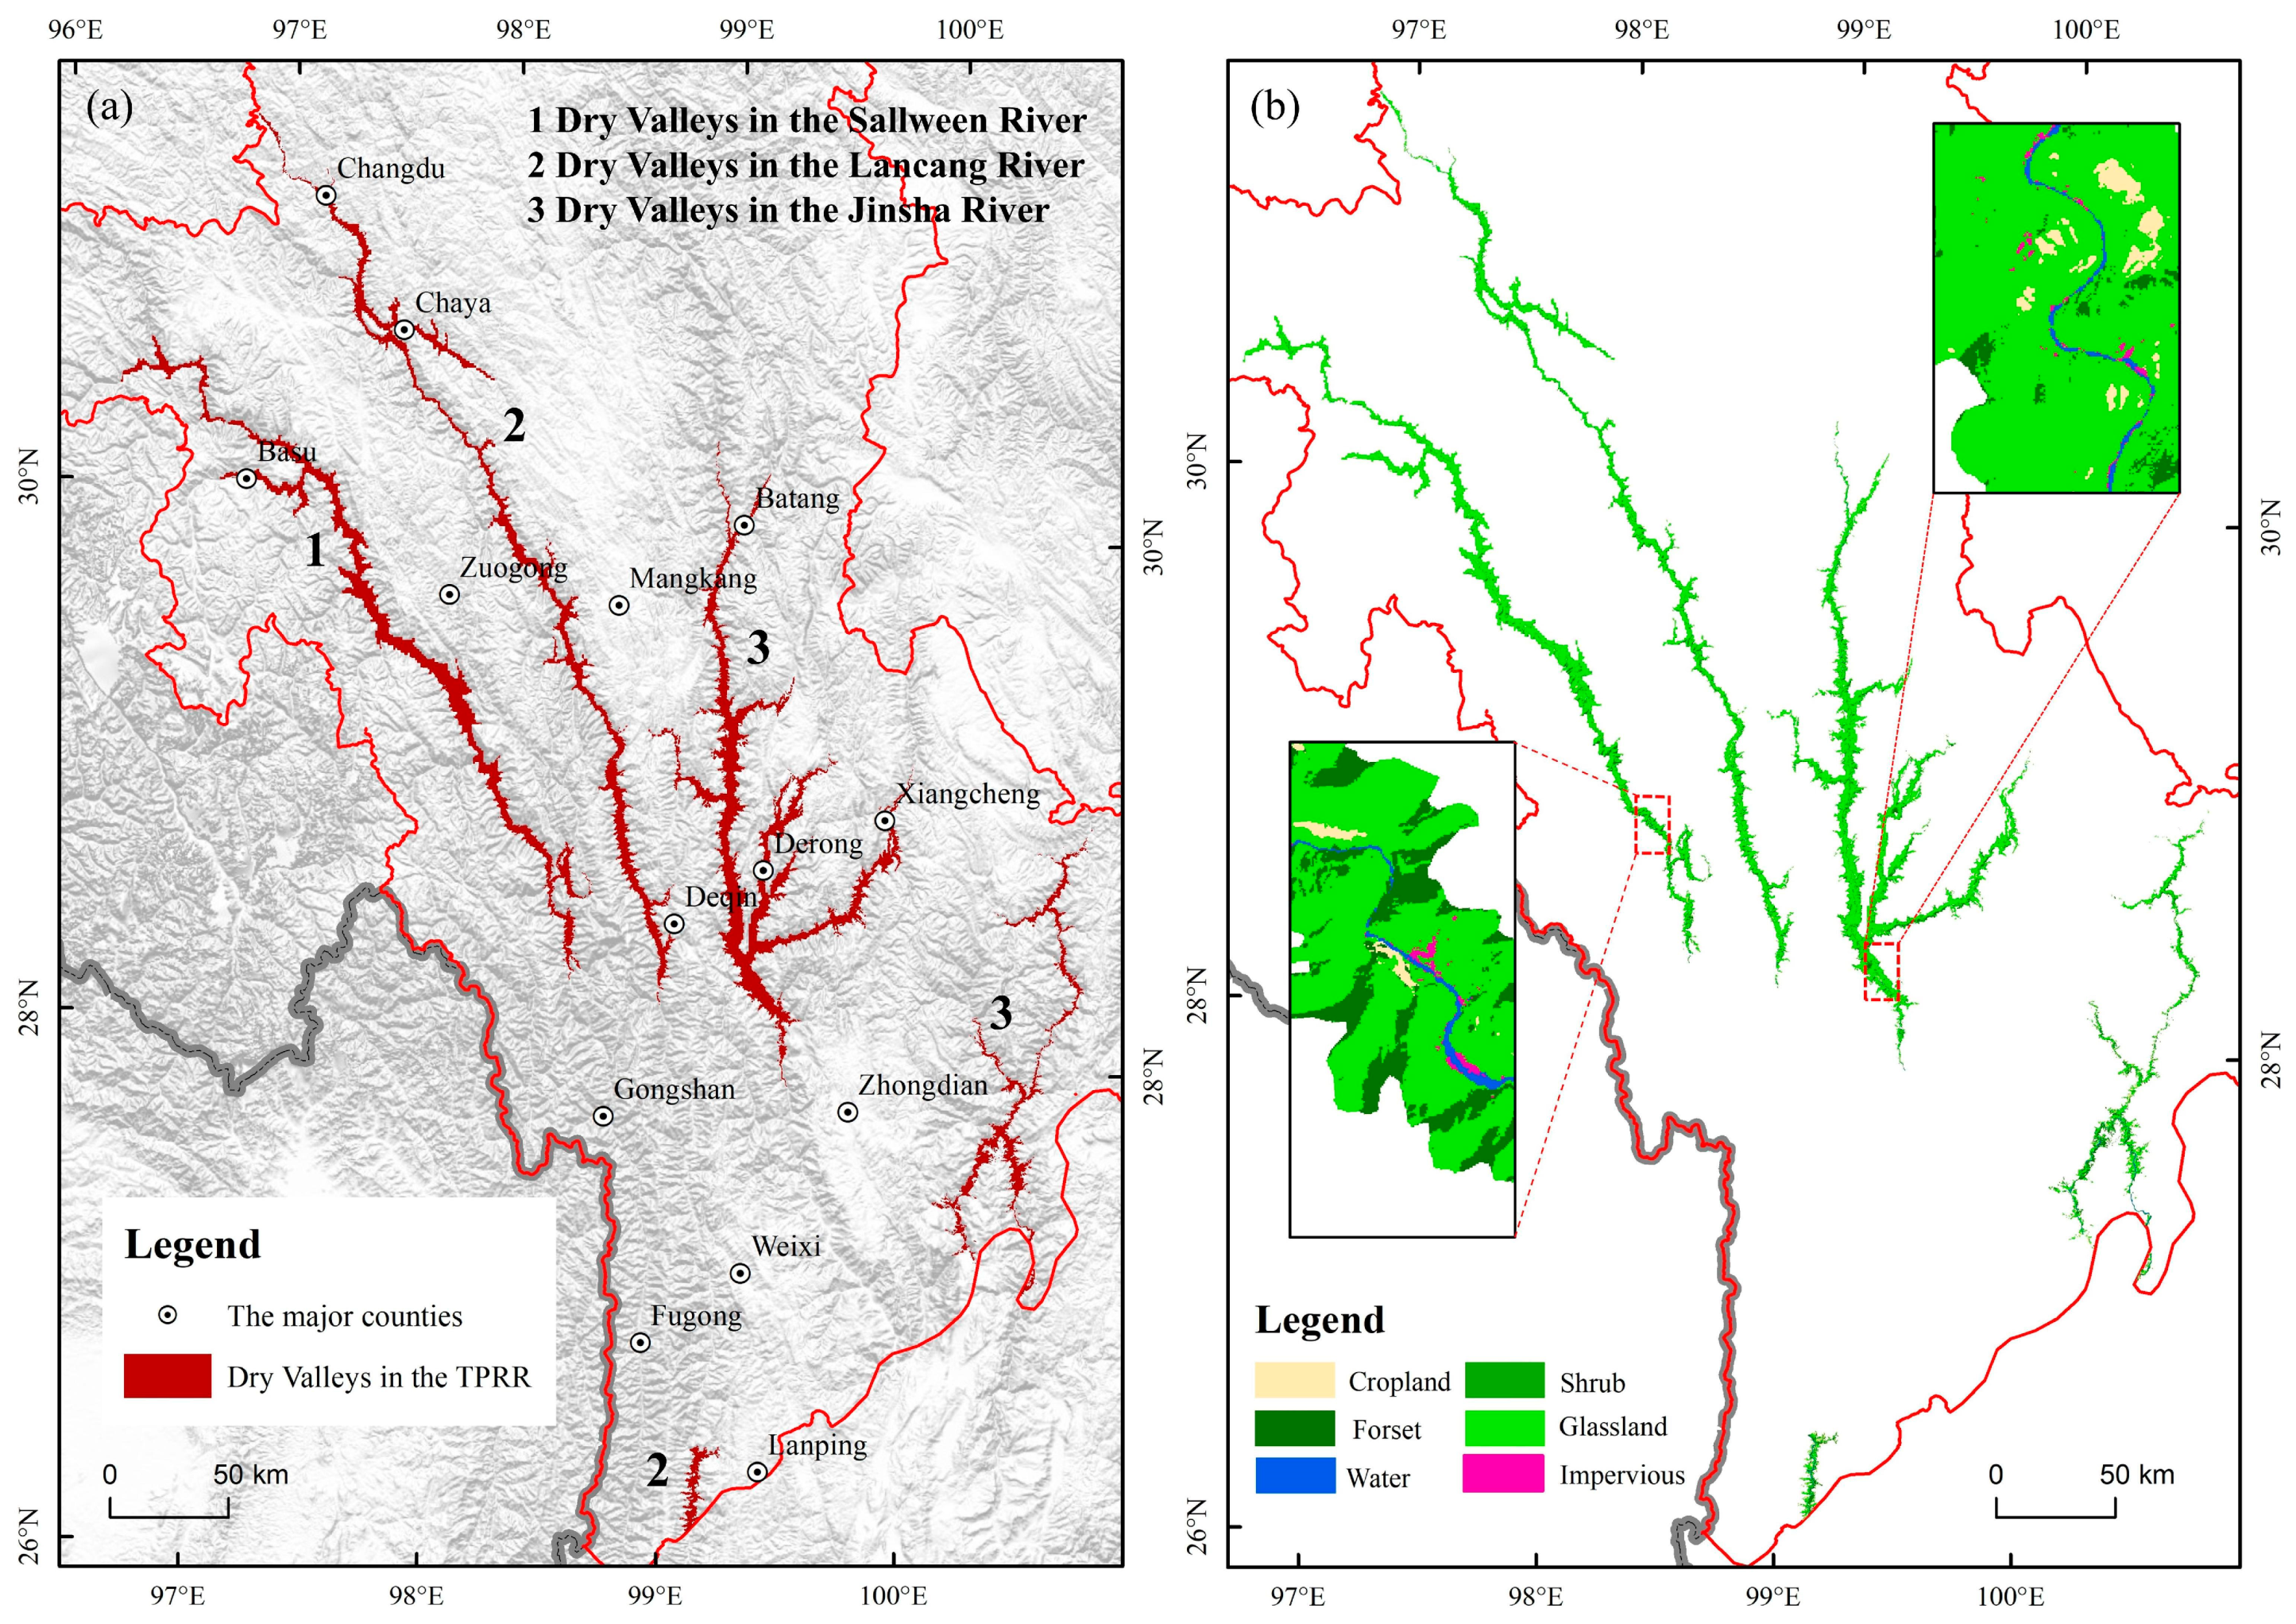
3.1. Spatial Distribution of DVT

The DVT is located within a latitude of 26°10′59″–31°25′06″ N and a longitude of 96°19′34″–100°42′04″ E (Figure 5a). The DVT spans from the Angqu River, a tributary of the Lancang River in Changdu, in the north, to the Yingpan section of the Lancang River in Lamping in the south, as well as from the upper reaches of the Sallween River in Basu in the west to the Wuliang River, a tributary of the Jinsha River in Muli, in the east. It involves 3 provincial administrative divisions, 7 prefecture administrative divisions, and 19 county administrative divisions in the Tibet Autonomous Region, Yunnan Province, and Sichuan Province (Table 4). The total area of the DVT is about 6147.1 km2, and the total length is 2125.3 km. Among the dry valleys in this region, the dry valley in the Jinsha River (DVJ) was found to have the largest area (2874.4 km2) and the longest length (925.5 km).
The boundary length of the dry valleys is inconsistent with their area distribution. The DVJ’s boundaries are complex, with long and relatively tortuous boundaries due to the distribution of the Jinsha River dry valley and its many tributaries. Although the area of the dry valley in the Sallween River (DVS) is comparable with that of the dry valley in the Lancang River (DVL), with a difference of only 5.3 km2, the length of the DVS, is much less than that of the DVL, indicating that its boundary is more regular.

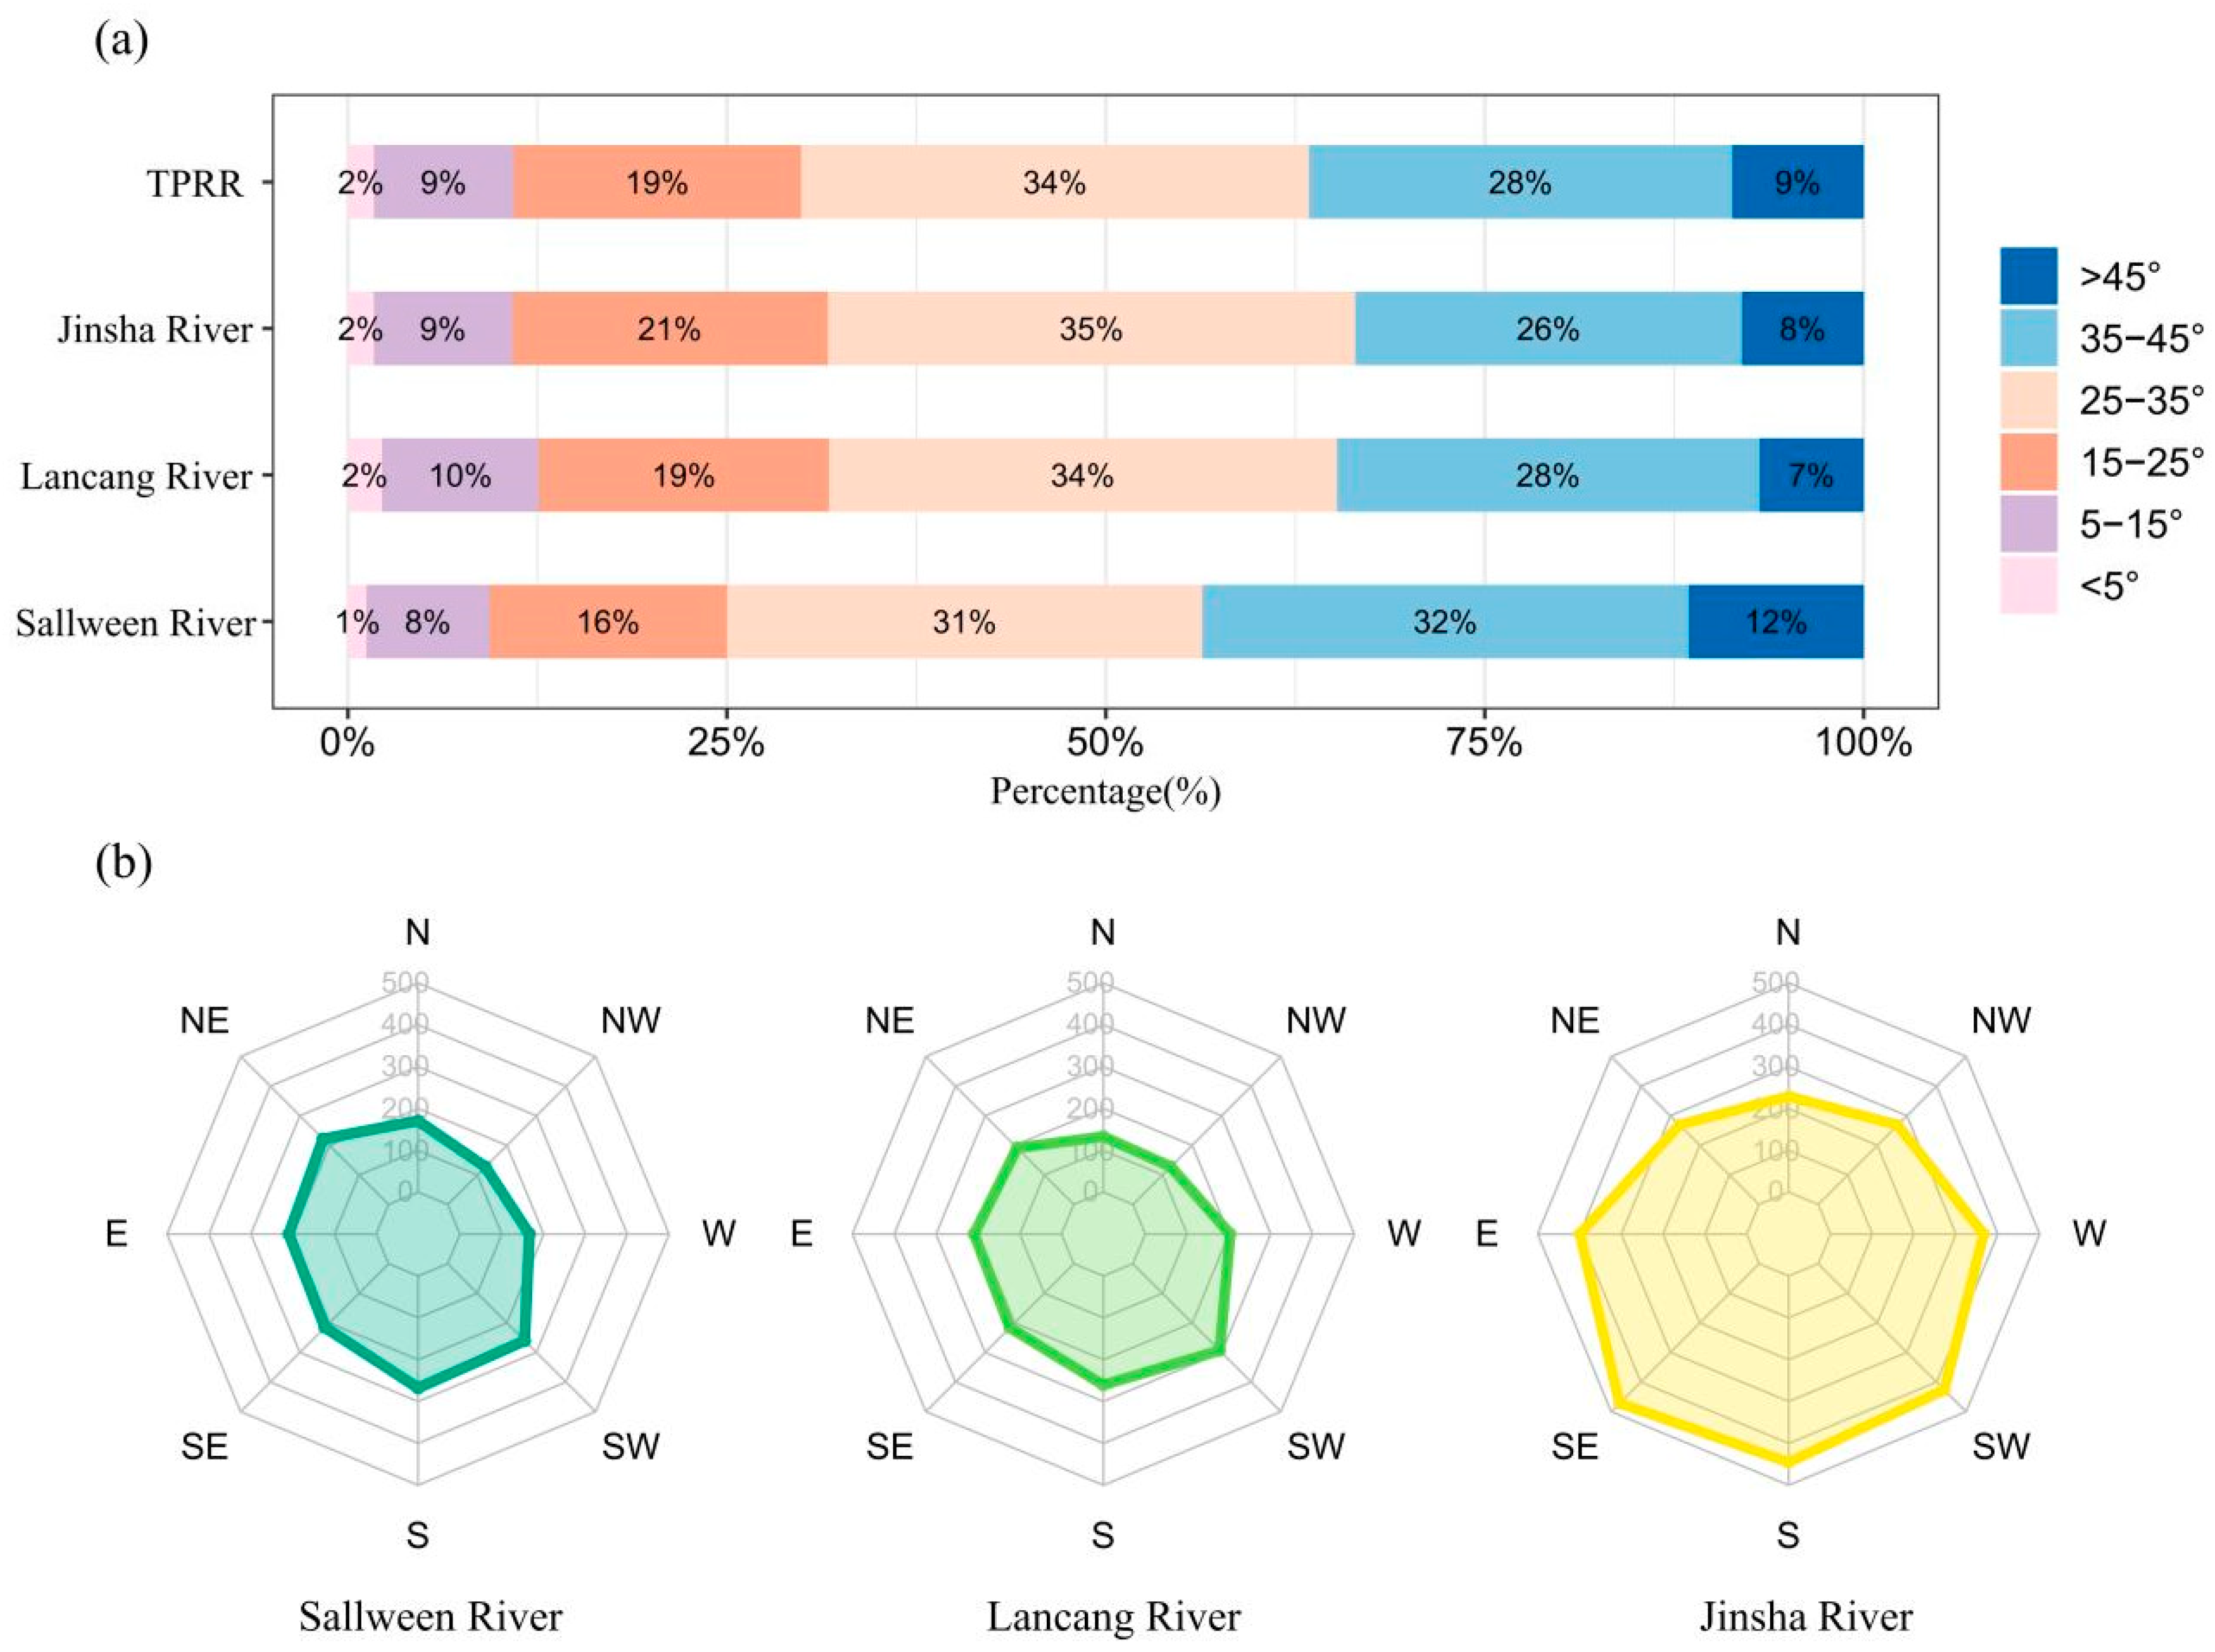
3.2. Topography and Land Cover Characteristics of DVT

Slopes greater than 25° account for 75% of the total area of the DVT (Figure 6a). The distribution of dry valley slopes in each basin is consistent, with steep slopes and sharp slopes dominating the area. Among them, the DVS has the smallest distribution area of flat slopes and the largest distribution area of sharp and dangerous slopes, which shows that the DVS has the most treacherous terrain.
Figure 6b shows that the area of sunny aspects (north, northeast, and northwest aspects) is larger than that of shady aspects (south, southeast, and southwest aspects) in the dry valley of each basin. In terms of aspect, the distribution area of the south and southwest aspects in the DVT is larger, accounting for 15.9% and 16.0% of the total area, respectively, whereas the distribution area of north and northwest aspects is smaller, accounting for 8.7% and 8.5% of the total area, respectively. In terms of the basin, the sunny aspects of the DVJ are the most widely distributed, accounting for 60% of the total area of the DVJ. The aspect distribution characteristics of the DVS and DVL are relatively consistent, with a larger distribution area in the southwest and southeast aspects and a smaller distribution area in the northeast and southwest aspects.
The land cover of the DVT is mainly grassland (Figure 5b and Table 5), which accounts for 82.6% of the total area. Shrubs and forests cover account for 13.4% of the total area of the DVT, mainly in the central part of the dry valley as well as in some marginal regions; surface water, including rivers, account for approximately 2% of the total area. Settlements and croplands cover less than 3% due to the complex climatic and topographic conditions of the dry valley. Combined with fieldwork, we found that the dry valley is mainly a desert substrate, where unique dominant vegetation types—drought-tolerant grasses or savanna shrub grasses—developed and where the overall vegetation cover is low. This is the result of the long-term adaptation of the vegetation to the local arid habitat. These shrubs and grasses are distributed in intermittent bands on the valley slopes and gradually transition into forests as the altitude increases, presenting a vegetation zone partition phenomenon in the landscape, that is, the existence of inverted vegetation belts. This is determined by the coupling gradient of various environmental factors such as “moisture” and “temperature” in the area. Town and rural settlements are mainly distributed sporadically along the second terraces of river valleys, mostly in the DVJ and DVL and less so in the DVS (Table 5). This is related to the steep topography of the DVS. Among all the basins, the DVS has the largest area with slopes greater than 25°; these types of slopes cover 75% of the total area of the DVS. Overall, the long and narrow parcels combined with the steep topography of the alpine and gorge regions make the dry valley unsuitable for farming; therefore, the proportion of settlements and croplands is small.

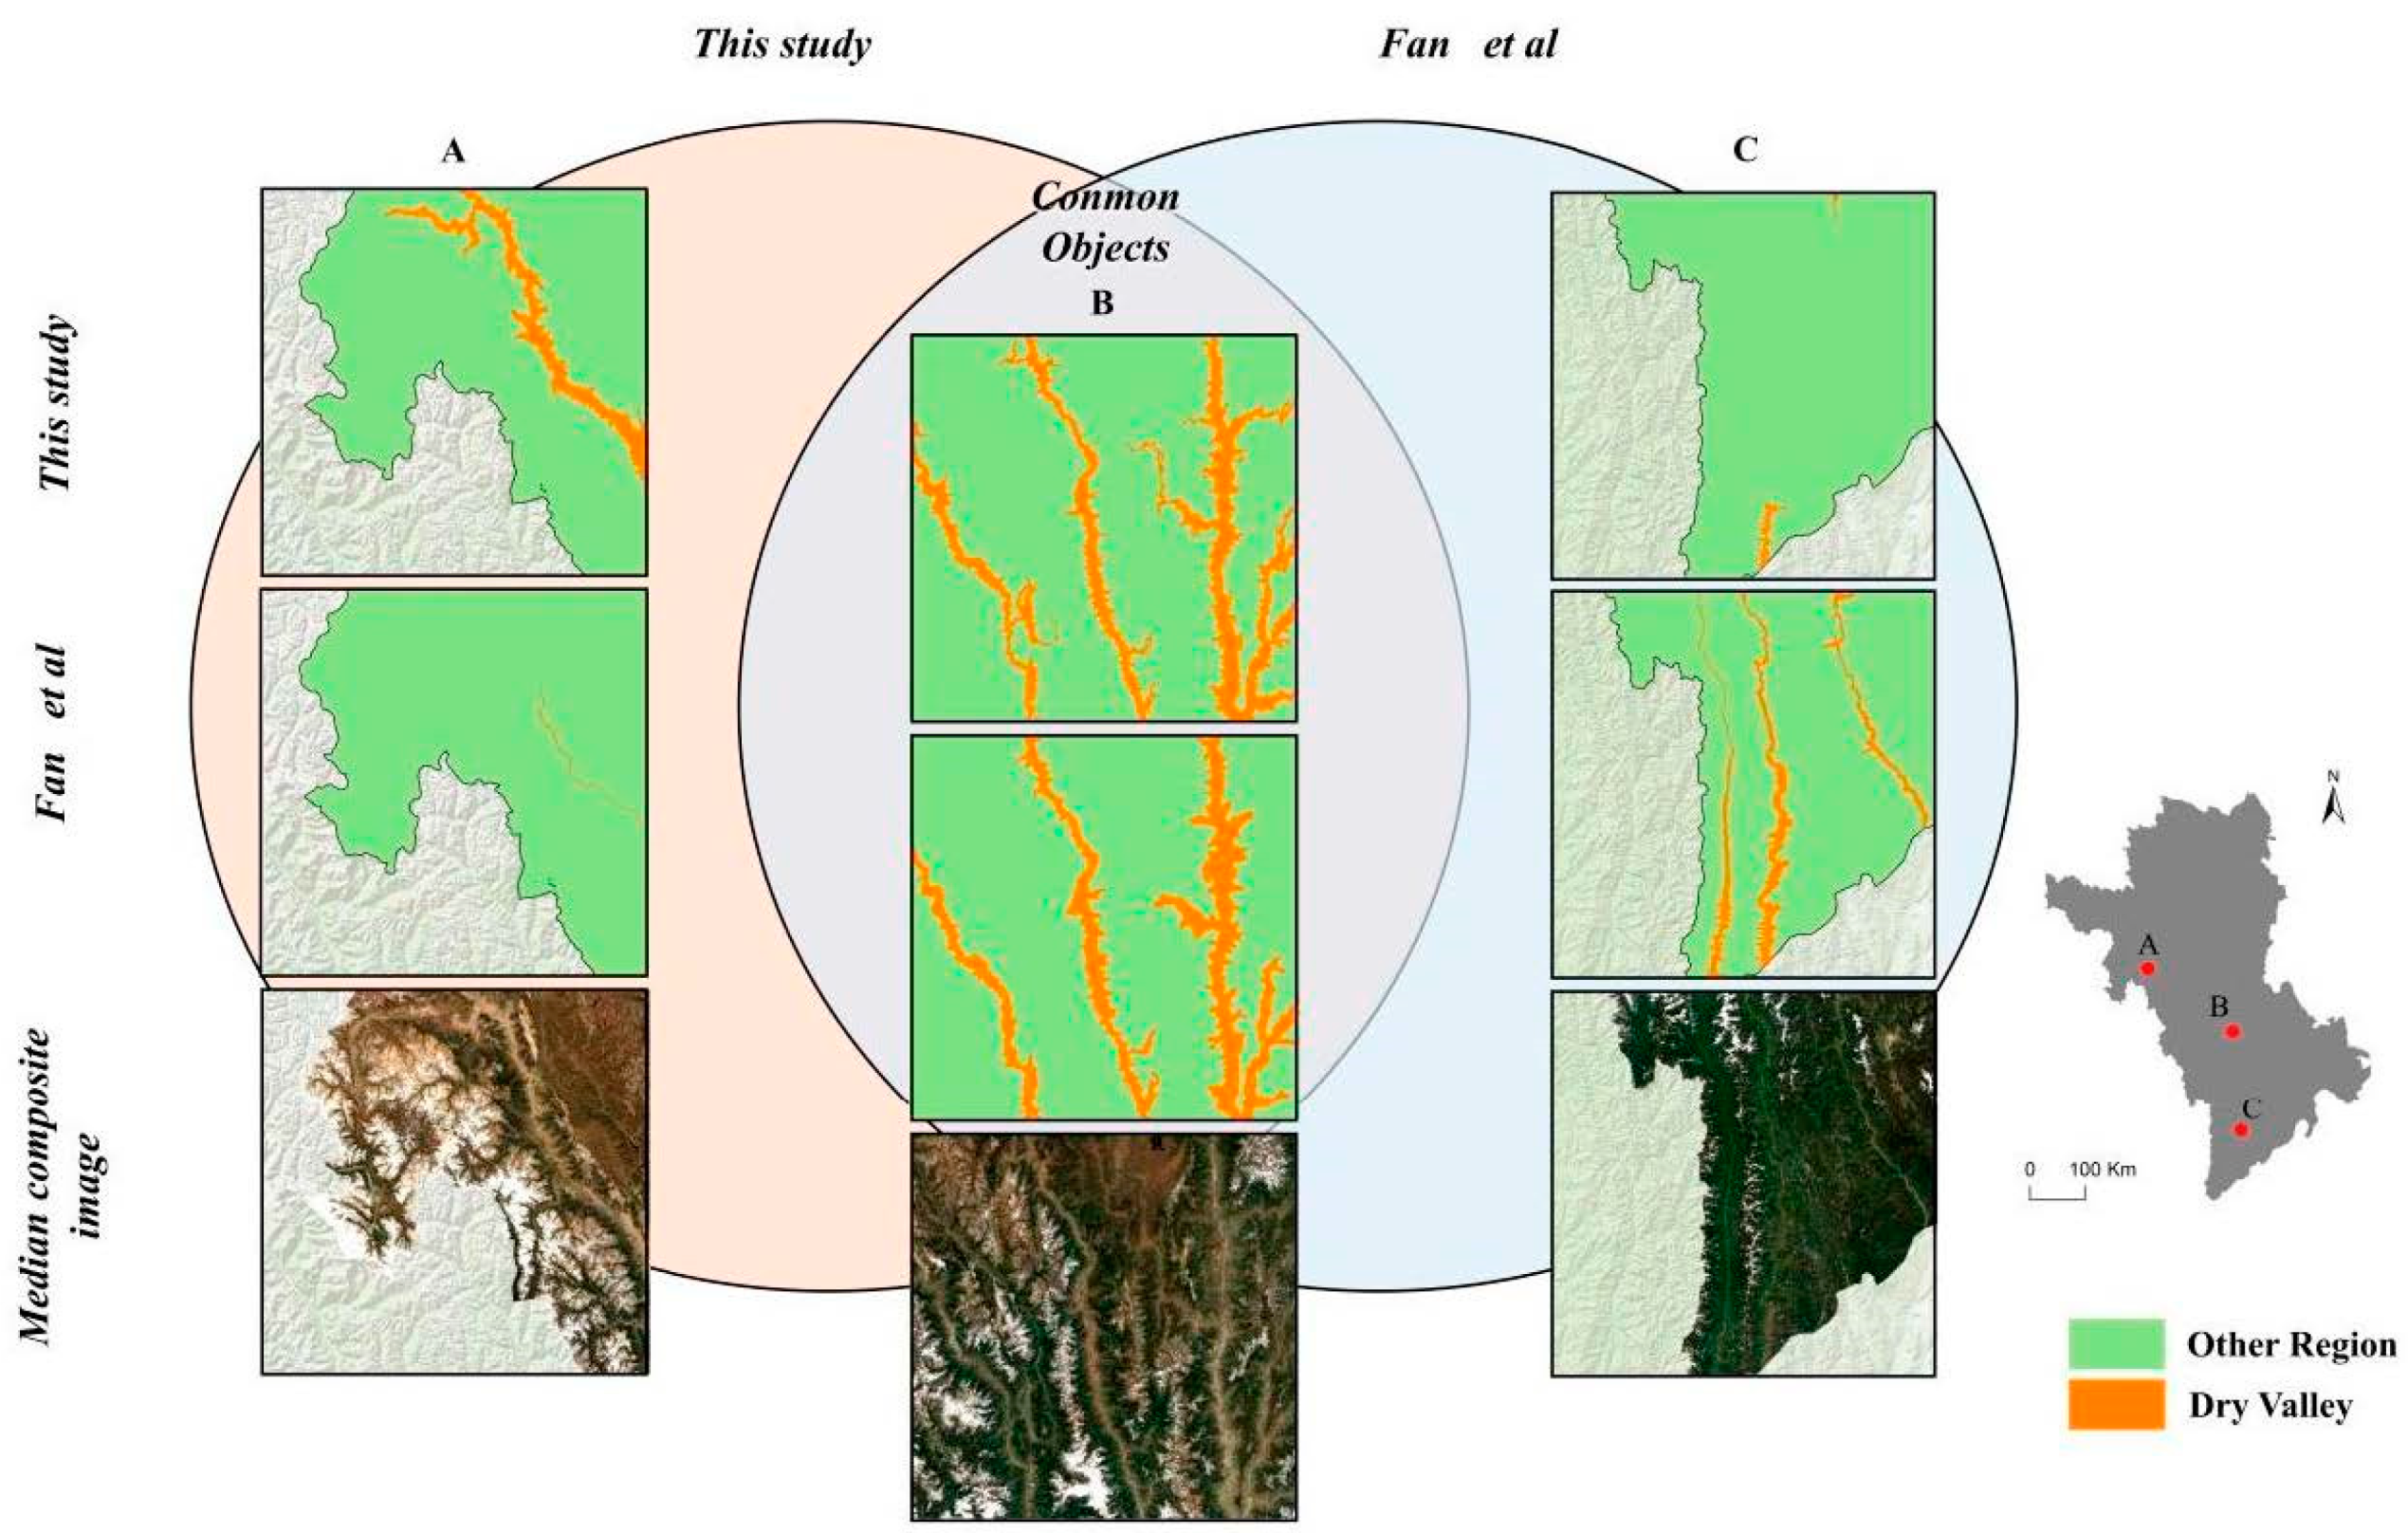
3.3. Results of Accuracy Verification

We verified the accuracy of the extraction results of dry valleys using 104 sampling points collected during the fieldwork. Table 6 shows that the accuracy of our identification results was relatively good, with a kappa coefficient up to 0.84 and an OA of 92.3%.

4. Discussion

In this study, we achieved an accurate extraction of dry valleys on a large spatial scale through a geographically and ontologically oriented method and circumvented the cloud pollution problem that is prevalent in Southwest China by fusing optical and SAR images, providing a new method for accurately defining the scope of dry valleys. A few studies have contributed to the delineation of dry valleys areas. For example, Fan et al. [13] outlined the scope of dry valleys in Southwest China based on visual interpretation to provide an understanding of the spatial distribution of dry valleys. However, the data used in the study are still insufficient in the TPRR. Using the collected field survey points, we evaluated the results of Fan et al. [13]. based on the confusion matrix. The results of the comparison showed that our overall classification accuracy in defining the scope of the dry valleys was 15.7% better than that of Fan et al. This is because the results of Fan et al. have omission errors in some of the valleys’ sections of the TPRR. For example, in the upper reaches of the Sallween River (Figure 7A), we found the existence of dry valleys from the 72 curves of the Sallween River to the north of the Sallween River Bridge during our field work, which is consistent with our results. Furthermore, we considered relevant geographical environmental factors in the process of defining the scope of dry valleys to reduce the misclassification problem that existed in the lower reaches of the three rivers (Figure 7C) in a previous study. We found that the overall aridity index was lower in the lower valley section of the three rivers. Previous studies have pointed out that the size of the intersection angle between the direction of the mountains and the moist airflow has an obvious influence on the formation of dry valleys [8]. When the intersection angle is small, the river valleys can play a role in guiding the wind, modifying the climate (such as making the area relatively humid) of the valley sections of the Sallween and Lancang rivers in the southwestern part of the Hengduan Mountains. Moreover, the depth of the valleys gradually decreases from north to south, and the barrier effect of the mountains gradually decreases, which, to a certain extent, creates a pattern of decreasing aridity from north to south in the valley section [49]. In addition, the overall vegetation cover of the valley in the lower reaches of the three rivers is relatively high; therefore, they were not identified as dry valleys in our results.
Zhang and others [8] developed a systematic understanding of dry valleys in the Hengduan Mountains and delineated a reliable scope of dry valleys after the First Qinghai–Tibet Plateau Scientific Expedition. However, because the work was published in the 1990s, the data are hand-drawn boundaries and are difficult to use at fine scales. In this study, we updated the scope of DVT through a geographically and ontologically oriented method and achieved good classification accuracy. The final total area of the DVT obtained in our results was 6147.1 km2, and the total length was 2125.3 km; both were slightly larger than their results (area of 4350 km2 and length of 1885 km). However, with respect to the distribution scope of the dry valleys, our results were consistent with Zhang et al. [8]. It has been pointed out that, under the influence of climate warming and human activities, the area of the dry valley in the upper reaches of the Minjiang River has increased by 81.6 km2 in the last 30 years [13]. The discrepancy between the two results could be due to the accuracy of the data at the time or the influence of climate and human activities.
Various studies in recent years have shown that the vegetation condition in Southwest China has generally improved [51,52,53,54], which has mainly been attributed to the implementation of several mountain ecological restoration projects in this region [18]. As a special landscape in Southwest China, dry valleys are fragile and sensitive ecosystems. It has been pointed out that more attention should be paid to vegetation cover changes in dry valleys to reveal substantial internal differences in vegetation cover in Southwest China [55]. The dry valleys are also key areas on which to build the ecological barrier of the TPRR [56]. Due to the special natural and geographical conditions of the dry valleys and the excessive interference of long-term human activities, the scope of the dry valleys’ expansion, aridification, and secondary aridification problems is becoming increasingly important [57]. The governance of the region should adopt a strategy that is compatible with that particular ecosystem and pay attention to the influence of human factors [43]. Clarifying the scope of the dry valleys not only helps scholars to better understand and protect these special ecosystems, but also aids in achieving coordinated and unified social development planning and environmental protection in dry valleys region. Therefore, future work requires accurate data support for the scope of dry valleys, which is of great significance for the formulation of ecological restoration and environmental protection policies in Southwest China. In addition, the dry valleys are considered to be an incongruous “anti-vertical zone” in phytogeography [58,59], and the existence of which causes a special “vegetation inversion” phenomenon in the TPRR, which affects the whole mountainous natural vertical zone [8]. Accurately defining the scope of dry valleys will lay the foundation for our next investigation of the local vegetation vertical zone under the development of a water–heat combination in this region.
There is still room for improvement in our study. First, the relevant attribute thresholds for the definition of the scope of dry valleys were obtained from expert knowledge. We could explore better constraints on the relevant properties of dry valleys by conducting more field surveys to improve accuracy when defining the scope of dry valleys in further studies. Second, the TPRR belongs to the alpine and gorge regions with relatively undulating terrain. The shadow cover brings some interference to the classification’s accuracy. In subsequent studies, we can include topographic correction methods in the preprocessing of remote sensing images to reduce the influence of shadows. In addition, because of the scarcity of ground-based meteorological observation stations in the study area, which are mainly distributed in lower elevation river valleys, our results are somewhat influenced by the accuracy of climate data products. In the future, refining the interpolation of climate data in the alpine and gorge regions will further improve the accuracy of our extraction of dry valleys.

5. Conclusions

We defined the latest scope of DVT based on a geographically and ontologically oriented method, which helps to provide basic data support for policy decisions related to the sustainable development and ecological protection of dry valley ecosystems. The conclusions of our research can be generalized as follows:
(1) We proposed a system of methods for defining the scope of dry valleys and achieved highly accurate results. The overall classification accuracy was 92.3%, and the kappa coefficient reached 0.84, which can provide a reference for defining the scope of dry valleys in other regions;
(2) The total area of the DVT is about 6147.1 km2, and the total length is 2125.3 km, within which the DVJ has the largest area (2874.4 km2) and the longest length (925.5 km). The DVT involves 3 provincial administrative divisions, 7 prefecture administrative divisions, and 19 county administrative divisions in the Tibet Autonomous Region, Yunnan Province, and Sichuan Province;
(3) Slopes greater than 25° account for 75% of the total area of the DVT. The distribution of dry valley slopes in each basin is consistent, with steep slopes and sharp slopes dominating. In terms of aspect, the distribution area of sunny aspects is larger than that of shady aspects. The land cover of the DVT is dominated by grasslands with desert substrates, which account for 82.6% of the total area; settlements and croplands cover less than 3%;
(4) Our results can be further improved. Future studies can improve accuracy when defining the scope of dry valleys by combining more field surveys to explore the optimal thresholds for relevant indicators, the topographical correction of remote sensing imagery, and for refining the interpolation of climate data in the alpine and gorge regions.

Author Contributions

Conceptualization, L.Z., H.T. and P.S.; methodology, L.Z. and W.J.; software, L.Z.; validation, L.Z. and L.D.; formal analysis, L.Z. and W.J.; investigation, L.Z., H.T. and P.S.; resources, H.T. and P.S.; writing—original draft preparation, L.Z.; writing—review and editing, H.T. and P.S.; visualization, L.Z.; supervision, H.T.; project administration, H.T.; funding acquisition, H.T. All authors have read and agreed to the published version of the manuscript.

Funding

This research was supported by the Second Qinghai-Tibetan Plateau Scientific Expedition and Research Program (STEP), Grant No. 2019QZKK0606.

Data Availability Statement

All data and materials are available upon request.

Conflicts of Interest

The authors declare no conflict of interest.

References

  1. Ming, Q.; Shi, Z. New Discussion on Dry Valley Formation in the Three Parallel Rivers Region. J. Desert Res. 2007, 27, 99–104. [Google Scholar]
  2. Bao, W. Scientific Basis for Ecological Restoration and Sustainable Management of Dry Valleys; Science Press: Beijing, China, 2012. [Google Scholar]
  3. Shen, Y.; Zhang, Y.; Liu, W. Plant rehabilitation on degraded land at debris-prone dry valley. Scientific basis for ecological restoration and sustainable management of dry valleys. J. Mount. Sci. 2002, 2, 188–193. [Google Scholar]
  4. Tang, Y.; Xie, J.; Sun, H. Revisiting sustainable development of dry valleys in Hengduan Mountains region. Chin. J. Mountain Sci. 2004, 1, 38–45. [Google Scholar] [CrossRef]
  5. Zhao, Z.; Li, C.; Qie, R.; Li, Q. Analysis of Landscape Pattern Feature of Land Use Based on Landscape Ecology—A Case Study of Panshi City in China. J. Landsc. Res. 2012, 4, 13–18. [Google Scholar]
  6. Kalthoff, N.; Fiebig-Wittmaack, M.; Meißner, C.; Kohler, M.; Uriarte, M.; Bischoff-Gauß, I.; Gonzales, E. The energy balance, evapo-transpiration and nocturnal dew deposition of an arid valley in the Andes. J. Arid. Environ. 2006, 65, 42–443. [Google Scholar] [CrossRef]
  7. Yang, Z.; Chang, Y.; Bu, R.; Liu, M.; Zhang, W. Long-term dynamics of dry valleys in the upper reaches of Mingjiang River, China. Acta Ecol. Sin. 2007, 27, 3250–3256. [Google Scholar]
  8. Zhang, R. The Dry Valleys of The Hengduan Mountains Region; Science Press: Beijing, China, 1992. [Google Scholar]
  9. Wang, W.; Zhu, W.; Li, X.; Shu, S. Soil quality assessment of typical vegetation in dry and warm valley of Dadu River based on minimum data set. J. Soil Water Conserv. 2021, 19, 54–59. [Google Scholar]
  10. Yang, C.; Fan, J.; Liu, J.; Xu, F.; Zhang, X. Evaluating the Dominant Controls of Water Erosion in Three Dry Valley Types Using the RUSLE and Geodetector Method. Land 2021, 10, 1289. [Google Scholar] [CrossRef]
  11. Yang, D.; Wang, Y.; Wang, Q.; Ke, Y.; Zhang, Y.; Zhang, S.; Zhang, Y.; McDowell, N.G.; Zhang, J. Physiological response and photosynthetic recovery to an extreme drought: Evidence from plants in a dry-hot valley savanna of Southwest China. Sci. Total Environ. 2023, 868, 161711. [Google Scholar] [CrossRef]
  12. Yuan, H.; Li, X.; Lin, Y. Arid River Valley Division Research in Sichuan Province Based on Remote Sensing. J. Sichuan Agric. Univ. 2013, 31, 182–187. [Google Scholar]
  13. Fan, J.; Yang, C.; Bao, W.; Liu, J.; Li, X. Distribution Scope and District Statistical Analysis of Dry Valleys in Southwest China. J. Mt. Sci. 2020, 38, 303–313. [Google Scholar]
  14. Ding, M.; Zhou, P.; Zhang, Y.; Lv, X. Quantitative Determination of Boundary Fluctuation in Arid Valley of the Upper Min River and Its Evolution Feature. J. Mt. Sci. 2017, 35, 170–178. [Google Scholar]
  15. Zheng, J.; Feng, W.; Wang, F.; Yuan, D.; Gong, X.; Huang, Y. Spatial definition and its range variation of arid valley in the upper reaches of Minjiang River. Aird Land Geogr. 2017, 40, 541–548. [Google Scholar]
  16. Gao, Y.; Liu, Q.; Wang, H.; Xu, X.; Shi, Q. Definition dry valleys scope by RS and GIS. J. Beijing Normal Univ. (Nat. Sci). 2012, 48, 92–96. [Google Scholar]
  17. Yao, X.; Deng, J.; Liu, X.; Zhou, Z.; Yao, J.; Dai, F.; Ren, K.; Li, L. Primary Recognition of Active Landslides and Development Rule Analysis for Pan Three-river-parallel Territory of Tibet Plateau. Adv. Eng. Sci. 2020, 52, 16–37. [Google Scholar]
  18. Wang, C.; Wang, J.; Naudiyal, N.; Wu, N.; Cui, X.; Wei, Y.; Chen, Q. Multiple Effects of Topographic Factors on Spatio-Temporal Variations of Vegetation Patterns in the Three Parallel Rivers Region, Southeast Qinghai-Tibet Plateau. Remote Sens. 2022, 14, 151. [Google Scholar] [CrossRef]
  19. Cheng, Z.; Weng, C.; Guo, J.; Dai, L.; Zhou, Z. Vegetation responses to late Quaternary climate change in a biodiversity hotspot, the Three Parallel Rivers region in southwestern China. Palaeogeogr. Palaeocl. 2018, 491, 10–20. [Google Scholar] [CrossRef]
  20. Seluchi, M.E.; Norte, F.A.; Satyamurty, P.; Chou, S.C. Analysis of three situations of the Foehn effect over the Andes (Zonda Wind) using the Eta-CPTEC regional model. Weather Forecast. 2003, 18, 481–501. [Google Scholar] [CrossRef]
  21. Tan, S.; Wu, B.; Zhang, X. Mapping Paddy Rice in the Hainan Province Using both Google Earth Engine and Remote Sensing Images. J. Geo-Inf. Sci. 2019, 21, 937–947. [Google Scholar]
  22. Wang, X.; Jiang, W.; Deng, Y.; Yin, X.; Peng, K.; Rao, P.; Li, Z. Contribution of Land Cover Classification Results Based on Sentinel-1 and 2 to the Accreditation of Wetland Cities. Remote Sens. 2023, 15, 1275. [Google Scholar] [CrossRef]
  23. The European Space Agency. Sentinel-2 User Handbook; European Space Agency (ESA): Paris, France, 2015; Volume 64. [Google Scholar]
  24. Zhang, X.; Wu, B.; Ponce-Campos, G.E.; Zhang, M.; Chang, S.; Tian, F. Mapping up-to-Date Paddy Rice Extent at 10 M Resolution in China through the Integration of Optical and Synthetic Aperture Radar Images. Remote Sens. 2018, 10, 1200. [Google Scholar] [CrossRef] [Green Version]
  25. Yang, J.; Huang, X. The 30 m annual land cover dataset and its dynamics in China from 1990 to 2019. Earth Syst. Sci. Data 2021, 13, 3907–3925. [Google Scholar] [CrossRef]
  26. Liu, Y.; Yuan, X.; Li, J.; Qian, K.; Yan, W.; Yang, X.; Ma, X. Trade-offs and synergistic relationships of ecosystem services under land use change in Xinjiang from 1990 to 2020: A Bayesian network analysis. Sci. Total Environ. 2023, 858, 160015. [Google Scholar] [CrossRef] [PubMed]
  27. Ling, Z.; Jiang, W.; Lu, Y.; Ling, Y.; Zhang, Z.; Liao, C. Continuous Long Time Series Monitoring of Urban Construction Land in Supporting the SDG 11.3.1—A Case Case Study of Nanning, Guangxi, China. Land 2023, 12, 452. [Google Scholar] [CrossRef]
  28. Lüscher, P.; Weibel, R.; Burghardt, D. Integrating ontological modelling and Bayesian inference for pattern classification in topographic vector data. Comput. Environ. Urban Syst. 2009, 33, 363–374. [Google Scholar] [CrossRef] [Green Version]
  29. Cao, Y.; Huang, Y.; Chen, J.; Sheng, Y. Geographic process modeling based on geographic ontology. open. Open Geosci. 2018, 10, 782–796. [Google Scholar] [CrossRef]
  30. Zhan, J.; Yang, B.; Li, M.; Gao, G.; Wang, S. Definition Scope of Arid Valley in the Upper Reaches of Minjiang River Based on GIS and Geographic Ontology. Geogr. Geo-Inf. Sci. 2015, 31, 65–69. [Google Scholar]
  31. Guo, C.; Xu, T.; Liu, L. Construction of Knowledge Graph Based on Geographic Ontology. IOP Conf. Ser. Earth Environ. Sci. 2019, 252, 52161. [Google Scholar] [CrossRef]
  32. Lin, L.; Hang, S.; Yu, L.; Haihong, Z.; Zhenwei, L.; Tao, S.; Zhaoxi, L. Semantic-Based Methodology for Creation of Exemplars of Geographical concepts. Geomat. Inf. Sci. Wuhan Univ. 2018, 43, 2243–2249. [Google Scholar]
  33. Kou, W.; Xiao, X.; Dong, J.; Gan, S.; Zhai, D.; Zhang, G.; Qin, Y.; Li, L. Mapping Deciduous Rubber Plantation Areas and Stand Ages with PALSAR and Landsat Images. Remote Sens. 2015, 7, 1048–1073. [Google Scholar] [CrossRef] [Green Version]
  34. Chen, B.; Li, X.; Xiao, X.; Zhao, B.; Dong, J.; Kou, W.; Qin, Y.; Yang, C.; Wu, Z.; Sun, R.; et al. Mapping tropical forests and deciduous rubber plantations in Hainan Island, China by integrating PALSAR 25-m and multi-temporal Landsat images. Int. J. Appl. Earth Obs. Geoinf. 2016, 50, 117–130. [Google Scholar] [CrossRef]
  35. Breiman, L. Bagging predictors machine learning. Mach. Learn. 1996, 24, 123–140. [Google Scholar] [CrossRef] [Green Version]
  36. Ho, T. The random subspace method for constructing decision forests. IEEE Trans. Pattern Anal. Mach. Intell. 1998, 20, 832–844. [Google Scholar]
  37. Pelletier, C.; Valero, S.; Inglada, J.; Champion, N.; Dedieu, G. Assessing the robustness of Random Forests to map land cover with high resolution satellite image time series over large areas. Remote Sens. Environ. 2016, 187, 156–168. [Google Scholar] [CrossRef]
  38. Mao, F.; Tang, S.; Sun, H.; Zhang, J. A study of dynamic change of dry and wet climate regions in the Tibetan Plateau over the last 46 years. J. Atmos Sci. 2008, 32, 499–507. [Google Scholar]
  39. Meng, N.; Wang, N.; Cheng, H.; Liu, X.; Niu, Z. Impacts of climate change and anthropogenic activities on the normalized difference vegetation index of desertified areas in northern China. J. Geogr. Sci. 2023, 33, 483–507. [Google Scholar] [CrossRef]
  40. Hartoyo, A.P.P.; Pamoengkas, P.; Mudzaky, R.H.; Khairunnisa, S.; Ramadhi, A.; Munawir, A.; Komarudin, K.; Hidayati, S.; Sunkar, A. Estimation of vegetation cover changes using normalized difference vegetation index (NDVI) in Mount Halimun Salak National Park, Indonesia. IOP Conf. Ser. Earth Environ. Sci. 2022, 1109, 12068. [Google Scholar] [CrossRef]
  41. Liu, G.; Shao, Q.; Fan, J.; Huang, H.; Liu, J.; He, J. Assessment of Restoration Degree and Restoration Potential of Key Ecosystem-Regulating Services in the Three-River Headwaters Region Based on Vegetation Coverage. Remote Sens. 2023, 15, 523. [Google Scholar] [CrossRef]
  42. Guo, J.; Sang, H.; Zhai, L. Spatiotemporal variations and driving factors of vegetation coverage on the Qinghai-Tibet. Chin. J. Ecol. 2022, 1–13. [Google Scholar]
  43. Fang, S.; Zhao, Y.; Han, L. Boundaries and Characteristics of Arid Regions in Mountain Valleys in Southwestern China. Mt. Res. Dev. 2018, 38, 73–84. [Google Scholar] [CrossRef] [Green Version]
  44. Zhao, Y.; Duan, X.; Han, J.; Yang, K.; Xue, Y. The main influencing factors of soil mechanical characteristics of the gravity erosion environment in the dry-hot valley of Jinsha river. Open Chem. 2018, 16, 796–809. [Google Scholar] [CrossRef]
  45. Gong, Z.; Li, Y.; Liu, L.; Deng, S. Great Facilitation of Thirty Years of Reforestation with Mixed Species to Ecosystem Nitrogen Accumulation in Dry-Hot Valley in the Jinsha River. Int. J. Environ. Res. Public Health 2022, 19, 12660. [Google Scholar] [CrossRef] [PubMed]
  46. Li, Y.; Duan, X.; Li, Y.; Li, Y.; Zhang, L. Interactive effects of land use and soil erosion on soil organic carbon in the dry-hot valley region of southern China. Catena 2021, 201, 105187. [Google Scholar] [CrossRef]
  47. Jia, W.; Ma, W.; Shi, P.; Wang, J.A.; Su, P. Monitoring Rock Desert Formation Caused by Ice–Snow Melting in the Qinghai-Tibet Plateau Using an Optimized Remote Sensing Technique: A Case Study of Yushu Prefecture. Remote Sens. 2022, 14, 570. [Google Scholar] [CrossRef]
  48. Ma, W.; Jia, W.; Su, P.; Feng, X.; Liu, F.; Wang, J.A. Mapping Highland Barley on the Qinghai–Tibet Combing Landsat OLI Data and Object-Oriented Classification Method. Land 2021, 10, 1022. [Google Scholar] [CrossRef]
  49. Li, X.; Liu, X.; Zhang, H.; Bao, W. Latitudinal patterns of climatic variables and influence of local topography on climatic variables in the dry valleys of southwestern China. J. Mt. Sci. 2022, 19, 1348–1356. [Google Scholar] [CrossRef]
  50. Fan, J.; Yang, C.; Bao, W.; Liu, J.; Li, X. Dry Valley Scope Data in Southwest, China; Mountain Science Data Center: Chengdu, China, 2020. [Google Scholar]
  51. Chen, C.; Park, T.; Wang, X.; Piao, S.; Xu, B.; Chaturvedi, R.K.; Fuchs, R.; Brovkin, V.; Ciais, P.; Fensholt, R.; et al. China and India lead in greening of the world through land-use management. Nat. Sustain. 2019, 2, 122–129. [Google Scholar] [CrossRef]
  52. Piao, S.; Yin, G.; Tan, J.; Cheng, L.; Huang, M.; Li, Y.; Liu, R.; Mao, J.; Myneni, R.B.; Peng, S.; et al. Detection and attribution of vegetation greening trend in China over the last 30 years. Glob. Chang. Biol. 2015, 21, 1601–1609. [Google Scholar] [CrossRef]
  53. Yu, L.; Liu, Y.; Liu, T.; Yan, F. Impact of recent vegetation greening on temperature and precipitation over China. Agric. For. Meteorol. 2020, 295, 108197. [Google Scholar] [CrossRef]
  54. Jiang, S.; Chen, X.; Smettem, K.; Wang, T. Climate and land use influences on changing spatiotemporal patterns of mountain vegetation cover in southwest China. Ecol. Indic. 2021, 121, 107193. [Google Scholar] [CrossRef]
  55. Guo, Q.; Zhong, R.; Shan, Z.; Duan, X. Vegetation Cover Variation in Dry Valleys of Southwest China: The Role of Precipitation. Remote Sens. 2023, 15, 1727. [Google Scholar] [CrossRef]
  56. Yang, Z.; Chang, Y. Ecological problems of primary dry valleys is Southwest China and advances in the researches into them. Agric. Res. Arid Areas 2007, 1, 90–99. [Google Scholar]
  57. Guo, Y.; Wang, Q.; Fan, M. Exploring the Relationship between the Arid Valley Boundary’s Displacement and Climate Change during 1999–2013 in the Upper Reaches of the Min River, China. ISPRS Int. J. Geo-Inf. 2017, 6, 146. [Google Scholar] [CrossRef] [Green Version]
  58. Zhang, B.; Zhou, C.; Chen, P. The Geo-info-spectrum of montane altitudinal belts in China. Acta Geogr. Sin. 2003, 58, 163–171. [Google Scholar]
  59. Yao, Y.; Zhang, B.; Han, F.; Pang, Y. Spatial pattern and exposure effect of altitudinal belts in the Hengduan Mountains. J. Mount. Sci. 2010, 28, 11–20. [Google Scholar]
Figure 1. Location of the study area.
Land 12 01235 g001
Figure 2. Location of field survey points along the Yunnan–Tibet and Sichuan–Tibet routes. Panels (ad) show four typical dry valleys in each watershed in the study area (the locations of which are indicated by the red squares).
Land 12 01235 g002
Figure 3. Dry valley ontology model.
Land 12 01235 g003
Figure 4. Workflow for defining the scope of dry valleys.
Land 12 01235 g004
Figure 5. Spatial distribution and land cover of the DVT: (a) the spatial distribution (using the shadow of the mountains as the base map); (b) the land cover distribution.
Land 12 01235 g005
Figure 6. Topographical characteristics of the DVT: (a) The distribution characteristics of slopes, which were divided into 6 classes: flat slope (<5°), gentle slope (5–15°), ramp slope (15–25°), steep slope (25–35°), sharp slope (35–45°), and dangerous Slope (>45°). (b) The distribution characteristics of the aspect: The south-facing slopes are the sunny aspects, and the north-facing slopes are the shady aspects.
Land 12 01235 g006
Figure 7. Subfigures (AC) shows the similarities and differences between our results and those of Fan et al. [50]: The left column (A) shows the dry valley in the upper Sallween River region identified in our study that is only sparsely distributed in the results of Fan et al. The right column (C) shows the dry valley identified by Fan et al. in the middle–lower reaches of the Sallween, Lancang, and Jinsha Rivers that is considered to exist only in the Yingpan section of the Lancang River in Lamping in our study. The center column (B) shows the region around 29° north latitude in the TPRR, where the dry valley appears in both research works.
Land 12 01235 g007
Table 1. Parameters of remote sensing image bands required for classification.
SensorBandSpatial Resolution (m)Provider
Landsat-8 OLIB2Blue30USGS
(https://www.usgs.gov, accessed on 12 March 2023)
B3Green30
B4Red30
B5Near-infrared30
B6Short-wave infrared 130
B7Short-wave infrared 230
Sentinel-2 MSIB2Blue10ESA
(https://scihub.copernicus.eu, accessed on 12 March 2023)
B3Green10
B4Red10
B8Near-infrared10
B11Short-wave infrared 120
B12Short-wave infrared 220
Sentinel-1VVDual-band cross polarization, vertical10
VHTransmission/horizontal receiver10
Table 2. Explanatory variables considered in the classification.
VariableDescription
Normalized Digital Vegetation Index (NDVI)NDVI = (NIR − Red)/(NIR + Red)
Enhanced Vegetation
Index (EVI)
EVI = 2.5 × (NIR − Red)/(NIR + 6 × Red − 7.5 × Blue + 1)
Normalized Difference Water Index (NDWI)NDWI = (Green − NIR)/(Green + NIR)
Normalized Difference
Snow Index (NDSI)
NDSI = (Green − SWIR)/(Green + SWIR)
Elevation-
Slope-
Note: Red: Visible red; Green: Visible green; Blue: Visible blue; NIR: Near infrared; SWIR: Shortwave infrared.
Table 3. Constraints on properties of the DVT.
Property FactorIndicatorEligibleIneligible
Terrain FactorGeographical locationJinsha, Lancang, and Sallween rivers and their major tributariesOther
Elevation 800   m E L 4000   m E L < 800   m o r E L 4000   m
Distance-to-river 0   k m < D T 3.5   k m D T > 3.5   k m
Geographical
Environment
Factor
Coldest monthly average temperature C T 4.3   CT < −4.3 °C
Warmest monthly average temperature W T 14   W T < 14  
Aridity index A I 1.5 A I < 1.5
FVCLow and medium–low vegetation coverOther
Soil typeDominated by cinnamon soil, brown soil, and red soilOther
Remote Sensing Image FeatureArid landscapeOff-white under false color; rough texture structureOther
Table 4. Statistics on the distribution of the DVT.
NameArea/km2Length/kmLength of Boundary/kmInvolved ProvinceInvolved County
Sallween River1639.0515.91794.0Tibet3
Lancang River1633.7683.82545.3Tibet, Yunnan6
Jinsha River2874.4925.55040.5Tibet, Yunnan, Sichuan10
TPRR6147.12125.39379.8Tibet, Yunnan, Sichuan19
Table 5. Land cover statistics of dry valleys in each basin.
Land CoverTPRRSallween RiverLancang RiverJinsha River
Proportion (%)Proportion (%)Proportion (%)Proportion (%)
Grassland82.6%88.7%83.1%79.1%
Forest13.0%9.1%12.7%15.3%
Shrub0.4%0%0.5%0.6%
Water1.3%0.8%1.2%1.6%
Cropland2.4%0.9%2.4%3.2%
Impervious0.3%0.5%0.1%0.2%
Table 6. Evaluation of the accuracy of dry valley identification results.
TypeProducer’s Accuracy
(Pixels)
User’s Accuracy
(Pixels)
Producer’s Accuracy
(%)
User’s Accuracy
(%)
Overall Accuracy
(%)
Kappa Coefficient
Dry Valley35/4035/3887.5%92.1%92.3%0.84
Other61/6461/6695.3%92.4%
Disclaimer/Publisher’s Note: The statements, opinions and data contained in all publications are solely those of the individual author(s) and contributor(s) and not of MDPI and/or the editor(s). MDPI and/or the editor(s) disclaim responsibility for any injury to people or property resulting from any ideas, methods, instructions or products referred to in the content.

