
Urbanization-Induced Diurnal Variation in Short-Duration Rainfall Events in Wuhan, China


1
Department of Atmospheric Science, School of Environmental Studies, China University of Geosciences, Wuhan 430070, China
2
CMA-NJU Joint Laboratory for Climate Prediction Studies, School of Atmospheric Sciences, Nanjing University, Nanjing 210023, China
3
Laboratory for Climate Studies, National Climate Center, China Meteorological Administration, Beijing 100081, China
4
State Key Laboratory of Plateau Ecology and Agriculture, Qinghai University, Xining 810000, China
*
Author to whom correspondence should be addressed.
Land 2023, 12(7), 1343; https://doi.org/10.3390/land12071343
Submission received: 10 May 2023
/
Revised: 27 June 2023
/
Accepted: 30 June 2023
/
Published: 4 July 2023
(This article belongs to the Special Issue Influence of Urbanization-Related Radical Land Modification on Urban Extreme Climate)
Abstract
:Increasing of evidence suggests that rapid urbanization modifies precipitation and increases atmospheric instability in urban areas mainly due to urban heat island (UHI)-induced thermal effects and urban building-induced dynamic effects. However, few studies focus on the impact of urbanization on the diurnal variations in urban rainfall in terms of initiating time, frequency, amount, and intensity. Here, six years of hourly data from a relatively dense meteorological observation network in the Wuhan area in central China are used to quantify the issue of urbanization-induced diurnal variations in hourly rainfall and short-duration rainfall (SDR) events by comparing urban and surrounding rural stations during the summer dry period (13 July to 4 August), corresponding to hot weather with little rainfall and high evaporation. The results indicate that: (i) A higher frequency of hourly rainfall appears during night-time and afternoon over urban areas as compared to rural areas. The urban rainfall is more concentrated during the night-time; (ii) More and stronger urban SDR events are triggered during the night-time over urban areas, especially in terms of amount and intensity of rainfall events. A greater diurnal urban–rural difference in SDR events is detected than that in hourly mean rainfall; (iii) There is an enhancement in the night-time and afternoon urban SDR events when UHI intensity increases before they are initiated, and this is detectable in the frequency, amount, and intensity of SDR events. It is also found that the UHI-induced thermal effects are the main reason for the stronger nocturnal SDR events in Wuhan during the summer dry period, which is caused by increases in the convection current and water vapor flux convergence in the urban areas.
1. Introduction
Early in the 1920s, Horton [1] observed some thunderstorms generated from cities in the northeast United States. Subsequently, a major North American field program, the Metropolitan Meteorological Experiment (METROMEX) [2,3], and high-density weather station networks and historical climate data series in a couple of major cities [4,5,6,7], provided more observational evidence that urban areas can significantly change precipitation due to human activities [4,8,9,10]. A recent review of 48 papers concerning the impact of urbanization on precipitation by Liu and Niyogi [11] indicated that the impacts of urbanization-induced rainfall modification are mostly seen in urban areas and places downwind of them, with an ~18% increase in the mean precipitation over the downwind areas and ~16% increase over the urban centers.
Several mechanisms have been proposed to explain urbanization-induced modifications using both observational and modeling approaches. These mechanisms include: (i) atmospheric destabilization and convection enhancement caused by Urban Heat Island (UHI)-induced thermal perturbation over urban areas [5,12,13]; (ii) barrier effects caused by increased mechanical turbulence associated with increased surface roughness in the urban environment and thermal effects from urban canyons [14,15,16]; (iii) anthropogenic aerosols changing the microphysical processes in urban clouds [17,18,19], which may be crucial in urbanization-induced rainfall once the convection is triggered [19]. One or more mechanisms may dominate the urbanization-induced impacts over various cities with different geographical features [11].
The spatial characteristics of urbanization-induced rainfall are a research hotspot. Destabilization of the urban boundary layer and resulting downstream translation of the UHI circulation by synoptic flow [20] may be the reason for increased rainfall downwind of urban areas. A combination of low wind and high UHI can enhance convergence into the city leading to higher rainfall totals over urban areas [21]. Liu and Niyogi [11] indicated that modeling studies suggested an increase in rainfall over urban areas, while case studies showed a preference for increasing rainfall downwind of urban areas. Furthermore, several studies reveal that short-duration rainfall (SDR) is significantly more impacted by UHI than the normal rainfall during the summer in China [6,22,23]. For instance, Liang and Ding [22] found the occurrence frequency and intensity of hourly heavy precipitation show a phenomenon of “urban rain-island” in Shanghai, China. Wu et al. [23] also found that an urbanization-related positive trend is more related to SDR than to rainfall with a longer duration in the Pearl River Delta region of south China.
The diurnal variation of rainfall is essentially governed by the interaction of thermodynamic forcing, cloud microphysics, and local circulation [24,25]. Oki and Musiake [25] showed that evening convective rainfall is caused by thermodynamic forcing in inland areas, while morning low-level convergence is due to the interactions of local land-sea breezes and predominant monsoon winds in the coastal regions of Japan and Malaysia. Zhang and Zhai [26] revealed that surface solar radiative heating results in the maximum frequencies of extreme rainfall in the afternoon and/or early evening over most of China. Huff and Vogel [27] indicated that the evening maximum rainfall downwind of urban areas is associated with the interaction between UHI and atmospheric processes, which enhances the regional nocturnal thunderstorm anomalies. Recently, more studies have focused on the impacts of urbanization on the diurnal variation of rainfall using high spatial and temporal resolution rainfall data. Case studies showed that both mean and extreme rainfall have increased during the late afternoon and/or early night-time over and downwind of urban areas [28]. For example, the diurnal variation in rainfall intensity shows a significant urban-rural difference during the late afternoon and early night-time in the downtown areas of Shanghai, China, as a result of urbanization, local circulation associated with solar heating, and sea breezes [22].
The nocturnal Urban Heat Island Intensity (UHII) peak might be an important factor that causes the convergence of night-time propagating storms over inland cities such as Minneapolis, MN, Washington, DC [13], and Atlanta, GA [12]. It may also play a role in the increased frequency of storms over cities, such as Chicago, IL, New Orleans, LA, and Los Angeles, CA [4]. The combined influence of topography and urban thermal processes is the main cause of most mesoscale torrential rains that mostly occur in the evening or early morning in China [29]. Further, Ganeshan and Murtugudde [30] used a modeling approach over Minneapolis, MN, and determined that frictional convergence due to rough urban surfaces, aided by the nocturnal UHI, appears to enhance local convergence and attract propagating storms towards the urban center. On the other hand, the UHI produces a low-pressure anomaly causing local convergence during calm atmospheric conditionsand even the development of new convection [12,31].
After changing the surface parameters to typical urban surface values in a mesoscale model, Guo et al. [14] showed that convective cells were produced earlier over urban areas as a result of increased sensible heat flux. Additionally, Zhong and Yang [32] determined that the thermal effects of UHI could slow cold front movement and thereby delay the occurrence of peak rainfall over urban areas. However, all studies focused on the urbanization-induced diurnal variation of rainfall variations based on hourly rain rates. The initiating time of rainfall is crucial in urban rainfall forecasts, especially for extreme rainfall events since such extreme weather directly increases risks in social, economic, and human systems. Exploring the effects of urbanization on rainfall initiating time can help improve rainfall forecasts, and it is also important for investigating more detailed characteristics of urbanization-induced rainfall events.
The summer dry period, corresponding to hot weather with little rainfall and high evaporation [33,34], usually occurs from mid-July to mid-August. It is one of the most relevant disasters characterized by rising temperature and more extreme precipitation [35]. It not only affects agricultural production and food security, but also threatens the economy and environment. In addition, rainfall frequency during the summer dry period is mainly dominated by SDR in the Wuhan area. The SDR events during this period have great implications for regional agricultural production, water resources, and urban operation and management. Thus, the causes and prediction of the summer dry period have received much attention. However, less attention has been paid to the influence of urbanization-induced diurnal variations in SDR events during the summer dry period.
By comparing the difference between urban and rural rainfall variables during the summer dry period in Wuhan, especially focusing on the SDR events, the possible influences of urbanization on diurnal variations in rainfall and SDR are explored. The remainder of this paper is arranged into five parts. The materials and methodologies used are introduced in Section 2. Section 3 presents the diurnal difference between urban and rural rainfall and SDR, and the possible impacts of UHI-induced thermal effects. Concluding remarks and discussions are presented in Section 4.
2. Materials and Methodologies
2.1. Data
The dataset of hourly rainfall and SAT over the Wuhan region was obtained from the National Meteorological Information Center (NMIC) of the China Meteorological Administration (CMA). These data have been extensively used to investigate the characteristics of sub-daily precipitation in China [23,36,37]. A total of 123 stations with hourly rain gauge records and hourly SAT data are established in the Wuhan area, and such relatively high density is beneficial for a more accurate comparison between urban and rural stations. The double tipping-bucket telemetering rain gauge is widely used in automatic weather stations in China. The rain gauges carry out hour-by-hour rainfall observations in the study area [38,39,40]. The study mainly focuses on the summer dry period from 2012 to 2018. However, 2015 was excluded due to missing values exceeding 50%.
Daily precipitation for the middle and lower regions of the Yangtze River, hourly wind vector field, specific humidity, and geopotential height for Jianghan Plain form ERA5 reanalysis data, provided by the European Centre for Medium-Range Weather Forecasts (ECMWF), are used in this study. The spatial resolution for these data is 0.25° × 0.25°. Daily precipitation data are available from 1980 to 2010. The 925 hPa wind is presented as the prevailing wind, and the prevailing wind in Wuhan during the summer dry period is from the southwest (Figure 1c). The 925 hPa divergence, wind vector, and specific humidity were used to calculate the water vapor flux divergence at low level. The area with a geometric height of less than 120 m is classified as Jianghan Plain, and it is not shown in the Figures.
The night-time light images were obtained from the Defense Meteorological Satellite Program/Operational Linescan System (DMSP/OLS) for the period 2000–2013, which needs to be adjusted to set thresholds in the city map in different cities with inconsistent urban development processes. It was pointed out that the area with the highest consistency was found in the Wuhan region when the selection threshold was set at 53% [41]. Thus, in this paper, the night-time light area greater than or equal to 53% over the Wuhan area is taken to be the Wuhan urban areas. At this value, the interference of transient light sources can be eliminated, and the integrity of the central part can be ensured. In addition, the land cover/land use (LULC) dataset was obtained from the Resources and Environmental Sciences Data Center, Chinese Academy of Sciences, at 1 km resolution. Six land-use types were classified in the LULC data, including cultivated land; forestry land; grassland; water area; urban, rural and residential land; and unused land.
2.2. Study Area
Studies have shown that different cities with different backgrounds (including climate regimes, terrain, and urbanization level, etc.) and urban expansion may have different characteristics and dominant mechanisms [13,42,43,44,45]. As the capital of Hubei Province, Wuhan has experienced the strongest ongoing and accelerated urbanization during the past few decades in the Jianghan Plain, which is located in the center of China (Figure 1a). The rapid urbanization can be seen from the changes in several indicators, such as night-time light intensity (Figure 1b) and urban land use data (Figure 1c). The population density shows an increase of 61% in 2015 compared to 1990, and the urban land use ratio has tripled from 1980 to 2018. Additionally, a significant UHI has been found over the past few decades using both annual and seasonal mean Surface Air Temperature (SAT) time series at the Wuhan station from the basic national meteorological observation network of China [46,47]. Furthermore, the land surface temperature in urban areas has increased [48,49]. Wuhan is not only one of many rapidly growing cities in central China but also a typical subtropical inland megacity. Accompanied by this rapid urbanization, a relatively dense meteorological observation network in and around the Wuhan areas was established to provide hourly and synoptic observations for regular weather parameters. Hence, Wuhan could serve as a great case-study site to examine the potential urbanization-induced impacts on rainfall characteristics on the diurnal time scale.
2.3. Methods
2.3.1. Definition of the Summer Dry Period
To define the summer dry period, the time series of daily precipitation is obtained by smoothing five points from 1 June to 15 September (Figure 2), using the reanalysis data of precipitation in the middle and lower reaches of the Yangtze River (27.5–32.5° N, 112–123° E) during 1981–2010. The daily precipitation was analyzed with standardized anomalies. The summer dry period begins with negative daily precipitation for 7 consecutive days and ends with daily precipitation greater than zero for 1 day. Therefore, in this paper the summer dry period is defined to run from 13 July to 4 August (Figure 2).
2.3.2. Classification of Urban and Rural Stations
Although many quality tests have been applied by NIMC, further quality control regarding missing values still needs to be performed. Therefore, 76 observational stations are retained in the study area after excluding stations with more than 5% of hours of missing data per year (Figure 1c).
As has been pointed out, the urban land use areas within the 4-km radius buffer zone around the station have the highest correlation with the SAT trend [50]. The areal percentage of urban land use in the buffering circle with a 4 km radius around the station was used as an urbanization indicator. All stations were ranked in order of urban land-use ratio, and the top 20 were selected as urban stations, among which the lowest urbanization percentage was 25%. Therefore, an urban land-use ratio of 25% within the buffer zone is taken as the standard to distinguish urban and rural stations.
In addition, the elevation range of urban stations is 12–44 m, with an average elevation of 29.75 m. Considering the fact that the comparison of urban and rural stations will be influenced by wind direction, elevation, and distance from the urban center, the conditions for the selection of rural station samples were defined as follows: (i) the elevation fluctuation range does not exceed the average elevation of urban stations by 20 m; (ii) the distance from the city boundary is less than or equal to 20 km; (iii) stations should be evenly distributed around the city. Finally, 20 urban and 20 rural stations were selected in this paper, and the distribution is shown in Figure 1c.
2.3.3. Definition of Rainfall Variables
Different definitions and procedures of rainfall event separation can be found in previous studies [51,52]. With specific constraints of rainfall characteristics, SDR can be defined based on the obtained rainfall events. In this study, the SDR begins with hourly rainfall exceeding 0.1 mm and ends with hourly rainfall falling to 0.1 mm, with a duration equal to or less than 6 h, following Yang [6]. The rainfall timing is defined as the rainfall initiating time in terms of Local Time (LT). For each rainfall event, the rainfall amount was defined as the sum of hourly rainfall, the rainfall duration was defined as the period time from start to end, and the rainfall intensity was calculated as the ratio of rainfall amount to rainfall duration. Frequency and average amount of hourly rainfall, frequency, average amount, and intensity of SDR events, respectively, were also analyzed. The diurnal variation in these variables of hourly rainfall and SDR were calculated using standardized approaches.
2.3.4. Definition of the Urbanization Indicator
In this paper, the urban SDR events are classified under different UHI backgrounds before they are initiated, i.e., SDR with strong UHI and SDR with weak UHI, respectively.
The urbanization indicator Urban Heat Island Intensity Anomaly (UHIIA) is defined by Wu et al. [23]:
For these equations, UHII represents the difference between hourly SAT over urban areas () and hourly SAT over rural areas (), and is calculated by averaging UHII at the same LT in 2012–2018. Therefore, UHIIA values greater/less than 0 are considered positive/negative anomalies of UHII.
Five hourly UHIIA values prior to the timing of all rainfall events are first selected, and then the events with a positive mean UHIIA within five hours prior to the rainfall are defined as the events with strong UHI; the remaining events, that is, the events with a negative mean UHIIA within five hours prior to the rainfall timing, are classified as events with weak UHI.
To clarify, rainfall or SDR initiated during 0000–0600 LT, 0600–1200 LT, 1200–1800 LT and 1800–0000 LT is referred to as the night-time, morning, afternoon and early night rainfall, respectively.
3. Results
3.1. Diurnal Urban-Rural Differences in Rainfall Variables
The diurnal variations in the frequency and average amount of hourly rainfall at the urban and rural stations, respectively, are examined during the summer dry period over the Wuhan area (Figure 3a–c). The diurnal variation in frequency exhibits a bimodal structure, with the first peak during 0500–0800 LT, and the second one during 1300–1500 LT, but it is more concentrated in the first peak. However, a trimodal structure is seen in the diurnal variation in amount, with the peaks at 0400–0800 LT, 2000–2100 LT, and 1300–1400 LT, respectively, and the amount is also more concentrated in the first two peaks.
Furthermore, Figure 3c,d shows the diurnal urban-rural differences in the frequency and average amount of hourly rainfall. During 2200–0600 LT and 1400–1900 LT, a higher frequency appears over Wuhan urban areas than rural areas; however, there is no obvious diurnal urban-rural difference in the average amount.
3.2. Diurnal Urban-Rural Differences in SDR Variables
A total of 743 and 736 SDR events were collected at the 20 urban stations and 20 rural stations, respectively, over the Wuhan area during the study period. The average amounts and intensity of urban SDR events are 5.32 mm and 2.35 mm/h, and those of rural SDR events are 5.80 mm and 2.62 mm/h, respectively.
The diurnal variations in frequency, amount, and intensity of SDR with different initiating times at urban and rural stations are shown in Figure 5a–c. The diurnal variations in the three variables of SDR events all reveal a bimodal structure, with the first peak during 0500–0800 LT, the second peak during 1300–1500 LT, and the valley at 1700 or 1800 LT. However, the diurnal variation in frequency is more concentrated on the first peak when compared to the amount and intensity (Figure 5a–c).
To further understand the urban-rural difference of SDR variables at different initiating times, their diurnal difference changes were calculated (Figure 5d–f). More and stronger SDR events are triggered during the night-time over Wuhan urban areas, corresponding to higher rainfall frequency, amount, and intensity. Except for the night-time, the urban SDR events initiated from 1400 to 1600 LT also show greater variability. When compared to the diurnal urban-rural difference in the hourly rainfall variables, a greater urban-rural difference is seen in the SDR variables, with a greater amount and intensity during the night-time (Figure 3a–d and Figure 5d–f). Thus, the urban environment may lead to a greater occurrence of the night-time SDR in the Wuhan area during the summer dry period.
The spatial distributions of frequency, amount, and intensity of SDR events are shown in Figure 6, respectively. An obviously greater amount and intensity are exhibited over and downwind of the urban areas, but it is also more concentrated in urban areas during the night-time (Figure 6c–f). However, there is no significant spatial urban-rural difference in SDR frequency (Figure 6a,b). Therefore, a greater urban-rural difference appears in the amount and intensity of SDR events over the Wuhan area during the study period, especially compared with hourly rainfall.
3.3. UHI-Induced Impacts on SDR
The peak of diurnal variation appears at the night-time over the Wuhan urban area (Figure 7). Therefore, the impacts of nocturnal UHI-induced thermal perturbation on favorable conditions for rainfalls are examined.
A total of 572 urban SDR events are collected at the urban stations during the study period. They are classified further into 262 SDR events with strong UHI and 310 SDR with weak UHI, based on the UHIIA within the six hours prior to the initiating rainfall time. The average amount and intensity of SDR with strong UHI are 3.67 mm and 1.62 mm/h, and those with weak UHI are 3.01 mm and 1.43 mm/h, respectively.
A bimodal structure is exhibited in the diurnal variations of SDR frequency with different UHI backgrounds, in which the peaks of SDR with strong UHI appear at 0800 LT and 1400 LT, while those with weak UHI appear at 0900 LT and 1500 LT, respectively (Figure 8a). Nevertheless, a completely different diurnal change is exhibited under different UHII background in the amount and intensity of SDR (Figure 8b,c). The amount and intensity of SDR with strong UHI also exhibit two peaks, which are 0300 LT and 1300 LT. However, a unimodal structure appears in the diurnal variation of the amount and intensity of SDR with weak UHI, with the maximum at 0700 LT. In addition, the diurnal variation of urban SDR events with strong UHI exhibit an earlier shift during the night-time than that of events with weak UHI (Figure 8a–c).
Figure 8d–f shows the different diurnal variations between SDR with strong UHI and weak UHI. The SDR with strong UHI shows a greater amount and intensity during 0000–0400 LT and 1300–1700 LT, especially compared to frequency. Therefore, an obvious greater enhancement in the SDR amount and intensity during the night-time and afternoon is detected in Wuhan urban areas, with an increasing UHI before the SDR initiated.
The spatial distribution of the difference in variables between SDR with strong UHI and weak UHI shows that nearly 90% of urban stations show a positive amount and intensity, and 70% of them passed the test of statistical significance at the 90% confidence level (Figure 9c,e). Under the southwest winds in the lower atmosphere, a significant enhancement is observed in downwind portions of the urban areas, with an increasing UHI before the SDR initiated. Especially during the night-time, 95% and 100% of urban stations show positive SDR amount and intensity differences between strong UHI and weak UHI events, respectively (Figure 9d,f). This positive difference is obviously greater at night-time when compared to all events, and it is distributed throughout the urban areas.
Furthermore, the spatial distributions of the mean SAT within 5 h prior to the initiating time of urban SDR events with strong UHI, weak UHI, and their difference are shown in Figure 10. A greater warm center of the SAT difference is observed over and downwind of the urban areas between the SDR events with strong UHI and weak UHI. Moreover, the warmer area generally corresponded to stronger SDR, when comparing the amount and intensity of urban SDR events with strong UHI and weak UHI (Figure 9c,e and Figure 10c).
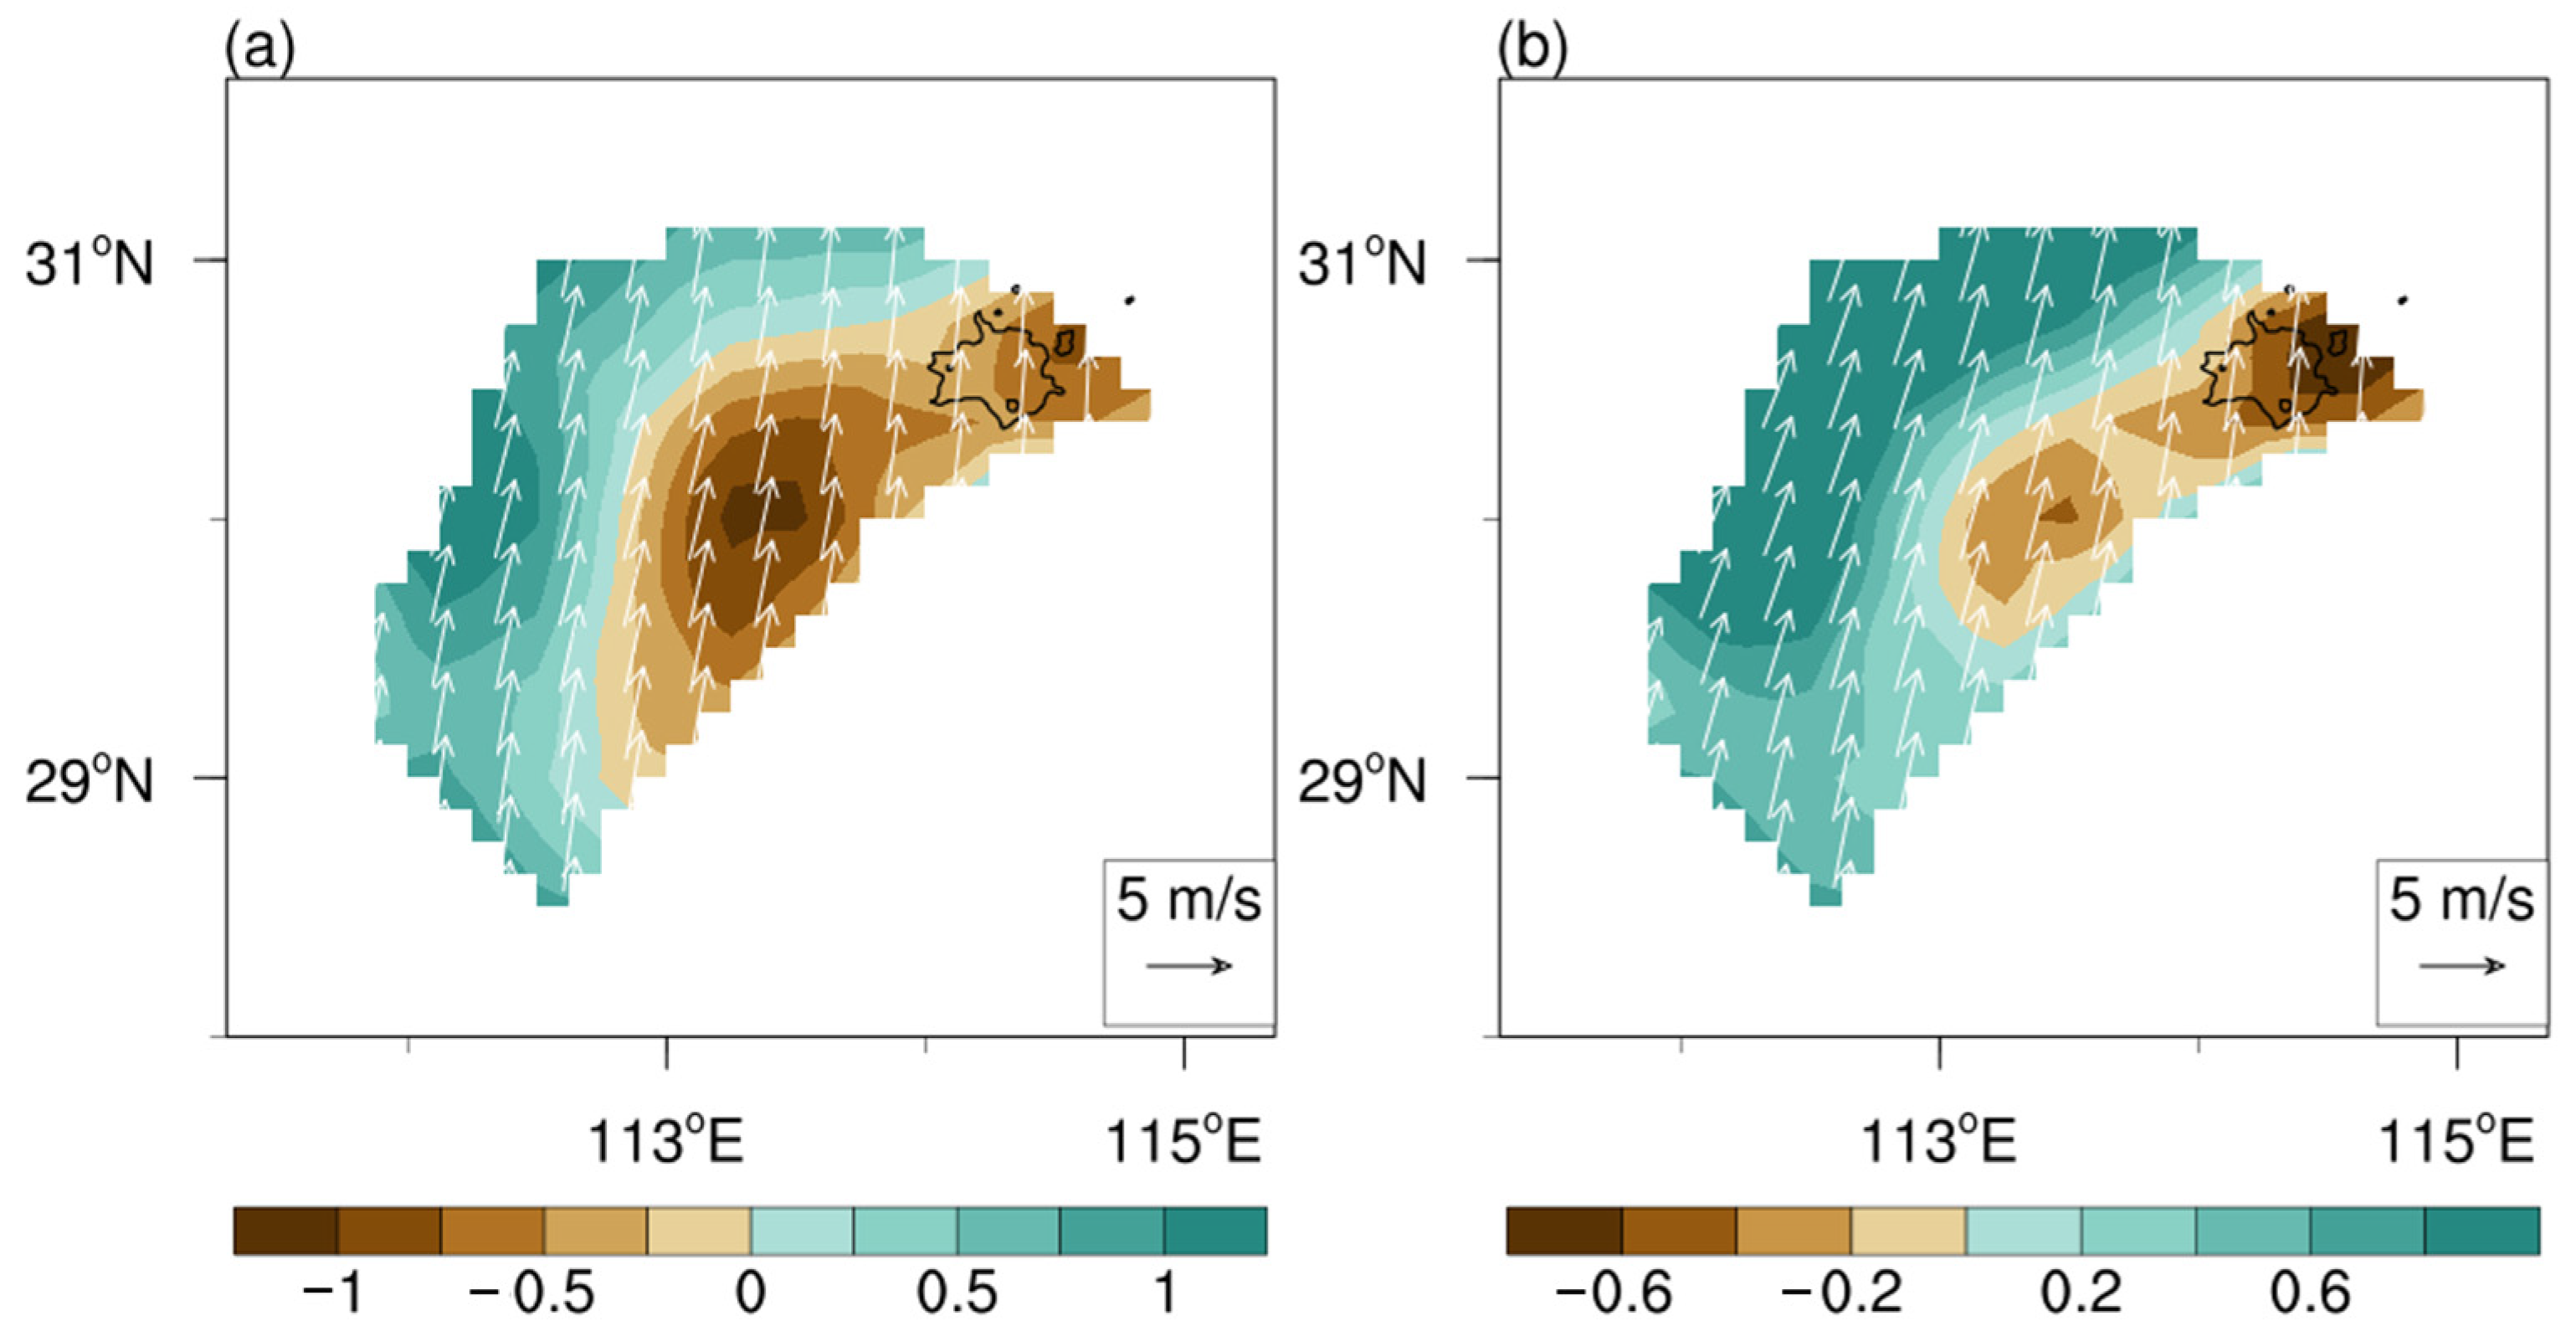
The water vapor flux divergence at 925 hPa at 0200 LT in the Jianghan Plain shows that a nocturnal convergence appears over the center of the Jianghan Plain (Figure 11a). The nocturnal water vapor convergence might explain the aforementioned greater hourly rainfall and SDR at night-time over Wuhan (Figure 3 and Figure 5). However, the nocturnal convergence appears over and downwind of Wuhan urban areas when the urban SDR events are affected by strong UHI during the night-time (Figure 11b). This indicates that the UHI-thermal effect concentrates the widespread nocturnal water vapor flux convergence zone on the Wuhan urban areas, and enhances the urban-rural difference, which is conducive to developing and maintaining urban rainfall events during night-time.
4. Discussion
The diurnal variations of SDR events also show a bimodal structure. The morning peak may be caused by the interaction between the nocturnal boundary layer low-level jet, aligned with the southwesterly synoptic-scale flow, which carries abundant moisture, and the mechanical lifting by the windward side of the Dabie mountain area, which is located downwind Wuhan [53]. The afternoon peak may be due to the surface heating [54].
There are some uncertainties in this work. First, only a specific period of a few years is considered in this study, although many rainfall variables of summer rainfall events during the entire study period have been analyzed. It is well known that rainfall events vary with different large-scale circulation and/or mesoscale systems. Other processes may also play an important role in explaining the diurnal urban-rural differences in rainfall events besides the UHI-induced thermal perturbation effect highlighted in this work. For example, Ganeshan and Murtugudde [30] suggested that the urban frictional convergence, when accompanied by a nocturnal UHI, can significantly modify the spatial position of a storm during night-time. The combined influence of topography and the urban thermal process can increase summer rainfall frequencies in the evening or early morning [29]. It was mentioned by Fu [55] that the intensified rainfall zone of each city cluster is different because of their unique geography and structure. Li [56] also found that terrain effects play an important role in affecting rainfall frequency, amount, and intensity. Therefore, UHI-induced thermal perturbation may not be the only and/or direct cause of the diurnal urban-rural differences in rainfall events. The complex interactions between land surface, planetary boundary layer, aerosols, atmospheric dynamics, and thermodynamic processes under different environmental and atmospheric conditions may help to explain the detailed differences in rainfall modification in various urban areas.
Second, the diurnal variations in rainfall events over neighboring non-urban areas are taken as the reference group to quantify the urbanization impacts on urban areas for this study. This urban-rural difference method assumes that both areas share the same meteorological conditions. However, Wuhan is surrounded by mountains with complex terrains, which will introduce some differences between urban and rural areas even without the impacts of urbanization. To minimize these uncertainties and further our study, in future work mesoscale models may be run to quantify the urbanization impacts on rainfall events and explore detailed the physical processes involved.
Although there are a few questions which need to be addressed in the future, the key conclusions drawn in the study are robust, and these are of importance to the planning and management of the city. In particular, the bimodal structure characteristic of hourly rainfall and the enhancement of the urban SDR at night-time and afternoon due to urbanization effects could be considered in designing and managing the urban sewage infrastructure so as to drain the urban floods in a more timely manner during the peaks of hourly precipitation frequency and intensity.
5. Conclusions
This paper aims to understand the urbanization-induced variations in diurnal short-duration rainfall events in Wuhan, an inland city in China, by using the hourly surface observed precipitation data during the summer dry period in 2012–2018. The main findings can be summarized as follows:
- The diurnal variation in the frequency of hourly rainfall shows a bimodal structure over the Wuhan area, with the peaks at night-time (2200–0600 Local Time) and afternoon (1400–1900 Local Time), respectively. More urban rainfall is concentrated at night-time and afternoon, which differs from the pattern of rural rainfall. Obviously greater frequency is exhibited over and downwind of Wuhan urban areas but is more concentrated on the urban areas during the night-time;
- The diurnal variations of SDR events also reveal a bimodal structure over the Wuhan area, with peaks in the early morning (0600–1200 Local Time) and afternoon. An enhancement in urban SDR events can be seen during the night-time when compared to the rural events, especially in amount and intensity. More numerous and intense SDR events occur over and downwind of urban areas but they are also more concentrated on the urban areas during the night-time. A greater diurnal urban-rural difference in SDR variables is detected than that in hourly rainfall during the dry summer over the Wuhan area;
- An obvious difference exists in the diurnal variations in urban SDR events when affected by different urban heat islands before the event initiated. There is an enhancement in the night-time and afternoon SDR events when urban heat islands increased, and this is detectable in the frequency, amount, and intensity of SDR events. Over 95% of urban stations show a significantly positive difference in SDR amount and intensity between strong UHI and weak UHI events, and they are distributed throughout the urban area. The warmer area before urban SDR initiated corresponded to the area of stronger SDR when comparing urban SDR events with strong UHI and weak UHI; The nocturnal UHII peak enhances the positive urban-rural difference in water vapor flux convergence, which is essential to the triggering, development, and maintenance of SDR.
Author Contributions
G.R. contributed the central idea, G.R., S.K.T. and Y.M. designed the study, Y.M. performed the calculations and wrote the main manuscript, G.R. and S.K.T. revised the manuscript. All authors have read and agreed to the published version of the manuscript.
Funding
This research was funded by the National Key R&D Program of China (2018YFA0605603).
Data Availability Statement
The data used in the manuscript are publicly available for ERA-5 (https://www.ecmwf.int/en/forecasts/dataset/ecmwf-reanalysis-v5 (accessed on 10 March 2021)), DMSP/OLS (https://ngdc.noaa.gov/eog/dmsp/downloadV4composites.html (accessed on 10 March 2021)), and the LULC from the Resources and Environmental Sciences Data Center, Chinese Academy of Sciences (https://www.resdc.cn/data.aspx?DATAID=264 (accessed on 10 March 2021)).
Conflicts of Interest
The authors declare no conflict of interest.
References
- Horton, R.E. Thunderstorm-Breeding Spots. Mon. Weather Rev. 1921, 49, 193. [Google Scholar] [CrossRef]
- Changnon, S.A.; Huff, F.A.; Semonin, R.G. METROMEX: An Investigation of Inadvertent Weather Modification. Bull. Am. Meteorol. Soc. 1971, 52, 958–968. [Google Scholar] [CrossRef]
- Shepherd, J.M. A Review of Current Investigations of Urban-Induced Rainfall and Recommendations for the Future. Earth Interact. 2005, 9, 1–27. [Google Scholar] [CrossRef] [Green Version]
- Huff, F.A.; Changnon, S.A. Precipitation Modification by Major Urban Areas. Bull. Am. Meteorol. Soc. 1973, 54, 1220–1232. [Google Scholar] [CrossRef]
- Shepherd, J.M.; Pierce, H.; Negri, A.J. Rainfall Modification by Major Urban Areas: Observations from Spaceborne Rain Radar on the TRMM Satellite. J. Appl. Meteorol. 2002, 41, 689–701. [Google Scholar] [CrossRef]
- Yang, P.; Ren, G.; Yan, P. Evidence for a Strong Association of Short-Duration Intense Rainfall with Urbanization in the Beijing Urban Area. J. Clim. 2017, 30, 5851–5870. [Google Scholar] [CrossRef]
- Yonetani, T. Increase in Number of Days with Heavy Precipitation in Tokyo Urban Area. J. Appl. Meteorol. 1982, 21, 1466–1471. [Google Scholar] [CrossRef]
- Huff, F.A. Urban effects on the distribution of heavy convective rainfall. Water Resour. Res. 1975, 11, 889–896. [Google Scholar] [CrossRef]
- Landsberg, H.E. Man-Made Climatic Changes: Man’s activities have altered the climate of urbanized areas and may affect global climate in the future. Science 1970, 170, 1265–1274. [Google Scholar] [CrossRef]
- Huff, F.A.; Changnon, S.A. Climatological Assessment of Urban Effects on Precipitation at St. Louis. J. Appl. Meteorol. 1972, 11, 823–842. [Google Scholar] [CrossRef]
- Liu, J.; Niyogi, D. Meta-analysis of urbanization impact on rainfall modification. Sci. Rep. 2019, 9, 7301. [Google Scholar] [CrossRef] [Green Version]
- Bornstein, R.; Lin, Q. Urban heat islands and summertime convective thunderstorms in Atlanta: Three case studies. Atmos. Environ. 2000, 34, 507–516. [Google Scholar] [CrossRef]
- Ganeshan, M.; Murtugudde, R.; Imhoff, M.L. A multi-city analysis of the UHI-influence on warm season rainfall. Urban Clim. 2013, 6, 1–23. [Google Scholar] [CrossRef]
- Guo, X.; Fu, D.; Wang, J. Mesoscale convective precipitation system modified by urbanization in Beijing City. Atmos. Res. 2006, 82, 112–126. [Google Scholar] [CrossRef]
- Shem, W.; Shepherd, M. On the impact of urbanization on summertime thunderstorms in Atlanta: Two numerical model case studies. Atmos. Res. 2009, 92, 172–189. [Google Scholar] [CrossRef]
- Niyogi, D.; Holt, T.; Zhong, S.; Pyle, P.C.; Basara, J. Urban and land surface effects on the 30 July 2003 mesoscale convective system event observed in the southern Great Plains. J. Geophys. Res. 2006, 111, D19. [Google Scholar] [CrossRef] [Green Version]
- Rosenfeld, D. Suppression of rain and snow by urban and industrial air pollution. Science 2000, 287, 1793–1796. [Google Scholar] [CrossRef]
- Rosenfeld, D.; Lohmann, U.; Raga, G.B.; O’Dowd, C.D.; Kulmala, M.; Fuzzi, S.; Reissell, A.; Andreae, M.O. Flood or drought: How do aerosols affect precipitation? Science 2008, 321, 1309–1313. [Google Scholar] [CrossRef] [Green Version]
- Cotton, W.R.; van den Heever, S.C. Urban Aerosol Impacts on Downwind Convective Storms. J. Appl. Meteorol. Climatol. 2007, 46, 828–850. [Google Scholar] [CrossRef] [Green Version]
- Baik, J.-J.; Kim, Y.-H.; Chun, H.-Y. Dry and Moist Convection Forced by an Urban Heat Island. J. Appl. Meteorol. 2001, 40, 1462–1475. [Google Scholar] [CrossRef]
- Dou, J.; Wang, Y.; Bornstein, R.; Miao, S. Observed Spatial Characteristics of Beijing Urban Climate Impacts on Summer Thunderstorms. J. Appl. Meteorol. Climatol. 2015, 54, 94–105. [Google Scholar] [CrossRef]
- Liang, P.; Ding, Y. The long-term variation of extreme heavy precipitation and its link to urbanization effects in Shanghai during 1916–2014. Adv. Atmos. Sci. 2017, 34, 321–334. [Google Scholar] [CrossRef]
- Wu, M.; Luo, Y.; Chen, F.; Wong, W.K. Observed Link of Extreme Hourly Precipitation Changes to Urbanization over Coastal South China. J. Appl. Meteorol. Climatol. 2019, 58, 1799–1819. [Google Scholar] [CrossRef]
- Ohsawa, T.; Ueda, H.; Hayashi, T.; Watanabe, A.; Matsumoto, J. Diurnal Variations of Convective Activity and Rainfall in Tropical Asia. J. Meteorol. Soc. Japan. Ser. II 2001, 79, 333–352. [Google Scholar] [CrossRef] [Green Version]
- Oki, T.; Musiake, K. Seasonal Change of the Diurnal Cycle of Precipitation over Japan and Malaysia. J. Appl. Meteorol. 1994, 33, 1445–1463. [Google Scholar] [CrossRef]
- Zhang, H.; Zhai, P. Temporal and spatial characteristics of extreme hourly precipitation over eastern China in the warm season. Adv. Atmos. Sci. 2011, 28, 1177–1183. [Google Scholar] [CrossRef]
- Huff, F.A.; Vogel, J.L. Urban, Topographic and Diurnal Effects on Rainfall in the St. Louis Region. J. Appl. Meteorol. 1978, 17, 565–577. [Google Scholar] [CrossRef]
- IPCC. Working Group III Contribution to the Fifth Assessment Report of the Intergovernmental Panel on Climate Change. In Climate Change 2014: Mitigation of Climate Change; Ottmar, E., Ramón, P.-M., Youba, S., Jan, C.M., Ellie, F., Susanne, K., Kristin, S., Anna, A., Ina, B., Steffen, B., et al., Eds.; Cambridge University Press: Cambridge, UK; New York, NY, USA, 2014. [Google Scholar]
- Sun, J.; Yang, B. Meso-β Scale Torrential Rain Affected by Topography and the Urban Circulation. Chin. J. Atmos. Sci. 2008, 6, 1352–1364. (In Chinese) [Google Scholar]
- Ganeshan, M.; Murtugudde, R. Nocturnal propagating thunderstorms may favor urban “hot-spots”: A model-based study over Minneapolis. Urban Clim. 2015, 14, 606–621. [Google Scholar] [CrossRef]
- Dixon, P.G.; Mote, T.L. Patterns and Causes of Atlanta’s Urban Heat Island–Initiated Precipitation. J. Appl. Meteorol. 2003, 42, 1273–1284. [Google Scholar] [CrossRef]
- Zhong, S.; Yang, X.-Q. Ensemble simulations of the urban effect on a summer rainfall event in the Great Beijing Metropolitan Area. Atmos. Res. 2015, 153, 318–334. [Google Scholar] [CrossRef]
- Fang, J.; Bai, A.; Xiao, K.; Tian, W. Analysis of climatic characteristics and causes of the drought in Shaanxi. Chin. J. Agric. Res. Arid Areas 2009, 27, 28–34. (In Chinese) [Google Scholar]
- Luo, B.; Zhang, C. Characteristics of droughts and floods in Hunan during the drought period and their correlation with the early circulation. Chin. J. Meteorol. Sci. Technol. 2009, 37, 19–24. (In Chinese) [Google Scholar]
- Spinoni, J.; Naumann, G.; Carrao, H.; Barbosa, P.; Vogt, J. World drought frequency, duration, and severity for 1951-2010. Int. J. Climatol. 2014, 34, 2792–2804. [Google Scholar] [CrossRef] [Green Version]
- Guo, J.; Su, T.; Li, Z.; Miao, Y.; Li, J.; Liu, H.; Xu, H.; Cribb, M.; Zhai, P. Declining frequency of summertime local-scale precipitation over eastern China from 1970 to 2010 and its potential link to aerosols. Geophys. Res. Lett. 2017, 44, 5700–5708. [Google Scholar] [CrossRef]
- Li, J.; Yu, R.; Zhou, T. Seasonal Variation of the Diurnal Cycle of Rainfall in Southern Contiguous China. J. Clim. 2008, 21, 6036–6043. [Google Scholar] [CrossRef]
- Li, Y.; Ren, Z.; Chen, G.; Miao, J.; Liu, F. Difference and correlation analysis between self-registered and automatically observed rainfall. Chin. J. Meteorol. Sci. Technol. 2011, 39, 227–230. (In Chinese) [Google Scholar] [CrossRef]
- Ren, Z.; Feng, M.; Zhang, H.; Ju, X.; Wang, Y. Differences and correlations between automatic and manually observed rainfall. Chin. J. Appl. Meteorol. Sci. 2007, 18, 358–364. (In Chinese) [Google Scholar]
- Ren, Z.; Zhao, P.; Zhang, Q.; Zhang, Z.; Cao, L.; Yang, Y.; Zouu, F.; Zhao, Y.; Zhao, H.; Chen, Z. Quality control methods for hourly precipitation data from automatic stations nationwide. Chin. J. Meteorol. Mon. 2010, 36, 123–132. (In Chinese) [Google Scholar]
- Wang, X.; Xiao, P.; Feng, X.; Li, H. Large-scale urban land use information extraction in China based on DMSP/OLS data. Chin. J. Remote Sens. Nat. Resour. 2013, 25, 159–164. (In Chinese) [Google Scholar]
- Pinto, O.; Pinto, I.R.C.A.; Ferro, M.A.S. A study of the long-term variability of thunderstorm days in southeast Brazil. J. Geophys. Res. Atmos. 2013, 118, 5231–5246. [Google Scholar] [CrossRef]
- Miao, S.; Chen, F.; Li, Q.; Fan, S. Impacts of Urban Processes and Urbanization on Summer Precipitation: A Case Study of Heavy Rainfall in Beijing on 1 August 2006. J. Appl. Meteorol. Climatol. 2011, 50, 806–825. [Google Scholar] [CrossRef]
- Ashley, W.S.; Bentley, M.L.; Stallins, J.A. Urban-induced thunderstorm modification in the Southeast United States. Clim. Chang. 2011, 113, 481–498. [Google Scholar] [CrossRef]
- Paliaga, G.; Faccini, F.; Luino, F.; Turconi, L. A spatial multicriteria prioritizing approach for geo-hydrological risk mitigation planning in small and densely urbanized Mediterranean basins. Nat. Hazards Earth Syst. Sci. 2019, 19, 53–69. [Google Scholar] [CrossRef] [Green Version]
- Jia, W.; Ren, G.; Tysa, S.K.; Zhang, P.; Wen, K.; Ren, Y. Urban heat island effect and its contribution to observed temperature increase at Wuhan station, Central China. J. Trop. Meteorol. 2019, 25, 102–113. [Google Scholar] [CrossRef]
- Ren, G.Y.; Chu, Z.Y.; Chen, Z.H.; Ren, Y.Y. Implications of temporal change in urban heat island intensity observed at Beijing and Wuhan stations. Geophys. Res. Lett. 2007, 34, L05711. [Google Scholar] [CrossRef]
- Shen, H.; Huang, L.; Zhang, L.; Wu, P.; Zeng, C. Long-term and fine-scale satellite monitoring of the urban heat island effect by the fusion of multi-temporal and multi-sensor remote sensed data: A 26-year case study of the city of Wuhan in China. Remote Sens. Environ. 2016, 172, 109–125. [Google Scholar] [CrossRef]
- Wu, H.; Ye, L.-P.; Shi, W.-Z.; Clarke, K.C. Assessing the effects of land use spatial structure on urban heat islands using HJ-1B remote sensing imagery in Wuhan, China. Int. J. Appl. Earth Obs. Geoinf. 2014, 32, 67–78. [Google Scholar] [CrossRef]
- Tysa, S.K.; Ren, G.; Qin, Y.; Zhang, P.; Ren, Y.; Jia, W.; Wen, K. Urbanization Effect in Regional Temperature Series Based on a Remote Sensing Classification Scheme of Stations. J. Geophys. Res. Atmos. 2019, 124, 10646–10661. [Google Scholar] [CrossRef]
- Molina-Sanchis, I.; Lázaro, R.; Arnau-Rosalén, E.; Calvo-Cases, A. Rainfall timing and runoff: The influence of the criterion for rain event separation. J. Hydrol. Hydromech. 2016, 64, 226–236. [Google Scholar] [CrossRef] [Green Version]
- Cao, S.; Diao, Y.; Wang, J.; Liu, Y.; Raimondi, A.; Wang, J. KDE-Based Rainfall Event Separation and Characterization. Water 2023, 15, 580. [Google Scholar] [CrossRef]
- Fu, P. Diurnal Cycle of Rainfall over Yangtze and Huai River Basin during Meiyu and Analysis of a Typical Convective System in the Morning. Master’s Thesis, Nanjing University, Nanjing, China, 2016. [Google Scholar]
- Jiang, X.; Luo, Y.; Zhang, D.-L.; Wu, M. Urbanization Enhanced Summertime Extreme Hourly Precipitation over the Yangtze River Delta. J. Clim. 2020, 33, 5809–5826. [Google Scholar] [CrossRef] [Green Version]
- Fu, X.; Yang, X.Q.; Sun, X. Spatial and Diurnal Variations of Summer Hourly Rainfall Over Three Super City Clusters in Eastern China and Their Possible Link to the Urbanization. J. Geophys. Res. Atmos. 2019, 124, 5445–5462. [Google Scholar] [CrossRef]
- Li, M.; Wang, T.; Xie, M.; Zhuang, B.; Li, S.; Han, Y.; Cheng, N. Modeling of urban heat island and its impacts on thermal circulations in the Beijing–Tianjin–Hebei region, China. Theor. Appl. Climatol. 2016, 128, 999–1013. [Google Scholar] [CrossRef]
Figure 1.
Topography of Hubei Province (a) and night-time light of Jianghan Plain (b). The solid black line delineates the Wuhan area. Land use and distribution of stations in the Wuhan region (c). The unit of the terrain is m, and the black line indicates the location of Wuhan in (a); the solid grey line in (b) is the 100 m elevation contour line, and the thin black solid line in (c) delineates the Wuhan urban areas based on night-time lighting. The dots in (c) represent 76 stations in Wuhan, with red dots for urban stations, blue dots for rural stations, and black dots for the rest.
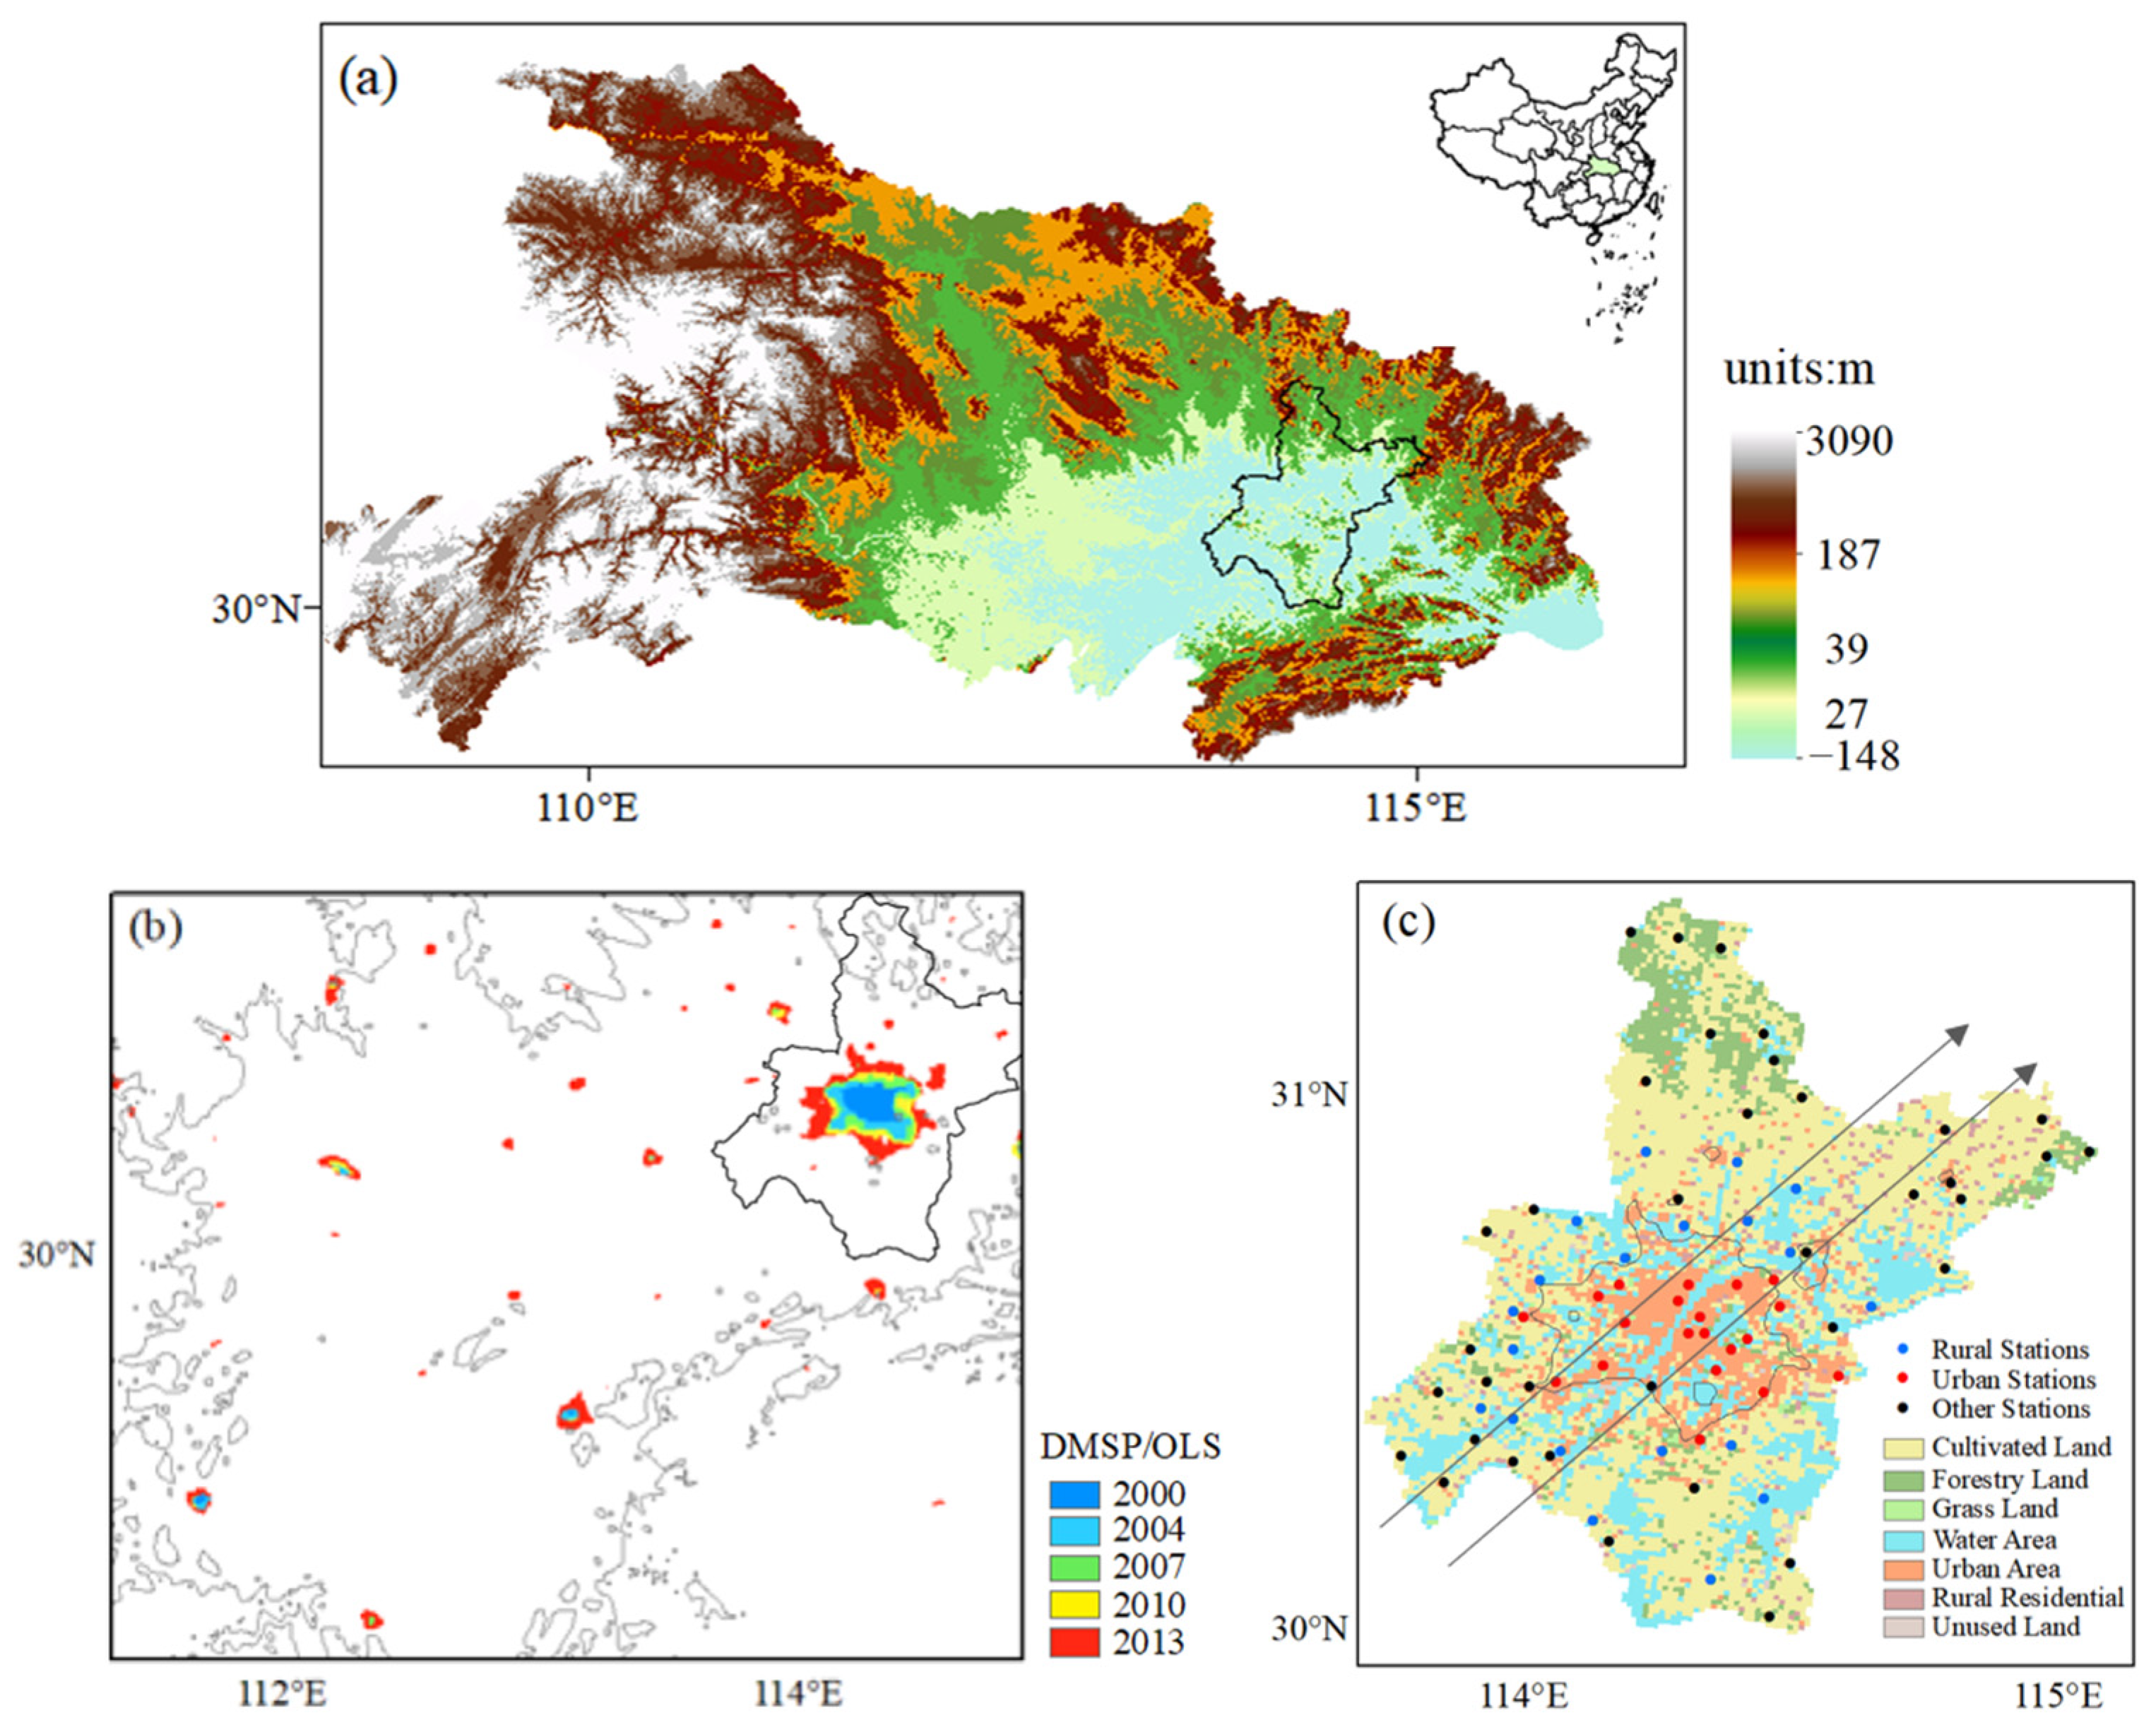
Figure 2.
Standardized anomalies of daily mean precipitation in the middle and lower reaches of the Yangtze River basin from 1 June to 15 September. The blue/pink areas are above/below 0.
Figure 2.
Standardized anomalies of daily mean precipitation in the middle and lower reaches of the Yangtze River basin from 1 June to 15 September. The blue/pink areas are above/below 0.
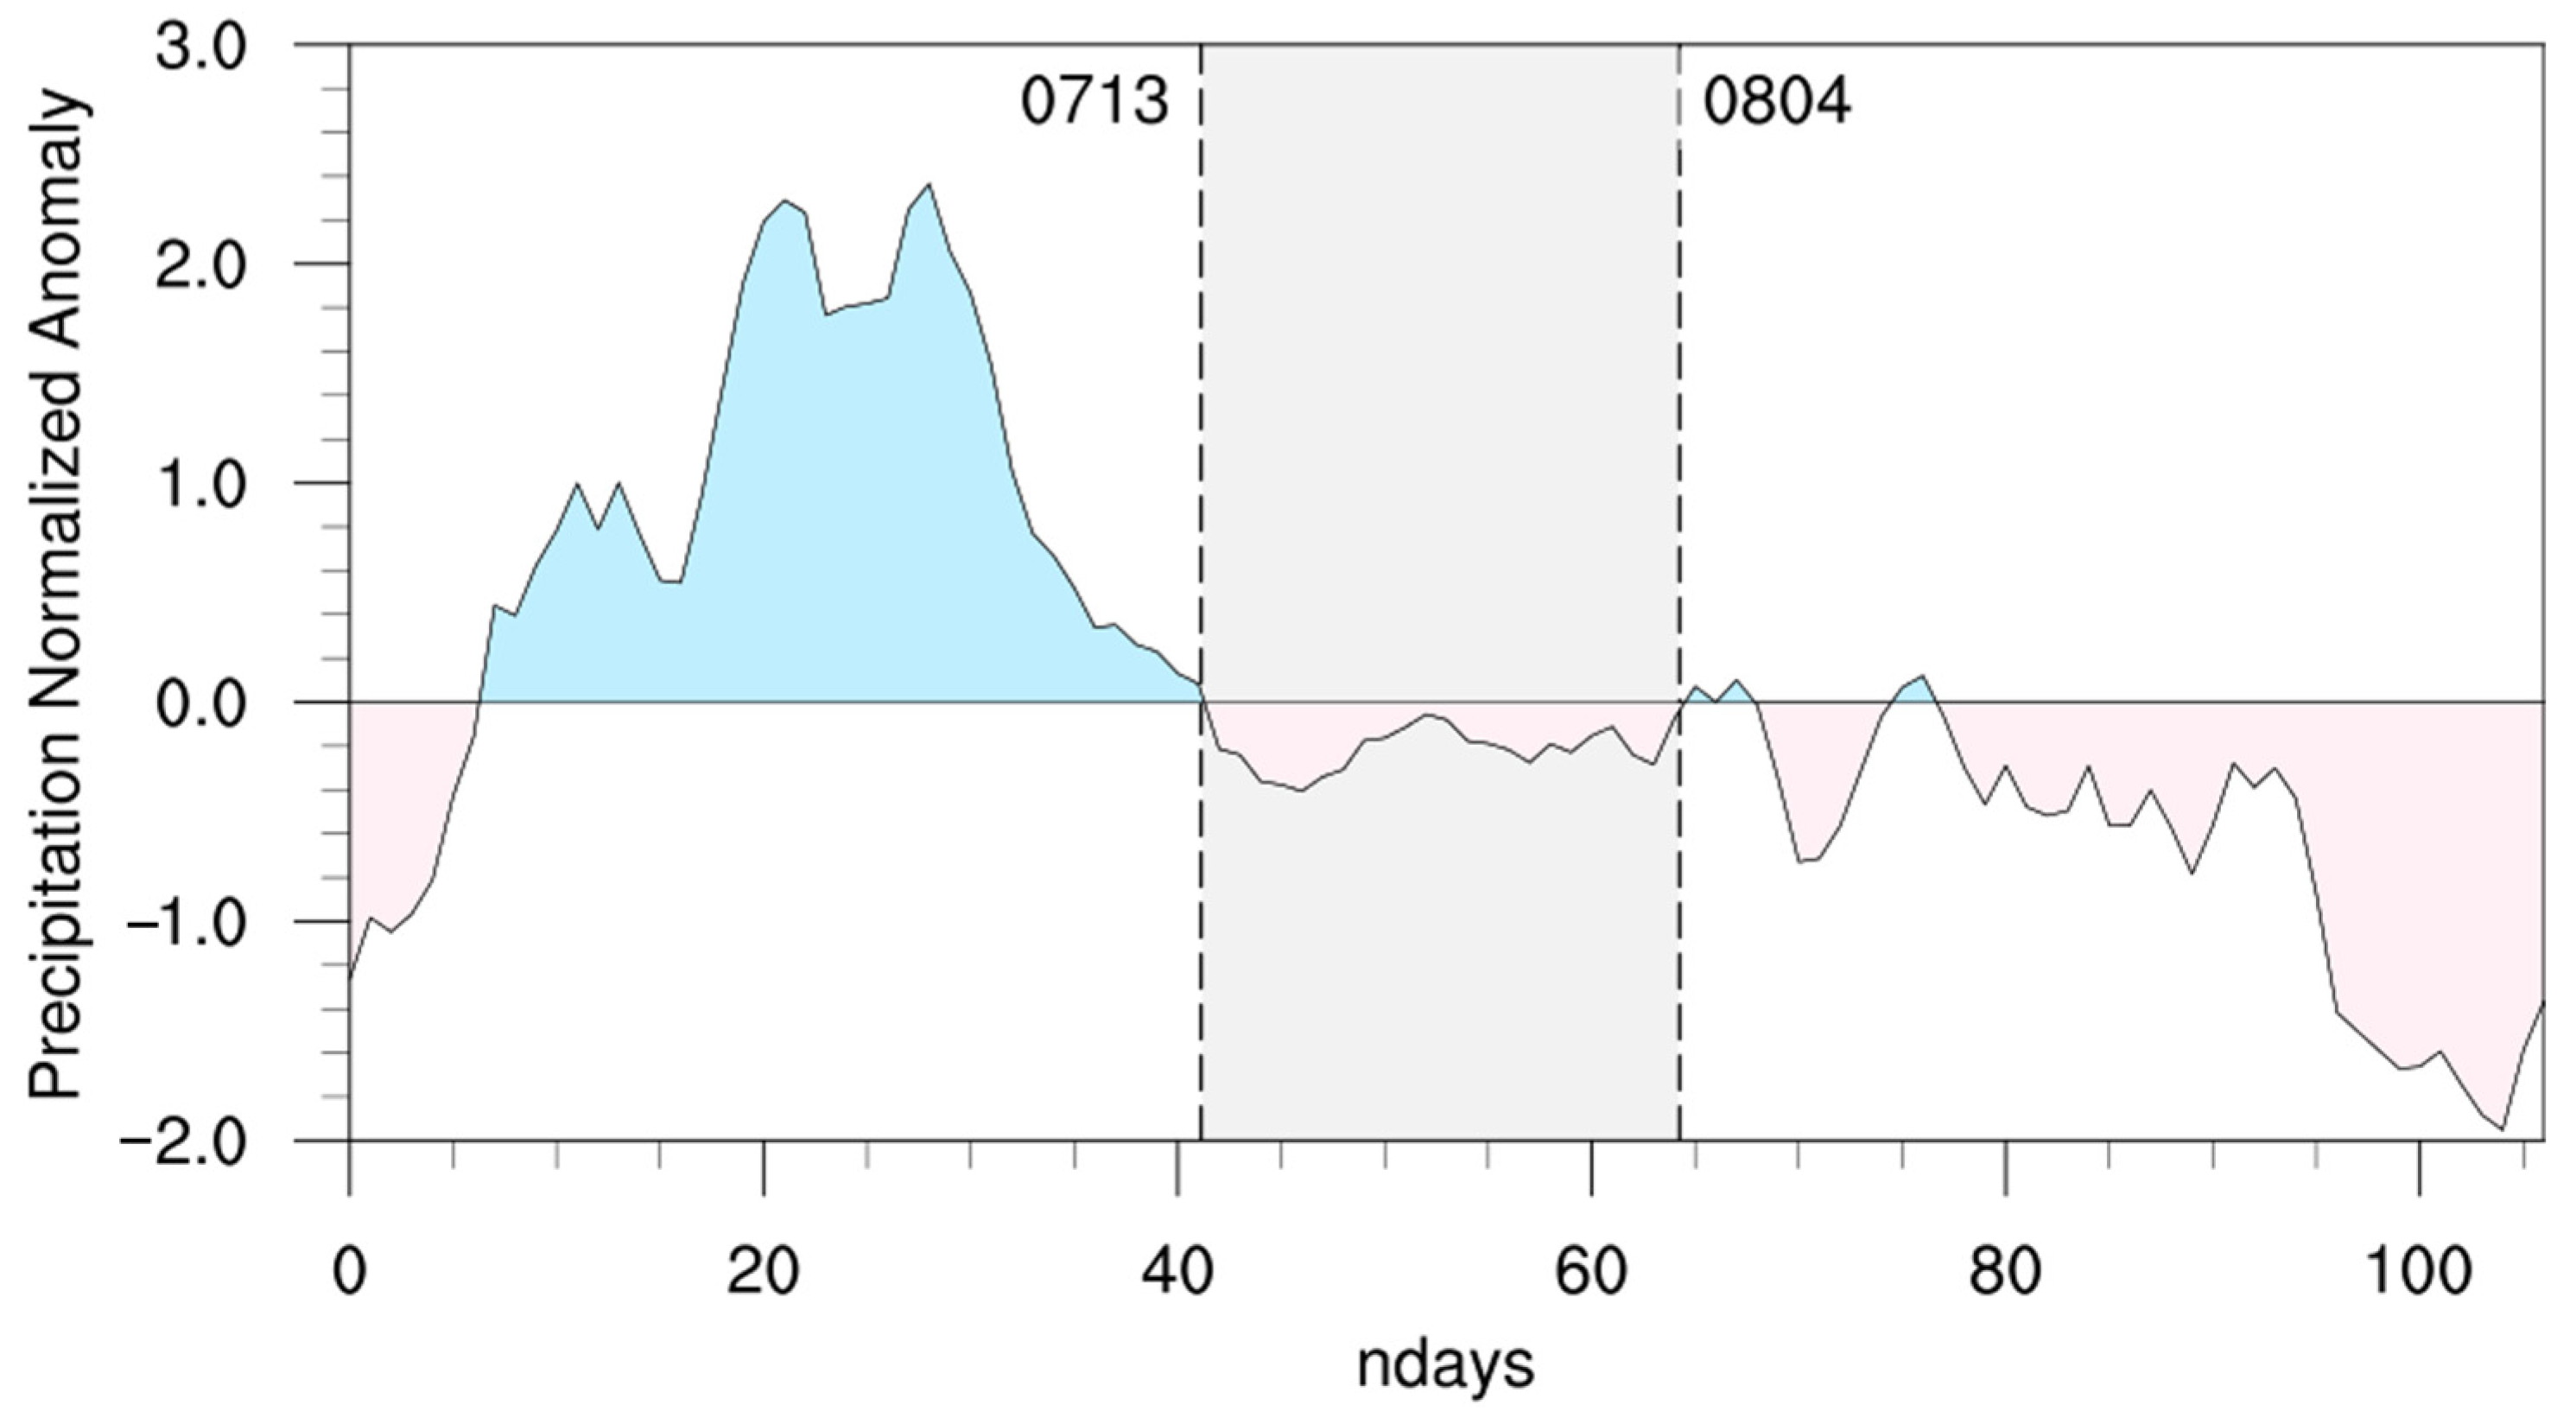
Figure 3.
The diurnal variations in rainfall frequency (a,c), average amount (b,d) at the urban and rural stations (a,b), and their difference between urban and rural stations (c,d). Red/blue bar indicates the positive/negative difference, respectively.
Figure 3.
The diurnal variations in rainfall frequency (a,c), average amount (b,d) at the urban and rural stations (a,b), and their difference between urban and rural stations (c,d). Red/blue bar indicates the positive/negative difference, respectively.

Figure 4.
Spatial distribution of rainfall frequency (a,b), average amount (c,d) anomaly in Wuhan area (a,c) and night-time (0000–0600 LT) (b,d), respectively. The units of rainfall frequency and amount are times and mm; the urban stations are shown as triangles, and the rural stations are shown as hollow circles; the thick black solid line delineates the Wuhan area, and the thin black solid line delineates the urban areas.
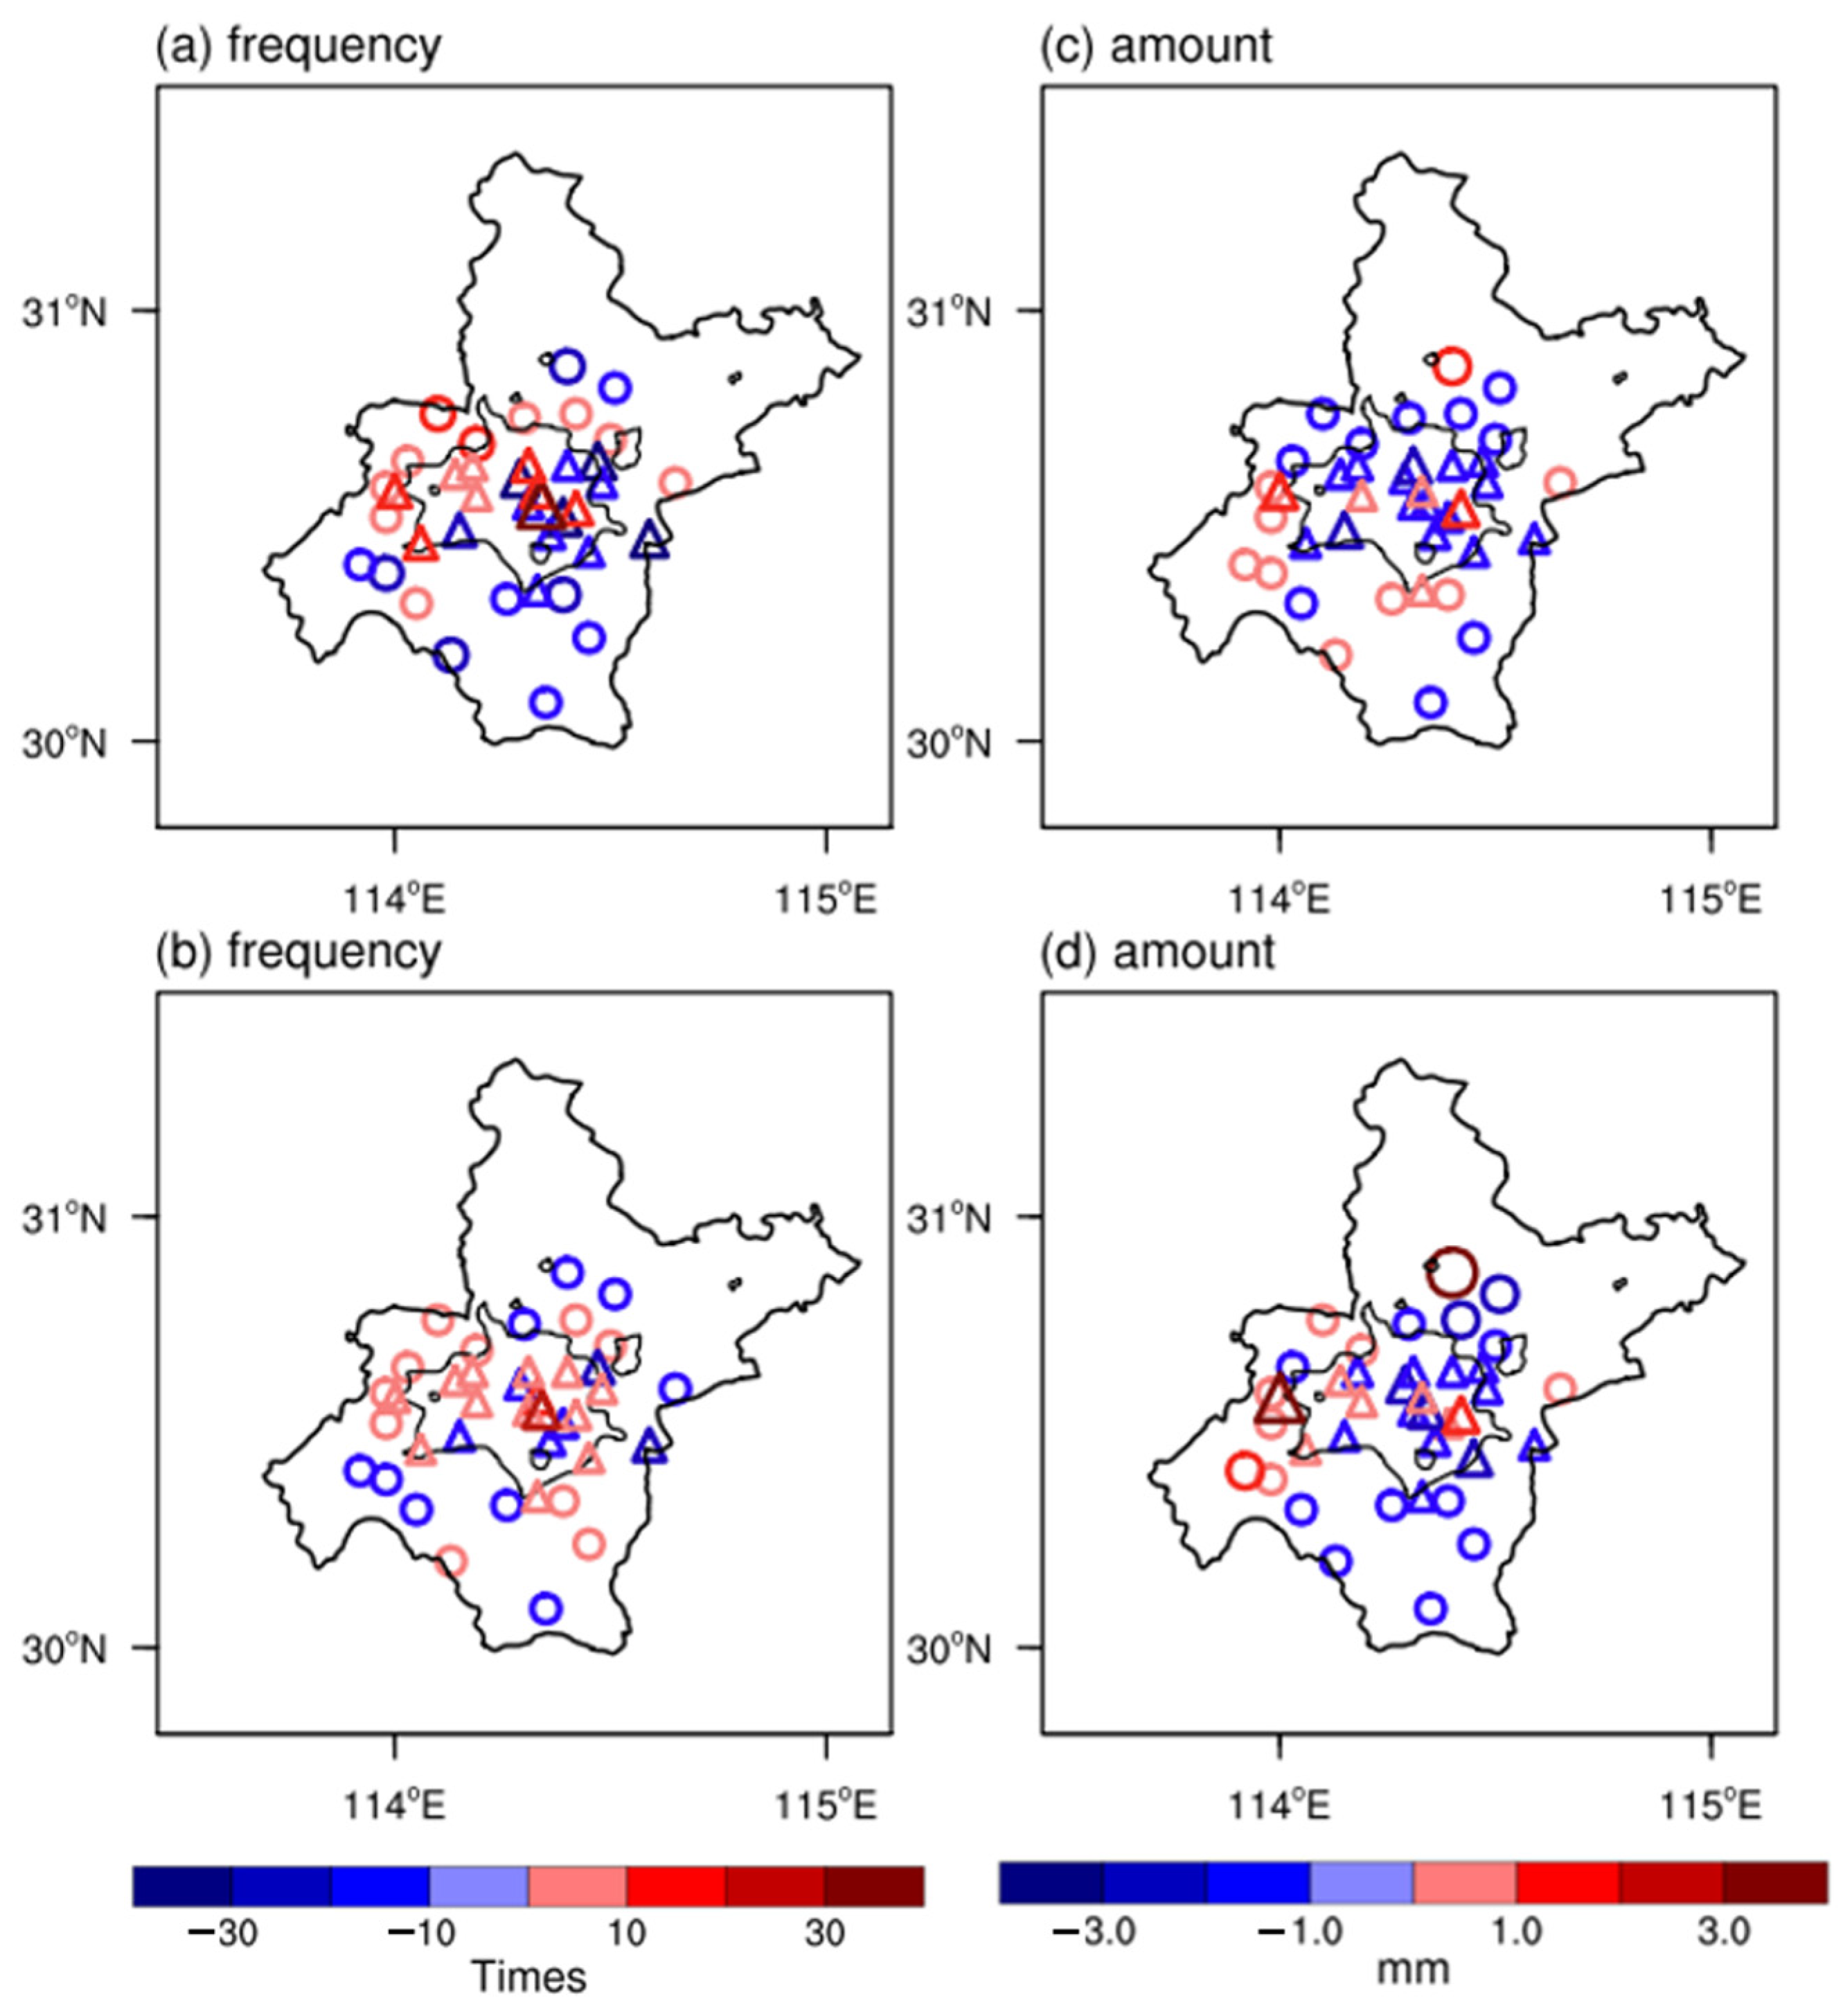
Figure 5.
The diurnal variations in SDR frequency (a,d), average amount (b,e), and average intensity (c,f) at urban and rural stations (a–c), and their differences between urban and rural stations (d–f). Red/blue bar indicates the positive/negative difference, respectively.
Figure 5.
The diurnal variations in SDR frequency (a,d), average amount (b,e), and average intensity (c,f) at urban and rural stations (a–c), and their differences between urban and rural stations (d–f). Red/blue bar indicates the positive/negative difference, respectively.
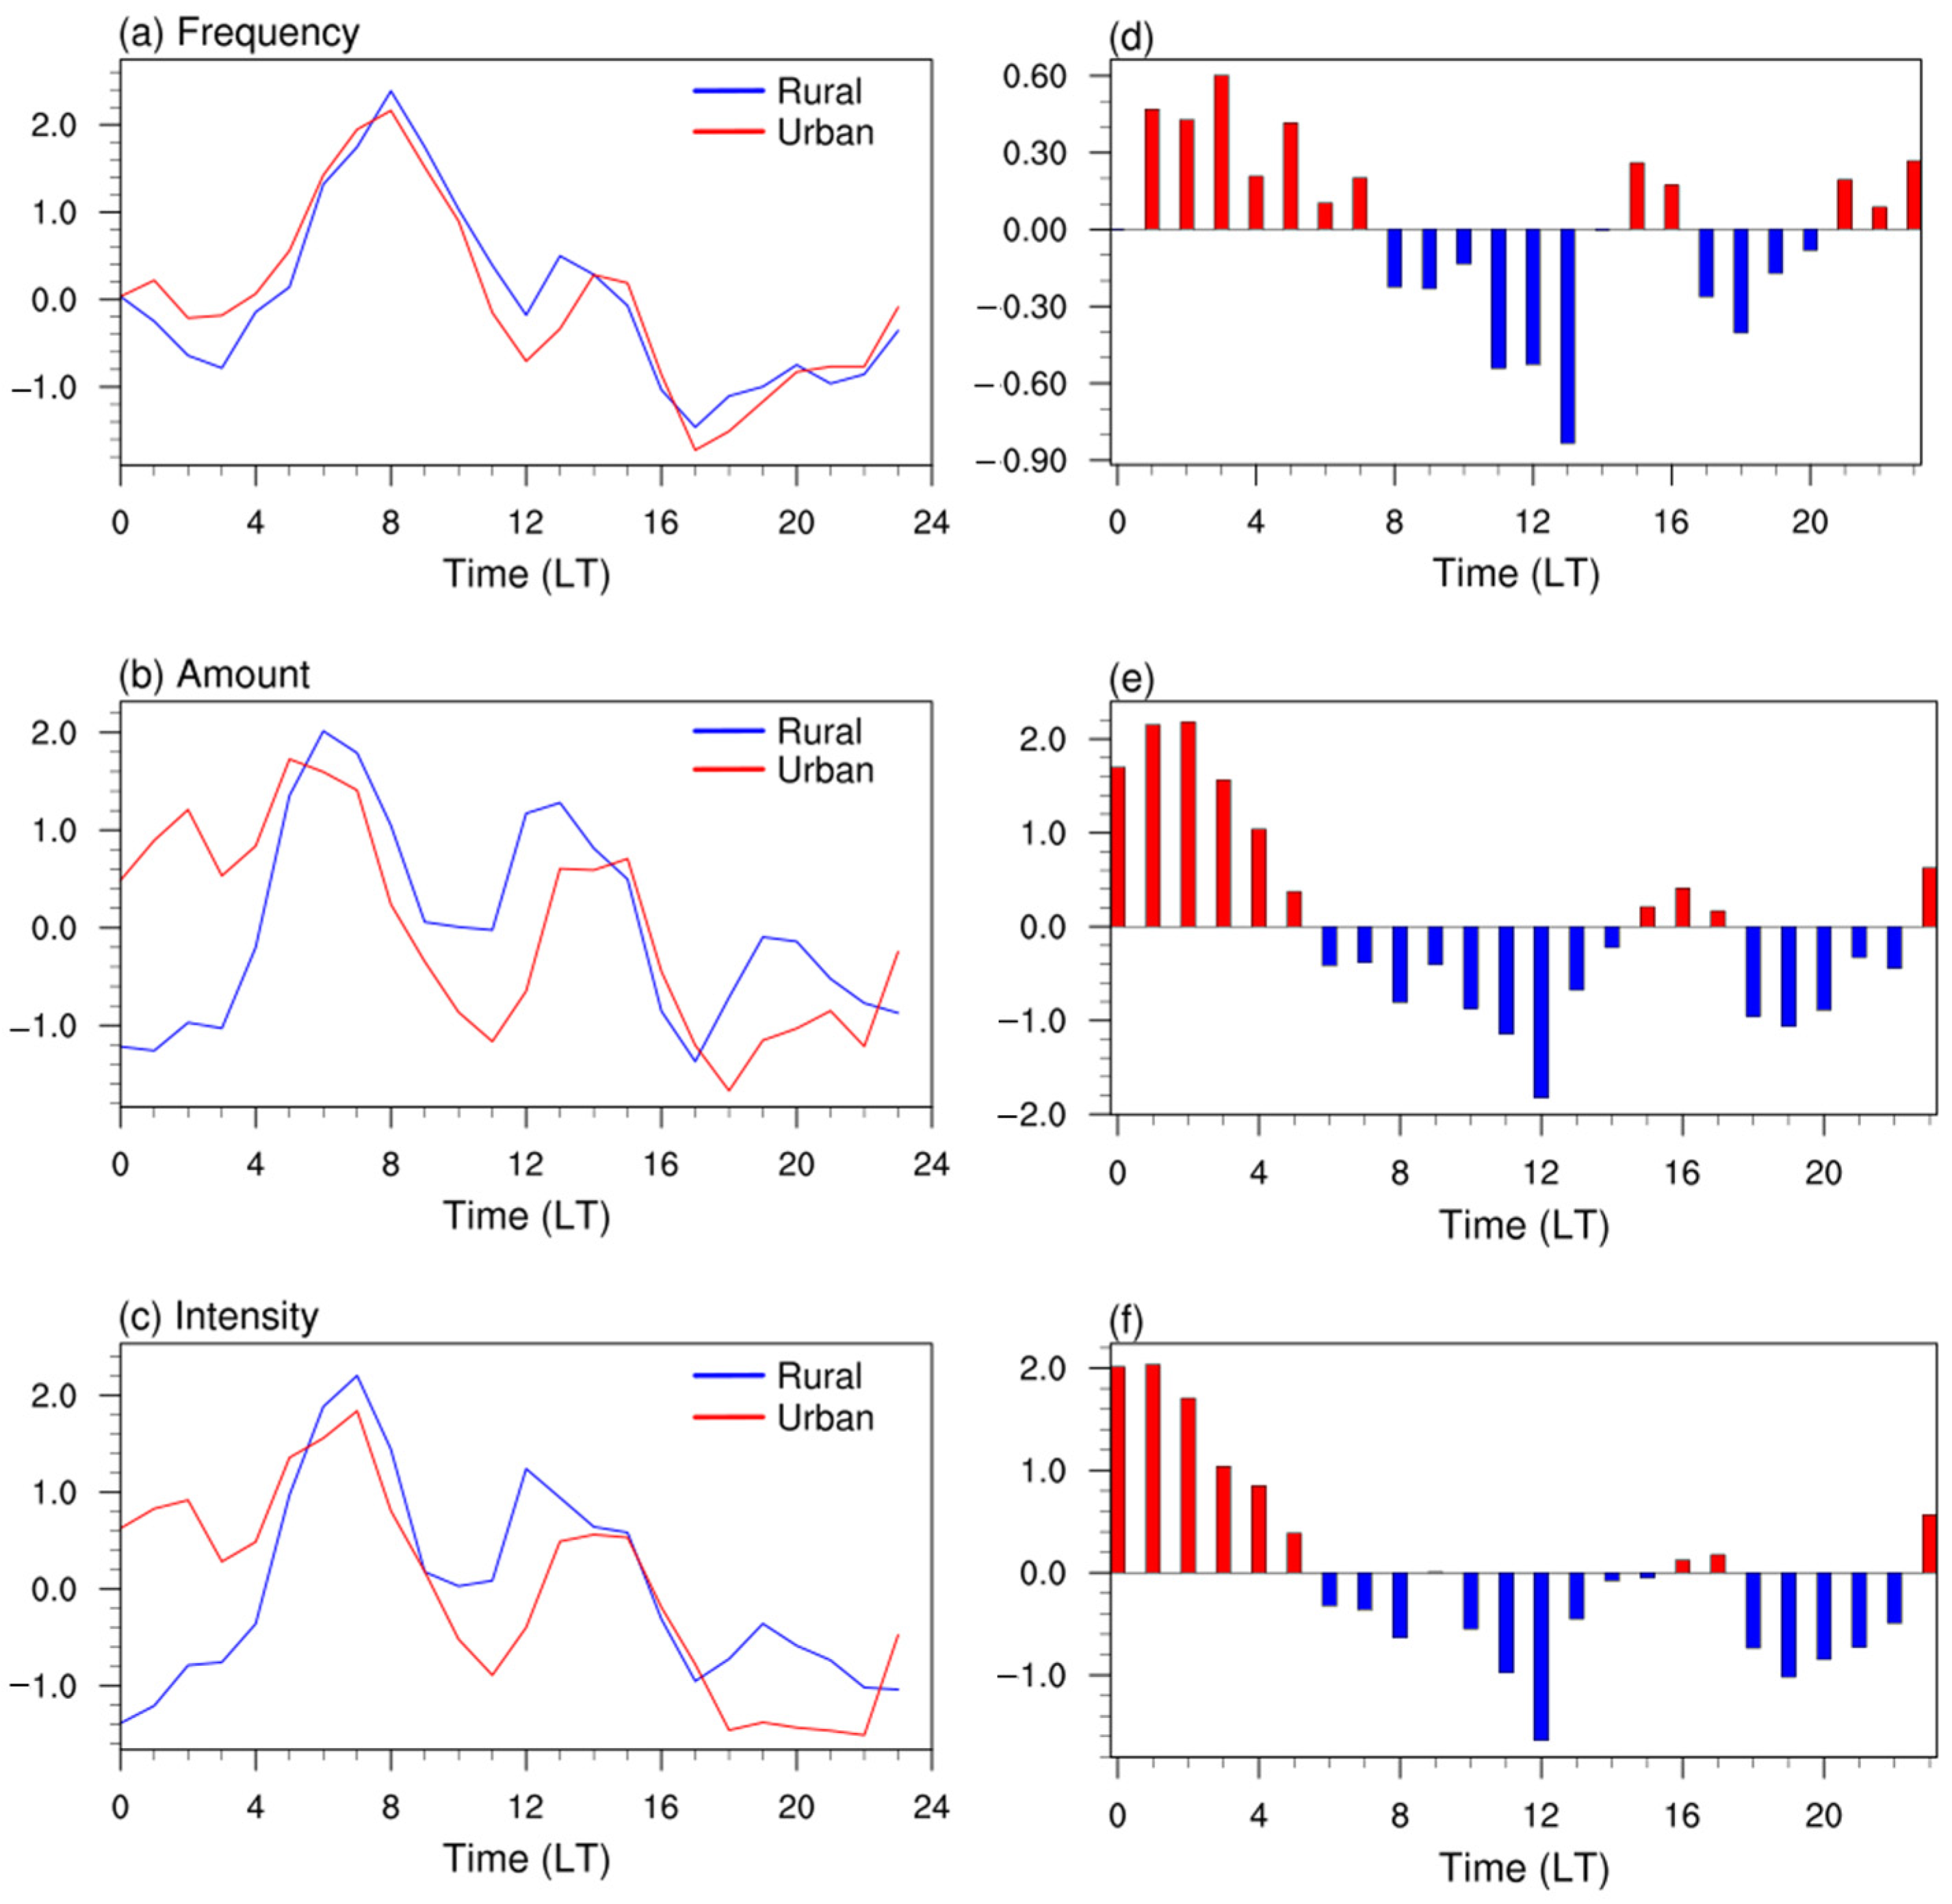
Figure 6.
Spatial distribution of SDR frequency (a,b), average amount (c,d), and average intensity (e,f) anomaly in Wuhan area (a,c,e) and night-time (0000–0600 LT) (b,d,f). The units of rainfall frequency, amount, and intensity are times, mm, and mm/h, respectively; the urban stations are shown as triangles, and the rural stations are shown as circles; the thick black solid line delineates the Wuhan area, and the thin black solid line delineates the urban areas.
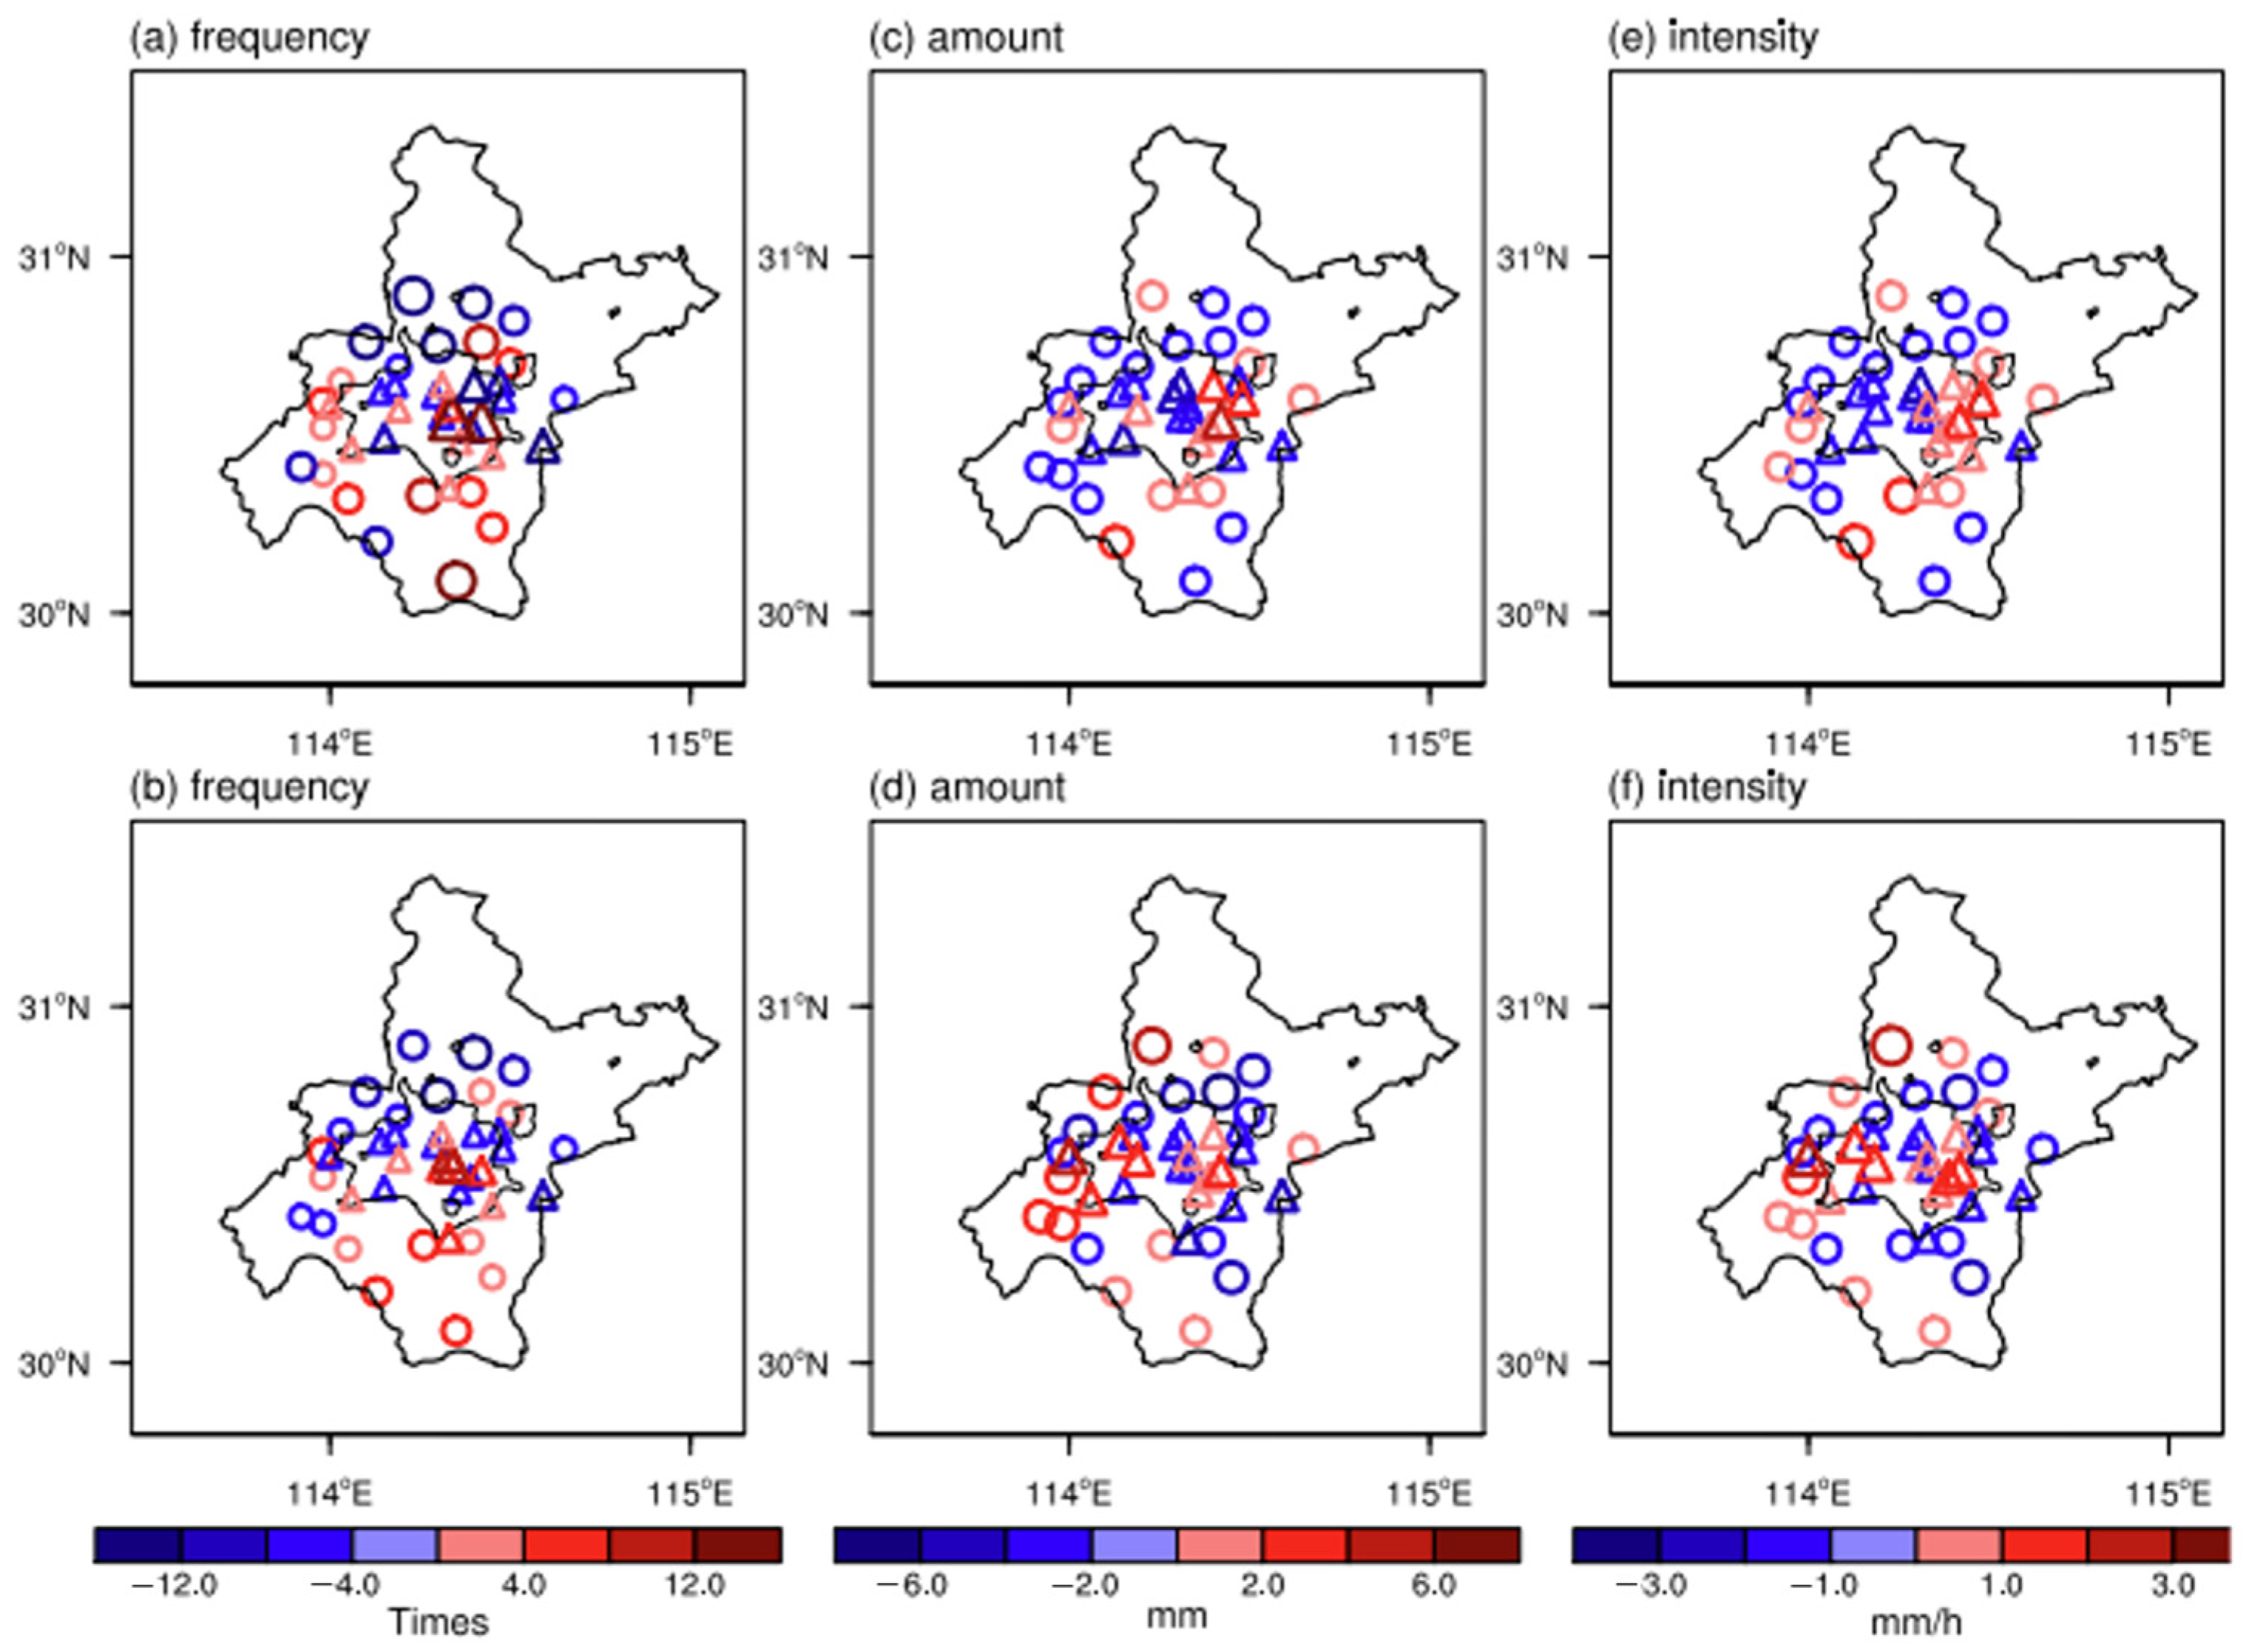
Figure 7.
Diurnal variation of the urban heat island intensity (UHII) anomaly in the Wuhan area. The unit is °C. Red/blue bar indicates the positive/negative UHII, respectively.
Figure 7.
Diurnal variation of the urban heat island intensity (UHII) anomaly in the Wuhan area. The unit is °C. Red/blue bar indicates the positive/negative UHII, respectively.

Figure 8.
Diurnal variations of frequency (a), amount, (b) and intensity (c) of SDR with strong UHI, and weak UHI, and their difference between SDR with strong UHI and weak UHI (d–f). Red/blue bar indicates the positive/negative difference, respectively.
Figure 8.
Diurnal variations of frequency (a), amount, (b) and intensity (c) of SDR with strong UHI, and weak UHI, and their difference between SDR with strong UHI and weak UHI (d–f). Red/blue bar indicates the positive/negative difference, respectively.
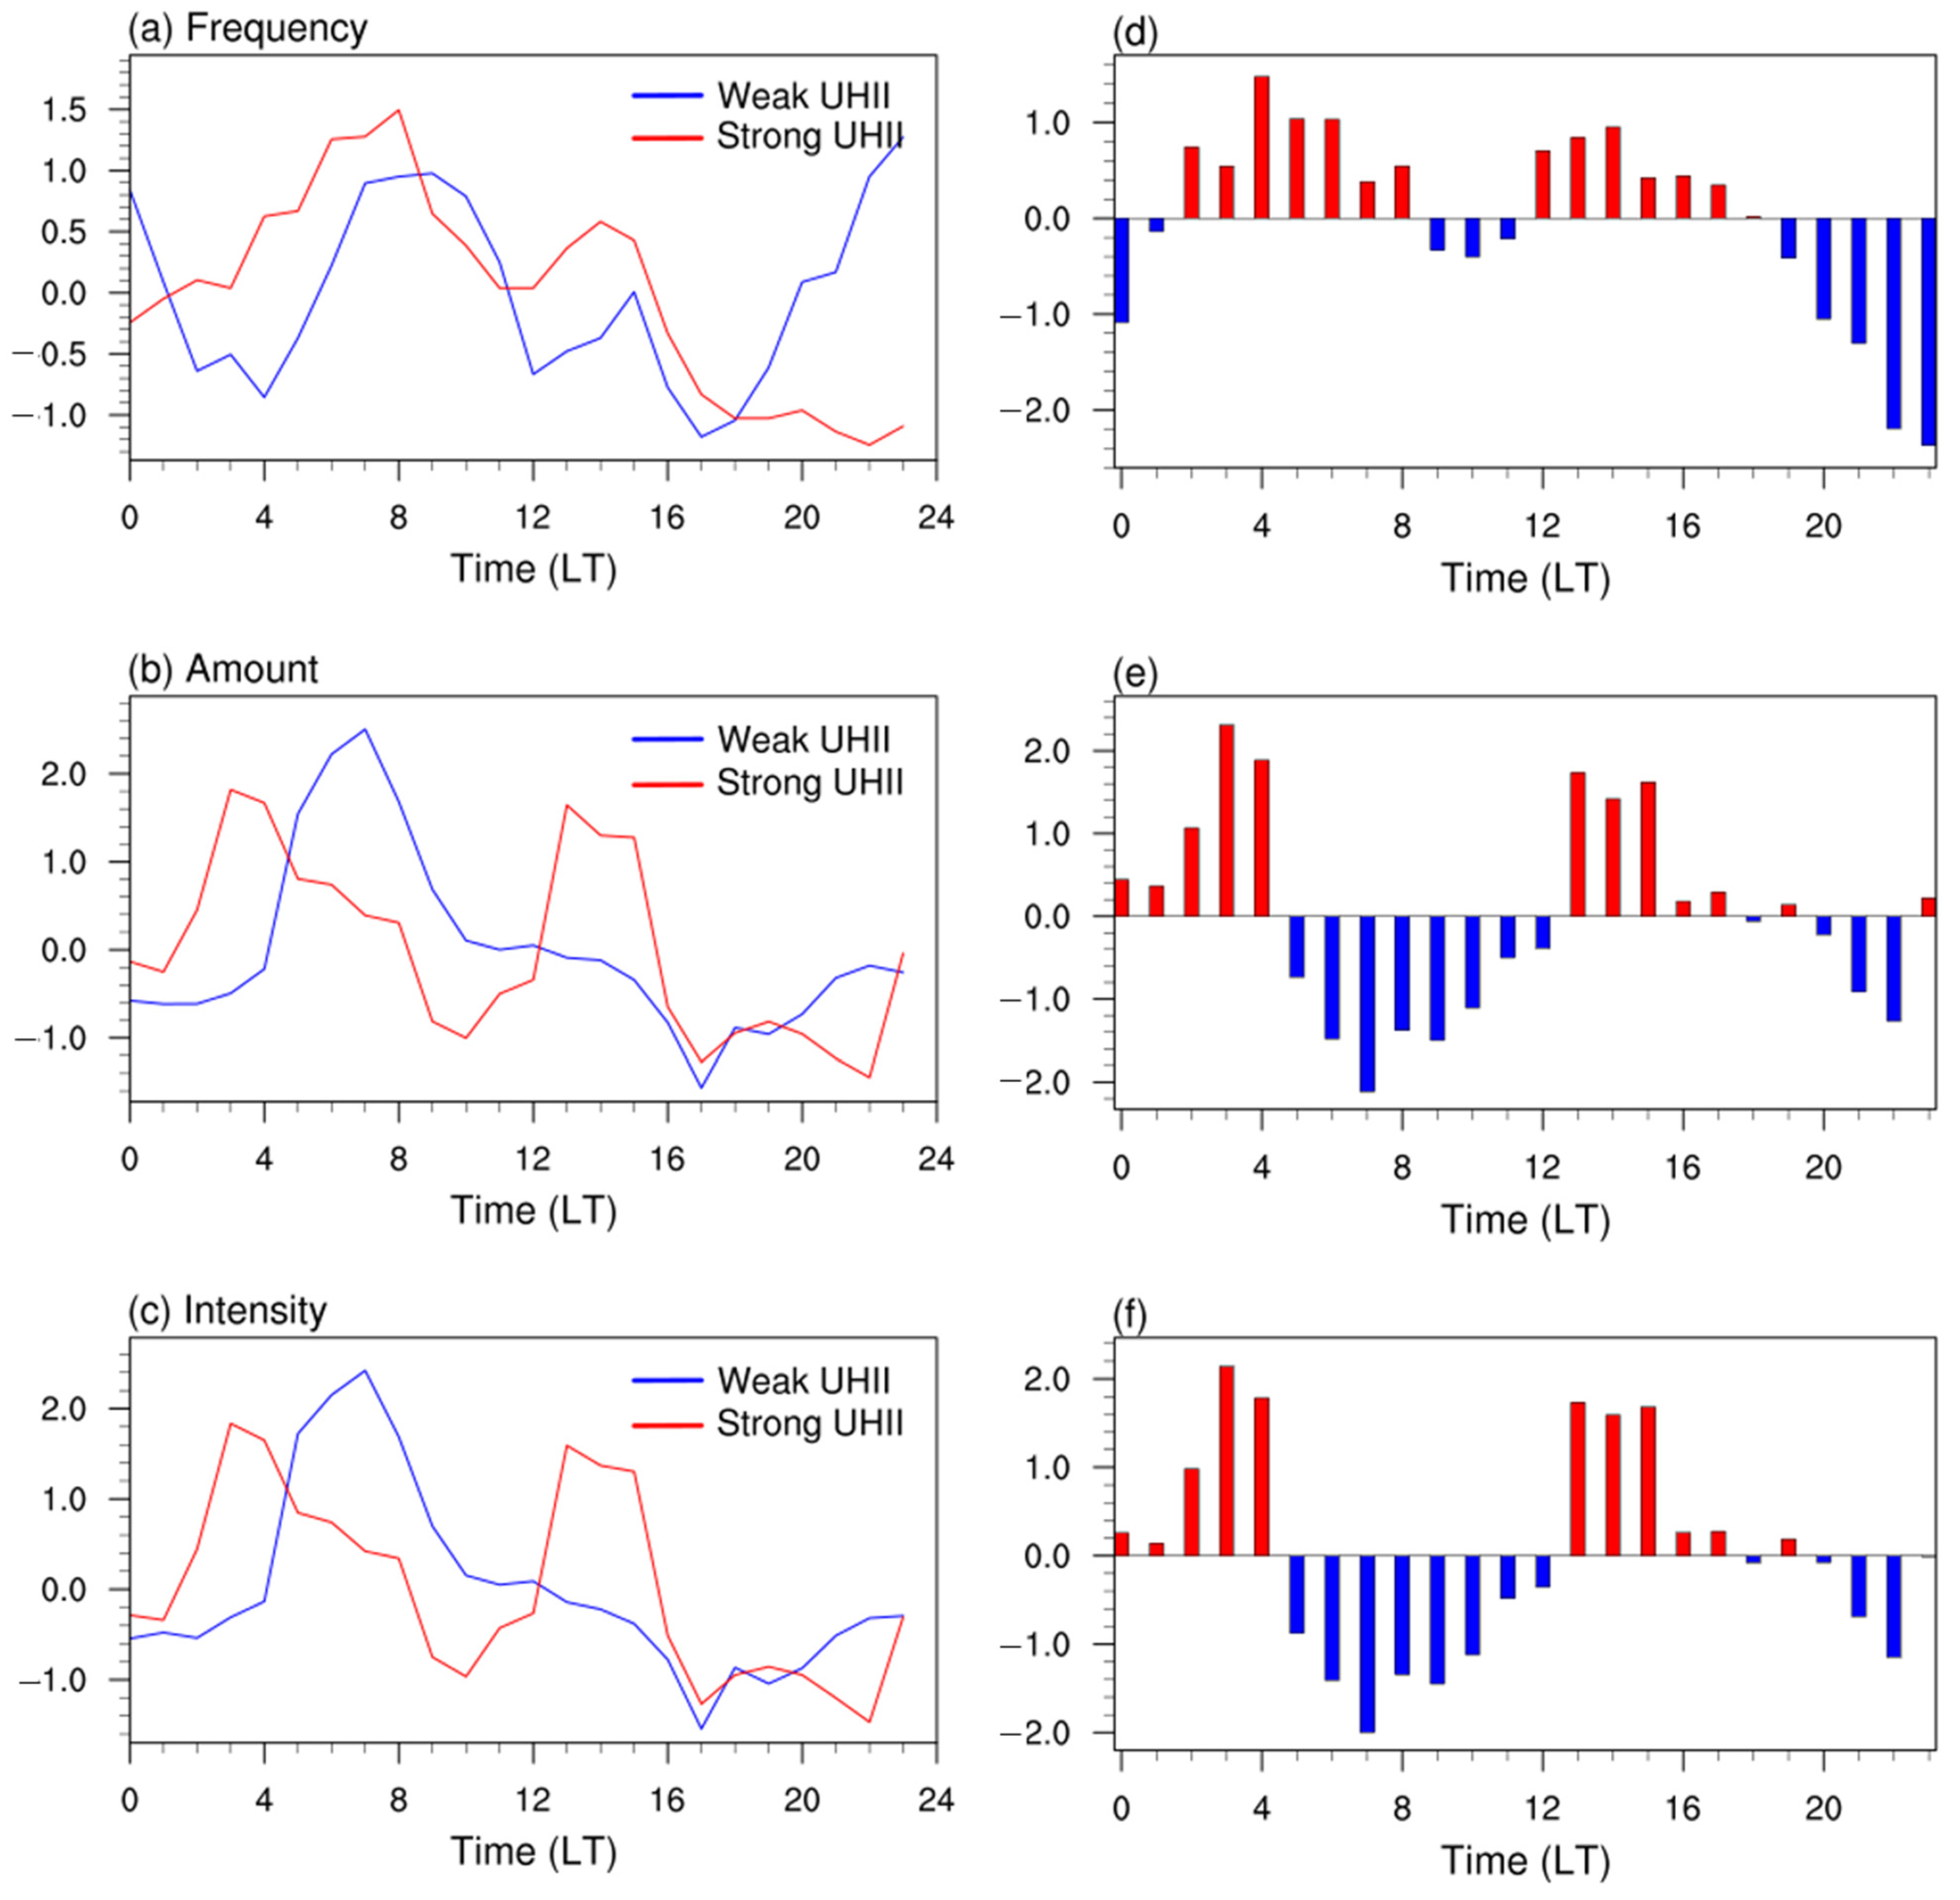
Figure 9.
Spatial distribution of different frequency (a), average amount (b) and average intensity (c) between SDR with strong UHI, and weak UHI in the Wuhan area (a,c,e) and night-time (0000–0600 LT) (b,d,f), respectively. The units of rainfall frequency, amount, and intensity are times, mm, and mm/h, respectively; the solid circles/hollow circles indicate statistically significant/insignificant at 90% confidence levels; the black solid line delineates the urban areas.
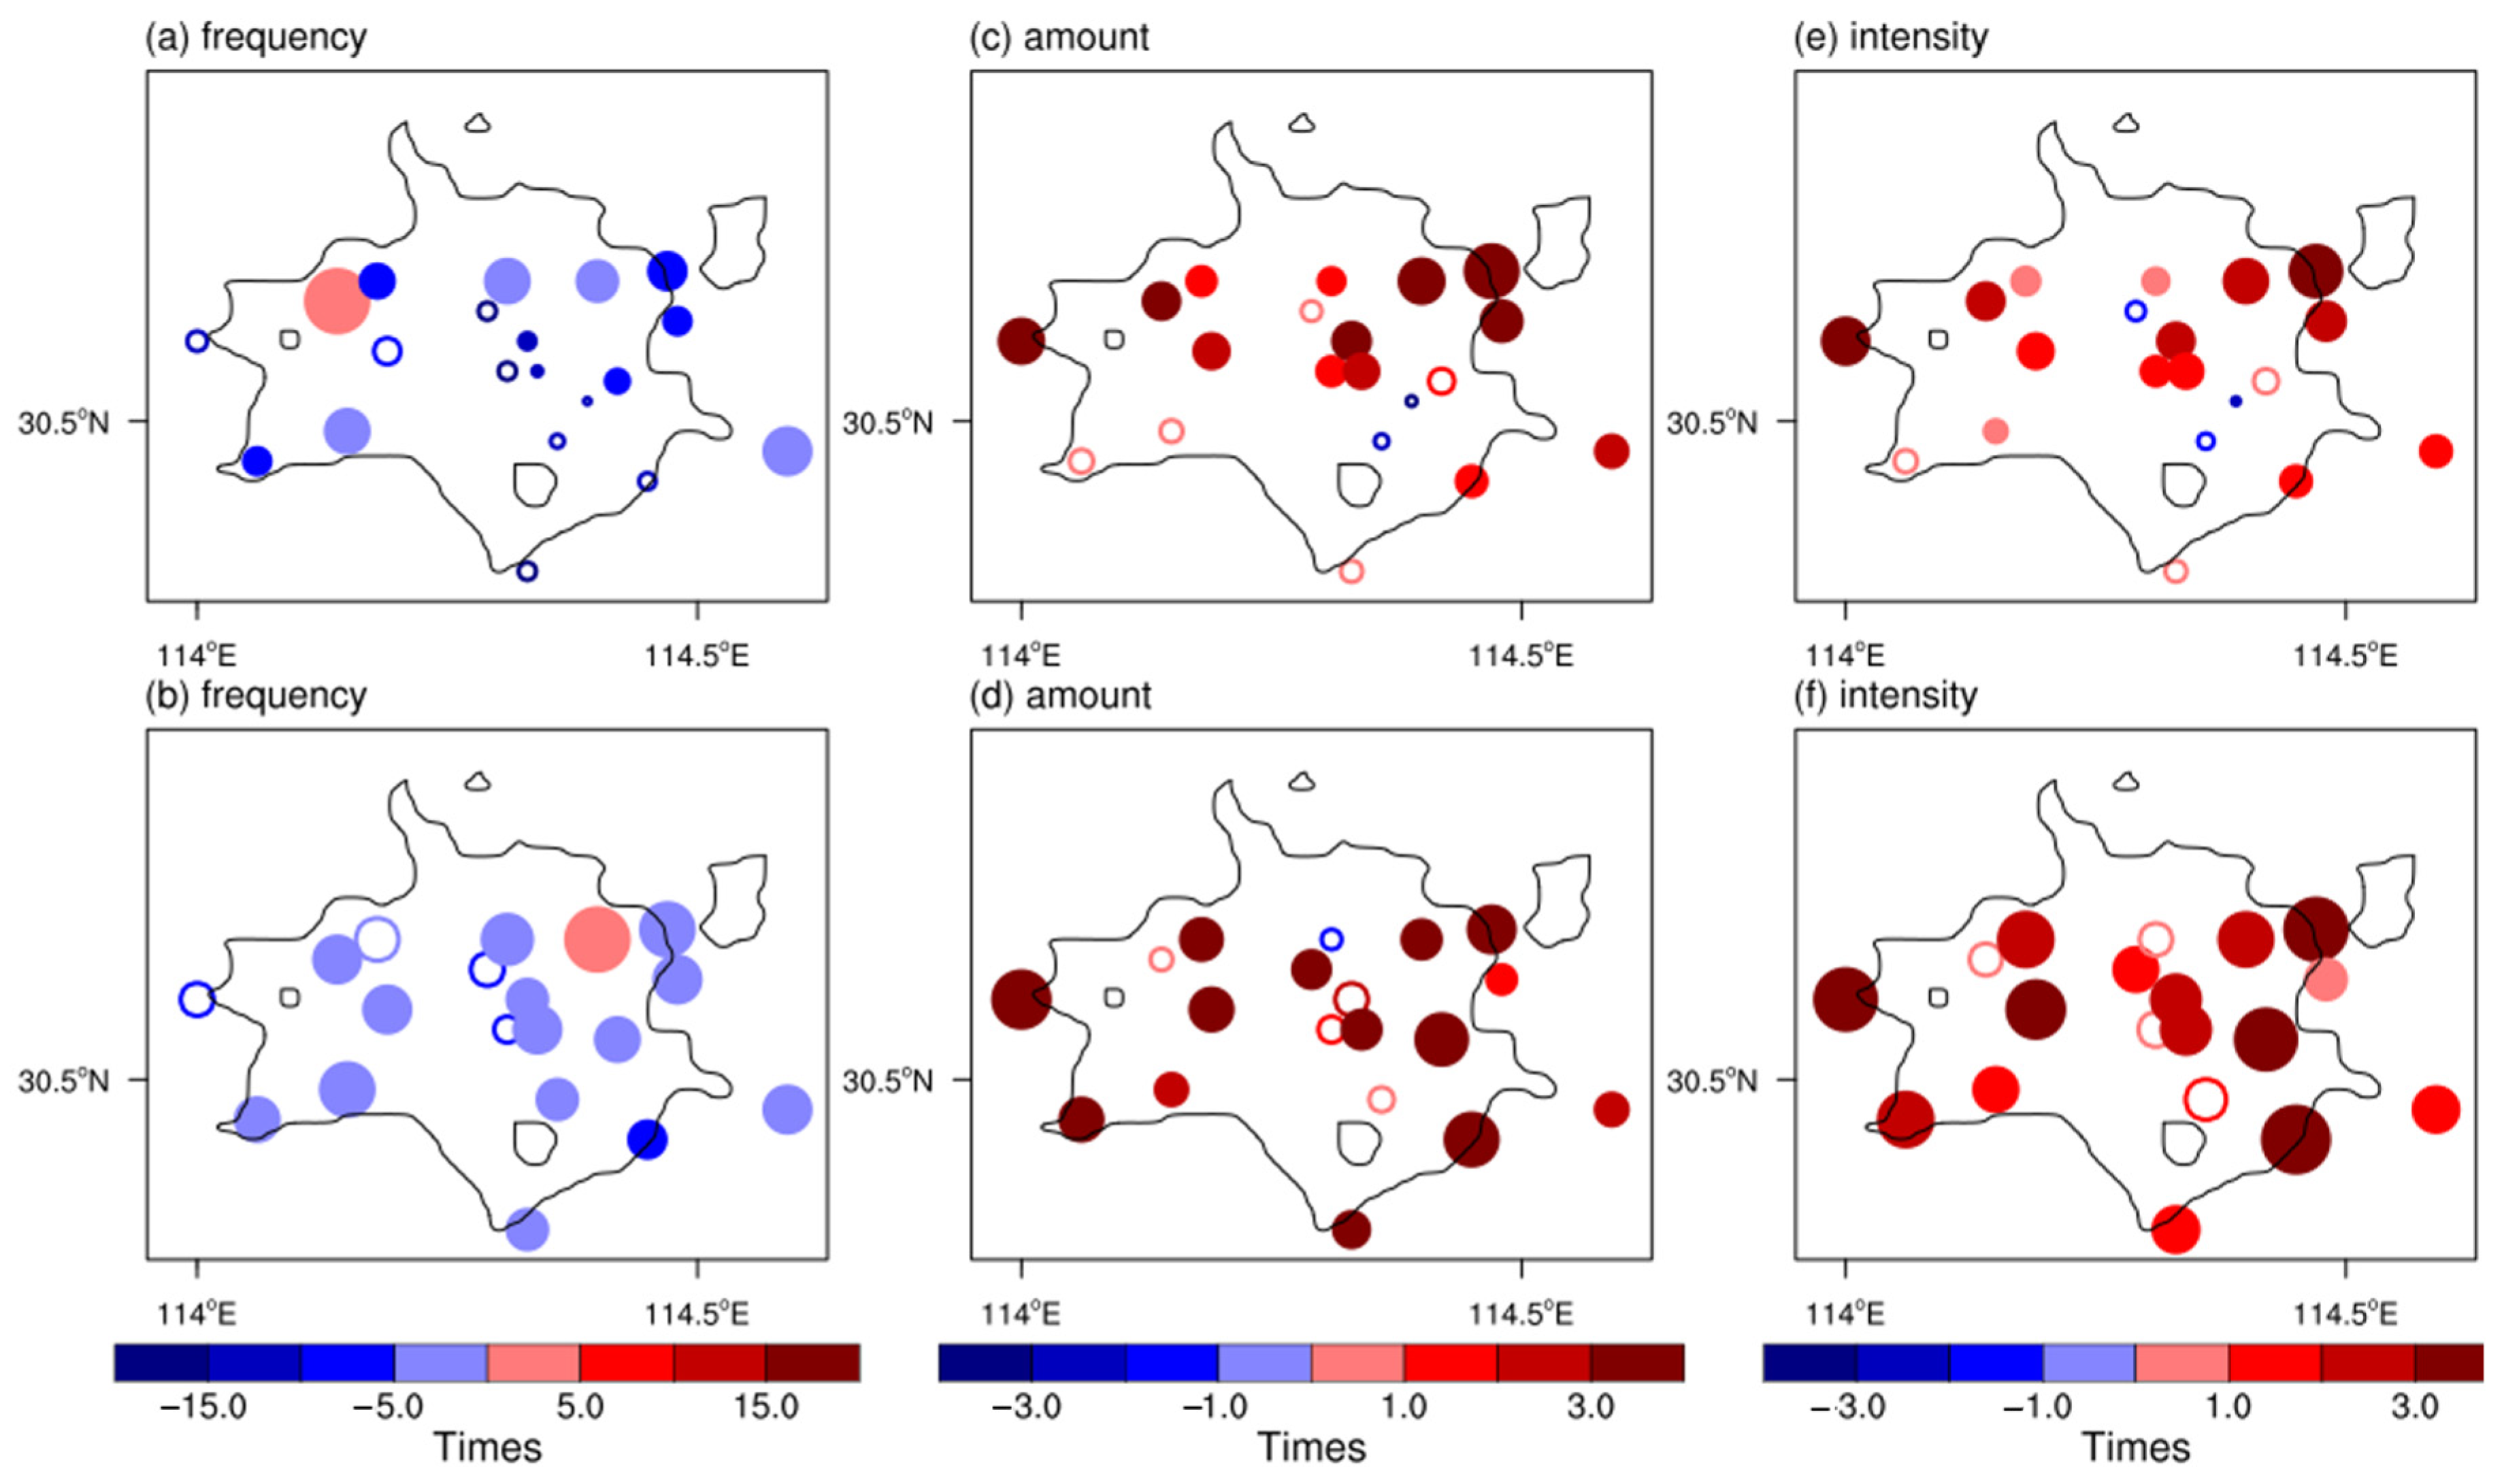
Figure 10.
Spatial distribution of average SAT anomaly in five hours before the SDR with strong UHI (a), SDR with weak UHI (b), and their difference between SDR with strong UHI and weak UHI (c). The unit is °C.
Figure 10.
Spatial distribution of average SAT anomaly in five hours before the SDR with strong UHI (a), SDR with weak UHI (b), and their difference between SDR with strong UHI and weak UHI (c). The unit is °C.
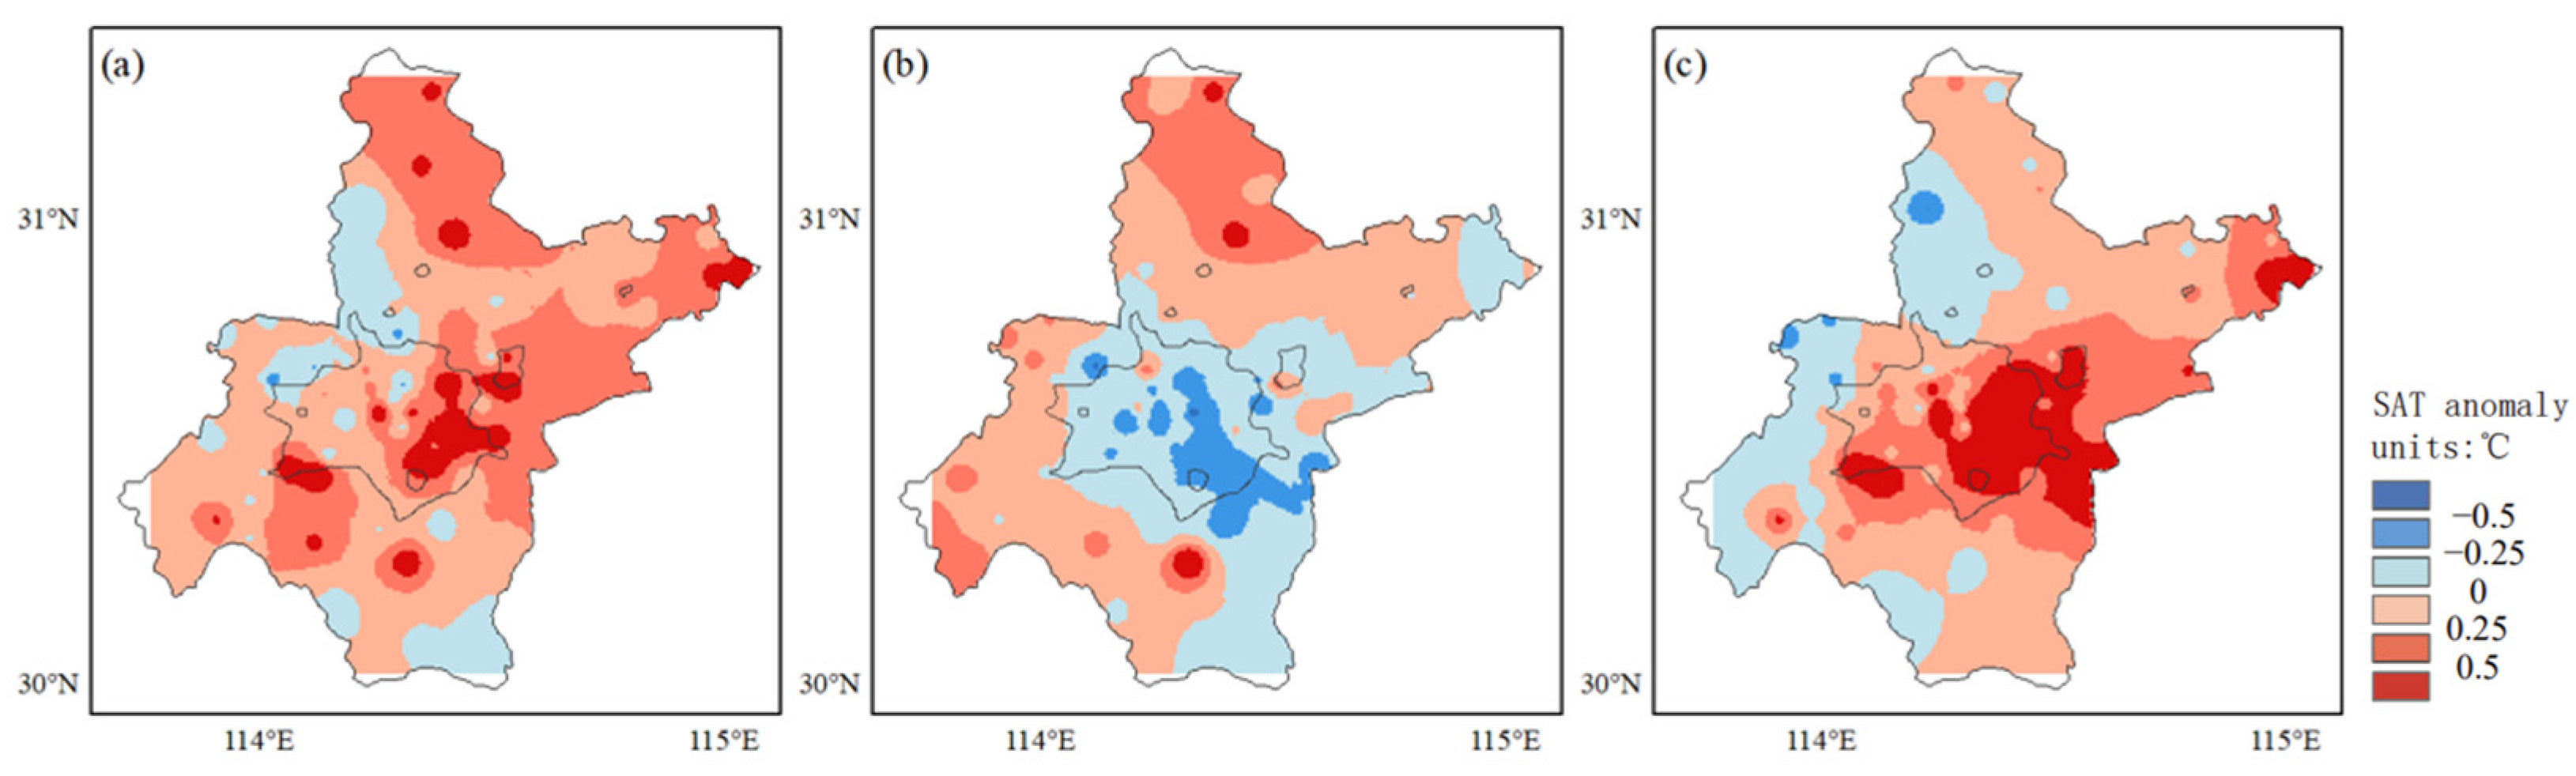
Figure 11.
Spatial distribution of water vapor flux divergence and wind at 925 hPa in the Jianghan Plain at 0200 LT when appears night-time urban SDR events (a), and when affected by a strong urban heat island before the night-time urban SDR events initiated (b). The unit of water vapor flux divergence and wind vector are g ×cm−2hPa−1s−1 and m s−1, respectively.
Disclaimer/Publisher’s Note: The statements, opinions and data contained in all publications are solely those of the individual author(s) and contributor(s) and not of MDPI and/or the editor(s). MDPI and/or the editor(s) disclaim responsibility for any injury to people or property resulting from any ideas, methods, instructions or products referred to in the content. |
© 2023 by the authors. Licensee MDPI, Basel, Switzerland. This article is an open access article distributed under the terms and conditions of the Creative Commons Attribution (CC BY) license (https://creativecommons.org/licenses/by/4.0/).
Share and Cite
MDPI and ACS Style
Mao, Y.; Ren, G.; Tysa, S.K. Urbanization-Induced Diurnal Variation in Short-Duration Rainfall Events in Wuhan, China. Land 2023, 12, 1343. https://doi.org/10.3390/land12071343
AMA Style
Mao Y, Ren G, Tysa SK. Urbanization-Induced Diurnal Variation in Short-Duration Rainfall Events in Wuhan, China. Land. 2023; 12(7):1343. https://doi.org/10.3390/land12071343
Chicago/Turabian StyleMao, Yanlin, Guoyu Ren, and Suonam Kealdrup Tysa. 2023. "Urbanization-Induced Diurnal Variation in Short-Duration Rainfall Events in Wuhan, China" Land 12, no. 7: 1343. https://doi.org/10.3390/land12071343
Note that from the first issue of 2016, this journal uses article numbers instead of page numbers. See further details here.