Article

Characteristics and Driving Mechanism of Urban Construction Land Expansion along with Rapid Urbanization and Carbon Neutrality in Beijing, China

1
Academy of Eco-Civilization Development for Jing-Jin-Ji Megalopolis, Tianjin Normal University, Tianjin 300387, China
2
School of Land Science and Space Planning, Hebei GEO University, Shijiazhuang 050031, China
3
Institute of Geographic Sciences and Natural Resources Research, Chinese Academy of Sciences, Beijing 100101, China
4
Hebei International Joint Research Center for Remote Sensing of Agricultural Drought Monitoring, Hebei GEO University, Shijiazhuang 050031, China
*
Author to whom correspondence should be addressed.
Land 2023, 12(7), 1388; https://doi.org/10.3390/land12071388
Submission received: 8 June 2023 / Revised: 4 July 2023 / Accepted: 7 July 2023 / Published: 12 July 2023
(This article belongs to the Special Issue Regional Sustainable Management Pathways to Carbon Neutrality)

Abstract

:
Escalating urban issues in Beijing call for comprehensive exploration of urban construction land expansion towards the goal of carbon neutrality. Firstly, urban construction land in Beijing during the period 2005–2020 was accurately detected using Landsat images and impervious surface data, and then its expansion characteristics were revealed. Finally, the driving mechanism of urban construction land expansion was explored using geographically and temporally weighted regression from the input–output perspective. The results showed that the expansion speed and intensity of urban construction land in Beijing showed an overall tendency to slow down, and the center of urban expansion shifted to the new urban development zone and ecological function conservation zone. Urban construction land expansion in the central urban area was first scattered and then compact, while that in the new urban development zone and ecological function conservation zone primarily followed an outward pattern. The permanent population, per capita GDP, and per capita retail sales of social consumer goods were the primary driving factors of urban construction land expansion in Beijing, the impacts of which varied significantly among different districts of Beijing. All these results can provide a solid foundation for improving land use policies towards the goal of carbon neutrality in highly urbanized areas.

1. Introduction

There has been urban construction land rapid expansion along with accelerated urbanization across the world, which has been one of the important contributors to carbon emissions and climate change [1,2]. Land use change has been the core driving force of carbon storage in terrestrial ecosystems, accounting for one-third of the anthropogenic carbon emission [3,4]. In particular, urban construction land expansion has an increasing impact on ecological carbon storage and carbon emission [5]. On the one hand, there is considerable conversion of cropland, forest, and grassland with higher carbon storage abilities into urban construction land with lower carbon storage abilities in the process of urbanization, greatly reducing the carbon storage capacity of terrestrial ecosystems [1]. On the other hand, the increasing consumption of fossil fuel within urban construction land also leads to a significant increase in carbon emission; for example, the urban areas have accounted for approximately 3/4 of the total carbon emission of the world [6]. Most previous studies have therefore suggested there is generally a strong positive correlation between urban construction land expansion and carbon emission, and the newly added construction land is an important source of increased carbon emission [7]. However, some other studies have suggested there was an inverted U-shaped trend of the impact of urban construction land expansion on urban carbon emission, which may be due to the spatial heterogeneity to carbon emission efficiency in the urbanization of different dimensions [5,8]. This provides some novel approaches for achieving a balance between rapid urbanization and carbon emission reduction, e.g., regulation of land use change and improvement in carbon emission efficiency [2]. In fact, there are both various influencing factors of urban construction land expansion and heterogeneous impacts of urban construction land on carbon emission across different geographical zones and urban area sizes [5]. It is of great practical significance to accurately reveal the characteristics and driving mechanism of urban construction land expansion, which can provide important theoretical support for low-carbon urbanization and carbon neutrality [4].
Urban construction land expansion as the most direct spatial manifestation of urbanization has been a central topic in urban studies worldwide, and is generally explored with 3S technology [9,10]. For example, some scholars have revealed the spatiotemporal patterns of urban expansion of megacities such as Beijing using remotely sensed land use data and GIS tools [9,10,11,12], while other studies have revealed the characteristics of urban land expansion, e.g., the growth rate of urban land, conversion from arable land to of urban land, and expansion process of construction areas in major urban agglomerations based on GIS technology multi-period remote sensing data [13,14,15]. For example, some previous studies based on remote sensing data such as nighttime light data suggested there has been extensive expansion of urban areas in Beijing in the past decades, with an annual urban expansion rate of 3.46% during the period 1978–2015 [10,15].
There are inevitably some limitations in the traditional retrieval of urban construction land based on remote sensing data, and the increasingly mature 3S technology and abundant multi-source data lay a firm foundation for further improving the retrieval accuracy of urban construction land. For example, there may be considerable differences in the resolution of long time-series remote sensing images from different satellite sensors, and earlier remote sensing images with the same resolution generally exhibited high error rates. In particular, the accuracy of the traditional retrieval of urban construction land is easily affected by the quality of remote sensing images with different cloud amounts in different months, and it costs a lot of human and material resources to carry out the correction of cloud layers, radiation, spectra, and so on. It may be feasible to improve the retrieval accuracy of urban construction land and reduce the cost by supplementing the retrieval results based on traditional methods with multi-source impervious surface data, which can effectively reduce the influence of mixed pixels. In fact, some studies have explored urban expansion using impervious surface data [16,17,18]. However, there are various impervious surfaces, which may lead to some errors in the retrieval of urban construction land. For example, infrastructure in the periphery of cities may be classified as urban construction land, while parkland within cities may be excluded if the retrieval of urban construction land is solely based on the impervious surface data. There is therefore an urgent need to further improve the retrieval of urban construction land by integrating the impervious surface data with more accurate methods based on 3S technology.
Urban construction land expansion is influenced by various driving factors [19], which have been generally explored with statistical analysis such as regression analysis in and previous studies [20,21]. Specifically, socio-economic factors such as gross domestic product (GDP), income of urban residents, and urban transportation generally have considerable influence on urban construction land expansion [20,21]. For example, there was temporal coevolution of the urban area with the urban population in Beijing, indicating the rising efficiency of urban land use [20]. But these driving factors of urban construction land expansion were generally selected according to previous experience rather than a solid theoretical foundation in most of the previous studies [20,21]. By contrast, the input–output theory suggested that the urbanization process can be regarded as the result of rising urban output brought on by the social input, which provides a reliable theoretical foundation for improving the rationality of selecting the driving factors of urban construction land expansion [22,23]. It is therefore necessary to carry out more in-depth research on urban construction land expansion on the basis of the input–output theory. Furthermore, previous studies have primarily explored the driving factors of urban construction land expansion via regression analysis such as conventional ordinary least squares regression (OLS) and geographically weighted regression (GWR), which generally fail to capture the non-stationary variation in urban construction land over time or space [24,25,26,27]. By contrast, the geographically and temporally weighted regression (GTWR) model, which was further developed based on the GWR model, can effectively reveal the spatiotemporal relationship between independent variables and dependent variables [28]. It is therefore better to explore the driving factors of long-term and non-stationary urban construction land expansion with the GTWR model [28,29].
Beijing, as the capital of China, has experienced substantial urban sprawl in the past decades, where the urbanization rate has been as high as 87.5% in 2021 [23,30,31]. The rapid urban construction land expansion has led to a series of ecological and social problems such as serious environmental pollution, increasing energy consumption, and considerable loss of agricultural land [10]. The concept of reducing construction land while promoting development has been proposed in the new round of national spatial planning of Beijing to cope with the excessive expansion of urban construction land. Previous studies have generally depicted the physical process of urbanization in Beijing with aggregate area change extent or rate from non-urban land to urban uses from the macroscopic and static perspective, providing limited information regarding the internal spatial patterns or driving factors of urban construction land expansion [10]. It is therefore necessary to carry out more in-depth analysis of the characteristics and driving mechanisms of urban construction land expansion in Beijing based on more accurate data and up-to-date technology, which can provide valuable reference information for formulating regional land use policies and achieving carbon neutrality for Beijing and other cities [31]. This study has therefore aimed to (1) detect the urban construction land of Beijing and reveal its expansion characteristics more accurately based on up-to-date remote sensing images and (2) reveal the driving mechanism of urban construction land expansion more accurately based on the input–output theory and the GTWR model. The results of this study can provide a basis for formulating land use policies in Beijing and offer valuable guidance for the optimal utilization of construction land in other areas with high urbanization levels against the background of carbon neutrality.

2. Materials and Methods
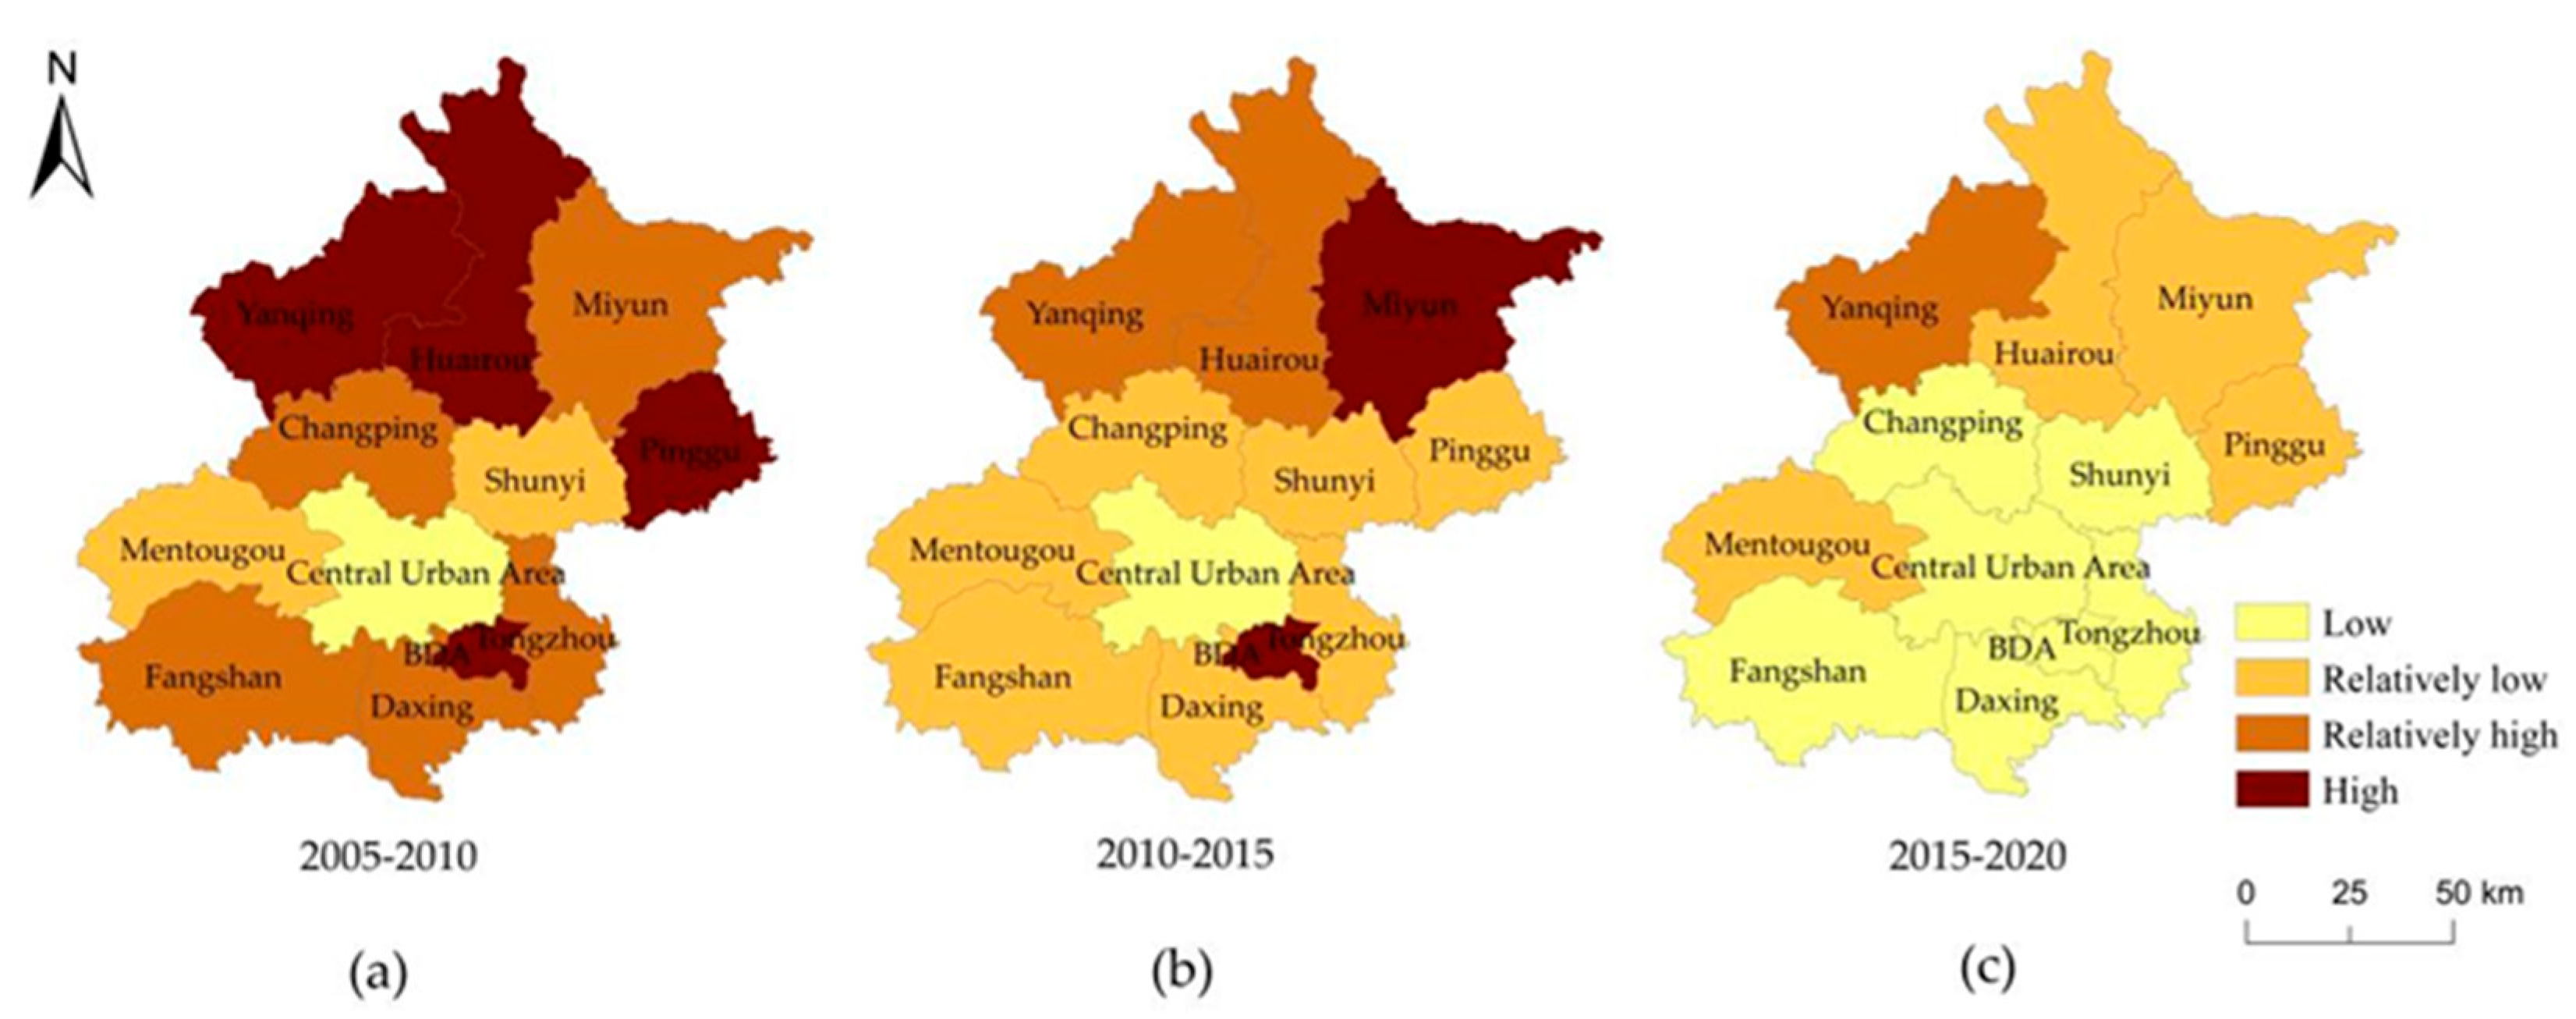
2.1. Study Area

Beijing is in the northern part of the North China Plain (115.7–117.4° E, 39.4–41.6° N), with a total area of approximately 16,410 km2. Beijing is adjacent to Yanshan Mountain, where the elevation generally ranges between 1000 and 1500 m in the mountainous areas and 20 and 60 m in the plain areas, with the elevation declining significantly from northwest to southeast [31]. Beijing includes 16 districts, such as the Dongcheng, Xicheng, and Chaoyang districts and the Beijing Economic-Technological Development Area (BDA) (Figure 1). Beijing is generally divided into four areas, i.e., the capital function core zone, urban function expansion zone, new urban development zone, and ecological function conservation zone, according to the “Main Functional Zone Planning of Beijing”. Specifically, the capital function core zone includes the Dongcheng and Xicheng districts, and the urban function expansion zone includes the Haidian, Chaoyang, Fengtai, and Shijingshan districts. The new urban development zone includes the Changping, Shunyi, Tongzhou, BDA, Daxing, and Fangshan districts, and the ecological function conservation zone includes the Mentougou, Yanqing, Huairou, Miyun, and Pinggu districts. The total permanent population of Beijing increased from 15.38 million in 2005 to 21.954 million in 2016, and thereafter gradually decreased to 21.89 million in 2020. But there has been rapid economic development in Beijing in the past decades, where the regional GDP reached USD 633.40 billion and the per capita regional GDP reached USD 28,514 in 2021. Meanwhile, there was significant urban construction land expansion in Beijing, but with a declining trend in the land use carbon emissions in recent years [31]. For example, the carbon emissions of Beijing reached approximately 2.6 million tons in 2021, and the carbon dioxide emissions per unit GDP decreased by about 4% in comparison to 2020, leading to continuous improvement in the ecological environmental quality.

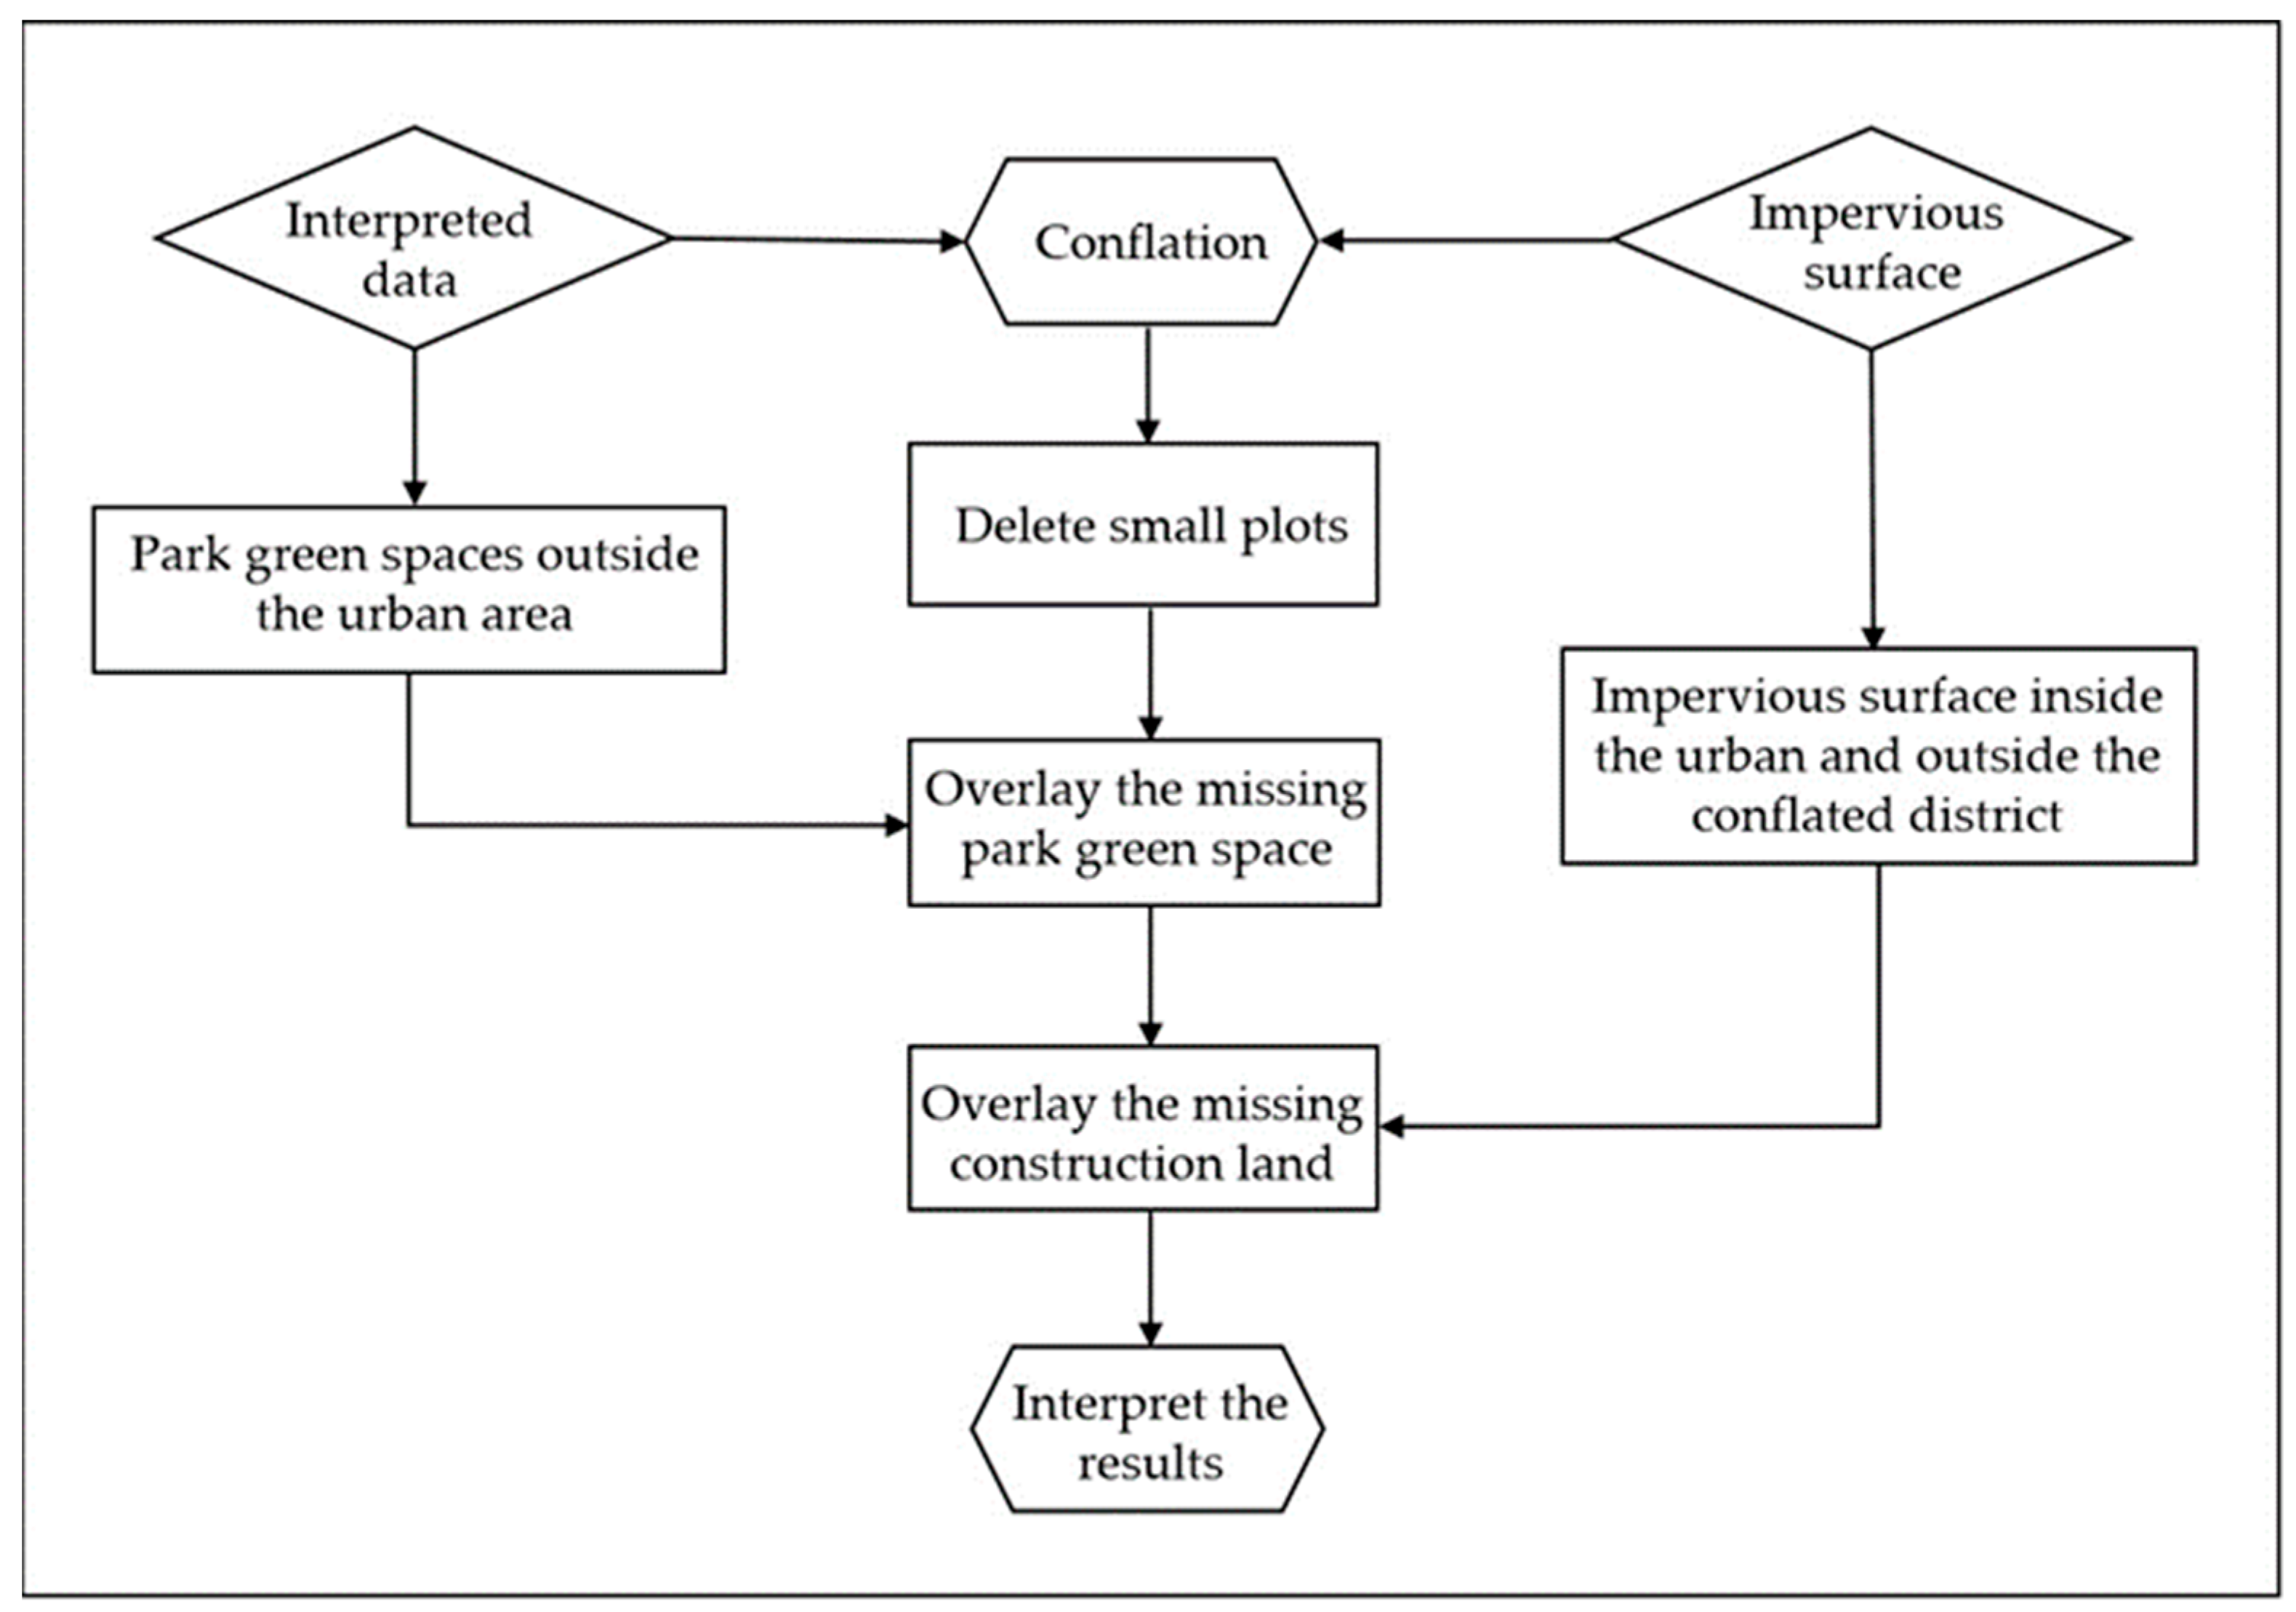
2.2. Data Preparation

This study collected data from the period 2005–2020, which is the implementation period of the “Beijing Urban Master Plan (2004–2020)”. This study used remote sensing images with a spatial resolution of 30 m in four periods during the period 2005–2020, which were obtained from the USGS Earth Explorer website (https://earthexplorer.usgs.gov/, accessed on 18 March 2022) (Table 1). This study primarily selected the Landsat images from the first half of May to the middle of June and from the first half of September to the first half of October, considering the growth patterns of vegetation and the planting practices of crops in the study area. Furthermore, the impervious surface data were extracted from China’s 30 m Land Cover Dataset from 1990 to 2020 on the Zenodo data sharing platform (https://zenodo.org/, accessed on 20 May 2022). In addition, Beijing’s digital elevation model data and administrative division data were obtained from the Resource and Environment Science and Data Center of the Institute of Geographic Sciences and Natural Resources Research, Chinese Academy of Sciences (https://www.resdc.cn/, accessed on 21 May 2022). Finally, the socio-economic data were extracted from the Beijing Statistical Yearbook and the Beijing Regional Statistical Yearbook.
This study detected the urban construction land in the remote sensing images using ENVI 5.3 software (Figure 2). Firstly, data pre-processing of Landsat images was carried out, including radiometric calibration, atmospheric correction, clipping, and mosaicking. Then, the interpretation keys were established, with the land cover classified into six types, i.e., cropland, forest, grassland, construction land, water body, and unused land, and the supervised classification was used to detect the construction land throughout the study area. Finally, this study further processed the detected urban construction land to reduce the error according to the process shown in Figure 2.
This study focused on the urban core and peripheral areas defined by the “Beijing Urban Master Plan (2004–2020)”. The urban core areas include the downtown area and the surrounding ten edge groups, including Beiyuan, Jiuxianqiao, Dongba, Dingfuzhuang, Fatou, Nanyuan, Fengtai, Shijingshan, Xiyuan, and Qinghe as well as Huilongguan and Beiyuan, which are approximately equivalent to the Haidian, Chaoyang, Dongcheng, Xicheng, Fengtai, and Shijingshan districts. At the same time, peripheral areas cover the remaining part of Beijing. This study firstly eliminated the impervious surface data in the peripheral areas, and then intersected the retrieved urban construction land data and the impervious surface data in the urban core areas, eliminating the fragmented patches and obtaining the confirmed urban construction land. Furthermore, the parkland data within the urban core area were extracted from the detected urban construction land, which was used to complete the missing data due to the data intersection. Additionally, the impervious surface in areas outside the areas of data intersection within the core area should be impervious in theory but may be misclassified into other land use types. This study has therefore included these areas as the missing construction land to form the final urban construction land data. Finally, the retrieval accuracy was evaluated using the Kappa coefficient based on the field survey data.

2.3. Exploration of Urban Construction Land Expansion Characteristics

This study explored the quantitative characteristics of urban construction land expansion using the expansion speed and intensity. The expansion speed of urban construction land refers to the average annual expansion area of construction land during a certain period. The urban construction land expansion intensity refers to the ratio of newly added construction land area during a certain period to the urban construction area of the base period and the time duration of a certain period. It quantifies the rate of change in the urban construction land area [32]. The specific equations are as follows:
S 1 = A 2 A 1 T
S 2 = A 2 A 1 A 1 × T × 100 %
where S1 represents the expansion speed of urban construction land, S2 represents the expansion intensity of urban construction land, A1 is the initial urban construction land area over the initial period, A2 is the urban construction land area over the ending period, and T is the time duration of a certain period. The dynamic degree was classified into four categories using the natural break classification method: low intensity, relatively low intensity, relatively high intensity, and high intensity.
This study characterized the morphological characteristics of urban construction land using the area-weighted mean fractal dimension (AWMPFD), by splitting the urban construction land into independent patches according to the principle of boundary non-contact [33]. Meanwhile, this study characterized the complexity of urban construction land expansion using the area-weighted mean shape index (AWMSI). Both indices were calculated using Fragstats 4.2 as follows:
A W M P F D = i = 1 m 2 ln ( 0.25 p i ) ln a i a i A
A W M S I = i = 1 m 0.25 p i a i a i A
where A represents the total area of urban construction land and ai, and pi represent the area and perimeter of the ith construction land patch, respectively.

2.4. Exploration of the Driving Mechanism of Urban Construction Expansion

This study explored the driving mechanism of urban construction land expansion with the GTWR model since the urban construction land varied both geographically and temporally. The GTWR model can simultaneously reveal the non-stationary relationship between urban construction land expansion and its driving factors in space over time by incorporating the temporal effects into the GWR model as follows [29]:
y i = P 0 ( x i , y i , t i ) + k P k ( x i , y i , t i ) X i t + e i
where xi and yi represent the spatial coordinates (longitude and latitude) of the ith sample point and ti represents the time dimension coordinate of the ith sample point; P0 is the regression constant of the sample point (xi, yi, ti); Xit represents the value of the kth independent variable at the ith sample point; ei represents the residual value; and Pk(xi, yi, ti) is the kth regression parameter of the ith sample point, which was estimated as follows:
P ^ ( x i , y i , t i ) = [ X T W ( x i , y i , t i ) X ] 1 X T W ( x i , y i , t i ) Y
where P ^ ( x i , y i , t i ) is the estimated value of Pk(xi, yi, ti); X is the matrix of independent variables and XT is the transpose matrix of X; Y is the sample matrix; and W(xi, yi, ti) is the spatiotemporal weight matrix, which was obtained with the finite Gaussian function, namely the bi-square spatial weight function [8,34]. The optimal bandwidth of the GTWR model was determined with the widely used Akaike information criterion in this study.
The previous studies have generally used the expansion speed or intensity of construction land expansion as the dependent variable [35], and this study accordingly used them as the candidate dependent variables and thereafter selected the one with the higher coefficient of determination (R2). Moreover, urban development can be regarded as the process of increase in the benefit of industrial aggregates under the constraints of land conditions and the guidance of government policies according to the input–output theory and the theory of urbanization [36]. It is therefore of high scientific importance and operability to select the indicators of driving factors of urban construction land expansion from the input–output perspective, which can effectively reduce the problem of empiricism and make the research results more robust [37]. Specifically, the input factors of urban development include the land, labor, and capital, which jointly influence the output of urban areas according to the extended Cobb–Douglas production function [38,39]. The approaches of increasing the output from the perspective of urban construction land primarily include the increase in the land area and improvement in the utilization efficiency of urban construction land, both of which are closely related to the input and output of economic activities [40]. This study has therefore selected the driving factors of urban construction land expansion from the input–output perspective (Table 2).
More specifically, the input index layer included the capital input (per capita general public budget expenditure, per capita fixed asset investment) and labor input (permanent population). Meanwhile, the output index layer included the capital output (per capita GDP, per capita industrial output value, and per capita general public budget revenue) and social output (per capita retail sales of consumer goods, per capita disposable income of urban residents, and per capita consumption expenditure of urban residents). At the same time, the topography was used as the limiting index layer, including the land surface’s relief degree and slope (Table 2). In particular, the Economic-Technological Development Area is inconsistent with traditional administrative districts, where the management hierarchy and data acquisition were also inconsistent with other districts and counties. Therefore, this study explored the driving mechanism of urban construction land expansion based on the administrative district to guarantee scientific validity and calculation convenience. Additionally, this study further filtered these driving factors according to their variance inflation factor (VIF) to ensure the accuracy of the model output, with VIF < 5 as the threshold.

3. Results

3.1. Quantitative Characteristics of Urban Construction Land Expansion in Beijing

The results of this study showed that the overall accuracy of the urban construction land detection was above 95% in all years, indicating the retrieval method used in this study performed better than that in most of the previous studies. For example, the accuracy of the ChinaCover2010 product reached approximately 91% in the first class and 82% in the second class. The overall accuracy of the GlobeLand30 V2010 and GlobeLand30 V2020 data reached 83.50% and 85.72%, with Kappa coefficients of 0.78 and 0.82, respectively, while the accuracy of the land use data provided by the Resource and Environment Science and Data Center (https://www.resdc.cn/, accessed on 22 October 2022), which are the most widely used in China, was above 85% for cropland and construction land and approximately 75% for other land use types. These previous studies generally detected urban construction land solely based on remote sensing images, leading to relatively limited retrieval accuracy. By contrast, the Kappa coefficient in this study reached 0.95 in most years, which met the need of exploration of urban construction land expansion, indicating it is feasible to reduce the retrieval workload and improve the retrieval accuracy of the urban construction land by integrating the remote sensing images and impervious surface data.
The results suggested the total area of urban construction land in the study area in 2005, 2010, 2015, and 2020 reached 2746.58 km2, 3130.35 km2, 3429.5 km2, and 3646.15 km2, respectively (Figure 3). Moreover, the results showed obvious spatial heterogeneity of the urban construction land expansion in the study area. Specifically, the construction land was concentrated in the central urban area in 2005, and there was remarkable construction land expansion in the Yanqing District and the surrounding areas of the central urban area during the period 2005–2010. However, the urban construction land expansion slowed down during the period 2010–2015, mainly in the Miyun and Yanqing districts. Furthermore, the urban construction land expansion further slowed down during the period 2015–2020, mainly in the southern and southeastern areas around the central urban area and some parts of the Yanqing and Pinggu districts.
The expansion speed of urban construction land varied remarkably among different parts of the study area, and the urban construction land increased most rapidly during the period 2005–2020 in the central urban area, followed by the new urban development zone, e.g., Daxing, the BDA, Shunyi and Changping districts (Table 3). The urban construction land kept expanding rapidly in the central urban area, which contains the major urban core area with a larger spatial scope and more population. Meanwhile, the urban construction land expansion in the new urban development zone was accelerated in Daxing, Shunyi, Changping, and the BDA but was relatively slow in the Tongzhou and Fangshan districts. By contrast, the urban construction land expansion was relatively rapid in Huairou and Miyun and slowed in Mentougou and Yanqing in the ecological function conservation zone. Overall, the urban construction land expansion in the study area slowed down during the period 2005–2020, especially in the central urban area, where the expansion speed continued to slow down significantly.
The expansion speed of urban construction land in the study area varied significantly in different periods. Specifically, the urban construction land expansion in the central urban area was considerably more remarkable in the central urban area than in other parts of the study area during the period 2005–2010. The urban construction land expanded relatively rapidly in the Daxing and Shunyi districts, the BDA in the new urban development zone, and Huairou District in the ecological function conservation zone during the period 2005–2010 but much more slowly in the Miyun, Yanqing, and Pinggu districts in the ecological function conservation zone. Consequently, the urban construction land expansion slowed down to some degree. However, it was at a relatively high speed in the central urban area during the period 2010–2015, while it significantly accelerated in the BDA and Shunyi District. The urban construction land expansion slowed down in Daxing District, while it was still at a low rate in the Mentougou, Pinggu, and Yanqing districts. The urban construction land expansion was at a relatively high speed in the central urban area, Daxing District, Changping District, Shunyi District, Miyun District, Tongzhou District, and the BDA during the period 2015–2020. However, other parts of the study area experienced a relatively low expansion speed.
Considerable spatial heterogeneity was observed in the intensity of the urban construction land expansion across different parts of Beijing (Table 4). During the period 2005–2020, the areas with high intensity of urban construction land expansion primarily included the BDA and the Yanqing, Miyun, Pinggu, and Huairou districts in the ecological function conservation zone. However, the urban construction land expansion intensity was always low in the central urban area and relatively low in the new urban development area districts and Mentougou District. Specifically, the urban construction land expansion intensity was higher than 5% in the Yanqing, Huairou, and Pinggu districts and the BDA during the period 2005–2010, while it was below 2% in Mentougou District. However, the urban construction land expansion intensity was above 5% in Miyun and the BDA and below 2% in Tongzhou, Changping, and Daxing during the period 2010–2015. The urban construction land expansion intensity was the highest in the BDA during the period 2015–2020, followed by the Yanqing, Miyun, Pinggu, Huairou, and Mentougou districts, while it reached only 0.71% in Shunyi District.
The urban construction land expansion intensity was always the lowest in the central urban area, without any change in the intensity level throughout the study period (Figure 4). It was generally high in the new urban development area but decreased throughout the study. The urban construction land expansion intensity was the highest in the ecological function conservation area far from the central urban area but significantly declined during the study period. Overall, the urban construction land expansion intensity in Beijing gradually increased from the central urban area to the peripheral areas, indicating that the pressure for expanding construction land in Beijing gradually shifted outward. It continuously decreased in the central urban area and most districts in the study area.
There was slight differentiation in the AWMPFD of different regions of Beijing, which showed an overall increasing trend in most of the study areas (Table 5). Specifically, the AWMPFD of the central urban area and Daxing District exceeded 1.3 in 2005, while that of other regions generally ranged between 1.21 and 1.27. The AWMPFD exceeded 1.3 in three parts of the study area in 2010, i.e., the central urban area, Shunyi District, and Tongzhou District; however, that of Daxing District decreased to 1.29. Meanwhile, the AWMPFD of other districts showed slight variation. In 2015, the number of regions with AWMPFD values over 1.3 reached four: the central urban area, Daxing, Tongzhou, and Shunyi districts. Contrastingly, the number of regions with an AWMPFD of over 1.3 reached five in 2020: the central urban area, Shunyi, Tongzhou, Changping, and Daxing districts. In addition, the variation in the AWMPFD differed remarkably among regions. For example, the AWMPFD of the Changping, Huairou, Shunyi, and Yanqing districts increased continuously. The BDA increased, decreased, and then increased, with an overall increasing trend. By contrast, the AWMPFD of the central urban area, Fangshan, Tongzhou, Daxing, and Mentougou districts first increased and then decreased, as opposed to that of the Miyun and Pinggu districts.
There was also a remarkable variation in the AWMSI across different parts of the study area during the period 2005–2020 (Table 6). In general, the AWMSI was below 20 in most regions of the study, exceeding 20 in only two or three regions during the study period, and the AWMSI in the central urban area consistently surpassed that of other parts of the study area. Specifically, the AWMSI in most regions ranged from 7.89 to 12.50 in 2005, exceeding 20 in only the central urban area and Daxing. The AWMSI slightly increased in most regions of the study area during the period 2005–2010, ranging between 7.59 and 19.66; however, it significantly increased in the central urban area. The AWMSI significantly decreased only in Pinggu and slightly increased in other regions during the period 2010–2015, including the central urban area. Meanwhile, the AWMSI slightly increased in most regions of the study area during the period 2015–2020 but showed a significant decrease in the central urban area. In addition, regarding changing trends, the AWMSI increased and then decreased in the central urban area and Mentougou and Tongzhou districts during the study period, while it continuously increased in the Huairou, Shunyi, and Yanqing districts. By contrast, the AWMSI exhibited fluctuations or slight increases in the Changping, Fangshan, and Miyun districts and the BDA. However, in Pinggu District, the AWMSI initially decreased and then increased, consistently maintaining very low values.

3.2. Driving Mechanisms of Expansion of Urban Construction Land in Beijing

Seven dependent variables were finally selected according to the VIF (Table 7) for ensuring the accuracy of the model output. Specifically, the selected dependent variables were the permanent resident population, per capita consumption expenditure of urban residents, per capita public budget expenditure, per capita fixed asset investment, per capita GDP, per capita industrial output value, and per capita total social consumer goods.
The results of the GTWR model suggested the R2 value of the expansion speed was higher than 0.95, while that of the expansion intensity was lower than 0.80 (Table 8). Therefore, the expansion speed was more appropriate to be used as the dependent variable of the GTWR model. However, the expansion intensity is often influenced by the initial period of construction land area, and the adaptability of this indicator is relatively weak. This study has therefore used the expansion speed of urban construction land as the dependent variable of the GTWR model and further explored its relationship with an independent variable in Beijing.
The results of the GTWR model revealed the driving mechanisms behind urban construction land expansion in Beijing as follows (Table 9): (1) the coefficient of per capita general public budget expenditures is relatively stable over time, generally showing a negative impact in the study area except for in the Miyun and Pinggu districts. Specifically, the absolute values of this coefficient were relatively large in the central urban area and new urban development zone. However, its absolute value remained relatively low and stable over time in the ecological conservation zone. (2) The per capita fixed asset investment coefficient significantly varied over time. There was a similarity between the central urban area and new urban development zone, as both areas exhibited a synchronized trend of initially increasing and then decreasing. The per capita fixed asset investment positively affected the urban construction land expansion in the central urban area but negatively affected the ecological conservation zone, except for Yanqing District. (3) The coefficient of the permanent resident population was relatively stable over time but with more remarkable regional differences. This coefficient was relatively low in the central urban area and new urban development zone, which showed some similarity. Moreover, it was high in the ecological conservation zone, indicating this area was susceptible to the influence of the permanent resident population. (4) The coefficients of per capita GDP were all positive and continuously increased during different periods. (5) The per capita industrial output value coefficient was relatively stable over time, with significant spatial differences. This coefficient was generally negative in the central urban area and new urban development zone, whereas it was positive in the ecological conservation zone throughout the study period. (6) The coefficient of per capita urban resident consumption showed a transition from positive to negative in the study area. Specifically, this coefficient was generally negative in the central and new urban development areas. However, it transitioned from negative to positive in the ecological conservation zone in the Miyun and Pinggu districts. (7) The coefficient of per capita retail sales of social consumer goods showed a steady decline over the study period. This coefficient was relatively high in the central urban area and new urban development zone and low in the ecological conservation zone, and it remained relatively stable throughout the study period.
The results obtained from the input–output perspective revealed the driving mechanism of urban construction land expansion in Beijing more clearly. On the one hand, from the input perspective, the permanent population was the main driving factor of the urban construction land expansion, indicating the population growth had a stronger promoting effect on urban expansion in Beijing. However, population growth may lead to decreased per capita general public budget expenditure and per capita fixed asset investment. As a result, the coefficient of per capita general public budget expenditure was generally negative. On the other hand, the explanatory power of per capita fixed asset investment was insufficient, and its coefficient was even negative in some districts. This suggested the rapid population growth rather than the overall capital investment from the entire society was the main driver of urban construction land expansion. On the other hand, from the output perspective, per capita GDP was the main factor promoting the urban construction land expansion, indicating the level of economic development strongly promoted urban expansion in Beijing. Meanwhile, per capital retail sales of social consumer goods had explanatory power for the urban construction land expansion only second to per capita GDP, indicating the overall level of social consumption significantly impacted the urban construction land expansion in the study area. But the explanatory power of per capita industrial output value and urban residents’ per capita consumption expenditure was insufficient for the urban construction land expansion, which may be related to the special industrial structure of Beijing. In particular, the impact of permanent residents on the urban construction land expansion was relatively less significant in the central urban area with a higher economic development level than that in the ecological function conservation zone, contrary to that of per capita social consumption and retail sales. By contrast, the impact of per capita GDP, which showed an increasing trend, was relatively significant in all districts, indicating that the land use in these urban areas has become more intensive. Overall, urban construction land expansion in Beijing was mainly influenced by three factors, i.e., population, per capita GDP, and per capita retail sales of social consumer goods.

4. Discussion

The urban construction land expansion in the study area has overall slowed down, with a significant decrease in the expansion speed and intensity in the central urban area, which showed an inverted “U-shaped” curve according to previous studies [15]. However, there was an increase in the expansion speed and intensity in the new urban development zone and ecological function conservation zone, thus shifting the center of urban expansion toward these zones. This is consistent with the spatial development strategy proposed by the previous overall urban planning of Beijing, aiming to transfer the strategic development of the old urban area and promote the construction of new urban areas. The expansion intensity in the ecological function conservation zone was significantly higher than that in the central urban area and new urban development zone, primarily due to the significantly lower urbanization baseline in the former.
It is notable that the urban construction land expansion in the central urban area was firstly dispersed and then compact, indicating a gradual shift from outward expansion to inward enhancement. This is primarily consistent with the conclusions of previous studies, i.e., the central urban area of Beijing has entered the later stage of urban construction land expansion with a slower expansion speed but better quality [15]. Furthermore, the AWMPFD declined slightly in a few districts and generally increased in most districts, indicating the urban construction land expansion was mainly in the new urban development zone and ecological conservation zone, which resulted in more complex morphological characteristics of the urban construction land in these zones. Additionally, the topography in some districts limited the urban construction land expansion, leading to complex morphological characteristics of the urban construction land. It is therefore necessary to pay more attention to the rapid urban construction land expansion in these suburban districts, which may lead to new urban sprawl and the destruction of ecological functions in the ecological conservation zone. Moreover, there is generally a close exchange of various elements between the central urban area and suburban districts in Beijing and other highly urbanized regions, but the previous studies generally focused only on the central urban zone, ignoring the role of regional coordinated development. This study more accurately revealed the overall mechanism of the urban construction land expansion by including the central urban zone, the new urban development zone, and the ecological conservation zone.
This study revealed urban construction land more accurately by overlaying the remote sensing data with impervious surface data. However, not only urban construction land expansion but also spatial aggregation of the population, industry, and infrastructure occurred in the urbanization process. It is difficult to comprehensively characterize the expansion of urban space with only the urban construction land expansion. Therefore, it is necessary to consider more factors to better characterize the urbanization process in the future. Moreover, previous studies mostly selected the indicators of driving factors of urban construction land expansion according to the research experience of other scholars, generally lacking a firm theoretical foundation. This study selected these indicators more rationally from the input–output perspective according to the input–output theory, which can effectively reduce the problem of empiricism and make the research results more robust. But this study still failed to take into account the impacts of institutional factors such as policies and city planning, and the influence of transportation factors and planning policies can only be indirectly reflected with some input factors. It is necessary to further improve the framework for selecting the driving factors of urban construction land expansion from the input–output perspective by considering more factors and including more direct characterization indicators in future studies.

5. Conclusions

This study revealed the characteristics of urban construction land expansion in Beijing during the period 2005–2020 based on the data retrieved using Landsat images and impervious surface data and explored its driving mechanism with the (GTWR) model from the input–output perspective. The major conclusions were as follows: (1) the expansion speed and intensity of urban construction land in Beijing showed an overall tendency to slow down, particularly in the central urban area, and the center of urban expansion shifted to the new urban development zone and ecological function conservation zone. (2) The morphological indices in the central urban area exhibited an initial increase followed by a decrease, indicating the urban construction land expansion in the central urban area was first scattered and then compact. However, the morphological indices increased in most of the new urban development zone and ecological function conservation zone, indicating that the urban construction land expansion in these zones primarily followed an outward pattern. (3) The urban construction land expansion in Beijing was driven by multiple factors, with the permanent population, per capita GDP, and per capita retail sales of social consumer goods being the primary driving factors. The impact of the permanent population was significantly smaller in the central urban area and the new urban development zone than in the ecological function conservation zone, which is contrary to that of per capita retail sales of social consumer goods. By contrast, the impact of per capita GDP was significant in all districts. These findings can make a significant contribution to improving urbanization and land use planning towards the goal of carbon neutrality in Beijing and other cities.

Author Contributions

Conceptualization, H.Y. (Huicai Yang) and X.J.; methodology, J.M.; software, J.M.; validation, X.J. and H.Y. (Haiming Yan); formal analysis, G.S.; investigation, J.M.; resources, G.S.; data curation, J.M. and H.Y. (Haiming Yan); writing—original draft preparation, X.J.; writing—review and editing, X.J.; visualization, J.M.; supervision, G.S.; project administration, X.J. and H.Y. (Haiming Yan). All authors have read and agreed to the published version of the manuscript.

Funding

The China Postdoctoral Science Foundation (2019M650823).

Data Availability Statement

All data, models, and code generated or used during this study are available from the authors upon request.

Conflicts of Interest

The authors declare no conflict of interest.

References

  1. Lai, L.; Huang, X.; Yang, H.; Chuai, X.; Zhang, M.; Zhong, T.; Thompson, J.R. Carbon emissions from land-use change and management in China between 1990 and 2010. Sci. Adv. 2016, 2, e1601063. [Google Scholar] [CrossRef] [PubMed] [Green Version]
  2. Yang, B.; Chen, X.; Wang, Z.; Li, W.; Zhang, C.; Yao, X. Analyzing land use structure efficiency with carbon emissions: A case study in the middle reaches of the Yangtze River, China. J. Clean. Prod. 2020, 274, 123076. [Google Scholar] [CrossRef]
  3. Huang, S.; Xi, F.; Chen, Y.; Gao, M.; Pan, X.; Ren, C. Land Use Optimization and simulation of low-carbon-oriented—A case study of Jinhua, China. Land 2021, 10, 1020. [Google Scholar] [CrossRef]
  4. Yang, H.; Huang, J.; Liu, D. Linking climate change and socioeconomic development to urban land use simulation: Analysis of their concurrent effects on carbon storage. Appl. Geogr. 2020, 115, 102135. [Google Scholar] [CrossRef]
  5. Peng, J.; Zheng, Y.; Liu, C. The Impact of urban construction land use change on carbon emissions: Evidence from the China land market in 2000–2019. Land 2022, 11, 1440. [Google Scholar] [CrossRef]
  6. Wang, S.; Shi, C.; Fang, C.; Feng, K. Examining the spatial variations of determinants of energy-related CO2 emissions in China at the city level using Geographically Weighted Regression Model. Appl. Energy 2018, 235, 95–105. [Google Scholar] [CrossRef]
  7. Wang, Q.; Xiao, Y. Has Urban Construction Land achieved low-carbon sustainable development? A case study of North China Plain, China. Sustainability 2022, 14, 9434. [Google Scholar] [CrossRef]
  8. Zhou, Z.; Cao, L.; Zhao, K.; Li, D.; Ding, C. Spatio-temporal effects of multi-dimensional urbanization on carbon emission efficiency: Analysis based on panel data of 283 cities in China. Int. J. Environ. Res. Public Health 2021, 18, 12712. [Google Scholar] [CrossRef]
  9. Alqahtany, A. GIS-based assessment of land use for predicting increase in settlements in Al Ahsa Metropolitan Area, Saudi Arabia for the year 2032. Alex. Eng. J. 2023, 62, 269–277. [Google Scholar] [CrossRef]
  10. Yang, Y.; Liu, Y.; Li, Y.; Du, G. Quantifying spatio-temporal patterns of urban expansion in Beijing during 1985–2013 with rural-urban development transformation. Land Use Policy 2018, 74, 220–230. [Google Scholar] [CrossRef]
  11. Lin, M.; Shi, Y.; Chen, Y.; Yu, D.Q.; He, Q.; Wang, L. A study on spatial-temporal features of construction land expansion in Changsha urban area. Geogr. Res. 2007, 26, 265–274. [Google Scholar]
  12. Alqurashi, A.F.; Kumar, L. Spatiotemporal patterns of urban change and associated environmental impacts in five Saudi Arabian cities: A case study using remote sensing data. Habitat Int. 2016, 58, 75–88. [Google Scholar] [CrossRef]
  13. Al-Bilbisi, H. Spatial monitoring of urban expansion using satellite remote sensing images: A case study of Amman City, Jordan. Sustainability 2019, 11, 2260. [Google Scholar] [CrossRef] [Green Version]
  14. Abass, K.; Adanu, S.K.; Agyemang, S. Peri-urbanisation and loss of arable land in Kumasi Metropolis in three decades: Evidence from remote sensing image analysis. Land Use Policy 2018, 72, 470–479. [Google Scholar] [CrossRef]
  15. Zhang, H.; Liang, C.; Pan, Y. Spatial expansion of built-up areas in the beijing–tianjin–hebei urban agglomeration based on nighttime light data: 1992–2020. Int. J. Environ. Res. Public Health 2022, 19, 3760. [Google Scholar] [CrossRef]
  16. Dutta, D.; Rahman, A.; Paul, S.K.; Kundu, A. Impervious surface growth and its inter-relationship with vegetation cover and land surface temperature in peri-urban areas of Delhi. Urban Clim. 2021, 37, 100799. [Google Scholar] [CrossRef]
  17. Xia, C.; Zhang, A.; Yeh, A.G. Shape-weighted landscape evolution index: An improved approach for simultaneously analyzing urban land expansion and redevelopment. J. Clean. Prod. 2020, 244, 118836. [Google Scholar] [CrossRef]
  18. Wu, R.; Li, Y.C.; Wang, S.J. Will the construction of high-speed rail accelerate urban land expansion? Evidences from Chinese cities. Land Use Policy 2022, 114, 105920. [Google Scholar] [CrossRef]
  19. Ma, Y.L.; Xu, R.S. Remote sensing monitoring and driving force analysis of urban expansion in Guangzhou City, China. Habitat Int. 2010, 34, 228–235. [Google Scholar] [CrossRef]
  20. Fei, W.; Zhao, S. Urban land expansion in China’s six megacities from 1978 to 2015. Sci. Total Environ. 2019, 664, 60–71. [Google Scholar] [CrossRef]
  21. Chen, L.Y.; Huang, F.; Qi, H.; Zhai, H. Analysis of urban expansion and the driving forces in eastern coastal region of China. In Proceedings of the Conference on Remote Sensing Technologies and Applications in Urban Environments 2018, Berlin, Germany, 9 October 2018. [Google Scholar] [CrossRef]
  22. Zhang, L.Q.; Chen, S.P.; Chen, B.P. The contribution of land to the economic growth and inflection point of its logistic curve in Anhui Province in recent 15 years. Sci. Geogr. Sin. 2014, 1, 40–46. [Google Scholar]
  23. Liu, Y.S.; Zhang, Z.W.; Zhou, Y. Efficiency of construction land allocation in China: An econometric analysis of panel data. Land Use Policy 2018, 74, 261–272. [Google Scholar] [CrossRef]
  24. Shu, B.; Zhang, H.; Li, Y.; Qu, Y.; Chen, L. Spatiotemporal variation analysis of driving forces of urban land spatial expansion using logistic regression: A case study of port towns in Taicang City, China. Habitat Int. 2014, 43, 181–190. [Google Scholar] [CrossRef]
  25. Sarkar, A.; Chouhan, P. Modeling spatial determinants of urban expansion of Siliguri a metropolitan city of India using logistic regression. Model. Earth Syst. Environ. 2020, 6, 2317–2331. [Google Scholar] [CrossRef]
  26. Peng, W.; Wang, G.; Zhou, J.; Zhao, J.; Yang, C. Studies on the temporal and spatial variations of urban expansion in Chengdu, western China, from 1978 to 2010. Sustain. Cities Soc. 2015, 17, 141–150. [Google Scholar] [CrossRef] [Green Version]
  27. El-Hamid, H.T.A.; Caiyong, W.; Yongting, Z. Geospatial analysis of land use driving force in coal mining area: Case study in Ningdong, China. GeoJournal 2021, 86, 605–620. [Google Scholar] [CrossRef]
  28. Brunsdon, C.; Fotheringham, A.S.; Charlton, M.E. Geographically weighted regression: A method for exploring spatial nonstationarity. Geogr. Anal. 1996, 28, 281–298. [Google Scholar] [CrossRef]
  29. Huang, B.; Wu, B.; Barry, M. Geographically and temporally weighted regression for modeling spatio-temporal variation in house prices. Int. J. Geogr. Inf. Sci. 2010, 24, 383–401. [Google Scholar] [CrossRef]
  30. Wang, D.G.; Kwan, M.P. Selected studies on urban development issues in China: Introduction. Urban Geogr. 2017, 38, 360–362. [Google Scholar] [CrossRef]
  31. Zhou, Y.; Chen, M.; Tang, Z.; Mei, Z. Urbanization, land use change, and carbon emissions: Quantitative assessments for city-level carbon emissions in Beijing-Tianjin-Hebei region. Sustain. Cities Soc. 2021, 66, 102701. [Google Scholar] [CrossRef]
  32. Luo, G.; Chen, X.; Zhou, K.; Ye, M. Temporal and spatial variation and stability of the oasis in the Sangong River Watershed, Xinjiang, China. Sci. China Ser. D 2003, 46, 62–73. [Google Scholar] [CrossRef]
  33. Cheng, L.X.; Feng, R.Y.; Wang, L.Z. Fractal characteristic analysis of urban land-cover spatial patterns with spatiotemporal remote sensing images in Shenzhen city (1988–2015). Remote Sens. 2021, 13, 4640. [Google Scholar] [CrossRef]
  34. Zhang, Y.; Chen, X. Spatial and nonlinear effects of new-type urbanization and technological innovation on industrial carbon dioxide emission in the Yangtze River Delta. Environ. Sci. Pollut. Res. 2023, 30, 29243–29257. [Google Scholar] [CrossRef] [PubMed]
  35. Hu, P.P.; Li, F.; Hu, D.; Sun, X. Spatial and temporal characteristics of urban expansion in pearl River Delta urban agglomeration from 1980 to 2015. Acta Ecol. Sin. 2021, 41, 7063–7072. [Google Scholar]
  36. Xie, H.; Zhu, Z.; Wang, B.; Liu, G.; Zhai, Q. Does the expansion of urban construction land promote regional economic growth in China? Evidence from 108 cities in the Yangtze River Economic Belt. Sustainability 2018, 10, 4073. [Google Scholar] [CrossRef] [Green Version]
  37. Jin, G.; Deng, X.; Zhao, X.; Guo, B.; Yang, J. Spatiotemporal patterns in urbanization efficiency within the Yangtze River Economic Belt between 2005 and 2014. J. Geogr. Sci. 2018, 28, 1113–1126. [Google Scholar] [CrossRef] [Green Version]
  38. Xu, G.; Yin, X.; Wu, G.; Gao, N. Rethinking the contribution of land element to urban economic growth: Evidence from 30 provinces in China. Land 2022, 11, 801. [Google Scholar] [CrossRef]
  39. Zhu, X.; Zhang, P.; Wei, Y.; Li, Y.; Zhao, H. Measuring the efficiency and driving factors of urban land use based on the DEA method and the PLS-SEM model—A case study of 35 large and medium-sized cities in China. Sustain. Cities Soc. 2019, 50, 101646. [Google Scholar] [CrossRef]
  40. Liu, S.; Xiao, W.; Li, L.; Ye, Y.; Song, X. Urban land use efficiency and improvement potential in China: A stochastic frontier analysis. Land Use Policy 2020, 99, 105046. [Google Scholar] [CrossRef]
Figure 1. Overview of the study area.
Land 12 01388 g001
Figure 2. Technical flowchart of the construction land interpretation.
Land 12 01388 g002
Figure 3. Spatial pattern of construction land expansion in Beijing during the period 2005–2020.
Land 12 01388 g003
Figure 4. Spatial differentiation of expansion intensity during (a) 2005–2010, (b) 2010–2015, and (c) 2015–2020.
Land 12 01388 g004
Table 1. Information on remote sensing images used in this study.
DateSatelliteSensorStrip Number/Row Number
2005Landsat 5TM123/32, 123/33
2010Landsat 5TM123/32, 123/33
2015Landsat 8OLI123/32, 123/33, 124/32
2020Landsat 8OLI123/32, 123/33, 124/32
Table 2. Selection of influencing factors of urban construction land expansion.
Index LayerVariableIndex FactorIndex Explanation
Capital inputX1Per capita general public budget expenditureGovernment support level
X2Per capita fixed asset investmentOverall investment intensity
Labor inputX3Permanent populationHuman resource foundation
Economic outputX4Per capita GDPLevel of economic development
X5Per capita industrial output valueLevel of industrial capacity
X6Per capita general public budget revenueGovernment revenue and expenditure capacity
Social outputX7Per capita disposable income of urban residentsStandard of living for residents
X8Per capita consumption level of urban residentsConsumer demand for residents
X9Per capita social consumer goods retail salesLevel of social consumption
Terrain constraintsX10, X11Relief degree of land surface, slopeGeological and geomorphic foundation
Table 3. Expansion speed of urban construction land in Beijing by districts and counties (unit: km2/a).
2005–20102010–20152015–20202005–2020
Central urban area8.856.453.646.31
Changping District3.561.891.412.29
Shunyi District3.683.991.333.00
Tongzhou District2.761.771.021.85
Daxing District4.843.061.823.24
Fangshan District2.551.860.901.77
Mentougou District0.480.680.580.58
Miyun District1.372.581.311.75
Pinggu District1.630.940.811.13
Huairou District2.702.071.422.06
Yanqing District1.090.700.940.91
Economic-Technological Development Area3.665.161.033.28
Overall37.1731.1516.2128.17
Table 4. Urban land expansion intensity in different parts of Beijing.
2005–20102010–20152015–20202005–2020
Central urban area0.98%0.68%0.37%0.70%
Changping District4.30%1.88%1.28%2.76%
Shunyi District2.48%2.39%0.71%2.02%
Tongzhou District3.09%1.71%0.91%2.07%
Daxing District3.59%1.92%1.05%2.40%
Fangshan District3.38%2.11%0.92%2.35%
Mentougou District1.78%2.32%1.77%2.15%
Miyun District3.19%5.17%2.08%4.07%
Pinggu District5.62%2.53%1.93%3.89%
Huairou District5.26%3.19%1.89%4.02%
Yanqing District6.34%3.10%3.60%5.30%
Economic-Technological Development Area5.02%5.65%0.88%4.50%
Overall2.22%1.67%0.80%1.68%
Table 5. Area-weighted mean fractal dimension of different parts of Beijing during the period 2005–2020.
2005201020152020
Central urban area1.33911.35681.36441.3562
Changping District1.24981.28861.29611.3095
Shunyi District1.26061.28661.31261.3247
Tongzhou District1.26791.31151.31201.3111
Daxing District1.31601.31741.30001.3012
Fangshan District1.25341.26101.28581.2766
Mentougou District1.26021.27431.28181.2646
Miyun District1.23551.23061.22641.2481
Pinggu District1.22251.21151.18121.1888
Huairou District1.21641.22981.25401.2765
Yanqing District1.23671.24471.25131.2627
Economic-Technological Development Area1.24841.28491.26021.2949
Table 6. Area-weighted mean shape index of different parts of Beijing during the period 2005–2020.
2005201020152020
Central urban area36.172643.289946.005942.0748
Changping District12.314017.992417.932220.3908
Shunyi District7.890717.135023.284525.2900
Tongzhou District12.495719.658919.346219.0957
Daxing District21.082221.555917.859318.0682
Fangshan District9.994710.212712.980612.0844
Mentougou District9.560410.901212.146910.5061
Miyun District9.563910.09089.847911.8292
Pinggu District7.89077.59555.40316.0641
Huairou District8.39478.940012.730615.0203
Yanqing District7.98088.89929.450210.6989
Economic-Technological Development Area11.003315.766313.677117.9802
Table 7. VIF values of selected independent variables.
Per Capita General Public Budget ExpenditurePer Capita Fixed Asset InvestmentPermanent PopulationPer Capita GDPPer Capita Industrial Output ValuePer Capita Consumption Level of Urban ResidentsPer Capita Social Consumer Goods Retail Sales
2.451.532.113.201.571.603.46
Table 8. Related parameters of geographically and temporally weighted regression of urban construction expansion.
Model ParametersBandwidthSigmaAICcR2R2 AdjustedSpatiotemporal
Distance Ratio
Expansion intensity0.81860.273873.03000.78870.66190.2731
Expansion speed0.29920.045316.61500.95050.93660.3731
Table 9. Results of geographically and temporally weighted regression.
X1X2X3X4X5X8X9
2005–
2010
Central urban area−0.2627 0.0911 0.4581 0.4111 −0.0470 −0.1188 0.3784
Changping District−0.1810 0.0507 0.5285 0.5618 0.0027 −0.1306 0.2340
Shunyi District−0.1465 −0.0304 0.4790 0.3418 −0.0110 −0.0529 0.2786
Tongzhou District−0.2678 0.0707 0.4427 0.2524 −0.0707 −0.1494 0.4573
Daxing District−0.3894 0.1460 0.3834 0.1706 −0.0725 −0.1438 0.5815
Fangshan District−0.4414 0.1048 0.4116 0.2665 0.0604 −0.0576 0.5264
Mentougou District−0.2962 0.0869 0.5388 0.5802 0.0730 −0.1157 0.2878
Miyun District0.0335 −0.2138 0.7636 0.3551 0.0966 −0.0751 0.0270
Pinggu District0.0052 −0.1401 0.7294 0.3455 0.0710 −0.0636 0.0638
Huairou District−0.0442 −0.1048 0.5869 0.3213 0.0822 −0.0906 0.1099
Yanqing District−0.1250 0.0272 0.5800 0.4986 0.0770 −0.1538 0.1586
2010–
2015
Central urban area−0.2283 0.0666 0.4654 0.4465 −0.0428 −0.1272 0.3669
Changping District−0.1692 0.0523 0.5383 0.6209 −0.0036 −0.1363 0.2164
Shunyi District−0.1257 −0.0409 0.4740 0.4419 −0.0143 −0.0271 0.2359
Tongzhou District−0.2255 0.0371 0.4568 0.3372 −0.0667 −0.1443 0.4183
Daxing District−0.3287 0.0990 0.4029 0.2239 −0.0575 −0.1612 0.5518
Fangshan District−0.3702 0.0624 0.4105 0.2417 0.0707 −0.0927 0.5476
Mentougou District−0.2322 0.0500 0.5361 0.5529 0.0662 −0.1533 0.3234
Miyun District0.0362 −0.2434 0.7369 0.4078 0.0936 −0.0436 0.0152
Pinggu District0.0110 −0.1818 0.6773 0.4275 0.0707 −0.0028 0.0406
Huairou District−0.0496 −0.0982 0.5679 0.3992 0.0704 −0.0937 0.0895
Yanqing District−0.1320 0.0432 0.5872 0.5974 0.0594 −0.1669 0.1379
2015–
2020
Central urban area−0.1967 0.0888 0.4788 0.5098 −0.0592 −0.1296 0.3274
Changping District−0.1555 0.0826 0.5434 0.6752 −0.0279 −0.1392 0.1928
Shunyi District−0.0886 −0.0007 0.4608 0.5114 −0.0417 −0.0200 0.2261
Tongzhou District−0.1856 0.0712 0.4645 0.4295 −0.0819 −0.1383 0.3717
Daxing District−0.2691 0.1164 0.4326 0.3273 −0.0788 −0.1825 0.4813
Fangshan District−0.3072 0.0862 0.4731 0.4229 0.0194 −0.1196 0.4222
Mentougou District−0.2102 0.0844 0.5839 0.6991 0.0223 −0.1657 0.2267
Miyun District0.0508 −0.1741 0.6566 0.4424 0.0603 0.0013 0.0276
Pinggu District0.0346 −0.1124 0.5767 0.4982 0.0220 0.0072 0.0556
Huairou District−0.0358 −0.0510 0.5169 0.4572 0.0372 −0.0949 0.0899
Yanqing District−0.1330 0.0764 0.5725 0.6647 0.0261 −0.1805 0.1306
Disclaimer/Publisher’s Note: The statements, opinions and data contained in all publications are solely those of the individual author(s) and contributor(s) and not of MDPI and/or the editor(s). MDPI and/or the editor(s) disclaim responsibility for any injury to people or property resulting from any ideas, methods, instructions or products referred to in the content.

