Article

Where Will Threatened Aegle marmelos L., a Tree of the Semi-Arid Region, Go under Climate Change? Implications for the Reintroduction of the Species

1
Department of Botany, University of Okara, Okara 56300, Pakistan
2
Department of Ethnobotany, Institute of Botany, Ilia State University, 0162 Tbilisi, Georgia
3
Department of Zoology, Wildlife, & Fisheries, PMAS-Arid Agriculture University, Rawalpindi 45600, Pakistan
4
Department of Botany and Microbiology, College of Science, King Saud University, Riyadh 11451, Saudi Arabia
5
Department of Botany, State Museum of Natural History, 76133 Karlsruhe, Germany
6
Institute of molecular biology and biotechnology (IMBB), The University of Lahore, Lahore 54000, Pakistan
*
Authors to whom correspondence should be addressed.
Land 2023, 12(7), 1433; https://doi.org/10.3390/land12071433
Submission received: 13 June 2023 / Revised: 10 July 2023 / Accepted: 11 July 2023 / Published: 18 July 2023
(This article belongs to the Special Issue Geospatial Data in Landscape Ecology and Biodiversity Conservation)

Abstract

:
The conservation of threatened species and the restoration of ecosystems have emerged as crucial ecological prerequisites in the context of a changing global environment. One such species of significant commercial value is the Bael tree, scientifically known as Aegle marmelos, which is native to semi-arid regions in Pakistan. However, the species faces threats in Pakistan due to overexploitation and changing land use. To support sustainable production practices and agricultural planning, it is important to investigate how climate change has affected the geographic distribution of Aegle marmelos. Additionally, the impact of climate change on its frequency and distribution remains uncertain. To address these concerns, we employed species distribution modeling techniques using MaxEnt and GIS to predict the present and future distribution of favorable habitats for Aegle marmelos. Based on our findings, several key bioclimatic variables were identified as significant influencers of Aegle marmelos distribution. These variables include soil bulk density (bdod), isothermality (bio03), precipitation during the warmest quarter (bio18), and mean temperature during the wettest quarter (bio08). Currently, the potential suitable habitat for Aegle marmelos spans an area of approximately 396,869 square kilometers, primarily concentrated in the regions of Punjab, Khyber Pakhtunkhwa, and Balochistan in Pakistan. The habitats deemed highly suitable for Aegle marmelos are predominantly found in upper and central Punjab. However, if climate change persists, the suitable habitats in Pakistan are likely to become more fragmented, resulting in a significant shift in the overall suitable area. Moreover, the distribution center of the species is expected to relocate towards the southeast, leading to increased spatial separation over time. The results of this research significantly contribute to our understanding of the geo-ecological aspects related to Aegle marmelos. Furthermore, they provide valuable recommendations for the protection, management, monitoring, and sustainable production of this species.

1. Introduction

In an era of global change, the ranges of endemic species are altering at an accelerated rate [1]. However, these changes go beyond protecting natural systems and are already changing the make-up of biological communities [2]. Climate change will have an effect on biodiversity, possibly leading to the decline or extinction of threatened species [3]. Direct effects of changes in temperature and precipitation regimes [4], as well as indirect effects of climate change (e.g., disturbance dynamics, shifts in biotic interaction), will all have an impact on biodiversity [5]. Prioritizing landscapes that can support biodiversity protection is essential for conducting recovery initiatives, especially for threatened species that are more susceptible to extinction [6,7].
Species Distribution Modeling (SDM) is an effective tool that can be applied to anticipate the potential for a species to exist in a specific place. By analyzing environmental variables, such as temperature, precipitation, topography, and land use, researchers can create models identifying the locations where a specific species is most likely to be found [8]. SDMs can be employed to determine crucial habitats and conservation areas, monitor the expansion of invasive plants, and estimate climate change’s consequences on species distributions [9,10,11,12,13]. By using SDMs, researchers can reduce the cost and time associated with fieldwork, since they can focus their efforts on areas with the highest possibility of locating the desired species [14]. Species Distribution Models (SDMs) have been applied to predict how climate change would affect the distribution of different species, which can help to guide conservation and management efforts aimed at mitigating these impacts [15]. Overall, SDMs are a versatile and powerful tool for understanding species distributions and the factors that influence them [16]. They can assist in guiding the greater effectiveness and efficiency of resources in the pursuit of a variety of conservation and management decisions.
In order to determine a species’ potential suitable habitat patches, SDMs require data on the occurrence of that species and environmental factors (e.g., land use, climate variables, and topography) that can influence its distribution [17,18]. In order to create SDM, the connection between the data on occurrences and the predictor parameters is analyzed using statistical algorithms and machine learning techniques. This model is then used to calculate the possibility of existence for the species over a larger geographic area [19]. After developing a species distribution model (SDM), it can be utilized to estimate the likelihood of species presence in areas where occurrence records are unavailable. In addition, SDMs can identify areas where the species is most likely to occur, based on the prevailing environmental conditions. By analyzing the ecological parameters that are believed to affect the dispersal of a particular species, SDMs can pinpoint areas where the environmental conditions are most favorable for that species to flourish [20,21,22,23,24]. Aegle marmelos, commonly known as the Bael tree, is a species that is currently categorized as near threatened [25]. Aegle marmelos has a native distribution that spans from eastern Pakistan through the sub-Himalayan tract to Bangladesh and extends south towards the Western Ghats [26]. Although there are indications of Aegle marmelos being introduced to Myanmar and the Andaman and Nicobar Islands, it is listed as part of the native flora in these regions [27,28]. Its population is declining primarily due to various human activities such as residential and commercial development, biological resource use, and agriculture and aquaculture practices. Residential and commercial development often involves habitat destruction and fragmentation, leading to the loss of suitable habitats for Aegle marmelos [29,30]. This species is also at risk due to the extraction of its biological resources, including timber and medicinal products derived from its fruits, leaves, and bark. Additionally, agricultural expansion and aquaculture activities can further contribute to habitat degradation and loss, impacting the survival of Aegle marmelos populations [31]. In the regions of Karnataka and Tamil Nadu, there is a significant trade of Aegle marmelos root barks and fruit pulps due to their considerable medicinal value. The commercial exploitation of these plant parts is prevalent in these areas. In Andhra Pradesh and Maharashtra, the documented threats to Aegle marmelos include the trade of the entire plant and its parts, local utilization, habitat loss, and human interference [32]. To analyze the habitat suitability of Aegle marmelos in Pakistan, MaxEnt and ArcGIS were employed to model the appropriate habitats for the species, considering various environmental factors like soil, bioclimatic conditions, topography, and human activities. The study also used global climate models (GCMs) that can be utilized to predict future climate change and the species’ appropriate regions [33]. The use of MaxEnt and ArcGIS in this study provides important scientific recommendations for the responsible planning and cultivation of high-quality crops of Aegle marmelos in Pakistan. By analyzing the suitability of various areas for cultivation and considering the potential impacts of climate change, this study can help support the sustainable growth and conservation of this important plant. The main goals of the present research are to (1) develop predictive models of Aegle marmelos growth and distribution in Pakistan under current and future ecological environments; (2) recognize the hotspots where environmental conditions are optimal for the species development; and (3) identify the potential habitats for ecological restoration under future climate change.

2. Materials and Methods

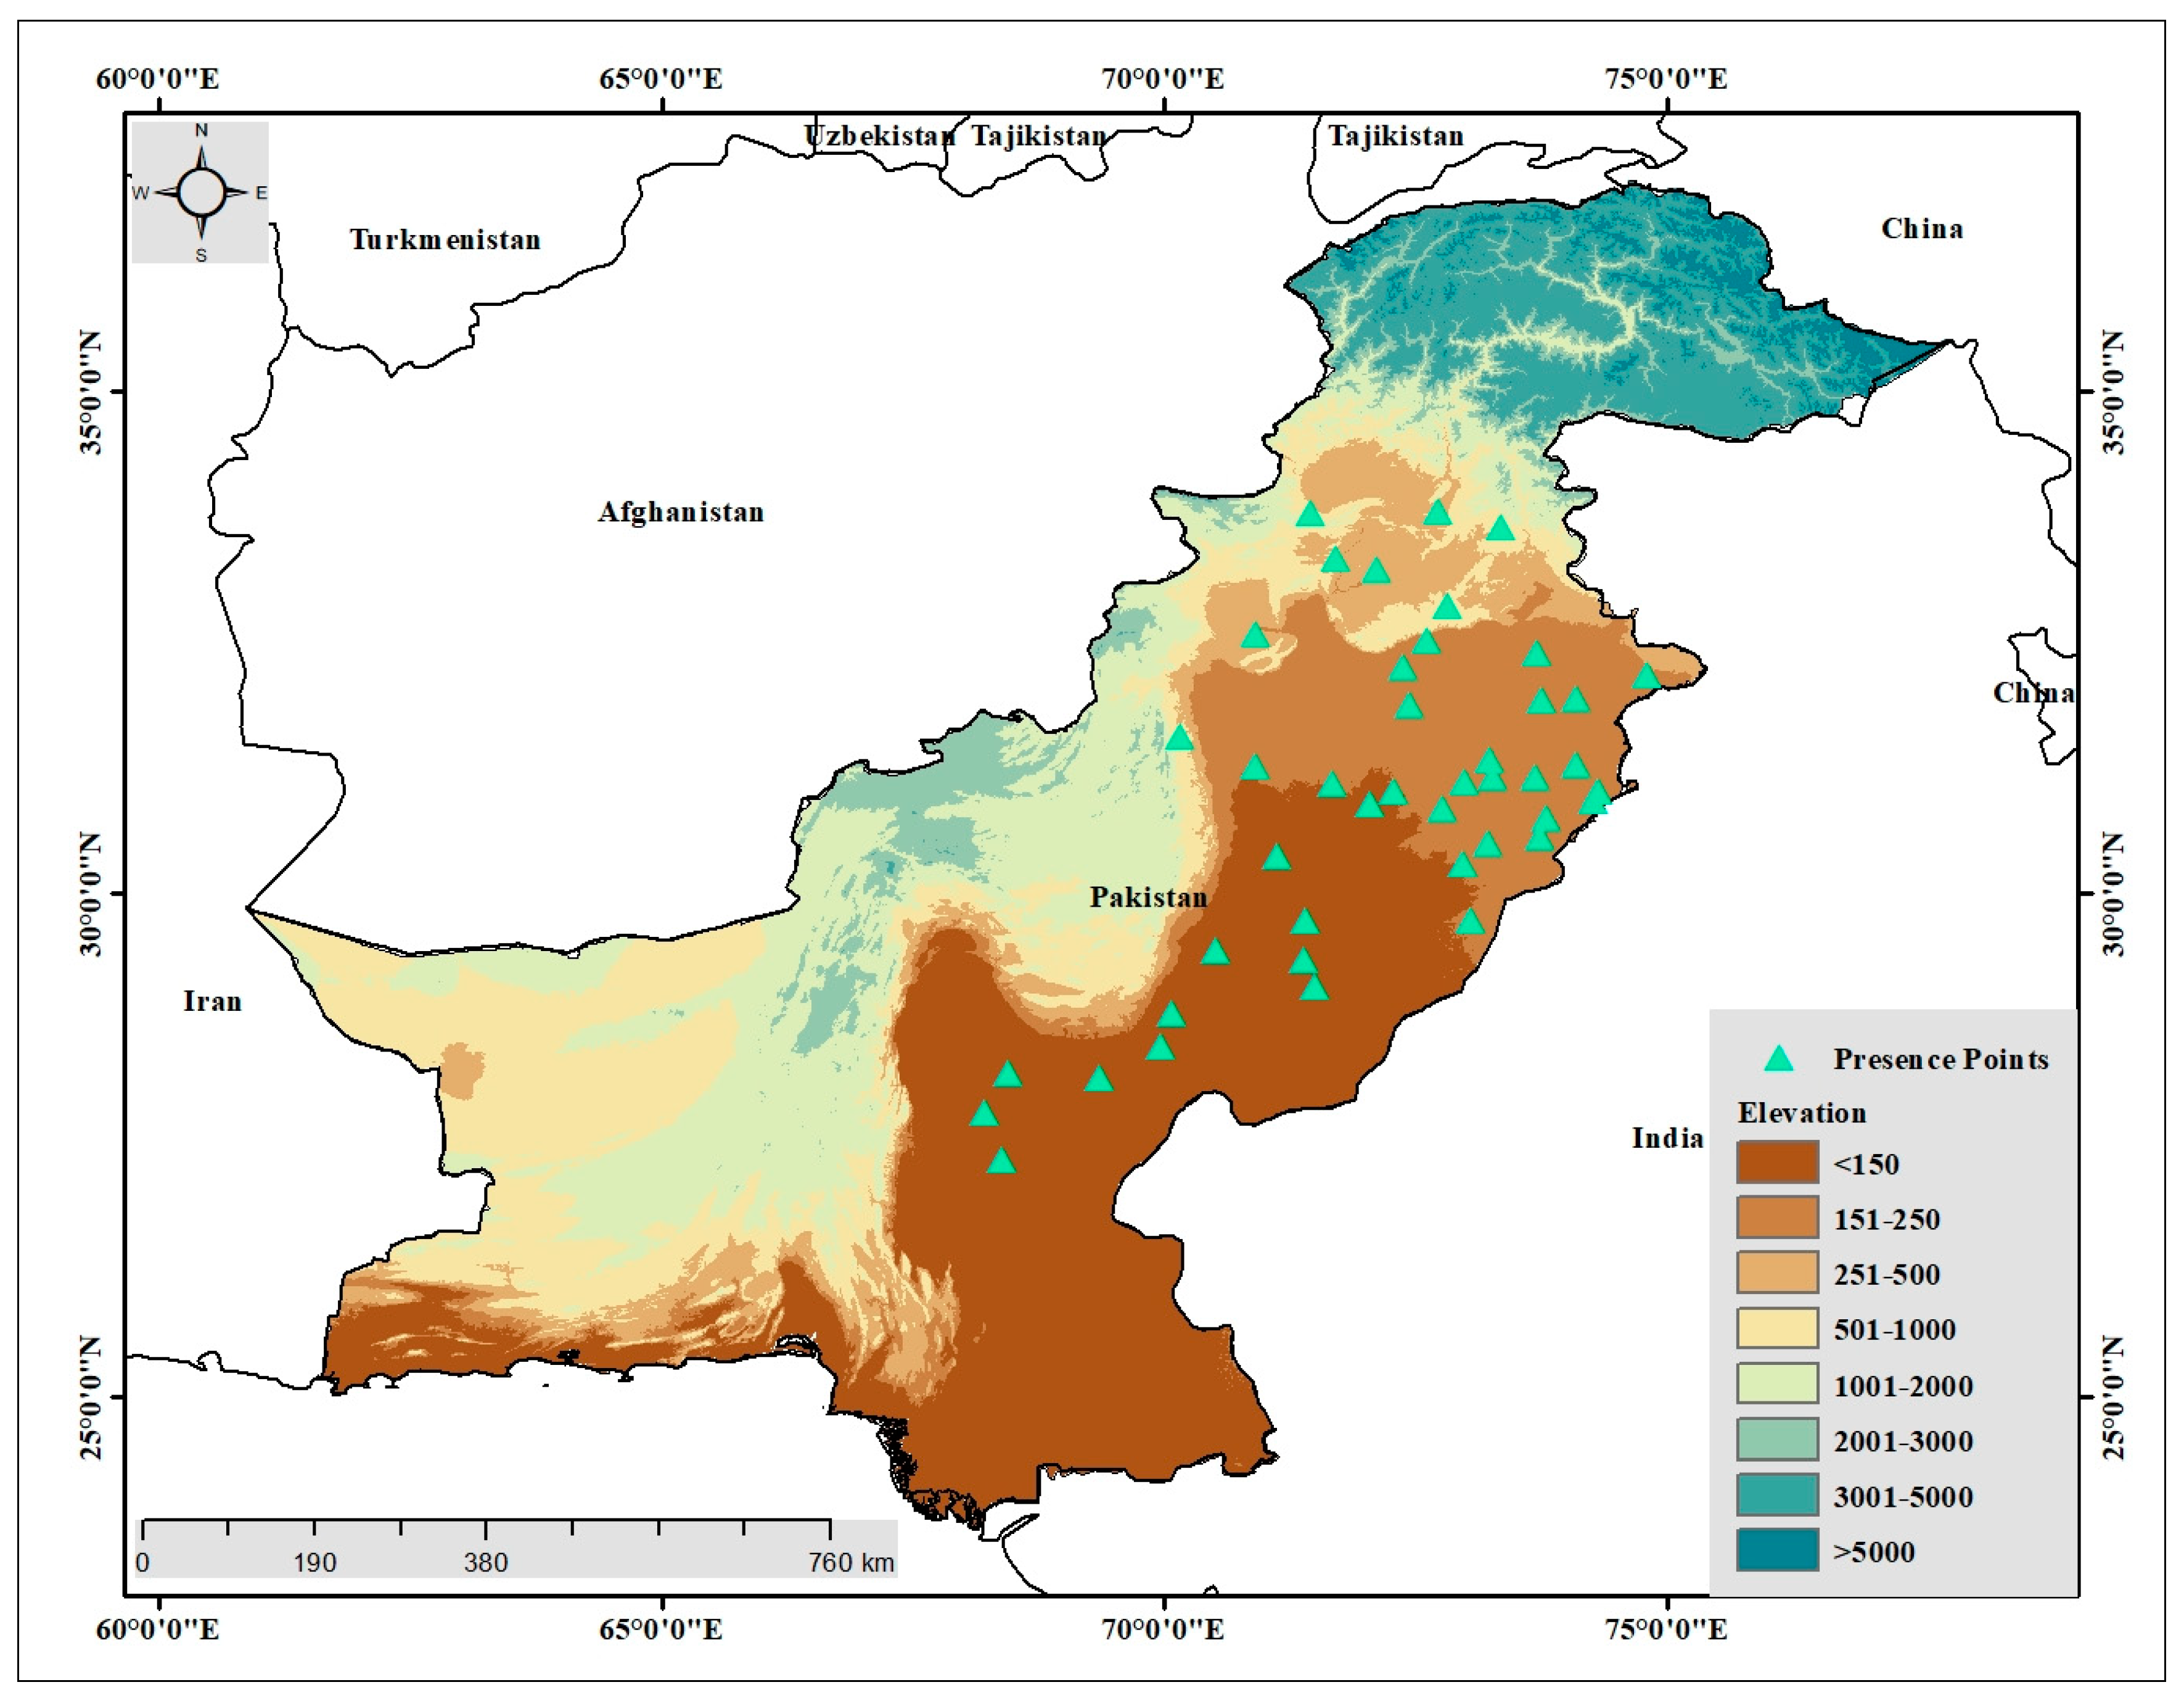
2.1. Aegle Marmelos and Occurrence Data

Aegle marmelos, also known as Bael, belongs to the Rutaceae family and is a moderate-sized, aromatic tree that grows wild in the deciduous forests of the subcontinent [34]. The tree can grow up to 6–7.5 m in height and has a somewhat fluted bole of 3–4.5 m in diameter. The leaves of the Bael tree are trifoliate, and the flowers are pale green or white, with a sweet fragrance. The fruit of the Bael tree is a globose, woody fruit that is about the size of a large grapefruit. The fruit has a hard, woody shell that must be cracked open to reveal the pulp inside, which is sweet and aromatic [35]. In addition to its traditional medicinal uses, Bael is also used for its edible fruit, which is consumed fresh or used to make jams, chutneys, and drinks. The leaves, bark, and roots of the Bael tree are also used in traditional medicine and have been shown to have various health benefits [36]. For many years, this plant has been employed in Ayurvedic medicine to remedy diverse ailments and conditions. Several bioactive compounds have been extracted from various components of the plant, including alkaloids, flavonoids, phenolics, and terpenoids. Bael is believed to have a wide range of therapeutic benefits, including anti-inflammatory, antidiabetic, antioxidant, antimicrobial, and anticancer properties [37]. In addition to its medicinal properties, Bael is also rich in nutrients such as vitamins, minerals, and antioxidants. Fruit is a good source of vitamin A, vitamin C, potassium, and fiber. Bael is also low in calories, making it a healthy addition to any diet [38]. Overall, Bael is a versatile fruit containing a wealth of health benefits and is valued both due to its therapeutic properties and its culinary applications.
Pakistan, situated in South Asia, encompasses diverse climatic zones, including subtropical regions. The subtropical climate in Pakistan primarily occurs in the southern and coastal areas, notably in the provinces of Punjab, Sindh, and Balochistan (Figure 1). These regions experience hot summers and mild winters, accompanied by relatively high humidity levels [39]. The subtropical climate is characterized by long, hot summers, with temperatures often exceeding 40 °C, and short, mild winters, with temperatures ranging from 10 to 20 °C. The vegetation in these subtropical regions of Pakistan is diverse, comprising various shrubs, grasses, and trees that have adapted to the arid and semi-arid conditions prevalent in the area [40]. From January 2019 to December 2022, the data on Bael trees were collected from three different land-use types, namely, farmland, riverine areas, and parkland. Over the course of three years of field surveys, the authors collected data on the present locations of Aegle marmelos in Punjab, Pakistan. The main survey involved recording and geo-referencing all instances of natural populations and isolated individuals of the species. In total, the documentation of 44 records in Punjab was carried out, enabling the creation of a comprehensive distribution map of Aegle marmelos in the region (Figure 2).

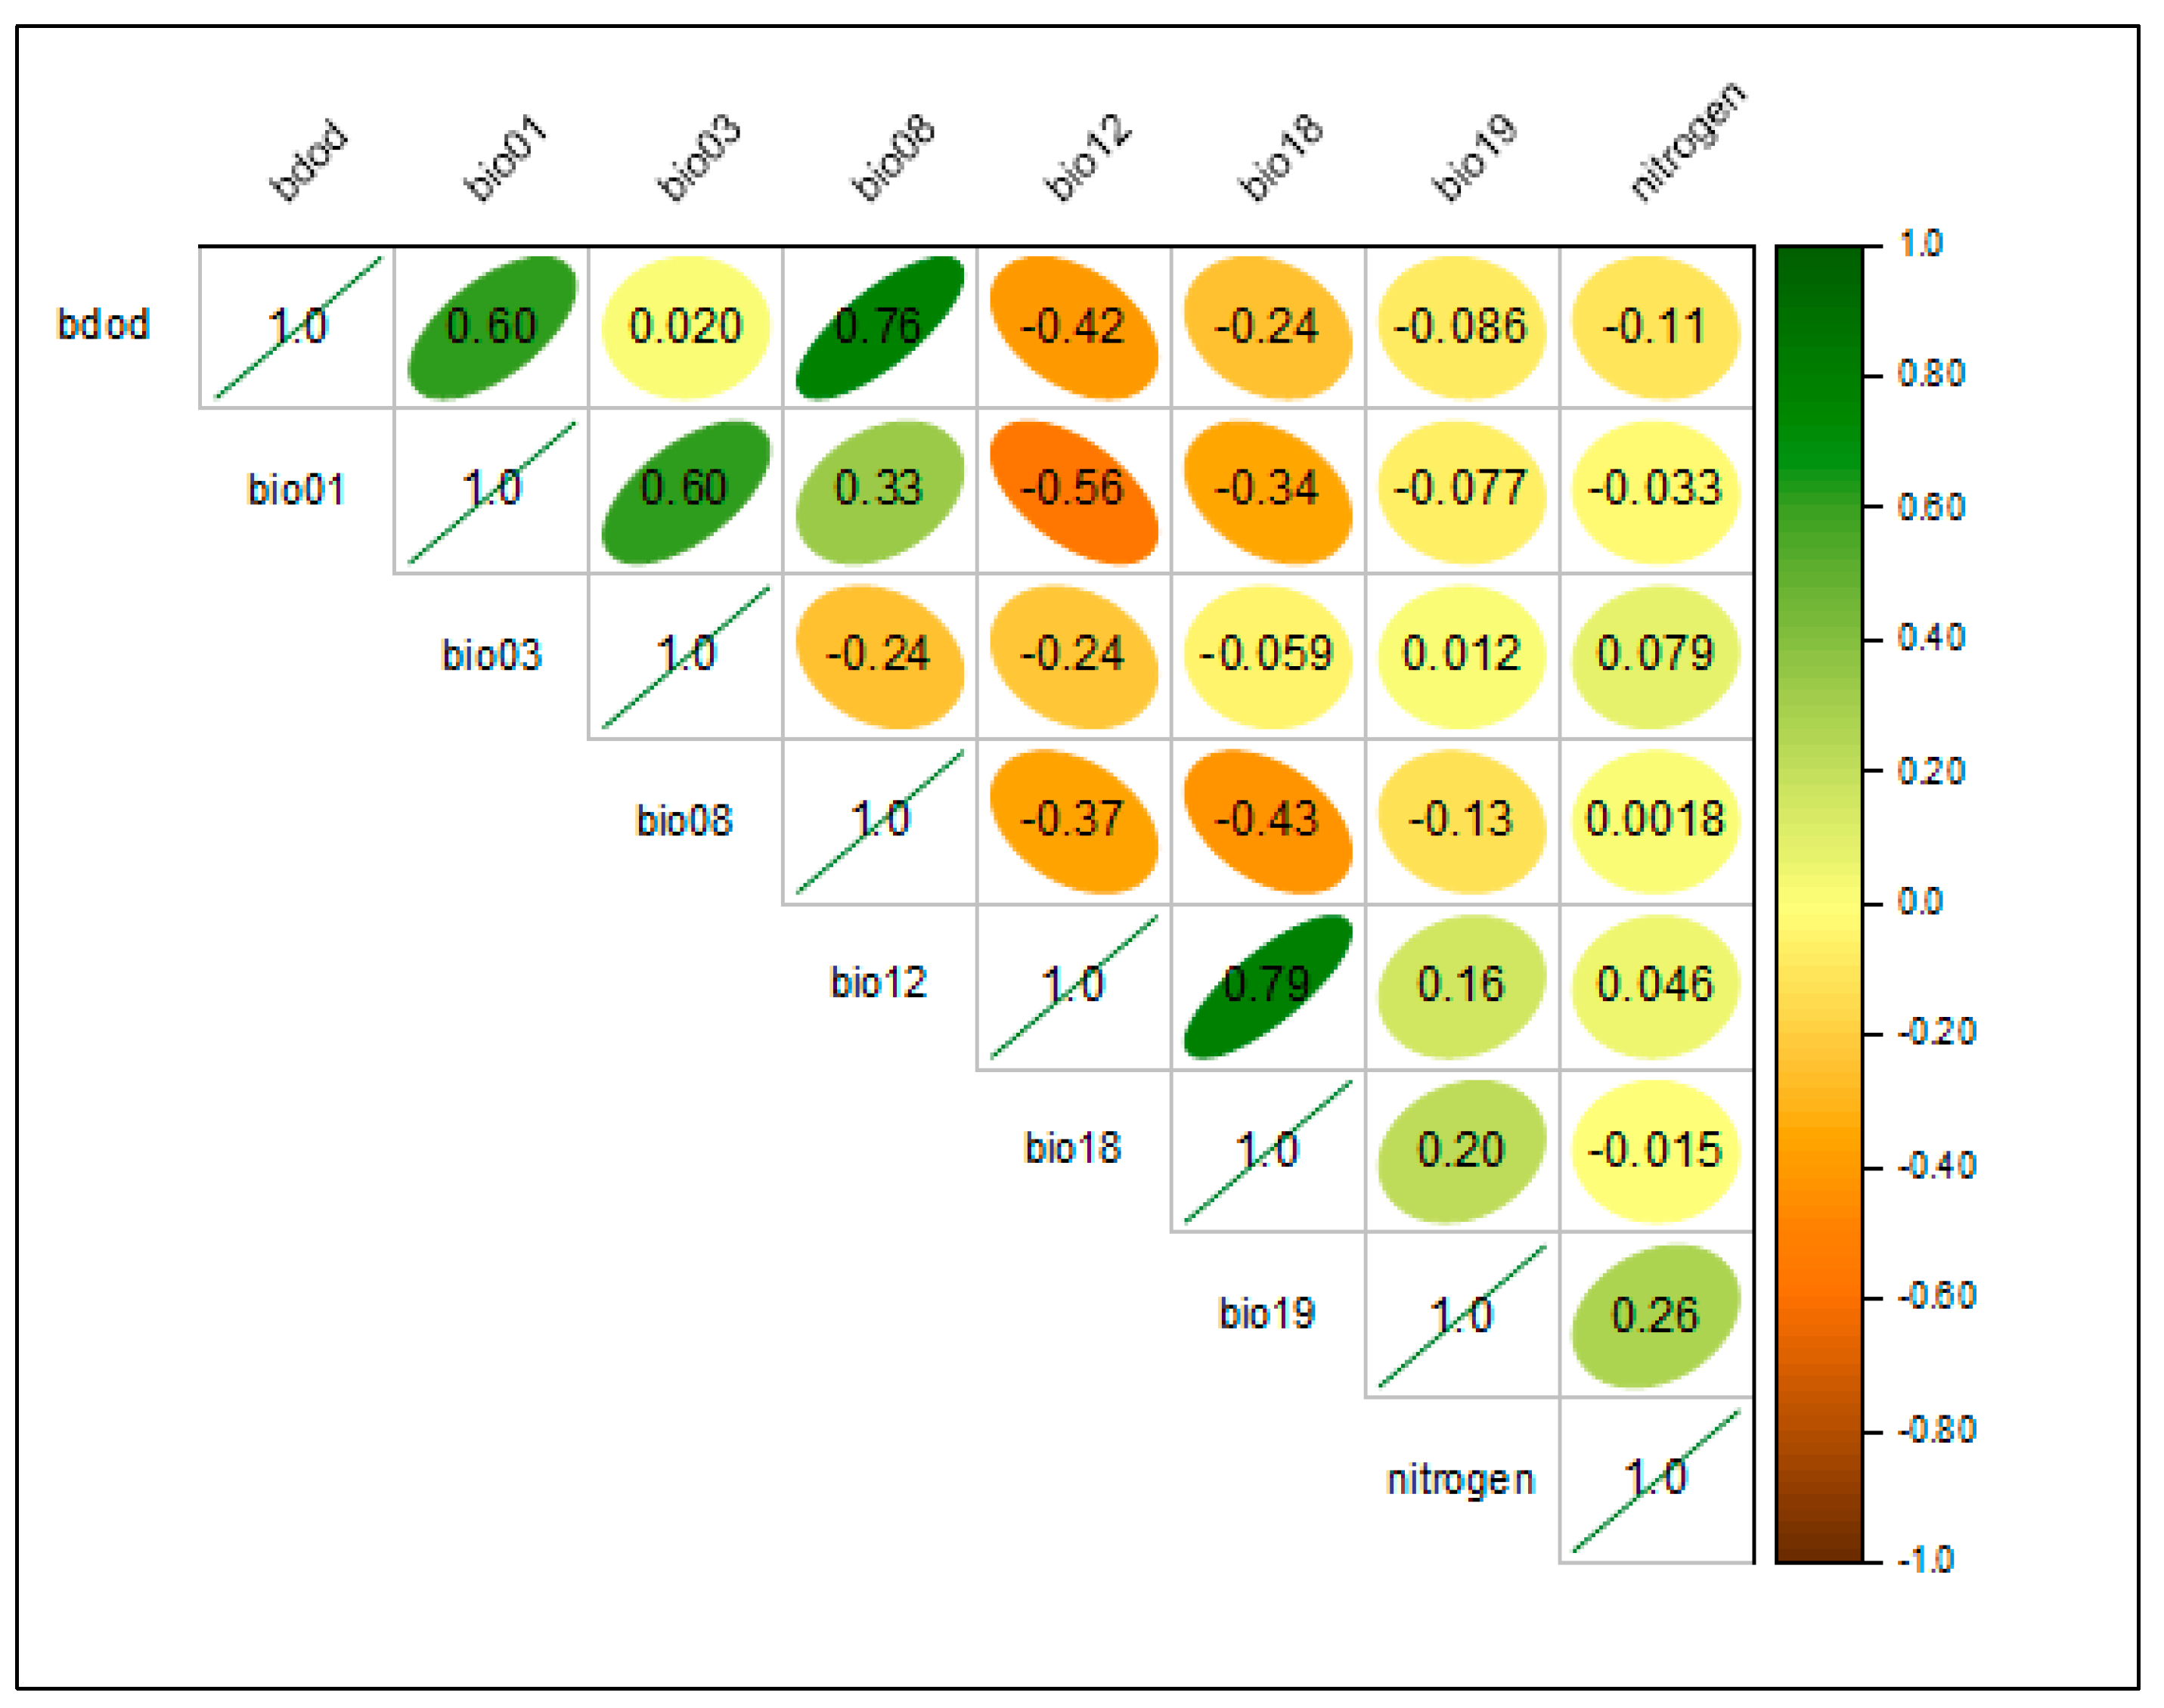
2.2. Environmental Data Collection and Variable Selection

During the research project, we obtained data on 19 bioclimatic variables at a resolution of 30 arc-seconds, as well as elevation data at the same resolution, from WorldClim (ver. 2.1) (www.worldclim.org, accessed on 15 June 2022). We incorporated 10 edaphic variables into our study, obtained from the source https://soilgrids.org/ (accessed on 15 June 2022) (Supplementary Table S1). Since the species was found in flat terrain with an elevation range of 150 to 500 m, topographic information like altitude, slope score, and aspect was not taken into account during the investigation. To consider both human activity and environmental factors, two variables, namely land cover and population density, were incorporated into the study. The Global Land Cover data included nine categories: savannah, forest, grassland, shrubland, wetland, urban, snow/ice, cropland/natural vegetation, and barren/sparsely vegetated regions. The source of the data was the International Geosphere-Biosphere Program (MODIS Global Land Cover Classification v2, http://www.modis.bu.edu/landcover accessed on 15 June 2022). The population density was gathered from Oak Ridge National Laboratory (http://www.ornl.gov/sci/landscan accessed on 15 June 2022) as a separate layer because it has been demonstrated to significantly affect the dispersion of species. For future simulations, we acquired two Shared Socioeconomic Pathways (SSPs)—SSPs 245 and SSPs 585—from the Coupled Model Intercomparing Project, Phase 6 (CMIP6) for two distinct timeframes: the 2050s (2041–2060) and the 2070s (2061–2080). To perform these simulations, we utilized the Global Climate Model of BCC-CSM2-MR, which has a resolution of 2.5 arc-min.
This study used a two-step procedure to guarantee independence and omit spatially linked data items. First, a preliminary model with default settings was implemented to ascertain the contribution of each variable. We set a threshold of >1% to filter out variables that did not meet the criterion. Secondly, in order to locate and eliminate any potential spatial association, we then assessed the remaining variables (above the contribution threshold) for pairwise Pearson’s association (r). To reduce the number of variables further, a threshold value (r ≥ ±0.8) was employed. If two variables had an r value above this threshold, the one with the lesser contribution was omitted [40,41].

2.3. Preliminary Variables Processing

Eight significant bioclimatic and edaphic variables were determined by applying the contribution and Pearson’s correlation coefficient thresholds. These factors include soil bulk density (bdod), total nitrogen, isothermality (bio03), warmest quarter precipitation (bio18), wettest quarter mean temperature (bio08), coldest quarter precipitation (bio19), yearly mean temperature (bio01), and annual precipitation (bio12) [42]. The pairwise correlation between the final variables chosen was also shown (Figure 3).

2.4. Model Calibration and Optimization

In species distribution modeling (SDM), calibrating and optimizing MaxEnt prediction models is crucial for selecting the best model. This is often achieved by tuning the model with various regularization multiplier (RM) values and feature classes (FC) to improve prediction reliability and prevent overfitting. To identify the optimal MaxEnt model settings, threshold-dependent evaluation metrics (i.e., omission rate) were used to improve model transferability. The study targeted multiple combinations of eight RM values (ranging from 1 to 4 with a 0.5 interval) and six FCs (L, LQ, H, LQH, LQHP, and LQHPT, where L = Linear, Q = Quadratic, H = Hinge, P = Product, and T = Threshold) [43,44]. The R package ENMEval was utilized to create the bias file, which utilized occurrence and environmental data for model implementation.
MaxEnt 3.4.4 was utilized to analyze the data and forecast the optimal habitats for Himalayan goral from the studied area [45], following ecological niche theory. This model utilizes presence data to predict the potential distributions of a species within a given area with high precision [46]. Due to its accuracy, MaxEnt is widely recognized as one of the most prominent and significant techniques for Species Distribution Modeling (SDM) [47,48,49]. To investigate the relationship between environmental conditions and wildlife distributions, we utilized MaxEnt, a reliable machine-learning technique for species distribution modeling [50]. Our goal was to determine a link between climatic variables and the occurrence of the species. The 10th percentile presence probability of the species, a 10-fold cross-validation approach, a complementary log-log (clog-log) output format, 10,000 background points, 10 repeat runs, 500 iterations, response curve generation, and an analysis of Jackknife importance in all final optimized SDMs were some of the MaxEnt configurations we used to improve the model’s accuracy and performance.

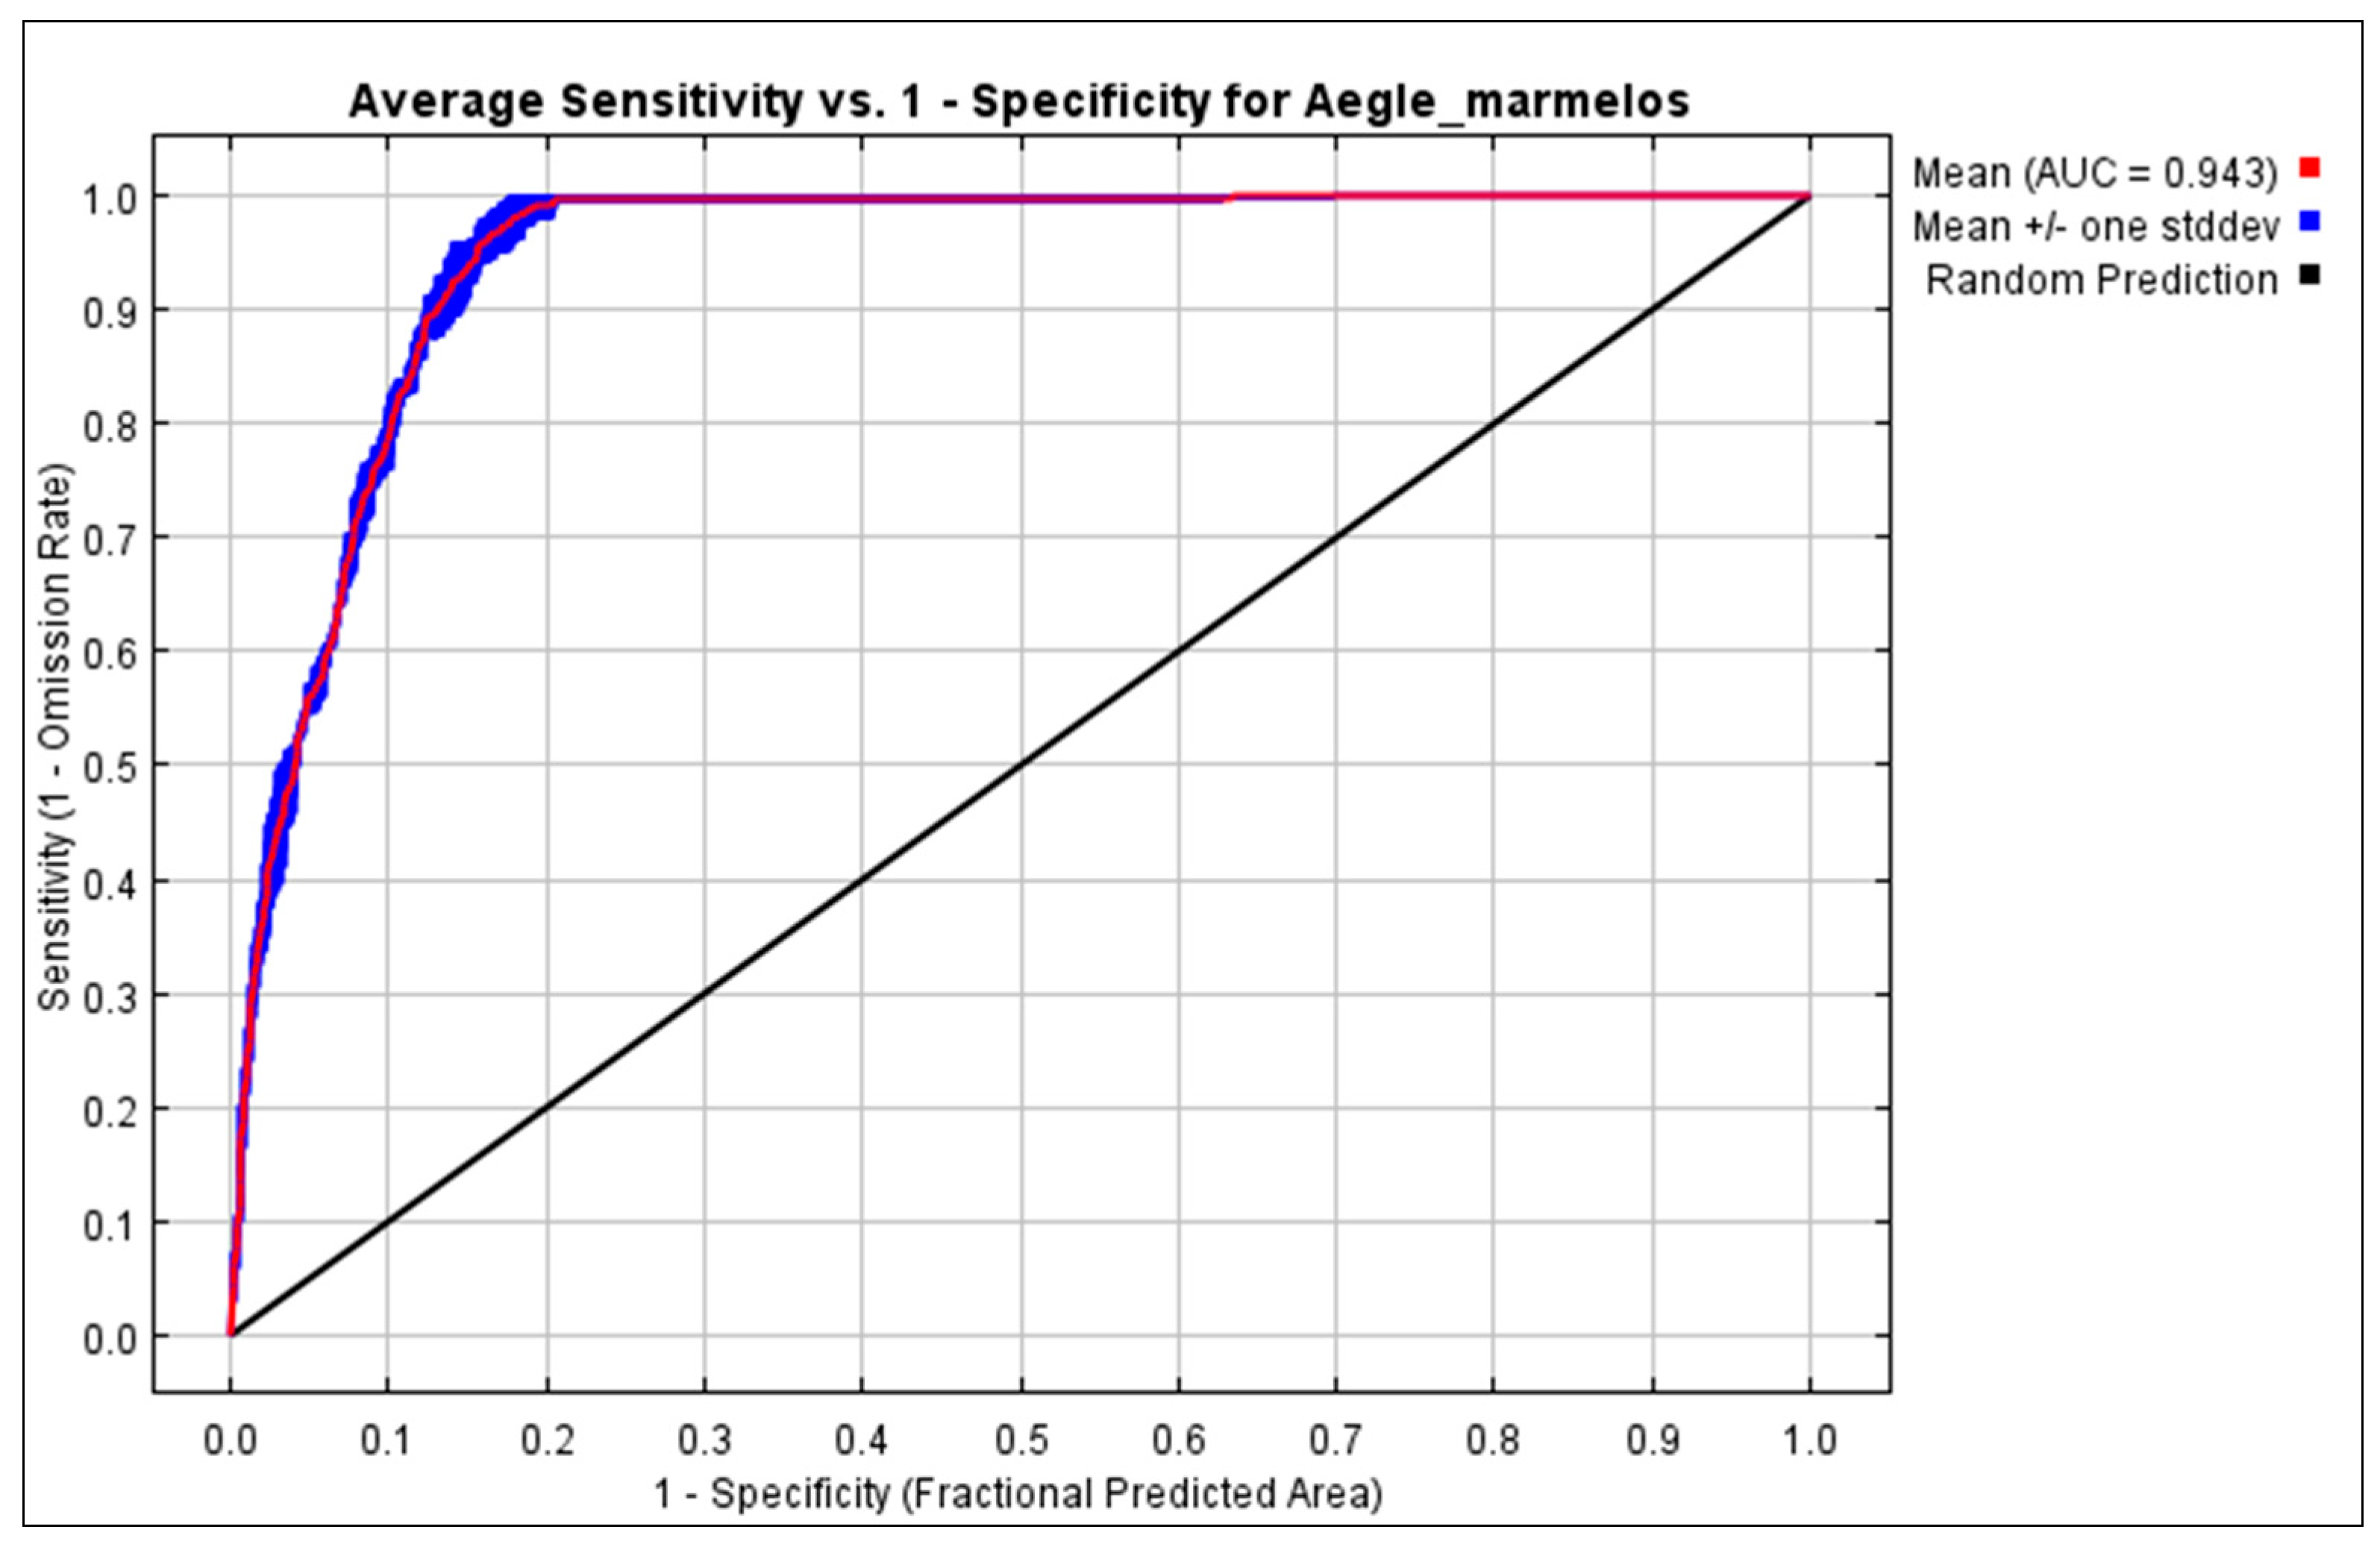
2.5. Reclassification of Predictions and Model Evaluation

The receiver–operator characteristic (ROC) curve’s area under the curve (AUC) measurements were used to assess how well the optimized SDMs performed. Better model prediction accuracy is indicated by a high AUC-ROC value; a good score is one of 0.9 or higher [45,47,51,52]. The AUC score reflects how well the model fits the test data and measures the model’s ability to distinguish between variations in species distribution under potential future climate conditions [45,51]. While an AUC value of 0.5 implies that the model’s performance is no better than chance, a number closer to 1.0 shows that the model performs better than chance [51]. The possible existence of Aegle marmelos in the study area was predicted using the averaged MaxEnt prediction output, which ranged from 0 to 1. In numerous studies on species distribution models (SDMs), a threshold prediction probability value of 0–0.2 has been commonly utilized to identify unsuitable areas for the species under consideration. Researchers have found that using equal-sized probability classes, specifically five classes with a threshold of 0.2, offers greater intuitiveness and significance. This approach, as suggested by [53], facilitates comparisons of habitat suitability classes across different climate scenarios using maps. Moreover, this classification scheme allows for the extraction of finer details regarding species predictions within a geographical context. Consequently, in line with these principles, the present study has developed five equal-sized classes to categorize habitat suitability. The model outputs were classified into five levels of habitat suitability: not suitable regions (NSR) for values between 0 and 0.2, low suitability regions (LSR) for values between 0.21 and 0.4, moderately suitable regions (MSR) for values between 0.41 and 0.6, and highly suitable regions (HSR) for values between 0.61 and 1. Additionally, values between 0.61 and 1 were further classified as very highly suitable regions (VHSR) [53,54,55].

3. Results

We ran MaxEnt for 10 replications and averaged the results to generate a single model prediction. This is a good practice as it helps to reduce the possible effects of random variation in the model. Response curves are a graphical representation of the link between the environmental parameters and the expected likelihood of occurrence for the species. These curves can help to identify which variables have the strongest influence on the species distribution and can aid in understanding the ecological factors driving the species distribution. The area under the curve (AUC) graph is a popular tool for evaluating how well species distribution models work. The best candidate model, with an AUC score of 0.992, was produced by using LQH as FCs in conjunction with an RM value (i.e., 1.5). (Figure 4). We used MaxEnt to construct a predictive habitat appropriateness score for the Aegle marmelos from the subtropical region of Pakistan. This score ranged from 0 to 0.99, indicating the predicted suitability of different areas for the species. The MaxEnt model’s AUC value can be used to assess the model’s predictive performance, as it measures the ability of the model to distinguish between presence and absence locations. The AUC ranged from 0.5 (no better than random) to 1.0 (perfect discrimination). It is important to note that while the AUC is a useful measure of model performance, it is not the only metric that should be considered when evaluating the model. The ROC curve represents the relationship between the true positive rate (sensitivity) and the false positive rate (1—specificity) for various projected probability threshold values. The model’s capacity to accurately identify true positives while minimizing false positives is illustrated visually. The average AUC value of the model was 0.943, which was significantly higher than the AUC value of the random prediction model (0.5), according to the results of the curve analysis. The results of the model’s predictions were believed to be extremely accurate, demonstrating a good fit between the species’ expected and actual distribution areas.

3.1. Key Environmental Variables

The factors that contribute significantly to the habitat appropriateness of Aegle marmelos include soil bulk density (bdod), isothermality, warmest quarter precipitation, mean wettest quarter temperature, and coldest quarter precipitation. These factors made minimal contributions to the SDMs of Aegle marmelos and included annual mean temperature, annual precipitation, and total nitrogen (Table 1).
The results of the jackknife test showed how different environmental conditions affected the distribution gain. It has been discovered that the main variables influencing the distribution of Aegle marmelos are soil bulk density and isothermality by using the jackknife method to evaluate the suitability of each environmental variable in relation to the distribution of Aegle marmelos and the contribution rate of each variable. Based on the selected variables, the current distribution of Aegle marmelos was validated with field observations and a known distribution. The jackknife test exhibited contributions to the MaxEnt model on the distribution of Aegle marmelos of 74.3% and 9.2% for the soil bulk density (bdod) and isothermality (bio03), respectively (Figure 5). A single study was carried out to illustrate the influence of the highest contribution rates of soil bulk density (bdod) and bio03 as a single factor. As soil bulk density increased, the probability of Aegle marmelos presence initially increased but then stabilized (Figure 6). Furthermore, as the isothermality percentage increased, there was an initial increase in the chance of Aegle marmelos presence, which then decreased with the increasing isothermality percentage. This suggests that soil bulk density might have a complex relationship with the presence of the species, and further research would be necessary to fully comprehend such a relationship. The annual precipitation greater than 25 cg/cm3 with a probability greater than 0.6 indicated a very appropriate location, whereas the chance of presence peaked at above 30 cg/cm3. The isothermality for highly suitable habitats ranged from 38–65 percent (Figure 6).

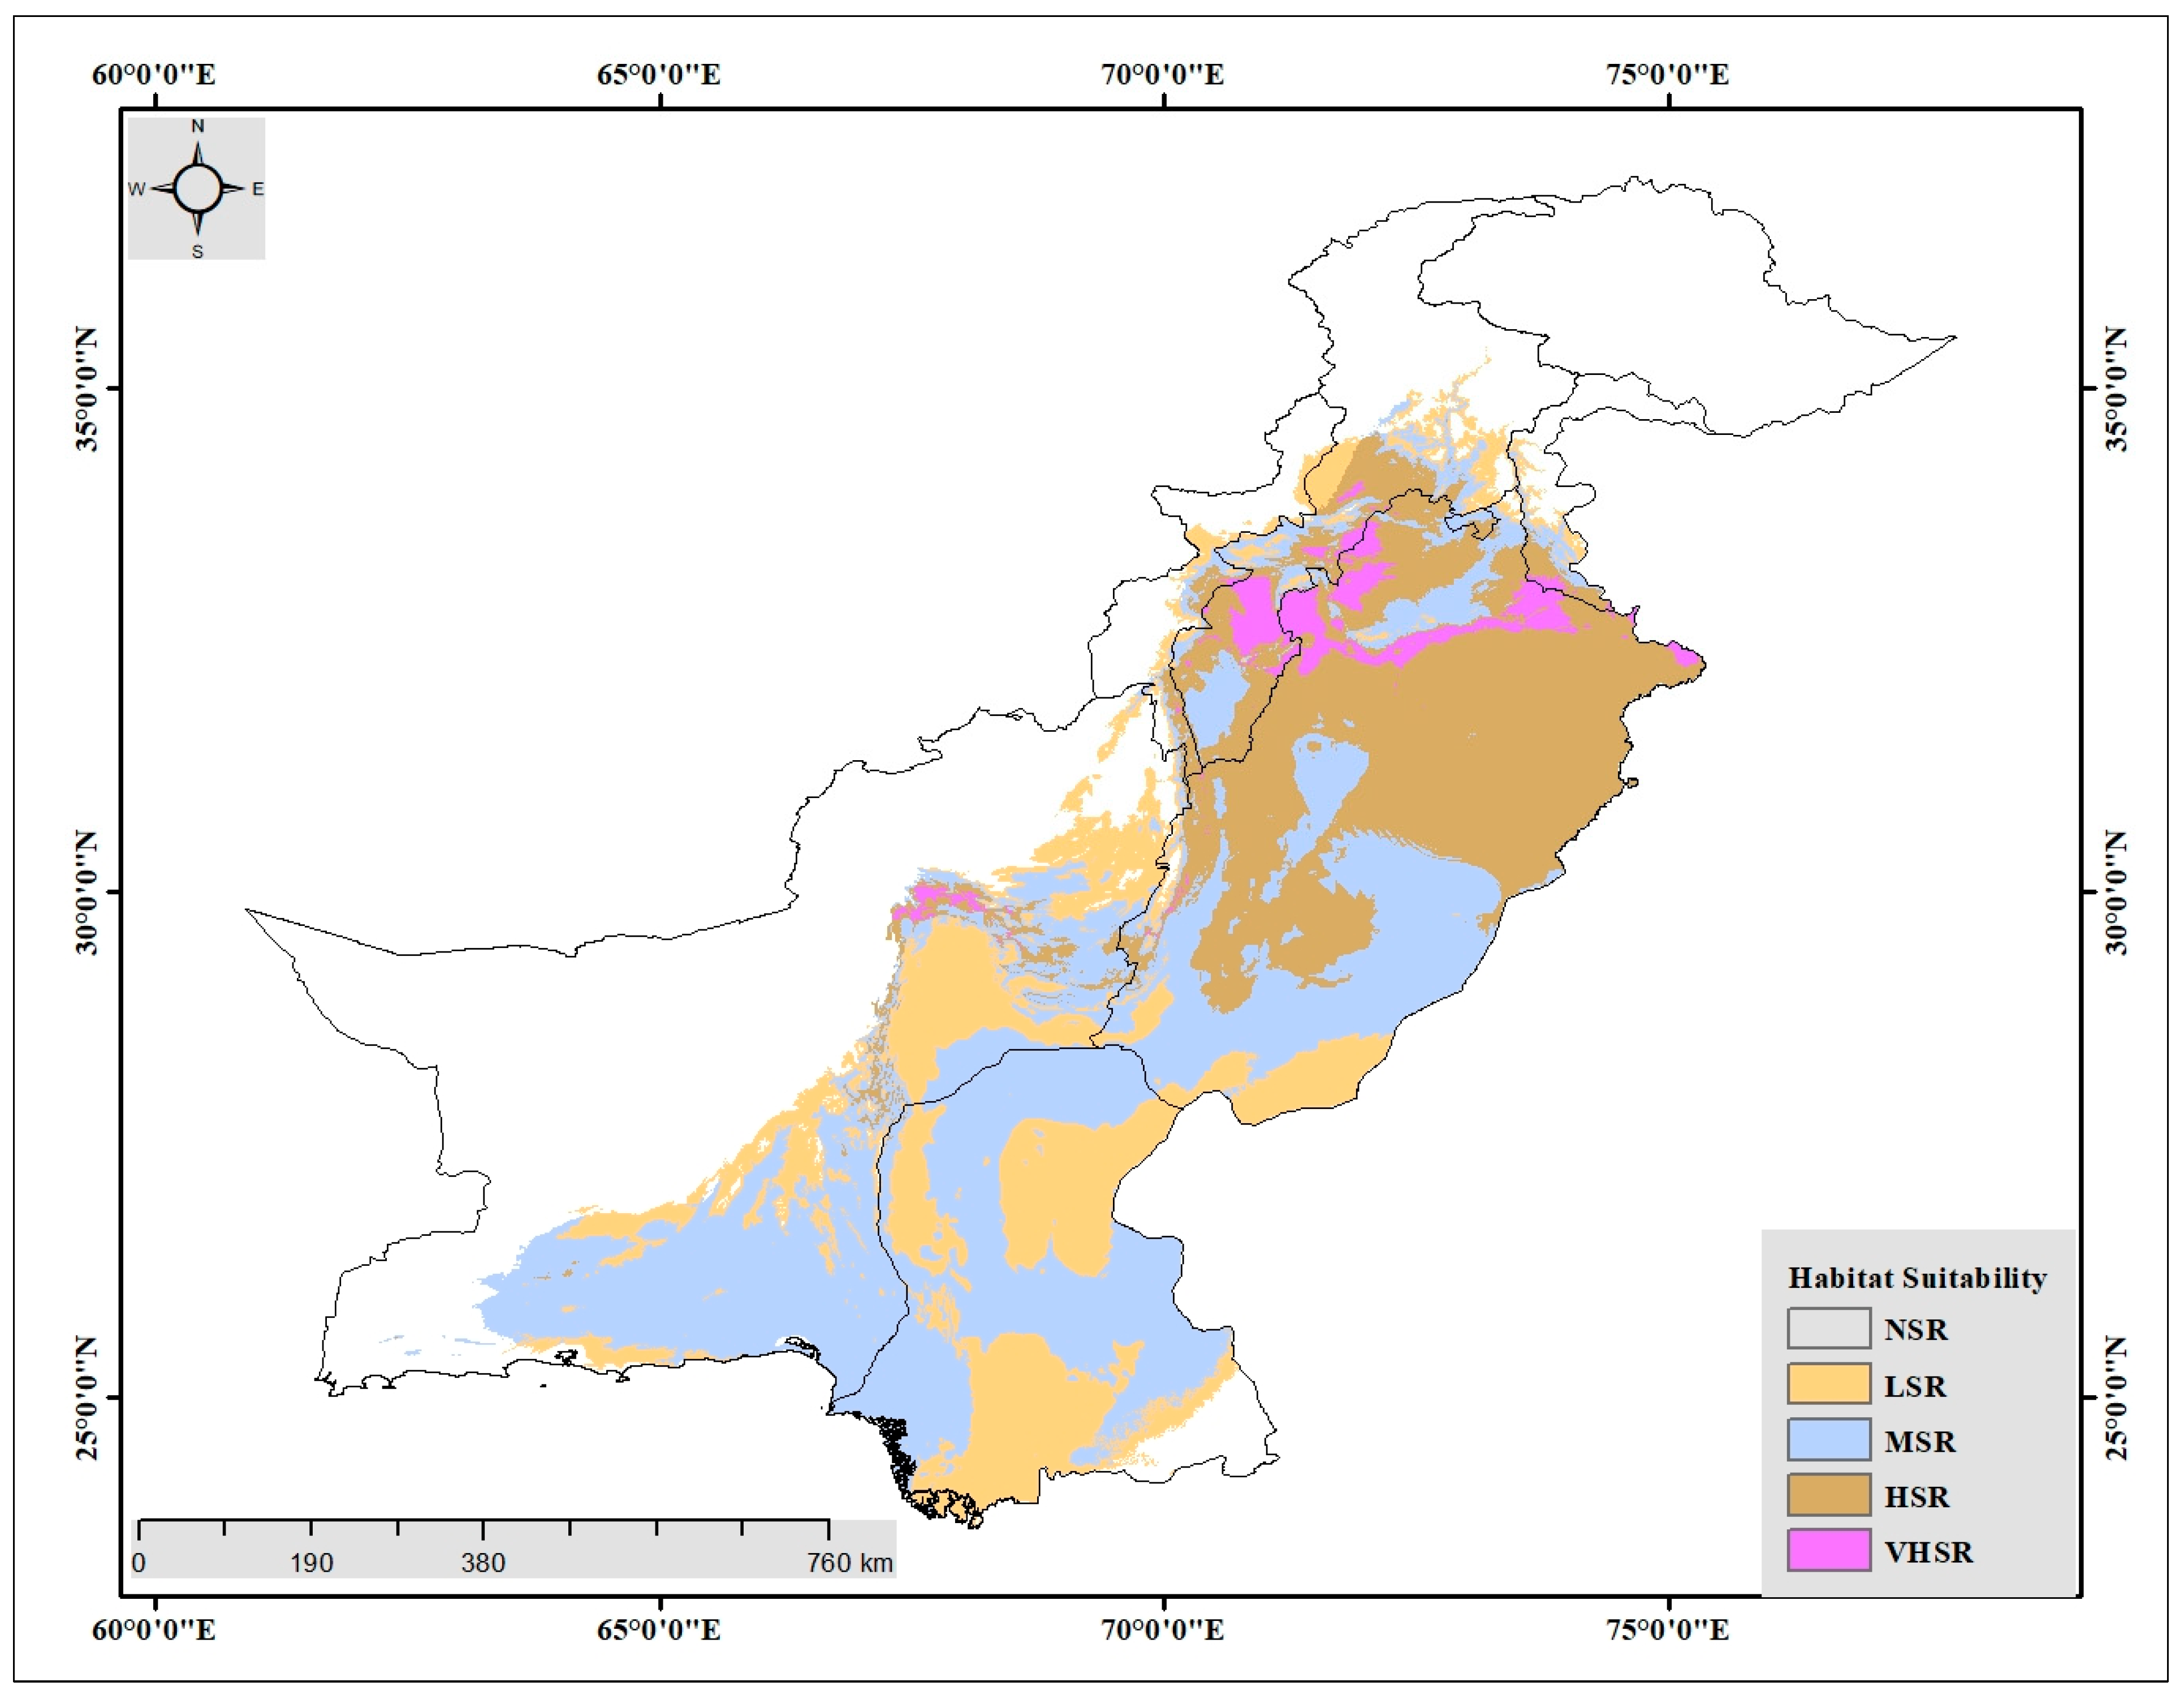
3.2. Current Distribution

The MaxEnt results were reclassified and formatted, and ArcGIS calculated that the highly suitable (HS) and very highly suitable (VHS) range for Aegle marmelos in Pakistan was 165,747 km2, corresponding to 18.79% of the country’s total area. The distribution range of the most suitable habitat was central Punjab, upper Punjab, and southern Punjab, covering an area of 104,362 km2 and accounting for 11.8% of the total suitable habitat. Figure 2 shows that the highly suitable areas located in Upper Punjab included Rawalpindi, Jhelum, Mianwali, Chakwal, Attok, Khoshab, and Gujrat. In central Punjab, the highly suitable locations for Aegle marmelos included Kasur, Nankana Sahib, Faisalabad, Okara, Sheikhpora, Chiniot, Hafizabad, and Sargodha, while in southern Punjab, the highly suitable habitats were located in Dera Ghazi Khan, Khanewal, Muzaffargarh, Layyah, Vehari, and Lodhran. In Balochistan and Khyber Pakhtunkhwa, the most suitable regions were present in Peshawar, Nowshera, Bannu, Laki Marwat, Kohat, Karak, Quetta, Sibi, Kech, and Mastung. From north-eastern Punjab to central Sindh and Balochistan, we discovered that medium-suitable habitats are scattered across the territory in patches. There are continuous bands of reasonably suitable habitats along the Indus River, southern Sindh, the northern irrigated plains, and the Salt Range. Aegle marmelos in poorly suitable habitats were located in Central Sindh, Eastern Balochistan, the Northern region of Khyber Pakhtunkhwa, and the coastal zones of Sindh and Balochistan provinces (Figure 7). A strong correlation between the occurrence points and suitable habitats in the predicted suitability map was observed.

3.3. Potential Habitat Suitability under the Future Climate Change Scenario

After collectively considering the potential impacts of future climate change, we have observed that the current habitat of Aegle marmelos, which is most suitable, is gradually disappearing. As a result, it is expected that the plant’s habitat will relocate towards the eastern zone of Punjab, as per the predictions made for the 2050s and 2070s under all four SSP scenarios. This shift in habitat will result in a contiguous distribution of highly suitable locations in the central region of Punjab and adjoining areas, specifically in Punjab and Khyber Pakhtunkhwa towards the southeast (Figure 8). The geographical range of Aegle marmelos will shift as a result of future climatic conditions.
According to this study, the total potential habitat suitability (p > 0.2) for Pakistan may decrease in the future. This decrease is estimated to be at a rate of −1.3% compared to the current distribution range, resulting in a potential habitat suitability of 121,145 km2 under SSPs 245 of the 2050s and a −2.3% rate of change, leading to a potential habitat suitability of 131,145 km2 under SSPs 585 of the 2050s. Similarly, under SSPs 245 of the 2070s, the potential habitat suitability is expected to reduce to 118,045 km2, which is a −1.6% rate of change, and 101,145 km2 (−3.8% rate of change) under SSPs 585 of the 2070s. If we consider SSPs 245 in the 2050s, there is a prediction that the very high suitability habitat (VHS) will increase slightly from its current climate, specifically from 55,292 km2 to 56,170 km2 (0.4% rate of change). As a result, within the highly suitability habitat (VHS), the estimated potential suitable land area is reduced to 52,170 km2 (−0.1%) under SSPs 585 of the 2050s, 54,170 km2 (0.1%) under SSPs 245 of the 2070s, and 49,170 km2 (−0.4%) under SSPs 585 of the 2070s (Table 2).
Based upon the observation of four future climate change scenarios, the highly suitable habitats predicted in Balochistan and Southern Punjab are expected to be lost by the 2070s. The western Khyber Pakhtunkhwa regions in Pakistan, southern Balochistan, central Punjab, and Sindh might face the disappearance of all current suitable and highly suitable habitats by the 2050s and 2070s under scenarios SSPs 245 and SPPs 585. Additionally, Upper Punjab, Peshawar, and Attok might only have marginally suitable locations in the arid region between 2050 and 2070 (Figure 8).

4. Discussion

The MaxEnt model generates statistical links between background locations in the study area and predictor variables at sites where a species has been seen. Different transformations of the initial predictor variables (FCs) restrict these correlations. The model becomes more adaptable and can match the observed data in a more complicated way by adding more FCs. The risk of overfitting the model may actually grow as flexibility increases [56]. Based on the number of occurrences in the dataset, the MaxEnt model automatically decides which FCs can be used. To prevent overfitting, the model incorporates regularization [48], regardless of which FCs are used. The regularization level can be adjusted by the user through a single RM parameter (default value = 1.0), and the user can also specify which FCs are allowed. However, in practice, few users adjust these parameters, as it can be a time-consuming process. Due to this, the majority of empirical research relies on an algorithm’s or software package’s default settings, which could lead to bias in the methodologies used for evaluation [57]. The MaxEnt model was used in this study to simulate the prospective distribution of Aegle marmelos, both historically and under hypothetical future climate conditions. It was discovered that the simulation accuracy was quite high, which is comparable with earlier studies finding MaxEnt model prediction accuracy indicators surpassing 0.90 [58,59]. In order to investigate the probable distribution of species and plants under potential future climate change scenarios, this model can be very useful [60,61]. A high degree of fit in the MaxEnt fitting findings does not necessarily guarantee an accurate simulation of the actual and potential distribution of species, according to some researchers [62].
Studying the ecological requirements and spatial distribution of species requires an understanding of the species–environment relationship [63]. The medicinal plant known as Aegle marmelos requires a comprehensive understanding of its distribution in order to be efficiently distributed and utilized within an ecosystem. Through the implementation of the MaxEnt model, this study offers an in-depth examination of potential global habitats for Aegle marmelos under both current and future climate conditions. Such findings furnish a theoretical foundation for the implementation of realistic measures for the restoration and management of Aegle marmelos. The impact of temperature and precipitation on species distribution is significant. However, the specific effects of each bioclimatic variable on various species may differ due to differences in their growth patterns [33]. The study found that specific bioclimatic variables, namely annual mean temperature (bio01), isothermality (bio03), mean temperature of the wettest quarter (bio08), precipitation of the warmest quarter (bio18), annual precipitation (bio12), and precipitation of the coldest quarter (bio19), play a crucial role in the growth of Aegle marmelos. This plant thrives in warm and sunny conditions and is not capable of tolerating cold temperatures. When exposed to low temperatures, the root system of Aegle marmelos is prone to freezing, ultimately resulting in its demise. Conversely, precipitation plays a critical role in the survival and growth of seedlings, as well as the overall lifespan of plants [64]. However, excessive water in the soil can upset the delicate water balance required by plants, leading to adverse effects on their metabolism and morphology, ultimately hindering their growth and potentially resulting in death [65]. The findings of this study suggest that Aegle marmelos has a notably low precipitation requirement, as evidenced by the low levels of precipitation in the warmest quarter (bio18) and the coldest quarter (bio19). The maximum precipitation in the warmest quarter was observed to be 3000 mm (Figure 6), with anything exceeding this threshold deemed unsuitable for the growth of Aegle marmelos. Nonetheless, the impact of specific bioclimatic variables varies among different species due to differences in their respective growth patterns. For instance, in the case of Sapindus mukorossi, the main bioclimatic variables affecting its growth, as predicted by the MaxEnt model, were precipitation of the warmest quarter (bio18), minimum temperature of the coldest month (bio6), temperature seasonality (bio4), and isothermality (bio3) [66]. Utilizing the MaxEnt model to analyze the suitable habitats of various plant species, such as Osmanthus fragrans and Pinus densiflora, has revealed that different bioclimatic variables play a significant role in determining their respective environmental needs. According to research on Osmanthus fragrans’ environmental needs, the metrics UV-B seasonality, precipitation seasonality (bio15), temperature yearly range (bio7), and mean diurnal temperature range (bio2) were shown to be the most crucial ones [67]. Meanwhile, it was discovered that the mean annual temperature (bio1), the mean temperature of the wettest season (bio8), the seasonality of temperature (bio4), and the mean warmest seasonal precipitation (bio18) were the most significant environmental factors impacting the growth of Pinus densiflora [68]. These results demonstrate the need for further study into how bioclimatic factors affect certain species and provide an invaluable benchmark for comparison with other species.
The prediction results of this study have practical implications for the cultivation of Aegle marmelos in Pakistan. Currently, the distribution of Aegle marmelos is recorded in several provinces and cities in Pakistan, including Upper Punjab, central Punjab, southern Punjab, Balochistan, Khyber Pakhtunkhwa, Peshawar, Nowshera, Bannu, Kohat, Karak, Quetta, Sibi, Kech, and Mastung. However, based on the model prediction results (Figure 7), the suitable habitats of Aegle marmelos under current climate conditions cover an even wider area of 396,869 km2 in Pakistan. This provides a broader range for the potential cultivation of Aegle marmelos.
Over the course of the last century, there has been an increase in the Earth’s temperature, and it is expected that there will be further alterations in precipitation patterns in the coming years. These modifications may have a direct or indirect impact on the distribution of species [69]. Changes in temperature and precipitation can have a dynamic effect on the phenological and metabolic activities of species. Furthermore, human activity and climate change may hasten the propagation of pathogens, invasive species, and pests, impeding their recovery and ability to establish themselves in their native environments. The impact of bioclimatic factors may also vary depending on regional biophysical characteristics such as slope and other geographical factors [70]. According to the findings of the present study, comprehending the functions of soil, plant community, slope, and land use pattern is critical to improving distribution modeling.
The study proposed that both climatic and edaphic conditions affected the suitable habitats of Aegle marmelos. The MaxEnt model was used to assess each factor’s importance in regions with high levels of potential distribution. The cumulative contribution rate of climatic and edaphic factors was significant, indicating that they were the principal drivers affecting the spatial distribution of Aegle marmelos in the research location. A previous study has shown that climatic and edaphic characteristics are the primary non-zonal determinants influencing plant distribution in subtropical regions [71]. They influence the heterogeneity of soil thickness, moisture, and nutrient distribution, as well as the regional distribution patterns of precipitation and solar radiation [72]. Aegle marmelos faced development limitations in the high-altitude area of Pakistan due to its temperate climate. Arid regions experienced droughts, while high-altitude areas suffered from severe colds. However, moderate-altitude areas with a favorable combination of temperature and precipitation were suitable for the growth of Aegle marmelos, resulting in higher suitability in these regions. The response curve displayed in Figure 6 indicates that the probability of the presence of an area with Aegle marmelos varied in response to different soil nutrient indicators. Soil bulk density and soil available nitrogen showed a positive correlation with the abundance of Aegle marmelos, while soil pH and sand percentage exhibited a negative correlation with the same, which agreed with the findings of Sharath et al. [73]. Native species face a multitude of serious threats, including habitat loss, deforestation, forest degradation, overexploitation, climate change, and land degradation [74]. Maxent modeling was used by researchers to assess the importance of bioclimatic factors in the distribution of a number of taxa, including the Family Myristicaceae [75], Parthenium hysterophorus [76], and Clerodendrum infortunatum [77]. For plant species found in hot, arid, and semi-arid regions, however, similar scientific inventories are incredibly uncommon.
Medicinal plants are essential for human health and are significant elements of ecosystems. Over the past few decades, active restoration and conservation efforts for medicinal plants have become increasingly vital to managing terrestrial ecosystems worldwide. Species distribution models are useful tools for identifying suitable habitats for rare and endangered species to achieve effective restoration and conservation [78]. As a result, the study suggests that suitable habitat for conservation and management efforts in Pakistan’s central Punjab region should concentrate predominantly on the low elevation range of 200 to 500 m above sea level. In order to determine how well the species would adapt to various climate change scenarios, it is also advised to create new or update existing ecosystem management standards. To test the species’ adaptability at elevations above its existing range, assisted migration may be a realistic strategy. Aegle marmelos acts as a bioindicator of forest health. In order to restore the species, we advise using this species as an indicator species. This will strengthen the conservation and protection of this flagship species. Studies like the current one should be applied to identify future potential areas, and such areas may be protected under community reserves, protected areas, and other conservation areas to ensure the long-term conservation of the species under the climate change scenario.
During field surveys, it was observed that the current habitat ranges of Aegle marmelos are rapidly disturbed through non-timber forest collection and forest cutting. As a result, we recommend that strategies be created to lessen the number or frequency of disturbances. Existing knowledge of the threats to habitat can be used to guide management in the face of future climate change. The habitat management strategy could be prioritized by addressing potential hazards before they become serious threats. The findings of this study suggest that a refined forest management strategy could significantly aid in the reintroduction of the Aegle marmelos population in its suitable habitats, thus contributing to the global goals envisioned for the UN-Decade (2021–2030) of Ecosystem Restoration targets.
Model transfers offer several benefits and can inform resource management and biodiversity conservation decisions. The spatial transfers of the Maxent model across Pakistan were highly consistent with the known ecology of Aegle marmelos. As such, we can confidently use the predictions of the species in Pakistan as realistic and consider introducing and cultivating the species in that country. Since the species is indigenous to the subcontinent, we suggest introducing it in areas where it is currently absent but predicted to be suitable, while also increasing its stocks in areas where it is already present but at low densities. In addition, we advise cultivating the species with the necessary caution to promote establishment in the predicted suitable regions of Sindh and Khyber Pakhtunkhwa. From a socio-ecological perspective, most young people are uninformed of the significance of Aegle marmelos, and attempts to reforest areas with this species in mind are now rare. Because of this, there needs to be greater awareness, and places with a high likelihood of occurrence need to be recognized for future management efforts.

5. Conclusions

The Aegle marmelos, a moderate-sized aromatic tree species, is native to the semi-arid zones of Pakistan. The possible changes in habitat appropriateness under several climate change scenarios were predicted using the MaxEnt software. Our results indicated that, in addition to the previously observed poor regeneration, the prospective habitat suitability of Aegle marmelos within its native range may have drastically changed as a result of the expected future climate change (SSPs 245 and 585 of the 2050s and 2070s). It was projected that the environmental niche for the species would somewhat shift toward central Punjab. In light of this, Balochistan, notably the western Khyber Pakhtunkhwa, and Upper Punjab were projected to suffer the most serious adverse impacts on the species that the current prospective habitat supported in South Punjab. According to the analysis, Aegle marmelos’s growth and survival depended heavily on the soil’s bulk density (bdod), isothermality (bio03), warm-quarter precipitation (bio18), and mean temperature of the wettest quarter. The local communities involved in collecting, selling, and trading/exporting Aegle marmelos may be significantly impacted socio-economically by the possible habitat change of the species’ distribution because of climate change. The study’s findings could be utilized to help establish plans for the management, conservation, and active restoration of economically important species in the region. We also encourage future research to record the regionally varied intensities of anthropogenic disturbances and socioeconomic activities associated with Aegle marmelos in the study area in order to safeguard species hotspots. Predictive models play a crucial role in guiding decisions related to natural resource management, particularly in the context of climate and global changes. To assess the impact of climate change on the management of the Aegle marmelos population in subtropical regions, we conducted temporal and spatial transfers of the models generated.

Supplementary Materials

The following supporting information can be downloaded at: https://www.mdpi.com/article/10.3390/land12071433/s1, Table S1: Environmental predictors used in the MaxEnt species distribution model (SDM) for Aegle marmelos from the studied locality. Table S2: Species Presence locations.

Author Contributions

Conceptualization, M.W. and S.M.H.; Methodology, M.W. and F.A.; software, M.W. and S.M.H.; validation, S.M.H., M.A.J. and F.A.; formal analysis, M.W.; investigation, M.W.; resources, S.M.H. and R.W.B.; Data curation, N.M. and S.A.; writing—original draft preparation, M.W., M.H.S. and S.M.H.; writing—review and editing, S.M.H., M.A.J., N.M., S.A., M.H.S. and F.A.; visualization, R.W.B.; supervision, F.A. and S.M.H.; project administration, R.W.B.; funding acquisition, M.H.S. and S.A. All authors having substantial contribution in research. All authors have read and agreed to the published version of the manuscript.

Funding

This study was supported by the Researchers Supporting Project number (RSP2023R194), King Saud University, Riyadh, Saudi Arabia.

Data Availability Statement

Data is contained within the article.

Acknowledgments

The authors would like to extend their sincere appreciation to the Researchers Supporting Project number (RSP2023R194), King Saud University, Riyadh, Saudi Arabia.

Conflicts of Interest

The authors declare no conflict of interest of this research article.

References

  1. Hamann, E.; Blevins, C.; Franks, S.J.; Jameel, M.I.; Anderson, J.T. Climate change alters plant–herbivore interactions. New Phytol. 2021, 229, 1894–1910. [Google Scholar] [CrossRef] [PubMed]
  2. Elsen, P.R.; Saxon, E.C.; Simmons, B.A.; Ward, M.; Williams, B.A.; Grantham, H.S.; Kark, S.; Levin, N.; Perez-Hammerle, K.V.; Reside, A.E.; et al. Accelerated shifts in terrestrial life zones under rapid climate change. Glob. Change Biol. 2022, 28, 918–935. [Google Scholar] [CrossRef] [PubMed]
  3. Haq, S.M.; Waheed, M.; Ahmad, R.; Bussmann, R.W.; Arshad, F.; Khan, A.M.; Casini, R.; Alataway, A.; Dewidar, A.Z.; Elansary, H.O. Climate change and human activities, the significant dynamic drivers of Himalayan Goral Distribution (Naemorhedus goral). Biology 2023, 12, 610. [Google Scholar] [CrossRef] [PubMed]
  4. Huang, C.; He, H.S.; Liang, Y.; Hawbaker, T.J.; Henne, P.D.; Xu, W.; Gong, P.; Zhu, Z. The changes in species composition mediate direct effects of climate change on future fire regimes of boreal forests in northeastern China. J. Appl. Ecol. 2021, 58, 1336–1345. [Google Scholar] [CrossRef]
  5. Schmeller, D.S.; Courchamp, F.; Killeen, G. Biodiversity loss, emerging pathogens and human health risks. Biodivers. Conserv. 2020, 29, 3095–3102. [Google Scholar] [CrossRef]
  6. Zhang, K.; Liu, Z.; Abdukeyum, N.; Ling, Y. Potential geographical distribution of medicinal plant Ephedra sinica Stapf. under climate change. Forests 2022, 13, 2149. [Google Scholar] [CrossRef]
  7. Zhang, Y.; Tariq, A.; Hughes, A.C.; Hong, D.; Wei, F.; Sun, H.; Sardans, J.; Peñuelas, J.; Perry, G.; Qiao, J.; et al. Challenges and solutions to biodiversity conservation in arid lands. Sci. Total Environ. 2023, 857, 159695. [Google Scholar] [CrossRef]
  8. Williams, J.N.; Seo, C.; Thorne, J.; Nelson, J.K.; Erwin, S.; O’Brien, J.M.; Schwartz, M.W. Using species distribution models to predict new occurrences for rare plants. Divers. Distrib. 2009, 15, 565–576. [Google Scholar] [CrossRef]
  9. Briscoe, N.J.; Elith, J.; Salguero-Gómez, R.; Lahoz-Monfort, J.J.; Camac, J.S.; Giljohann, K.M.; Holden, M.H.; Hradsky, B.A.; Kearney, M.R.; McMahon, S.M.; et al. Forecasting species range dynamics with process-explicit models: Matching methods to applications. Ecol. Lett. 2019, 22, 1940–1956. [Google Scholar] [CrossRef] [Green Version]
  10. Jinga, P.; Liao, Z.; Nobis, M.P. Species distribution modeling that overlooks intraspecific variation is inadequate for proper conservation of marula (Sclerocarya birrea, Anacardiaceae). Glob. Ecol. Conserv. 2021, 32, e01908. [Google Scholar] [CrossRef]
  11. Smith, J.N.; Kelly, N.; Renner, I.W. Validation of presence-only models for conservation planning and the application to whales in a multiple-use marine park. Ecol. Appl. 2021, 31, e02214. [Google Scholar] [CrossRef]
  12. Srivastava, V.; Lafond, V.; Griess, V.C. Species distribution models (SDM): Applications, benefits and challenges in invasive species management. CABI Rev. 2019, 14, 1–13. [Google Scholar] [CrossRef]
  13. Waheed, M.; Arshad, F.; Majeed, M.; Haq, S.M.; Aziz, R.; Bussmann, R.W.; Ali, K.; Subhan, F.; Jones, D.A.; Zaitouny, A. Potential distribution of a noxious weed (Solanum viarum Dunal), current status, and future invasion risk based on MaxEnt modeling. Geol. Ecol. Landsc. 2023, 12, 1–16. [Google Scholar] [CrossRef]
  14. Stewart, S.B.; Fedrigo, M.; Kasel, S.; Roxburgh, S.H.; Choden, K.; Tenzin, K.; Allen, K.; Nitschke, C.R. Predicting plant species distributions using climate-based model ensembles with corresponding measures of congruence and uncertainty. Divers. Distrib. 2022, 28, 1105–1122. [Google Scholar] [CrossRef]
  15. Guisan, A.; Tingley, R.; Baumgartner, J.B.; Naujokaitis-Lewis, I.; Sutcliffe, P.R.; Tulloch, A.I.; Regan, T.J.; Brotons, L.; McDonald-Madden, E.; Mantyka-Pringle, C.; et al. Predicting species distributions for conservation decisions. Ecol. Lett. 2013, 16, 1424–1435. [Google Scholar] [CrossRef] [PubMed]
  16. Chauvier, Y.; Descombes, P.; Guéguen, M.; Boulangeat, L.; Thuiller, W.; Zimmermann, N.E. Resolution in species distribution models shapes spatial patterns of plant multifaceted diversity. Ecography 2022, 10, e05973. [Google Scholar] [CrossRef]
  17. Gotelli, N.J.; Stanton-Geddes, J. Climate change, genetic markers and species distribution modelling. J. Biogeogr. 2015, 42, 1577–1585. [Google Scholar] [CrossRef]
  18. Mod, H.K.; Scherrer, D.; Luoto, M.; Guisan, A. What we use is not what we know: Environmental predictors in plant distribution models. J. Veg. Sci. 2016, 27, 1308–1322. [Google Scholar] [CrossRef] [Green Version]
  19. Falk, W.; Mellert, K.H. Species distribution models as a tool for forest management planning under climate change: Risk evaluation of Abies alba in Bavaria. J. Veg. Sci. 2011, 22, 621–634. [Google Scholar] [CrossRef]
  20. Grenouillet, G.; Buisson, L.; Casajus, N.; Lek, S. Ensemble modelling of species distribution: The effects of geographical and environmental ranges. Ecography 2011, 34, 9–17. [Google Scholar] [CrossRef]
  21. Arshad, F.; Waheed, M.; Fatima, K.; Harun, N.; Iqbal, M.; Fatima, K.; Umbreen, S. Predicting the suitable current and future potential distribution of the native endangered tree Tecomella undulata (Sm.) Seem. in Pakistan. Sustainability 2022, 14, 7215. [Google Scholar] [CrossRef]
  22. Albert, C.H.; Rayfield, B.; Dumitru, M.; Gonzalez, A. Applying network theory to prioritize multispecies habitat networks that are robust to climate and land-use change. Biol. Conserv. 2017, 31, 1383–1396. [Google Scholar] [CrossRef] [Green Version]
  23. Herrera-Feijoo, R.J.; Torres, B.; López-Tobar, R.; Tipán-Torres, C.; Toulkeridis, T.; Heredia-R, M.; Mateo, R.G. Modelling climatically suitable areas for Mahogany (Swietenia macrophylla King) and their shifts across Neotropics: The role of Protected Areas. Forests 2023, 14, 385. [Google Scholar] [CrossRef]
  24. Ferraz, K.M.P.M.D.B.; Morato, R.G.; Bovo, A.A.A.; da Costa, C.O.R.; Ribeiro, Y.G.G.; de Paula, R.C.; Desbiez, A.L.J.; Angelieri, C.S.C.; Traylor-Holzer, K. Bridging the gap between researchers, conservation planners, and decision makers to improve species conservation decision-making. Conserv. Sci. Pract. 2021, 3, e330. [Google Scholar] [CrossRef]
  25. UCN. The IUCN Red List of Threatened Species. Version 2022-2. Available online: https://www.iucnredlist.org/ (accessed on 10 December 2022).
  26. Hassan-ud-Din, G.; Ghazanfar, S. Rutaceae. Flora Pak. 1980, 132, 10–15. [Google Scholar]
  27. Kress, W.J.; DeFilipps, R.A.; Farr, E.; Kyi, D.Y.Y. A checklist of the trees, shrubs, herbs, and climbers of Myanmar. Natl. Herbarium 2003, 45, 1–590. [Google Scholar]
  28. Pandey, R.P.; Diwakar, P.O. An integrated check-list flora of Andaman and Nicobar Islands, India. J. Econ. Taxon. Bot. 2008, 32, 403–500. [Google Scholar]
  29. Neeraj, V.B.; Johar, V. Bael (Aegle marmelos) extraordinary species of India: A review. Int. J. Curr. Microbiol. Appl. 2017, 6, 1870–1887. [Google Scholar]
  30. Vasava, D.; Kher, M.M.; Nataraj, M.; Teixeira da Silva, J.A. Bael tree (Aegle marmelos (L.) Corrêa): Importance, biology, propagation, and future perspectives. Trees 2018, 32, 1165–1198. [Google Scholar] [CrossRef]
  31. Waheed, M.; Arshad, F.; Majeed, M.; Fatima, S.; Mukhtar, N.; Aziz, R.; Mangrio, W.M.; Almohamad, H.; Al Dughairi, A.A.; Al-Mutiry, M.; et al. Community structure and distribution pattern of woody vegetation in response to soil properties in semi-arid lowland District Kasur Punjab, Pakistan. Land 2022, 11, 2145. [Google Scholar] [CrossRef]
  32. Pande, H.K.; Arora, S. India’s Fifth National Report to the Convention on Biological Diversity; Ministry of Environment and Forests, Government of India, New Delhi: Delhi, India, 2014; Volume 142. [Google Scholar]
  33. Porfirio, L.L.; Harris, R.M.; Lefroy, E.C.; Hugh, S.; Gould, S.F.; Lee, G.; Bindoff, N.L.; Mackey, B. Improving the use of species distribution models in conservation planning and management under climate change. PLoS ONE 2014, 9, e113749. [Google Scholar] [CrossRef] [Green Version]
  34. Tiwari, V.; Singh, R.; Pandey, A.K. Aegle marmelos: Pharmacological, medicinal importance, and conservation in India. J. Exp. Zool. India 2018, 21, 1–9. [Google Scholar]
  35. Rahman, S.; Parvin, R. Therapeutic potential of Aegle marmelos (L.)—An overview. Asian Pac. J. Trop. Dis. 2014, 4, 71–77. [Google Scholar] [CrossRef]
  36. Maity, P.; Hansda, D.; Bandyopadhyay, U.; Mishra, D.K. Biological activities of crude extracts and chemical constituents of Bael, Aegle marmelos (L.) Corr. Indian J. Exp. Biol. 2009, 47, 849–861. [Google Scholar]
  37. Mujeeb, F.; Bajpai, P.; Pathak, N. Phytochemical evaluation, antimicrobial activity, and determination of bioactive components from leaves of Aegle marmelos. BioMed. Res. Int. 2014, 2014, 497606. [Google Scholar] [CrossRef] [Green Version]
  38. Rajan, S.; Gokila, M.; Jency, P.; Brindha, P.; Sujatha, R.K. Antioxidant and phytochemical properties of Aegle marmelos fruit pulp. Int. J. Curr. Pharm. Res. 2011, 3, 65–70. [Google Scholar]
  39. Waheed, M.; Haq, S.M.; Arshad, F.; Bussmann, R.W.; Iqbal, M.; Bukhari, N.A.; Hatamleh, A.A. Grasses in semi-arid lowlands—Community composition and spatial dynamics with special regard to the influence of edaphic factors. Sustainability 2022, 14, 14964. [Google Scholar] [CrossRef]
  40. Bosso, L.; Di Febbraro, M.; Cristinzio, G.; Zoina, A.; Russo, D. Shedding light on the effects of climate change on the potential distribution of Xylella fastidiosa in the Mediterranean basin. Biol. Invasions 2016, 18, 1759–1768. [Google Scholar] [CrossRef]
  41. Hijmans, R.J.; Cameron, S.E.; Parra, J.L.; Jones, P.G.; Jarvis, A. Very high resolution interpolated climate surfaces for global land areas. Int. J. Climatol. A J. R. Meteorol. Soc. 2005, 25, 1965–1978. [Google Scholar] [CrossRef]
  42. Graham, M.H. Confronting multicollinearity in ecological multiple regression. Ecology 2003, 84, 2809–2815. [Google Scholar] [CrossRef] [Green Version]
  43. Anderson, R.P.; Gonzalez, I., Jr. Species-specific tuning increases robustness to sampling bias in models of species distributions: An implementation with Maxent. Ecol. Modell. 2011, 222, 2796–2811. [Google Scholar] [CrossRef]
  44. Bao, R.; Li, X.; Zheng, J. Feature tuning improves MAXENT predictions of the potential distribution of Pedicularis longiflora Rudolph and its variant. PeerJ 2022, 10, e13337. [Google Scholar] [CrossRef] [PubMed]
  45. Phillips, S.J.; Anderson, R.P.; Schapire, R.E. Maximum entropy modeling of species geographic distributions. Ecol. Modell. 2006, 190, 231–259. [Google Scholar] [CrossRef] [Green Version]
  46. Bai, D.F.; Chen, P.J.; Atzeni, L.; Cering, L.; Li, Q.; Shi, K. Assessment of habitat suitability of the snow leopard (Panthera uncia) in Qomolangma National Nature Reserve based on MaxEnt modeling. Zool. Res. 2018, 39, 373. [Google Scholar] [PubMed]
  47. Fourcade, Y.; Engler, J.O.; Rödder, D.; Secondi, J. Mapping species distributions with MAXENT using a geographically biased sample of presence data: A performance assessment of methods for correcting sampling bias. PLoS ONE 2014, 9, e97122. [Google Scholar] [CrossRef] [Green Version]
  48. Merow, C.; Smith, M.J.; Silander, J.A., Jr. A practical guide to MaxEnt for modeling species’ distributions: What it does, and why inputs and settings matter. Ecography 2013, 36, 1058–1069. [Google Scholar] [CrossRef]
  49. Summers, D.M.; Bryan, B.A.; Crossman, N.D.; Meyer, W.S. Species vulnerability to climate change: Impacts on spatial conservation priorities and species representation. Glob. Change Biol. 2012, 18, 2335–2348. [Google Scholar] [CrossRef]
  50. Elith, J.; Graham, C.H.; Anderson, R.P.; Dudík, M.; Ferrier, S.; Guisan, A.; Hijmans, R.J.; Huettmann, F.; Leathwick, J.R.; Lehmann, A.; et al. Novel methods improve prediction of species’ distributions from occurrence data. Ecography 2006, 29, 129–151. [Google Scholar] [CrossRef] [Green Version]
  51. Elith, J.; Phillips, S.J.; Hastie, T.; Dudík, M.; Chee, Y.E.; Yates, C.J. A statistical explanation of MaxEnt for ecologists. Diver. Distrib. 2011, 17, 43–57. [Google Scholar] [CrossRef]
  52. Phillips, S.J.; Dudík, M.; Elith, J.; Graham, C.H.; Lehmann, A.; Leathwick, J.; Ferrier, S. Sample selection bias and presence-only distribution models: Implications for background and pseudo-absence data. Ecol. Appl. 2009, 19, 181–197. [Google Scholar] [CrossRef] [PubMed] [Green Version]
  53. Yang, X.Q.; Kushwaha, S.P.S.; Saran, S.; Xu, J.; Roy, P.S. Maxent modeling for predicting the potential distribution of medicinal plant, Justicia adhatoda L. in Lesser Himalayan foothills. Ecol. Eng. 2013, 51, 83–87. [Google Scholar] [CrossRef]
  54. Gassó, N.; Thuiller, W.; Pino, J.; Vilà, M. Potential distribution range of invasive plant species in Spain. NeoBiota 2012, 12, 25. [Google Scholar]
  55. Khan, A.M.; Li, Q.; Saqib, Z.; Khan, N.; Habib, T.; Khalid, N.; Majeed, M.; Tariq, A. MaxEnt modelling and impact of climate change on habitat suitability variations of economically important Chilgoza Pine (Pinus gerardiana Wall.) in South Asia. Forests 2022, 13, 715. [Google Scholar] [CrossRef]
  56. Peterson, A.T.; Papes, M.; Eaton, M. Transferability and model evaluation in ecological niche modeling: A comparison of GARP and Maxent. Ecography 2007, 30, 550–560. [Google Scholar] [CrossRef]
  57. Phillips, S.J.; Dudík, M. Modeling of species distributions with Maxent: New extensions and a comprehensive evaluation. Ecography 2008, 31, 161–175. [Google Scholar] [CrossRef]
  58. Chu, J.; Li, Y.; Zhang, L.; Li, B.; Gao, M.; Tang, X.; Ni, J.; Xu, X. Potential distribution range and conservation strategies for the endangered species Amygdalus pedunculata. Biodiver. Sci. 2017, 25, 799. [Google Scholar] [CrossRef] [Green Version]
  59. Xiong, Q.L.; He, Y.L.; Deng, F.Y.; Li, T.Y.; Yu, L. Assessment of alpine mean response to climate change in Southwest China based on MaxEnt model. Acta Ecol. Sin. 2019, 39, 9033–9043. [Google Scholar]
  60. Venne, S.; Currie, D.J. Can habitat suitability estimated from MaxEnt predict colonizations and extinctions? Divers. Distrib. 2021, 27, 873–886. [Google Scholar] [CrossRef]
  61. Zengli, L.I.U.; Lile, H.U. Prediction of potential distribution and climate change of rare species Cephalotaxus oliveri. For. Resour. Manag. 2022, 1, 35. [Google Scholar]
  62. Cotto, O.; Wessely, J.; Georges, D.; Klonner, G.; Schmid, M.; Dullinger, S.; Thuiller, W.; Guillaume, F. A dynamic eco-evolutionary model predicts slow response of alpine plants to climate warming. Nat. Commun. 2017, 8, 15399. [Google Scholar] [CrossRef] [Green Version]
  63. Kaky, E.; Nolan, V.; Alatawi, A.; Gilbert, F. A comparison between Ensemble and MaxEnt species distribution modelling approaches for conservation: A case study with Egyptian medicinal plants. Ecol. Inform. 2020, 60, 101150. [Google Scholar] [CrossRef]
  64. Midolo, G.; Wellstein, C. Plant performance and survival across transplant experiments depend upon temperature and precipitation change along elevation. J. Ecol. 2020, 108, 2107–2120. [Google Scholar] [CrossRef]
  65. Chaudhry, S.; Sidhu, G.P.S. Climate change regulated abiotic stress mechanisms in plants: A comprehensive review. Plant Cell Rep. 2022, 41, 1–31. [Google Scholar] [CrossRef]
  66. Li, Y.; Shao, W.; Jiang, J. Predicting the potential global distribution of Sapindus mukorossi under climate change based on MaxEnt modelling. Environ. Sci. Poll. Res. 2021, 29, 21751–21768. [Google Scholar] [CrossRef] [PubMed]
  67. Kong, F.; Tang, L.; He, H.; Yang, F.; Tao, J.; Wang, W. Assessing the impact of climate change on the distribution of Osmanthus fragrans using Maxent. Environ. Sci. Poll. Res. 2021, 28, 34655–34663. [Google Scholar] [CrossRef] [PubMed]
  68. Duan, X.; Li, J.; Wu, S. MaxEnt Modeling to estimate the impact of climate factors on distribution of Pinus densiflora. Forests 2022, 13, 402. [Google Scholar] [CrossRef]
  69. Thakur, K.K.; Bhat, P.; Kumar, A.; Ravikanth, G.; Saikia, P. Distribution mapping of Bauhinia vahlii Wight & Arn. in India using ecological niche modelling. Trop. Ecol. 2022, 63, 286–299. [Google Scholar]
  70. Austin, M.P.; Van Niel, K.P. Improving species distribution models for climate change studies: Variable selection and scale. J. Biogeogr. 2011, 38, 1–8. [Google Scholar] [CrossRef]
  71. Wu, B.; Zhou, L.; Qi, S.; Jin, M.; Hu, J.; Lu, J. Effect of habitat factors on the understory plant diversity of Platycladus orientalis plantations in Beijing mountainous areas based on MaxEnt model. Ecol. Indic. 2021, 129, 107917. [Google Scholar] [CrossRef]
  72. Cantón, Y.; Del Barrio, G.; Solé-Benet, A.; Lázaro, R. Topographic controls on the spatial distribution of ground cover in the Tabernas badlands of SE Spain. Catena 2004, 55, 341–365. [Google Scholar] [CrossRef]
  73. Sharath, A.A.; Ghosh, S.N.; Das, B.C. Integrated nutrient management in bael (Aegle marmelos Corr.) in New Alluvial soil. IJMFM AP 2016, 2, 41–46. [Google Scholar]
  74. Rajpoot, R.; Adhikari, D.; Verma, S.; Saikia, P.; Kumar, A.; Grant, K.R.; Dayanandan, A.; Kumar, A.; Khare, P.K.; Khan, M.L. Climate models predict a divergent future for the medicinal tree Boswellia serrata Roxb. in India. Glob. Ecol. Conserv. 2020, 23, e01040. [Google Scholar] [CrossRef]
  75. Priti, H.; Aravind, N.A.; Shaanker, R.U.; Ravikanth, G. Modeling impacts of future climate on the distribution of Myristicaceae species in the Western Ghats, India. Ecol. Eng. 2016, 89, 14–23. [Google Scholar] [CrossRef]
  76. Ahmad, R.; Khuroo, A.A.; Hamid, M.; Charles, B.; Rashid, I. Predicting invasion potential and niche dynamics of Parthenium hysterophorus (Congress grass) in India under projected climate change. Biodiv. Conserv. 2019, 28, 2319–2344. [Google Scholar] [CrossRef]
  77. Purohit, S.; Rawat, N. MaxEnt modeling to predict the current and future distribution of Clerodendrum infortunatum L. under climate change scenarios in Dehradun district, India. Model. Earth Sys. Environ. 2022, 8, 2051–2063. [Google Scholar] [CrossRef]
  78. Mahmoodi, S.; Heydari, M.; Ahmadi, K.; Khwarahm, N.R.; Karami, O.; Almasieh, K.; Naderi, B.; Bernard, P.; Mosavi, A. The current and future potential geographical distribution of Nepeta crispa Willd., an endemic, rare and threatened aromatic plant of Iran: Implications for ecological conservation and restoration. Ecol. Indic. 2022, 137, 108752. [Google Scholar] [CrossRef]
Figure 1. The Bael tree (Aegle marmelos) (A) branch with fruit; (B) fruit and fruit shell; (C) farmland with a number of mature trees.
Land 12 01433 g001
Figure 2. The study area map exhibits the elevation and occurrence points of Aegle marmelos in different regions.
Land 12 01433 g002
Figure 3. Pearson correlation is used to produce a heat map of the pairwise correlation (threshold: r = ±0.8) between the climatic and biophysical variables used in the distribution modeling of Aegle marmelos.
Land 12 01433 g003
Figure 4. ROC prediction using the MaxEnt model. The model’s precision was 0.992.
Land 12 01433 g004
Figure 5. The predictive power of environmental factors is assessed using the jackknife of regularized training gain in MaxEnt models for Aegle marmelos.
Land 12 01433 g005
Figure 6. Response curve of a contributing variable in the distribution of Aegle marmelos. (a) Soil bulk density (bdod), (b) isothermality (bio03), (c) precipitation of the warmest quarter (bio18), (d) mean temperature of the wettest quarter (bio08), (e) precipitation of the coldest quarter (bio19), (f) annual mean temperature (bio01), (g) annual precipitation (bio12), and (h) total nitrogen.
Land 12 01433 g006
Figure 7. Under the current climatic (1970s–2000s) circumstances, the MaxEnt prediction map shows the possible habitat suitability categorization of Aegle marmelos in the research area. (Legends: NSR: not suitable regions; LSR: low suitability regions; MSR: moderately suitable regions; HSR: highly suitable regions; and VHSR: very highly suitable regions.).
Land 12 01433 g007
Figure 8. The habitat suitability classes under various climate change scenarios are shown on the MaxEnt prediction maps ((A) = SSPs-245 of the 2050s; (B) = SSPs-585 of the 2050s; (C) = SSPs-245 of the 2070s; (D) = SSPs-585 of the 2070s). (Legends: NSR: not suitable regions; LSR: low suitability regions; MSR: moderately suitable regions; HSR: highly suitable regions; and VHSR: very highly suitable regions).
Land 12 01433 g008
Table 1. Following preliminary analysis, environmental elements and their contribution rates were chosen.
DescriptionCodePercent Contribution
Bulk Densitybdod74.3
Isothermality (Bio2/Bio7) (×100) Bio039.2
Precipitation of the Warmest Quarter Bio186.9
Mean Temperature of the Wettest QuarterBio085.2
Precipitation of the Coldest Quarter Bio194.2
Annual Mean Temperature Bio011
Annual Precipitation Bio121.7
Total Nitrogennitrogen1.5
Table 2. The expected probability of A. marmelos habitat suitability under various climate change scenarios.
Climate Change
Scenario
NSLSMSHSVHSTotal Suitable Land Area (km2)
(p ≤ 0.2)(p 0.21–0.4)(p 0.41–0.6)(p 0.61–0.8)(p ≥ 0.81)
Current484,918128,961102,161110,45555,292396,869
SSPs_245_2050515,774121,14594,26894,43056,170366,013
Rate of change (%)3.5−1.3−0.3−2.30.4−3.5
SSPs_585_2050538,774131,14585,26884,43052,170343,013
Rate of change (%)6.1−2.3−1.3−3.4−0.1−6.1
SSPs_245_2070526,774118,04592,56890,23054,170355,013
Rate of change (%)4.7−1.6−0.5−2.80.1−4.7
SSPs_585_2070555,774101,14588,26887,43049,170326,013
Rate of change (%)8.0−3.5−1.0−3.1−0.4−8.0
Disclaimer/Publisher’s Note: The statements, opinions and data contained in all publications are solely those of the individual author(s) and contributor(s) and not of MDPI and/or the editor(s). MDPI and/or the editor(s) disclaim responsibility for any injury to people or property resulting from any ideas, methods, instructions or products referred to in the content.

