1. Introduction
The expansion of urbanization presents complex challenges, including uncontrolled development boundaries, irrational land-use practices, and disorderly spatial structures, leading to low-quality urban spaces, ecological damage, and declining human welfare [
1,
2,
3,
4]. These challenges are especially prevalent in resource-based cities, like coal-resource-based areas, resulting in fragmented spatial structures and inefficient land use [
5,
6], severely impeding the sustainable development of these regions [
7]. To address these issues, the national “14th Five-Year Plan” has outlined the importance of maximizing land’s economic and intensive use, revitalizing underutilized land, promoting the reuse of abandoned industrial and mining land, and optimizing mixed land use. In addition, the plan emphasizes comprehensive land improvement and the revitalization of land resources in sinkhole regions. Thus, identifying and addressing urban spatial structure and land-use inefficiencies in resource-based areas are critical factors in achieving high-quality development in these regions [
8,
9,
10,
11,
12,
13].
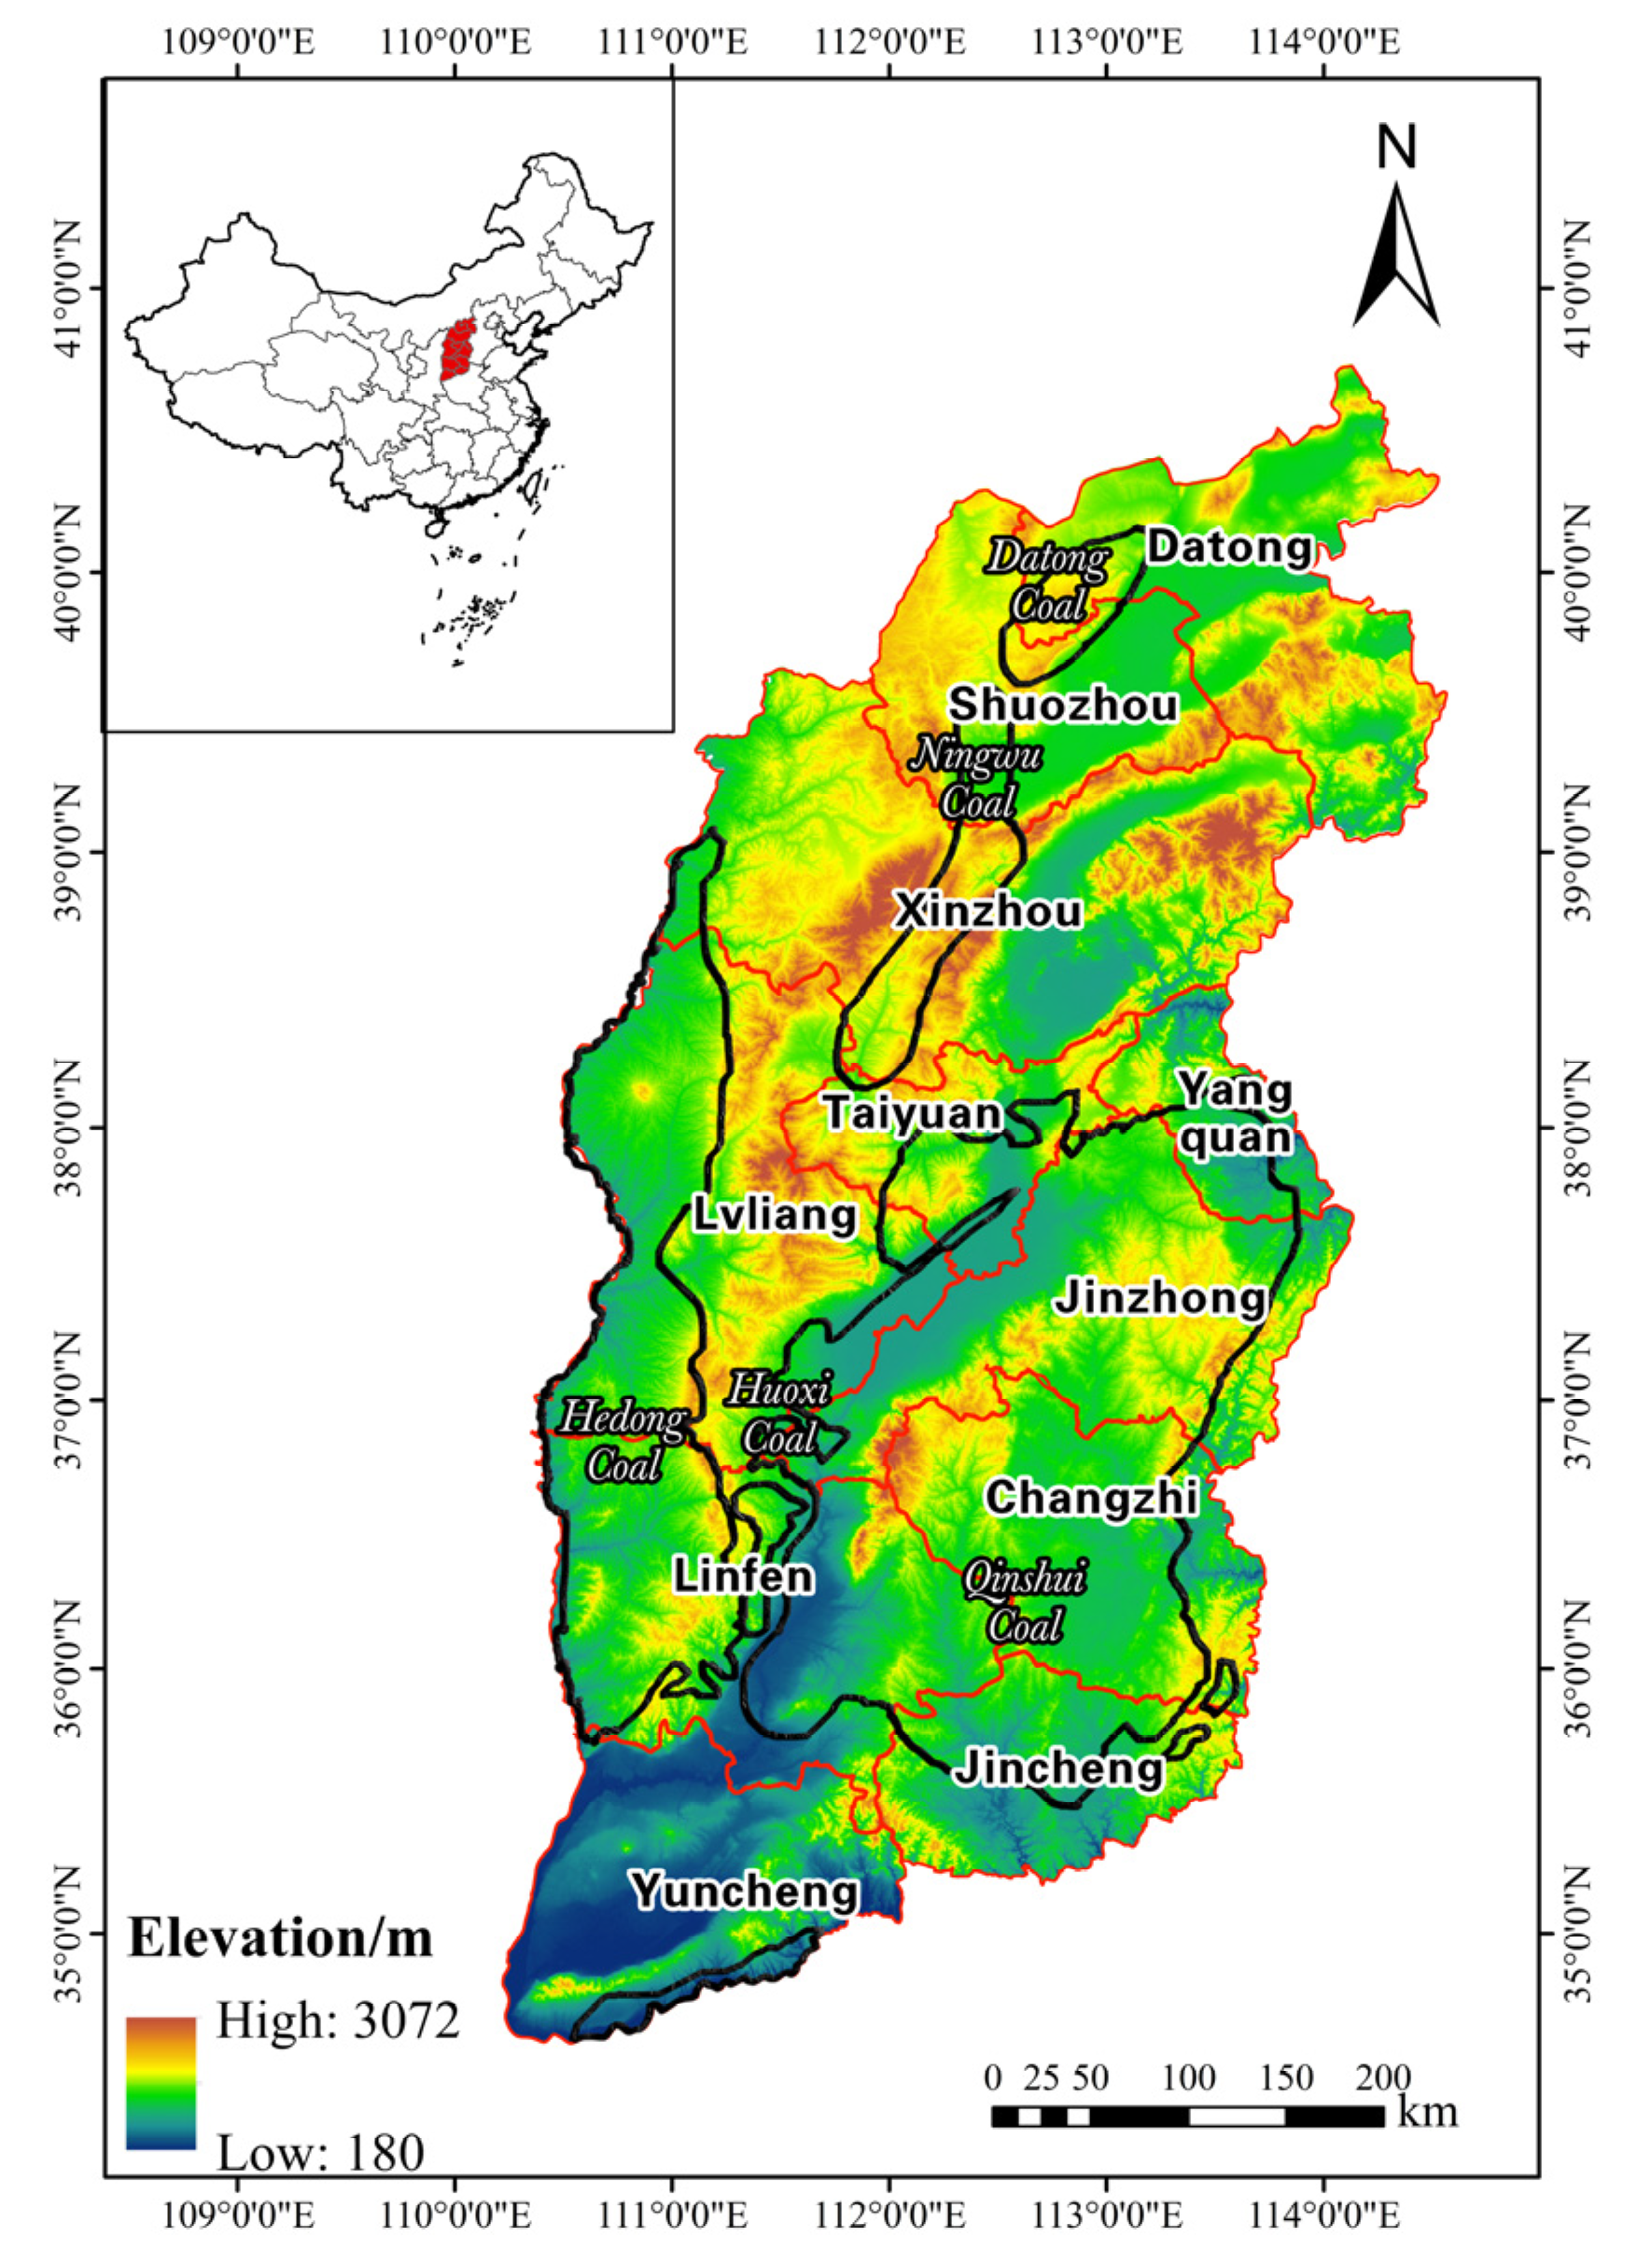
Shanxi Province in China is a significant energy-resource-rich region, housing 119 district-level units, 94 cities, and coal distribution accounting for 80% of the province’s resources. The coal reserves influence the distribution of several independent industrial and mining areas in the region, which are mainly situated far from urban areas. The region’s sparse infrastructure has resulted in loose urban spatial structure and inefficient land use, negatively affecting the cities’ compact development. In light of the necessary high-quality development for resource-based regions, this paper aims to offer a scientific analysis of the urban compactness evolution characteristics and land-use efficiency while exploring their coordinated development status, coupling relationship, and overall coordination. This approach provides insightful support for upgrading the urban spatial structure and enhancing land-use efficiency in resource-based regions.
The compact city represents a response to the issue of urban sprawl and an exploration of sustainable urban development [
14,
15]. Characteristics of a compact city include mixed land use [
16], high urban density [
17], efficient urban operation [
18], good quality of life, and convenient road access [
19]. This concept can be categorized into three research areas: theoretical connotation [
20], measurement of urban compactness [
21], and planning practice [
22]. The measurement index is an essential aspect of the compact city concept used to determine whether urban development is compact [
23,
24]. Previous research on urban compactness primarily focused on the characteristics of urban geometry [
25], which lacked depth and rationality. Current research employs multiple indicators to measure the city’s compactness, utilizing system theory and statistical principles to comprehensively evaluate different dimensions of cities [
25], such as morphology, function, population, and economy [
26]. The aforementioned criteria are limited in scope, as they solely assess the influence of urban form on compactness, leaving room for further analysis. As a result, there has been a shift towards utilizing multiple indicators to assess a city’s compactness by systematically researching each function of the city. This approach employs the principles of system theory and statistics to provide a comprehensive evaluation of various dimensions of cities including morphology, function, population, and economy [
27]. A comprehensive evaluation index system and types of urban compactness have been established through factor and correlation analysis and used to measure single cities or urban clusters [
28,
29].
The aim of promoting compact city space development is to enhance the efficiency of land resource allocation and usage [
30]. Over the years, numerous scholars have undertaken research to dissect the meaning of land-use efficiency, as well as its influencing factors and methods of measurement under various conditions and constraints [
31,
32]. This has led to a thorough exploration of the spatial and temporal patterns of land-use efficiency across varying spatial scales [
33]. Several evaluation methods, like data envelopment analysis [
34], the Malmquist index, the regression analysis model [
35], and the multi-factor integrated evaluation approach, have been developed, with the data envelopment analysis (DEA) and slack based measure (SBM)models being the most prevalent [
36,
37]. To analyze the spatio-temporal evolution of land-use efficiency and the possible influencing factors of resource-based cities in China, Song et al. employed the SBM-undesirable model [
38], while Xiao et al. (2022) used SBM, the coupling coordination degree model (CCDEM), and the geographically weighted regression model (GWRM) to scrutinize the complex dynamic link between urbanization and land-use efficiency, as well as its spatial effects, in 39 cities on the Loess Plateau of China [
39]. Chen et al. (2019) utilized the CCDEM model to assess the efficiency of industrial land use in 119 resource-based cities in China, and Xue et al. (2022) used the super-explainable boosting machine (EBM) model to analyze the land-use efficiency of 57 cities in the Yellow River basin in China [
40]. The study revealed that the lowest land-use efficiency was in the middle reaches of the Yellow River basin, where Shanxi Province is located, while the urban land-use efficiency along the Yellow River was even lower [
41].
Currently, there is ongoing policy analysis and quantitative measurement research on the relationship between urban compactness and land-use efficiency [
42]. However, there is a noticeable lack of exploration into the correlation between the two and the mechanism of their effects. Moreover, there is a noticeable scarcity of analyses of small-scale urban units, while more emphasis is put on the macro-regional level [
43]. Notably, more attention is directed towards resource-based areas with concentrated coal mines because these cities are primarily affected by mining activities, which significantly impact urban spatial structure and land resources. This study aims to examine the intersection of urban compactness and land-use efficiency research, which is an expansion of compact-city-related research and a deepening of land-use efficiency research [
44]. Analyzing county-level administrative units is a suitable approach for capturing the urban problems of resource-based regions and the heterogeneity of inter-regional development. Ultimately, this study aims to enhance the research framework of sustainable urban development in resource-based areas [
45].
Building upon this research foundation, our study proposes several key innovations. To begin, we have developed a measuring method for compactness and land-use efficiency that accounts for the unique characteristics of resource-based areas. This approach has been applied to evaluate county units in Shanxi Province. Additionally, we have conducted an analysis of the coupling-coordination levels and types for urban compactness and land-use efficiency in these same county units. Finally, through cold hot-spot analysis, we have revealed the temporal evolution and spatial distribution patterns of urban compactness and land-use efficiency.
3. Methods
To further investigate the impact of coal mining activities on urban compactness and land-use efficiency, this study divided 119 county units in Shanxi province into 77 coal-resource-based cities and 42 non-coal-resource-based cities based on the presence or absence of coal mining.
3.1. Compactness Measurement Method
Assigning weights to each metric is a crucial step in determining the significance of various indicators in the urban compactness index system. Popular methods used in urban compactness studies include the entropy method, principal component analysis, and hierarchical analysis. However, solely relying on a single assignment method has its limitations and cannot account for the diverse meanings of attribute data. Therefore, this research employs a combination of objective and subjective assignment techniques to overcome this limitation. Firstly, the selected index data are standardized, projected into the 0–1 interval, and assessed using the Entropy and CRITIC methods to determine their weights. Secondly, the D–S evidence theory approach is utilized to establish the combined weights of the two methods. Finally, the linear weighted summation method is applied to calculate the compactness of each district and county in Shanxi Province over three years.
3.2. The Two-Stage Network Super-EBM Model Considering Undesirable Outputs
The methodology of data envelopment analysis (DEA) was first initiated by Charnes, Cooper, and Rhodes in 1978 for the purpose of assessing the validity of decision-making units. However, the conventional DEA model is a radial measurement technique that does not integrate the input and output slack into the model, and any non-zero slack in the measurements can lead to inefficiencies and inaccuracies. To address these issues, Tone proposed a non-radial SBM model based on slack variables, but this model still did not evaluate multiple decision units effectively. As a result, Tone and Tsutsui introduced the EBM model, which effectively considers the proportional and non-radial differences between input or output variables, thus avoiding the drawbacks of the SBM model. However, the EBM model measures the practical unit efficiency value as 1, which makes it difficult to analyze the differences in efficiency between evaluation units. Therefore, this study combines the network EBM model proposed by Tavana et al. (2013) [
39] with the research basis of Chen et al. (2020) [
40], and finally adopts the EBM model for land-use efficiency calculation. The formula of the model used for this purpose is as follows:
where
is the optimal efficiency value measured by the model.
Wh (
h = 1, 2) is the weight of stage h.
,
, and
are the input, desired output, and non-desired output of stage h of the DMU, respectively.
,
, and
are the slack of input, desired output, and non-desired output of stage h, respectively.
is the efficiency value in the radial condition.
is the core parameter of the importance of the non-radial part.
,
, and
represent the weights of input, desired output, and non-desired output of stage h, respectively.
Z is the intermediate variable, and
λ is the intensity vector of the corresponding stage.
3.3. Coupling-Coordination Degree Model (CCDM)
The concept of coupling coordination refers to the harmonious symbiosis of measurement systems or elements, which reflects the transformation from disorder to order within a system [
42]. This study presents a model for measuring the degree of coupling coordination between two systems, namely urban compactness and land-use efficiency. By analyzing the coordinated development levels of districts and counties in Shanxi Province over three years, this study aims to establish the coupling-coordination relationship between the two systems and provide recommendations for territorial spatial planning. The formula for calculating the coupled-coordination degree is as follows:
where
C represents the coupling degree of urban compactness and urban land-use efficiency, D represents the coupling-coordination degree, and T represents the coupling-coordination development-level index.
is the comprehensive index of compactness, is the comprehensive index of land-use efficiency C ∈ [0,1), and a and b, respectively, represent the contribution of compactness and land-use efficiency to the comprehensive evaluation index, which belong to undetermined weights.
Based on the results of a related study (Shao et al., 2022) [
61],
a =
b = 0.5 was taken in this paper. Consistent with the current research, the relationship between the coupling-coordination degree D, and the difference between compactness and land-use efficiency
f(
Uc) −
f(
Ul), is divided into five grades from low to high. The specific classification standards are shown in
Table 3.
3.4. Hot-Spot Analysis
The present study utilized the Getis–Ord Gi* statistical index method to investigate the hot and cold spots related to compactness and land-use efficiency. The Getis–Ord Gi* statistical index method is a specialized local autocorrelation analysis technique which helps to identify spatial clusters exhibiting statistically significant high values (hot-spot areas) or low values (cold-spot areas). This technique enables us to effectively assess the spatially distributed clustering of study objects. By spatializing data, we can also track the evolutionary trend of the spatial clustering distribution concerning compactness and land-use efficiency. Lastly, we can analyze the spatial evolutionary states of the cold- and hot-spot areas of the clustering distribution of both factors.
3.5. The Spatial-Divergence Characterization Method
The examination of spatial autocorrelation for compactness and land-use efficiency through hot-spot analysis has its limitations, as it only provides insight on the local level. It fails to identify areas with significant attribute value differences within the same area. To address this, we employed the alternative spatial dispersion feature analysis method to augment the shortfall of cold-spot analysis. In this research, we utilized the local Moran-I-index LISA values to investigate the clustering of attribute values. Moran scatter plots were also utilized to scrutinize the agglomeration dispersion effects of individual regions, disclosing the degree of autocorrelation between the CCD of each unit and its surrounding units in each district and county of Shanxi Province. Through identifying low–low, high–high, low–high, and high–low spatial clustering patterns, we revealed the CCD spatial dispersion patterns of urban compactness and land-use efficiency.
where
and
represent the attribute variables of county
i (district) and county
j (district),
is the spatial weight matrix,
is the sample variance, and
n is the number of counties (districts).
4. Results
4.1. Analysis of Spatial–Temporal Changes of Urban Compactness
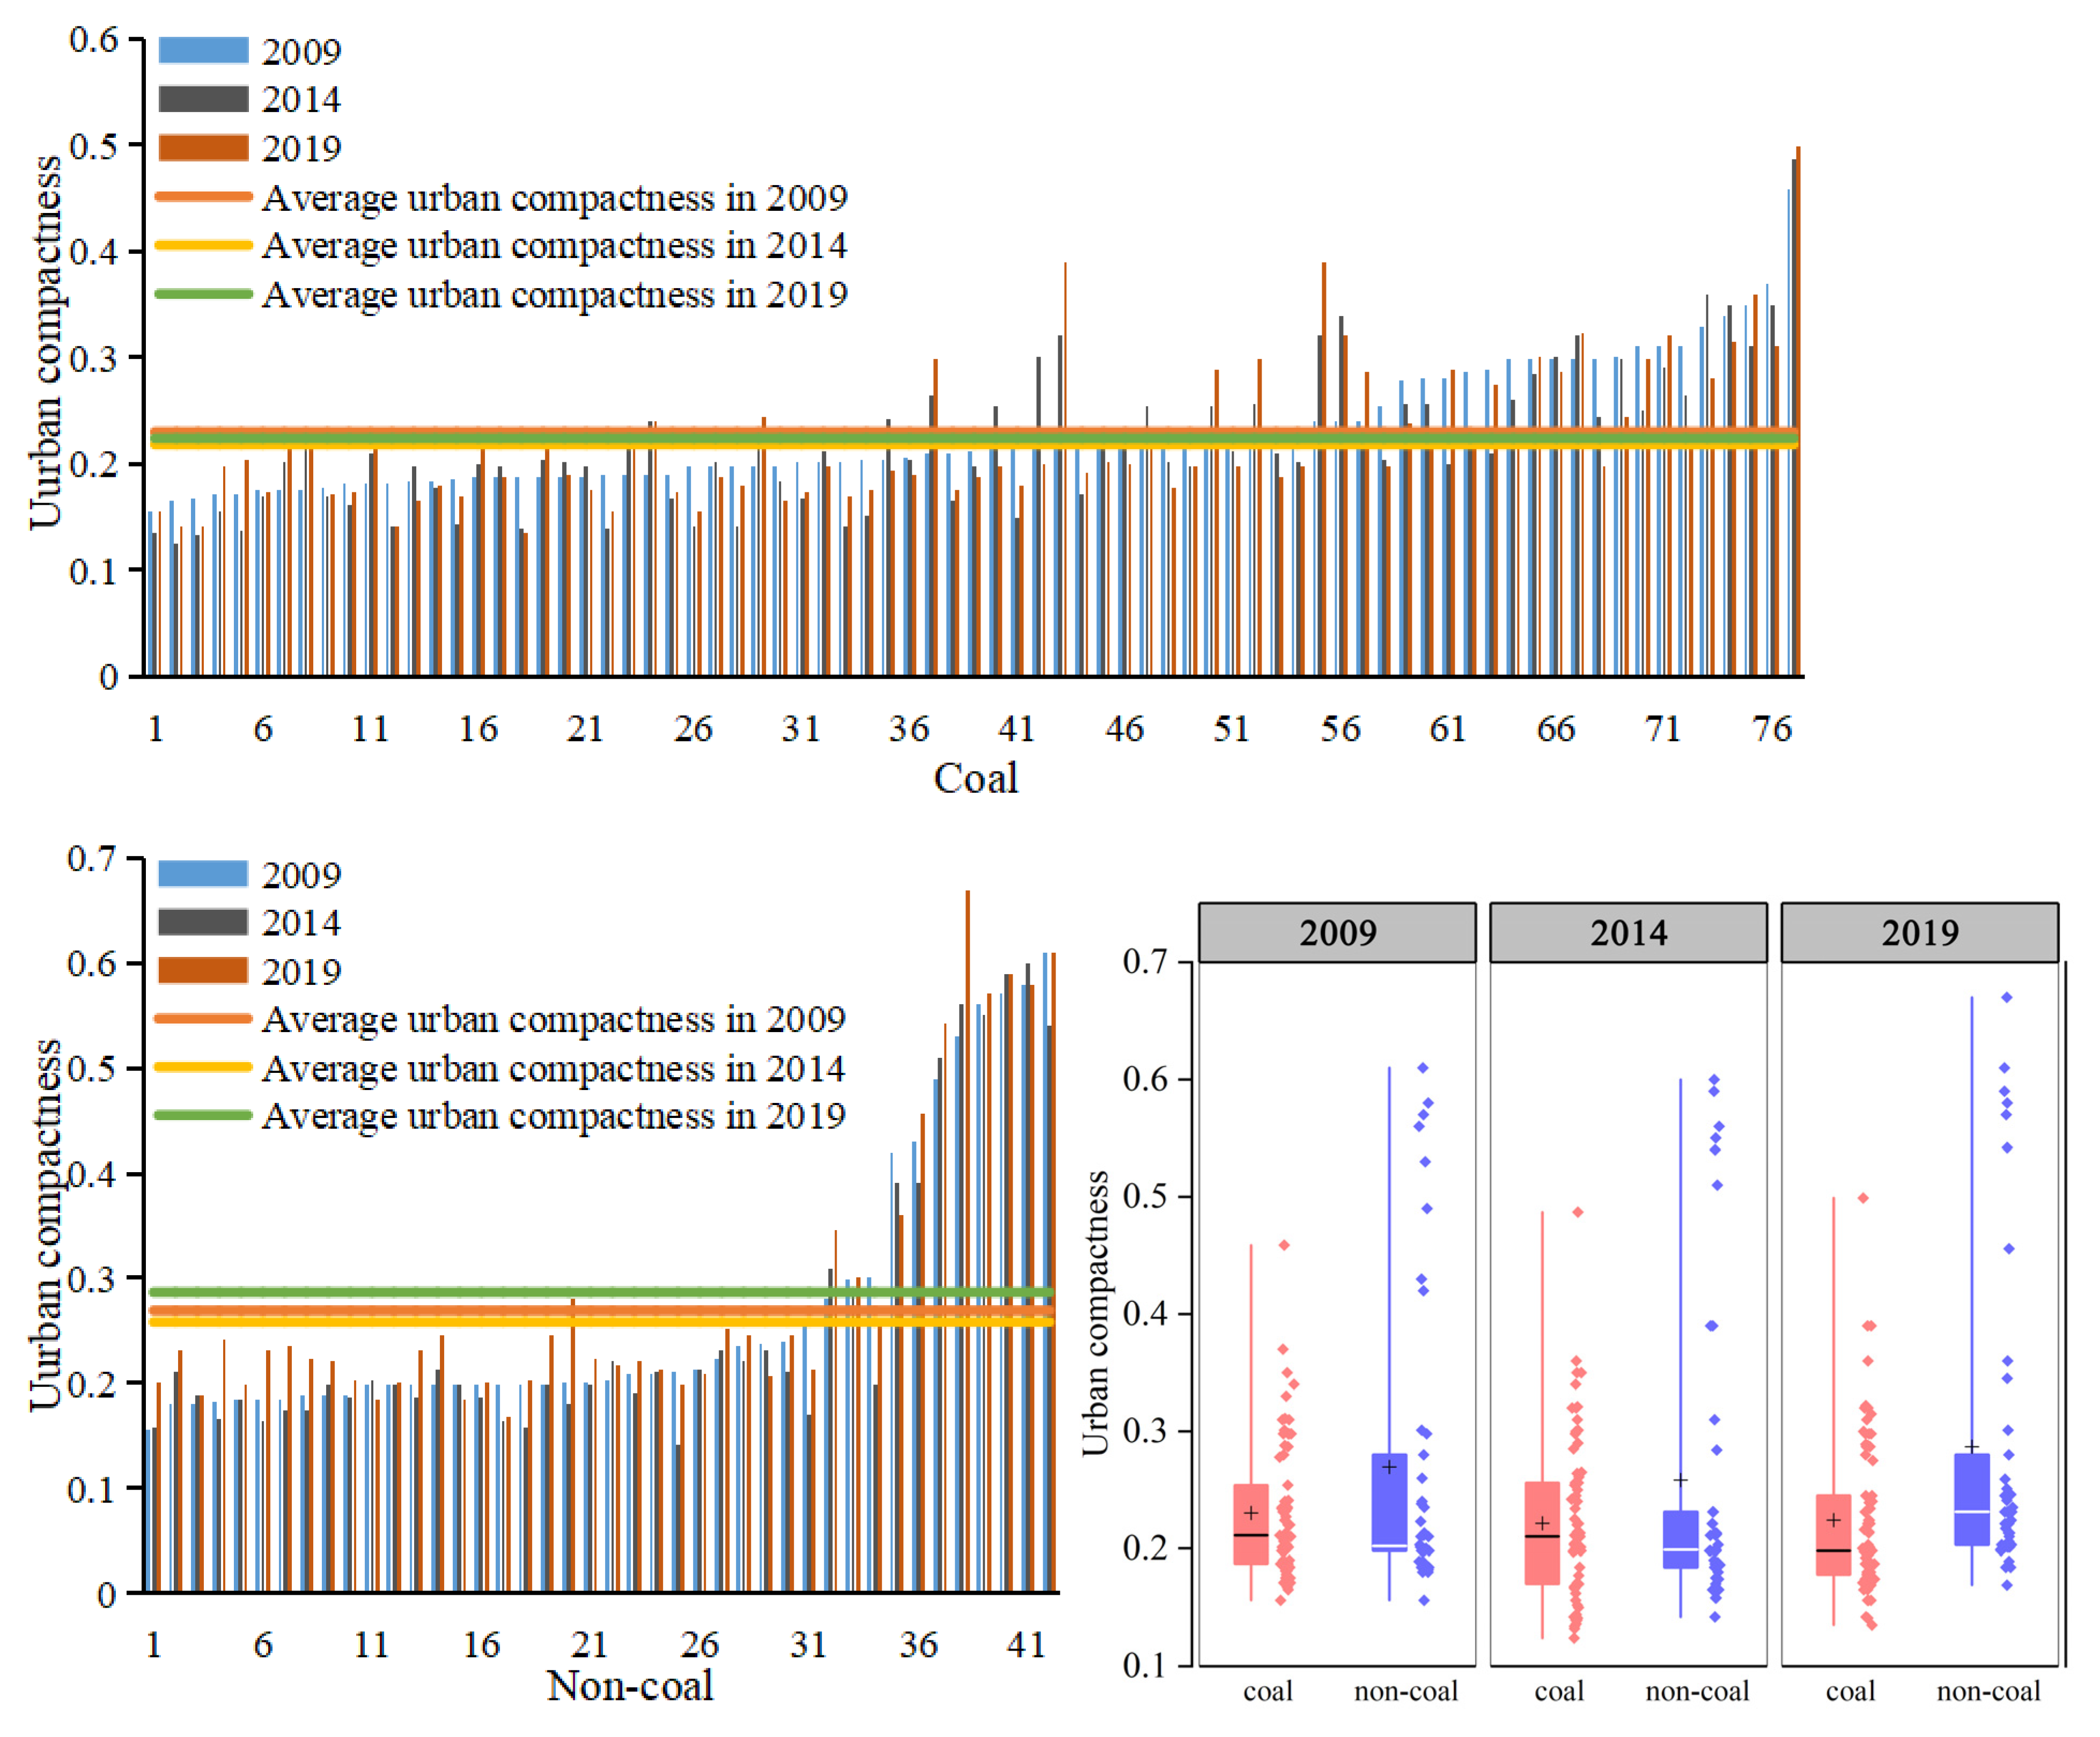
This study analyzed the evolution of urban compactness in 2009, 2014, and 2019. The results showed that the compactness of coal-resource-based cities exhibited a fluctuating downward trend. The compactness of non-coal-resource-based cities showed a slight upward trend and was generally higher than that of coal-resource-based cities (
Figure 2).
From the study, the average level of compactness of coal-resource-based cities shows a decreasing trend, with an equal distribution of compactness dynamics and a lower overall level. It declined from 0.230 in 2009 to 0.218 in 2014, and slowly increased to 0.224 in the following five years. The relatively high compactness is mainly concentrated in the Jincheng urban area (0.481), Yangquan Kuangqu (0.343), Jiaoqu (0.335), the Datong urban area (0.340), and Taiyuan and the adjacent counties and cities of Jincheng.
The areas with low compactness values are mainly concentrated within the jurisdiction of the city of Lvliang, including the cities of Zhongyang (0.143), Liulin (0.147), and Jiaokou (0.153). On the one hand, they are affected by coal mining activities, but on the other hand, due to the unique terrain and landform of the city of Lvliang, the cities within its jurisdiction are mainly distributed along the valleys in a strip-development pattern, leading to uneven distribution of urban functions, increased commuting distances, and, consequently, a relatively low intensity of urban development. This poses a challenge to the sustainable development of these areas.
Non-coal-resource-based cities show a fluctuating upward trend in their average compactness level, which is generally higher than that of coal-resource-based cities. The compactness level decreased from 0.269 in 2009 to 0.258 in 2014, and then increased to 0.288 in the following five years. The cities with relatively high compactness levels are mainly concentrated in the central urban areas of cities, such as Taiyuan (0.586), Changzhi (0.425), and Yangquan (0.390). The cities with the lowest compactness values are Wuzhai County (0.177), Fanshi County (0.185), and Jixian (0.193). As seen in
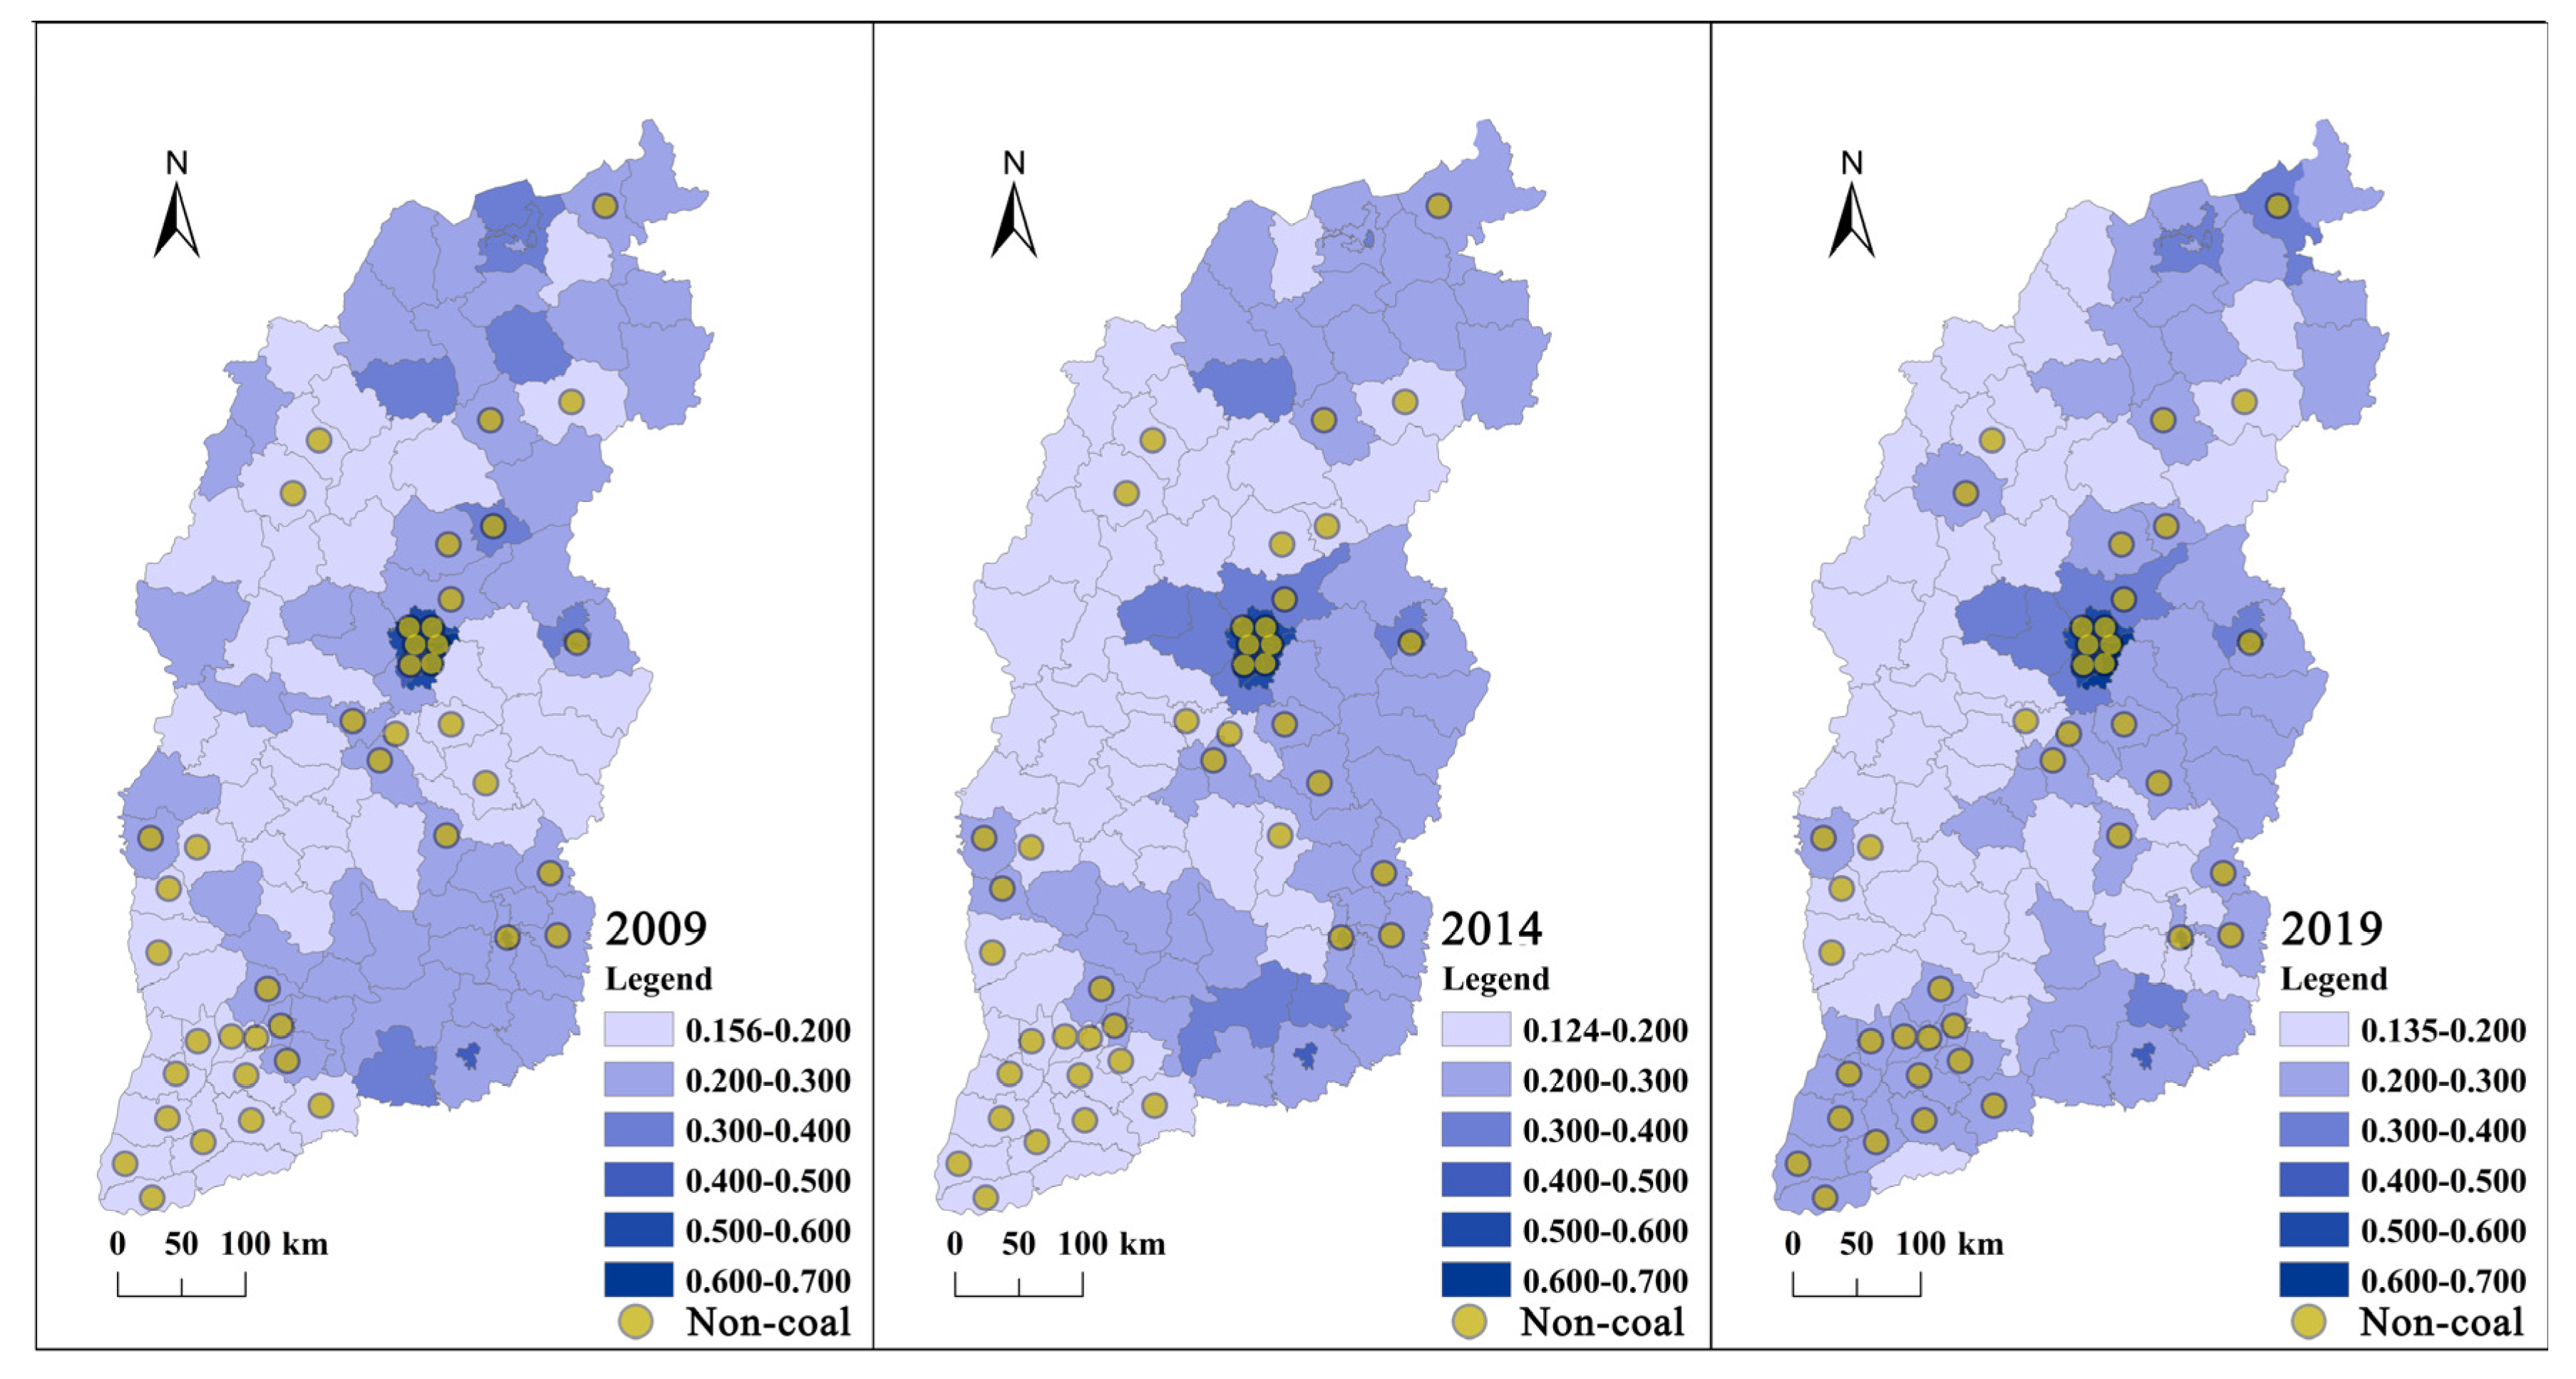
Figure 3, there is a significant gap between the central urban areas and the counties, one which is widening gradually. The compactness levels of most counties in Shanxi Province are in a relatively low range.
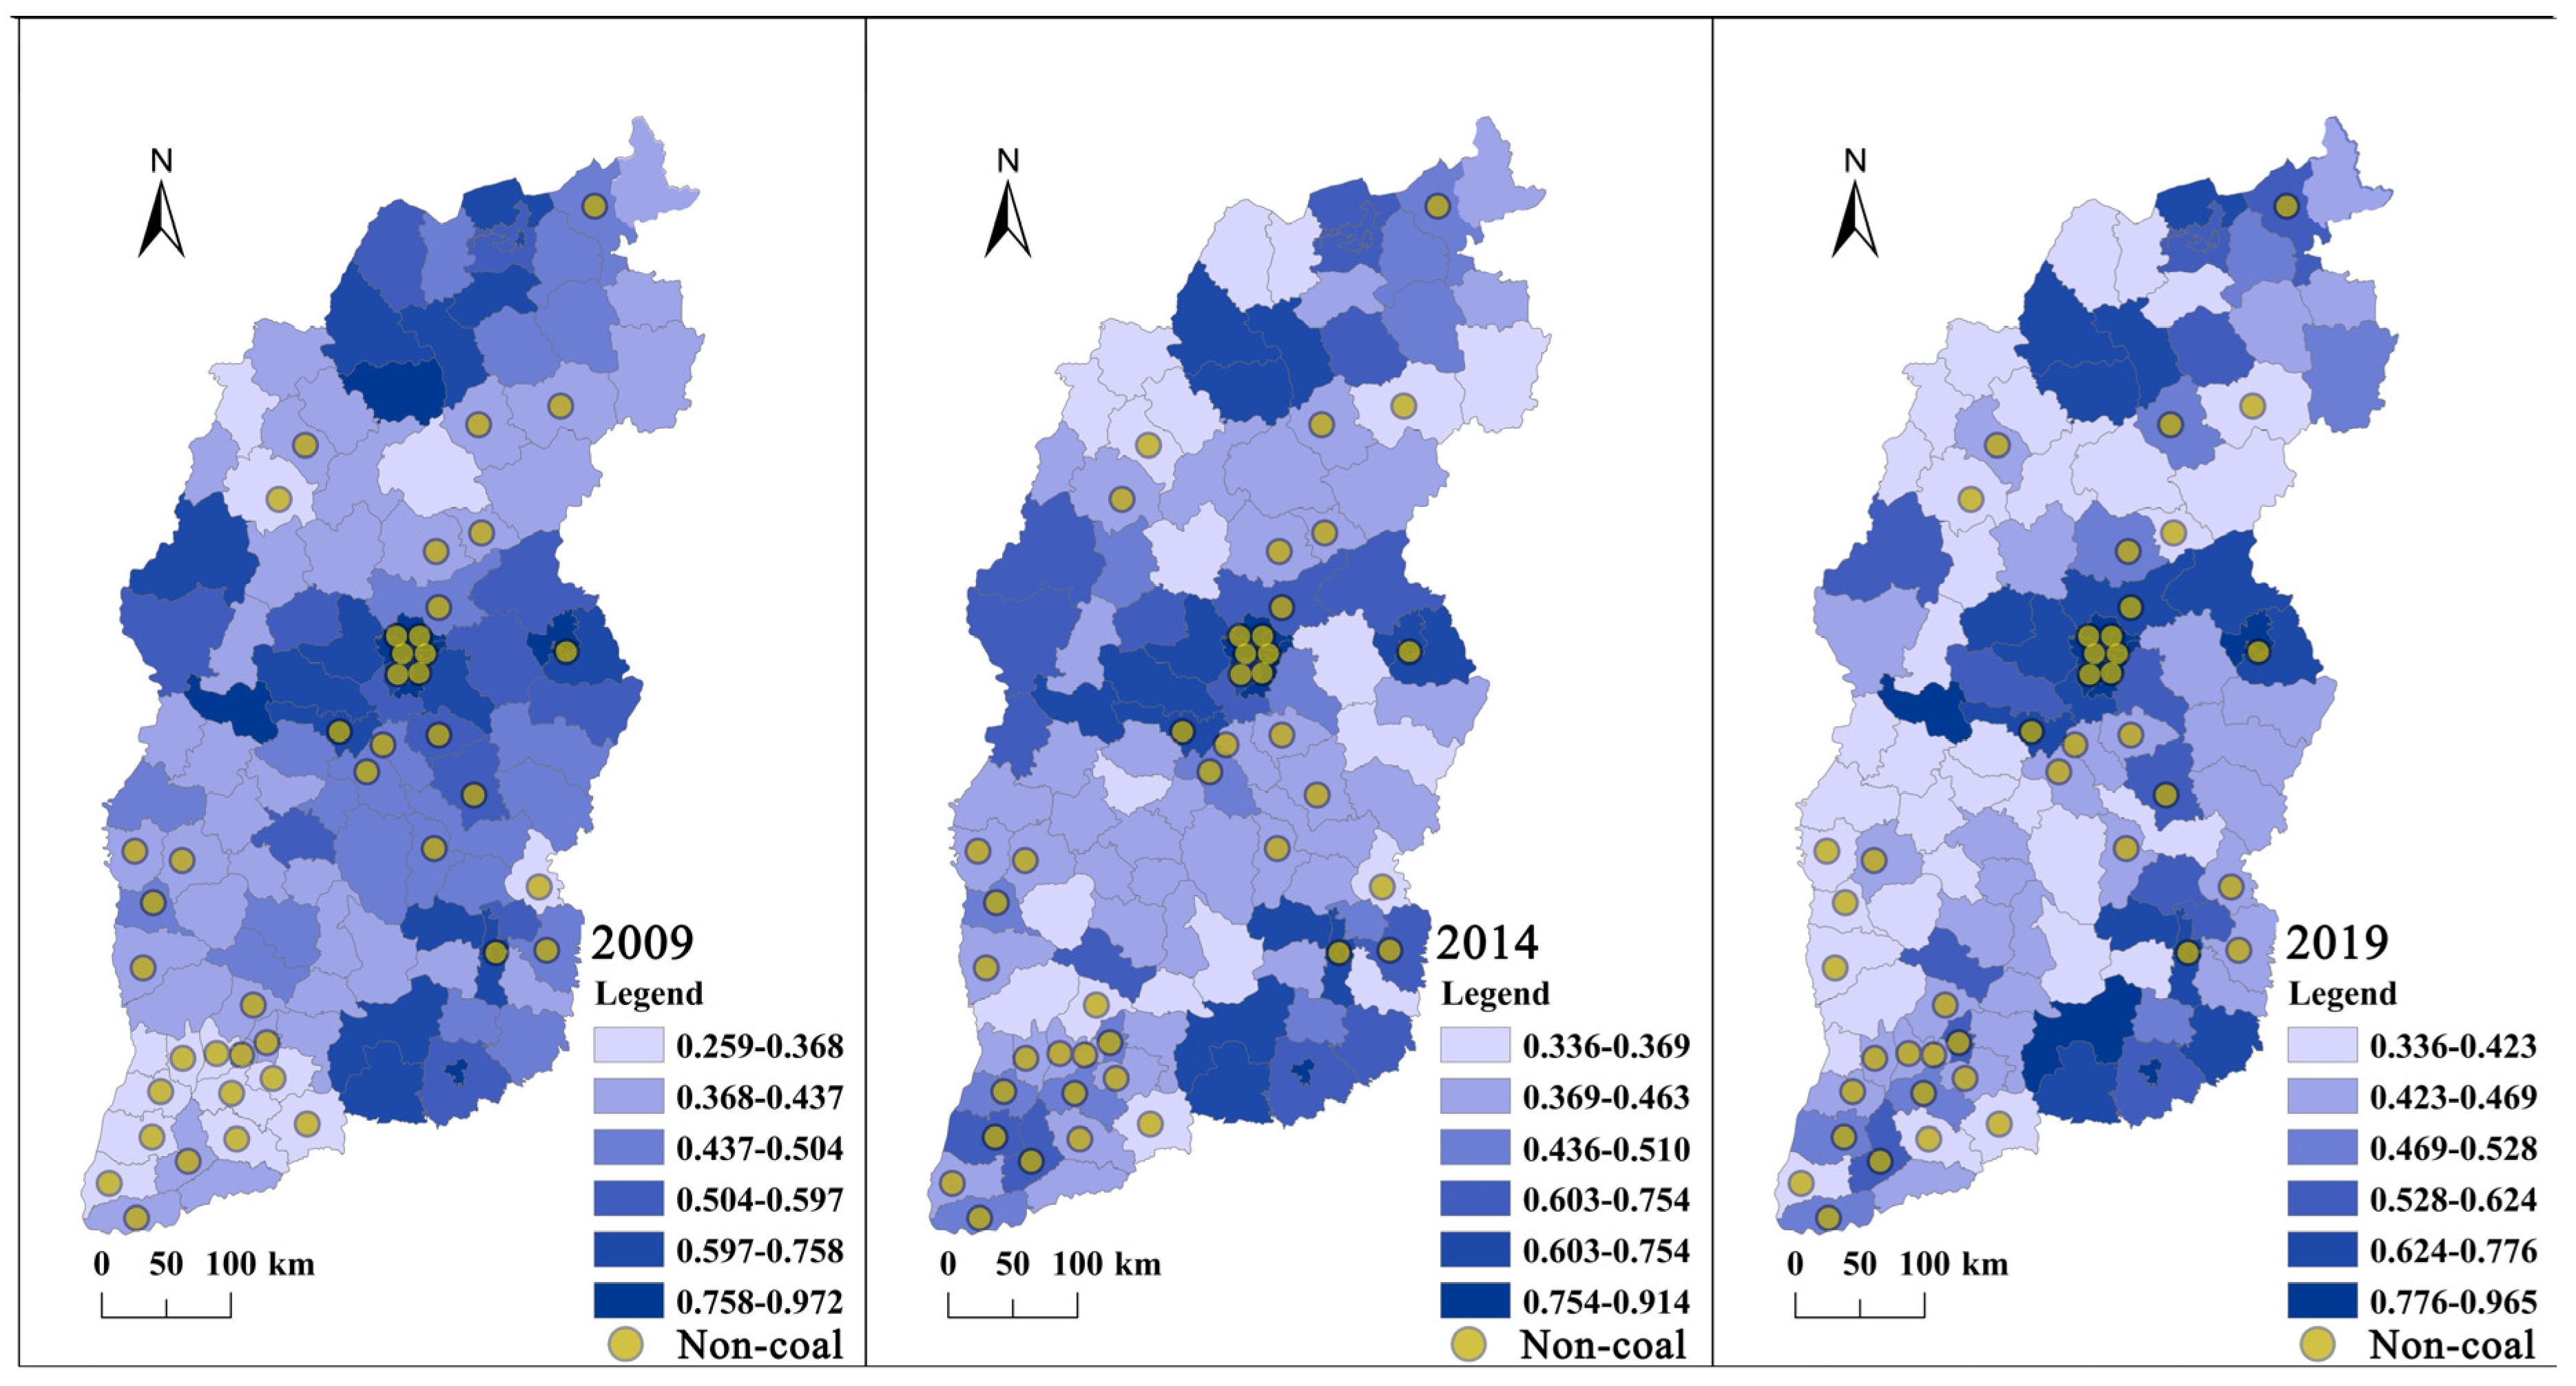
Figure 3 illustrates the spatial pattern of urban compactness in Shanxi Province in 2000, 2014, and 2019. At the three time points, the high compactness values exhibited a dispersed development state in the north, central, and southern regions, with low values clustering in the intermediate zones. In 2009, except for the urban areas of Taiyuan and Yangquan, the compactness of the entire province showed a distribution of high values around the periphery and low values in the middle, and the spatial distribution of low values had a certain coincidence with the distribution of coal resources and mountainous areas in Shanxi Province. By 2014 and 2019, the distribution of low compactness values began to shift westward, mainly along the Yellow River, and this trend became more pronounced by 2019. The gap between high and low compactness values gradually widened at the three time points, and the compactness of non-coal-resource cities gradually increased. In contrast, the compactness of coal-resource cities slowly decreased, especially in the cities along the east bank of the Yellow River.
4.2. Analysis of Spatio-Temporal Changes of Land-Use Efficiency
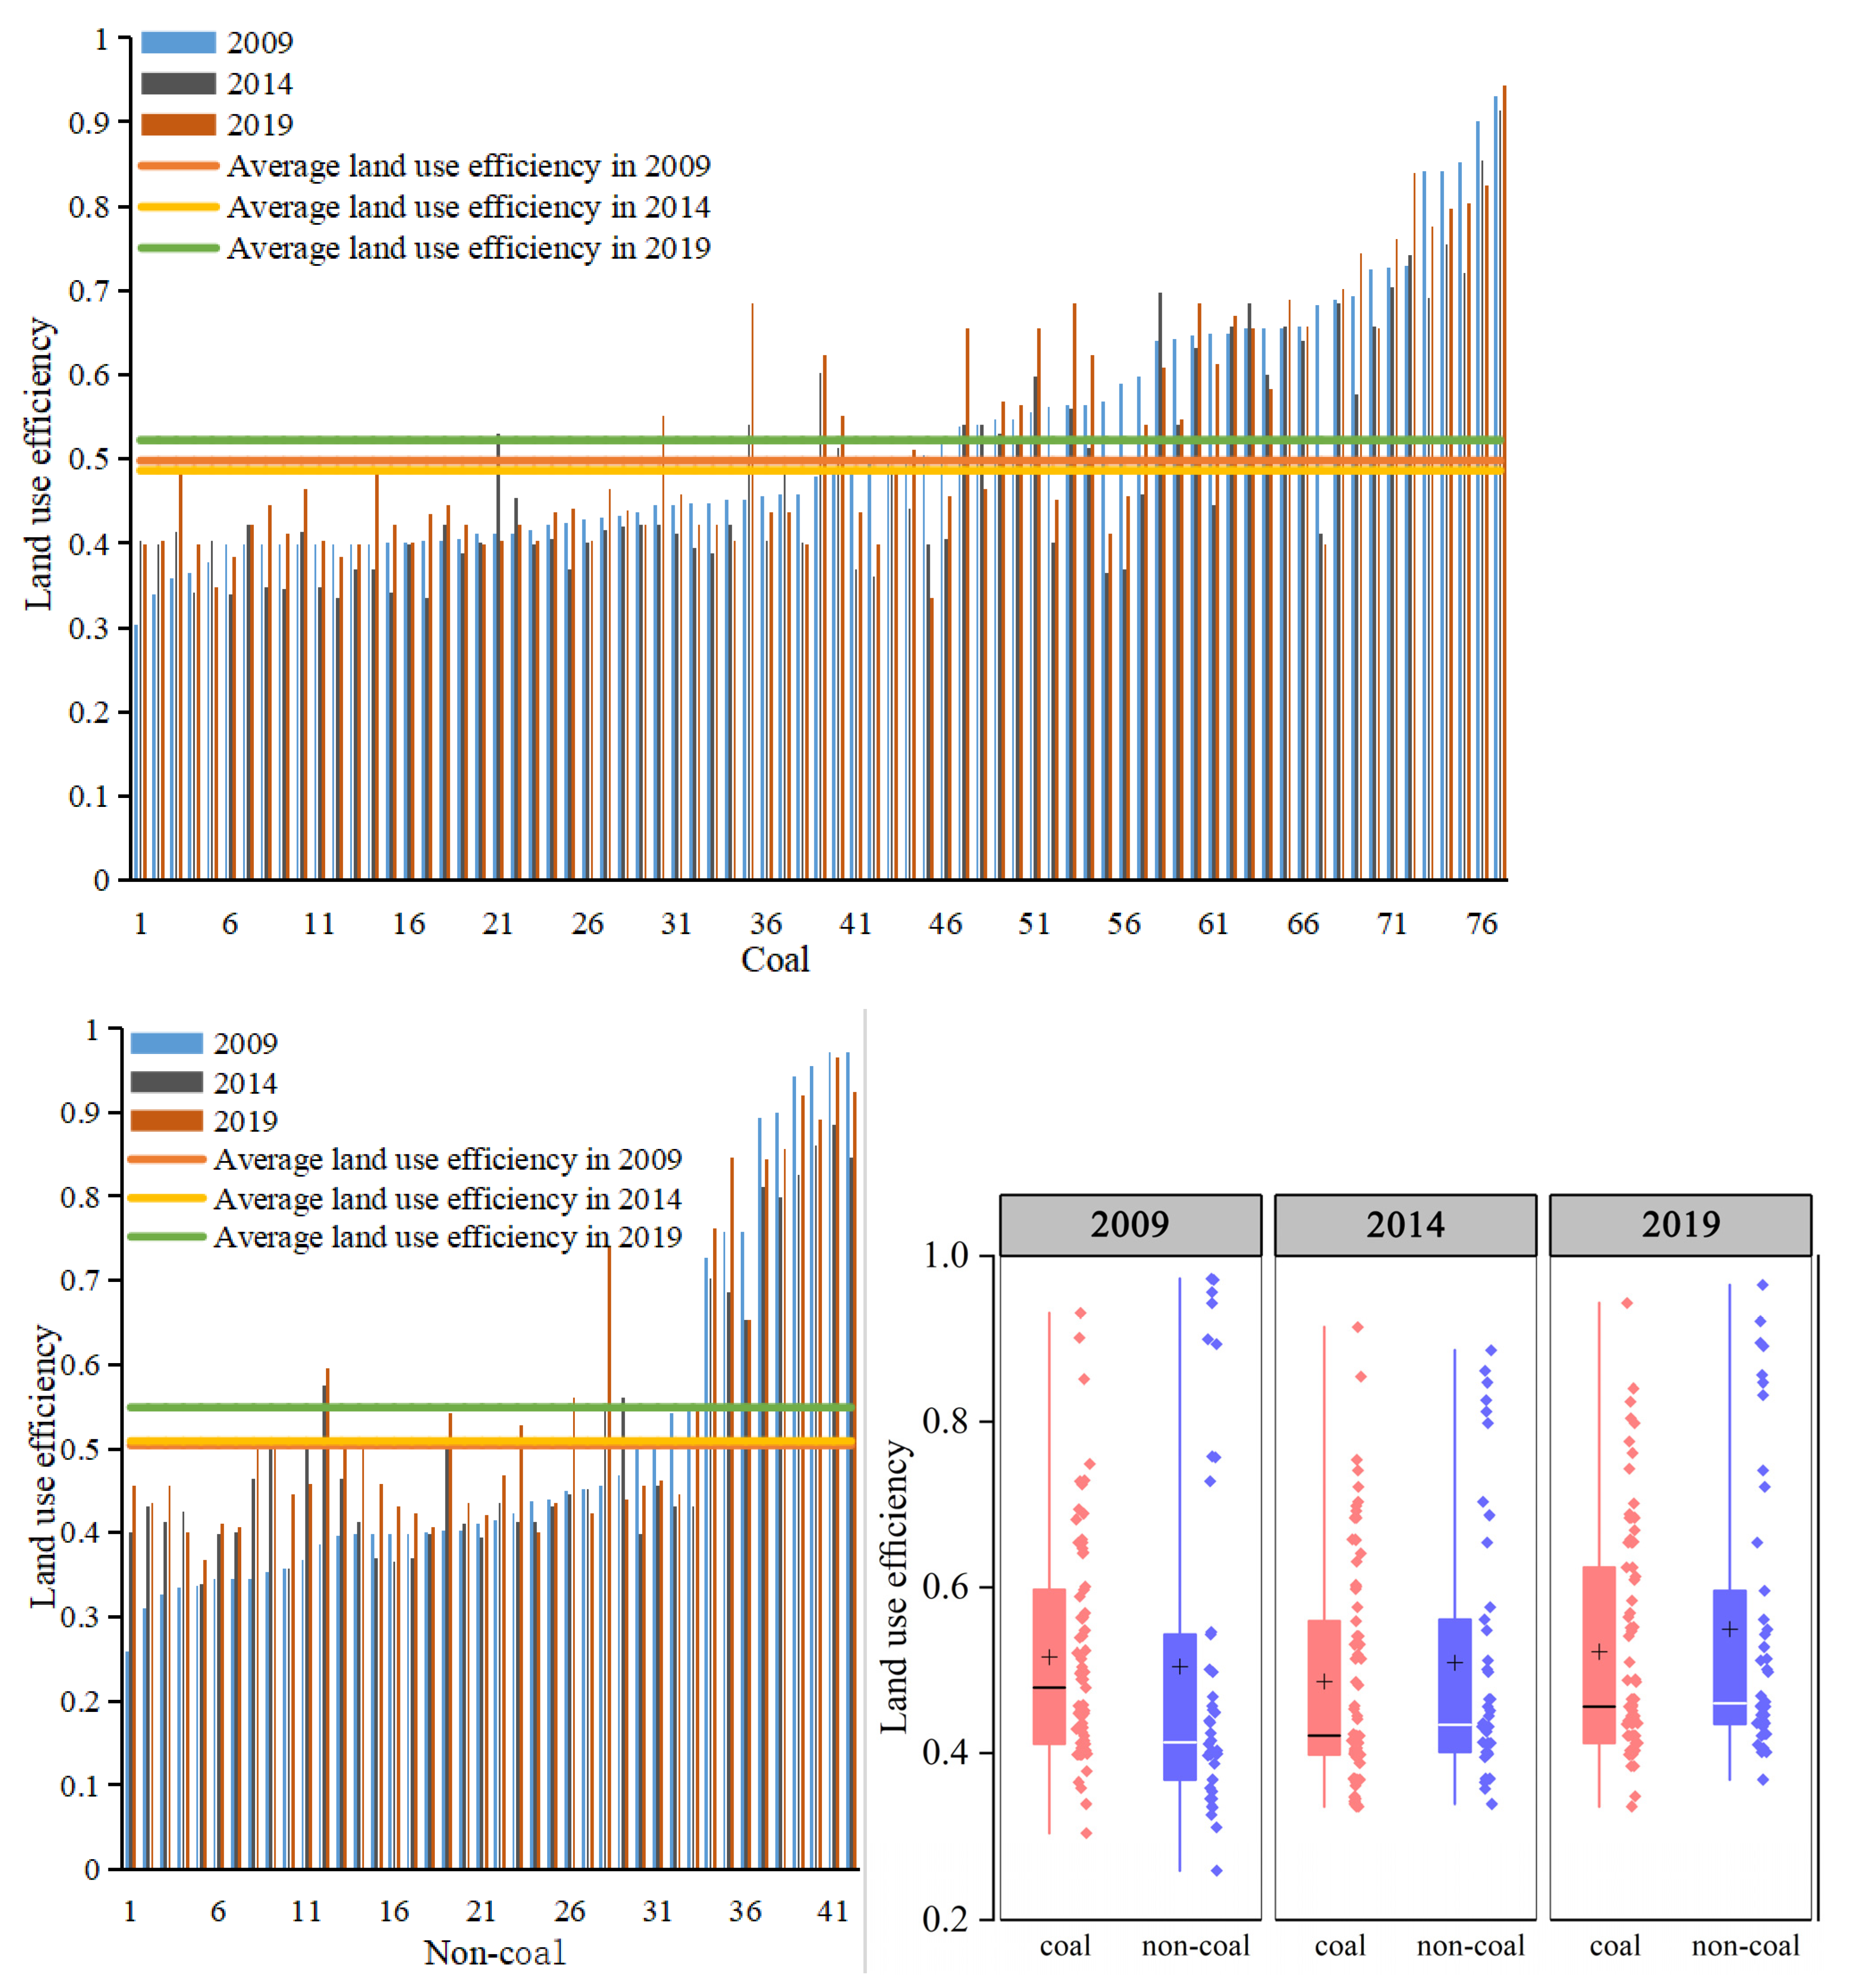
Figure 4 depicts the evolution of land-use efficiency in 77 coal resource cities and 42 non-coal resource cities in Shanxi Province in 2009, 2014, and 2019. The results indicate that the land-use efficiency of both coal resource cities and non-coal resource cities showed a gradual improvement trend, but the overall level was relatively low.
The average level of land-use efficiency in coal resource cities showed a fluctuating upward trend, declining from 0.498 in 2009 to 0.486 in 2014, and gradually increasing to 0.522 over the following five years. Among them, cities with relatively high land-use efficiency were mainly concentrated in the Jincheng urban area (0.929), Yangquan Kuangqu (0.859), and the Lvliang Lishi district (0.792). Throughout the period of 2009–2019, the number of cities with a land-use efficiency higher than 0.6 increased annually, and by 2019, this number had reached 22, representing nearly 30% of the total cities in the study. This is due to the practical achievements of the cities’ strengthened planning of existing land use and ecological restoration of national land and space.
The average level of land-use efficiency in non-coal-resource-based cities has steadily increased from 0.504 in 2009 to 0.549 in 2019. The higher compactness is mainly concentrated in the main urban areas of cities such as Taiyuan (0.940), Yangquan (0.902), and Changzhi (0.731). The cities with the lowest compactness values include Jiaoxian in Yuncheng (0.372), Yuanqu (0.347), Kelan (0.384), and Wuzhai (0.398) in Xinzhou. There is a two-tiered differentiation in the high and low values of land-use efficiency in non-coal-resource-based cities, but this phenomenon is gradually decreasing. Despite the gradual improvement in land-use efficiency in coal-resource-based cities, their overall level is still lower than that of non-coal-resource-based cities. The structure of mining land and the cost of funds and time for restoration and governance of coal mining activities have affected the improvement of land-use efficiency in coal-resource-based cities.
Figure 5 illustrates the spatial evolution of land-use efficiency in Shanxi Province in the years 2000, 2014, and 2019, At each of the three time points, the high values of land-use efficiency were dispersed in a north–south pattern, with the major concentrations located within the urban areas of Datong, Shuozhou, Taiyuan, Lvliang, Yangquan, and Jincheng. In 2009, apart from the above-mentioned high-value regions, the development of other cities was relatively coordinated, with low-value areas mainly concentrated in the southwest of Shanxi Province, particularly in the counties and cities of Yuncheng and Linfen. In 2014, the overall land-use efficiency of the province decreased slightly, and high and low values showed a trend of polarization. The spatial pattern of high-value areas remained north–south, while low-value areas gradually shifted upwards from the southwest and concentrated within the counties and cities of Linfen and Xinzhou.
In 2019, the overall land-use efficiency of the province improved, but the trend of polarization between high and low values was strengthened. Low-value areas extended from the southwest clustering in 2009–2014 to the northwest, showing a trend of lower values in the west and higher values in the east, with low-value areas mainly concentrated along the Yellow River. From the perspective of mineral resources and coal mine distribution, the low-value areas were mainly concentrated in the Hedong coalfield, Ningwu coalfield, and Huoxi coalfield regions, where the development of mining has led to the extensive expansion of urban land and the emergence of various types of adverse land use. Meanwhile, the complex terrain of the Lvliang Mountains has also limited the efficient development and utilization of land.
4.3. Analysis of Coupling-Coordination Degree
4.3.1. Coupling-Coordination Degree of Urban Compactness and Land-Use Efficiency
The results show that the coupling-coordination relationship between UC and ULUE in Shanxi Province has remained stable. From the average CCD results of the entire province, it decreased from 0.52 in 2009 to 0.51 in 2014, and then increased to 0.53 in the following five years, indicating a primary coupling-coordination relationship throughout the province. However, a closer look reveals that the CCD of coal-resource-based cities decreased from 5.155 in 2009 to 4.896 in 2019. The proportion of cities with a CCD lower than 4 reached 30%, with an abrupt increase in the number of extreme-lack-of-coordination cases from 2014 to 2019. In contrast, the CCD of non-coal-resource-based cities increased from 5.166 in 2009 to 5.761 in 2019, and the proportion of cities with a CCD lower than 4 was 22% in total, with a consistently low number of extreme-lack-of-coordination cases.
Between 2014 and 2019, as the UC of coal decreased, the CCD also showed a decreasing trend, with the lowest CCD in 2019. However, this phenomenon does not appear in non-coal areas, and their CCD has improved. Therefore, it can be determined that the decline of UC will affect the positive development of CCD. In order to maintain a good coupling-coordination relationship in the whole province, it is necessary to strengthen the intensive and compact development of coal.
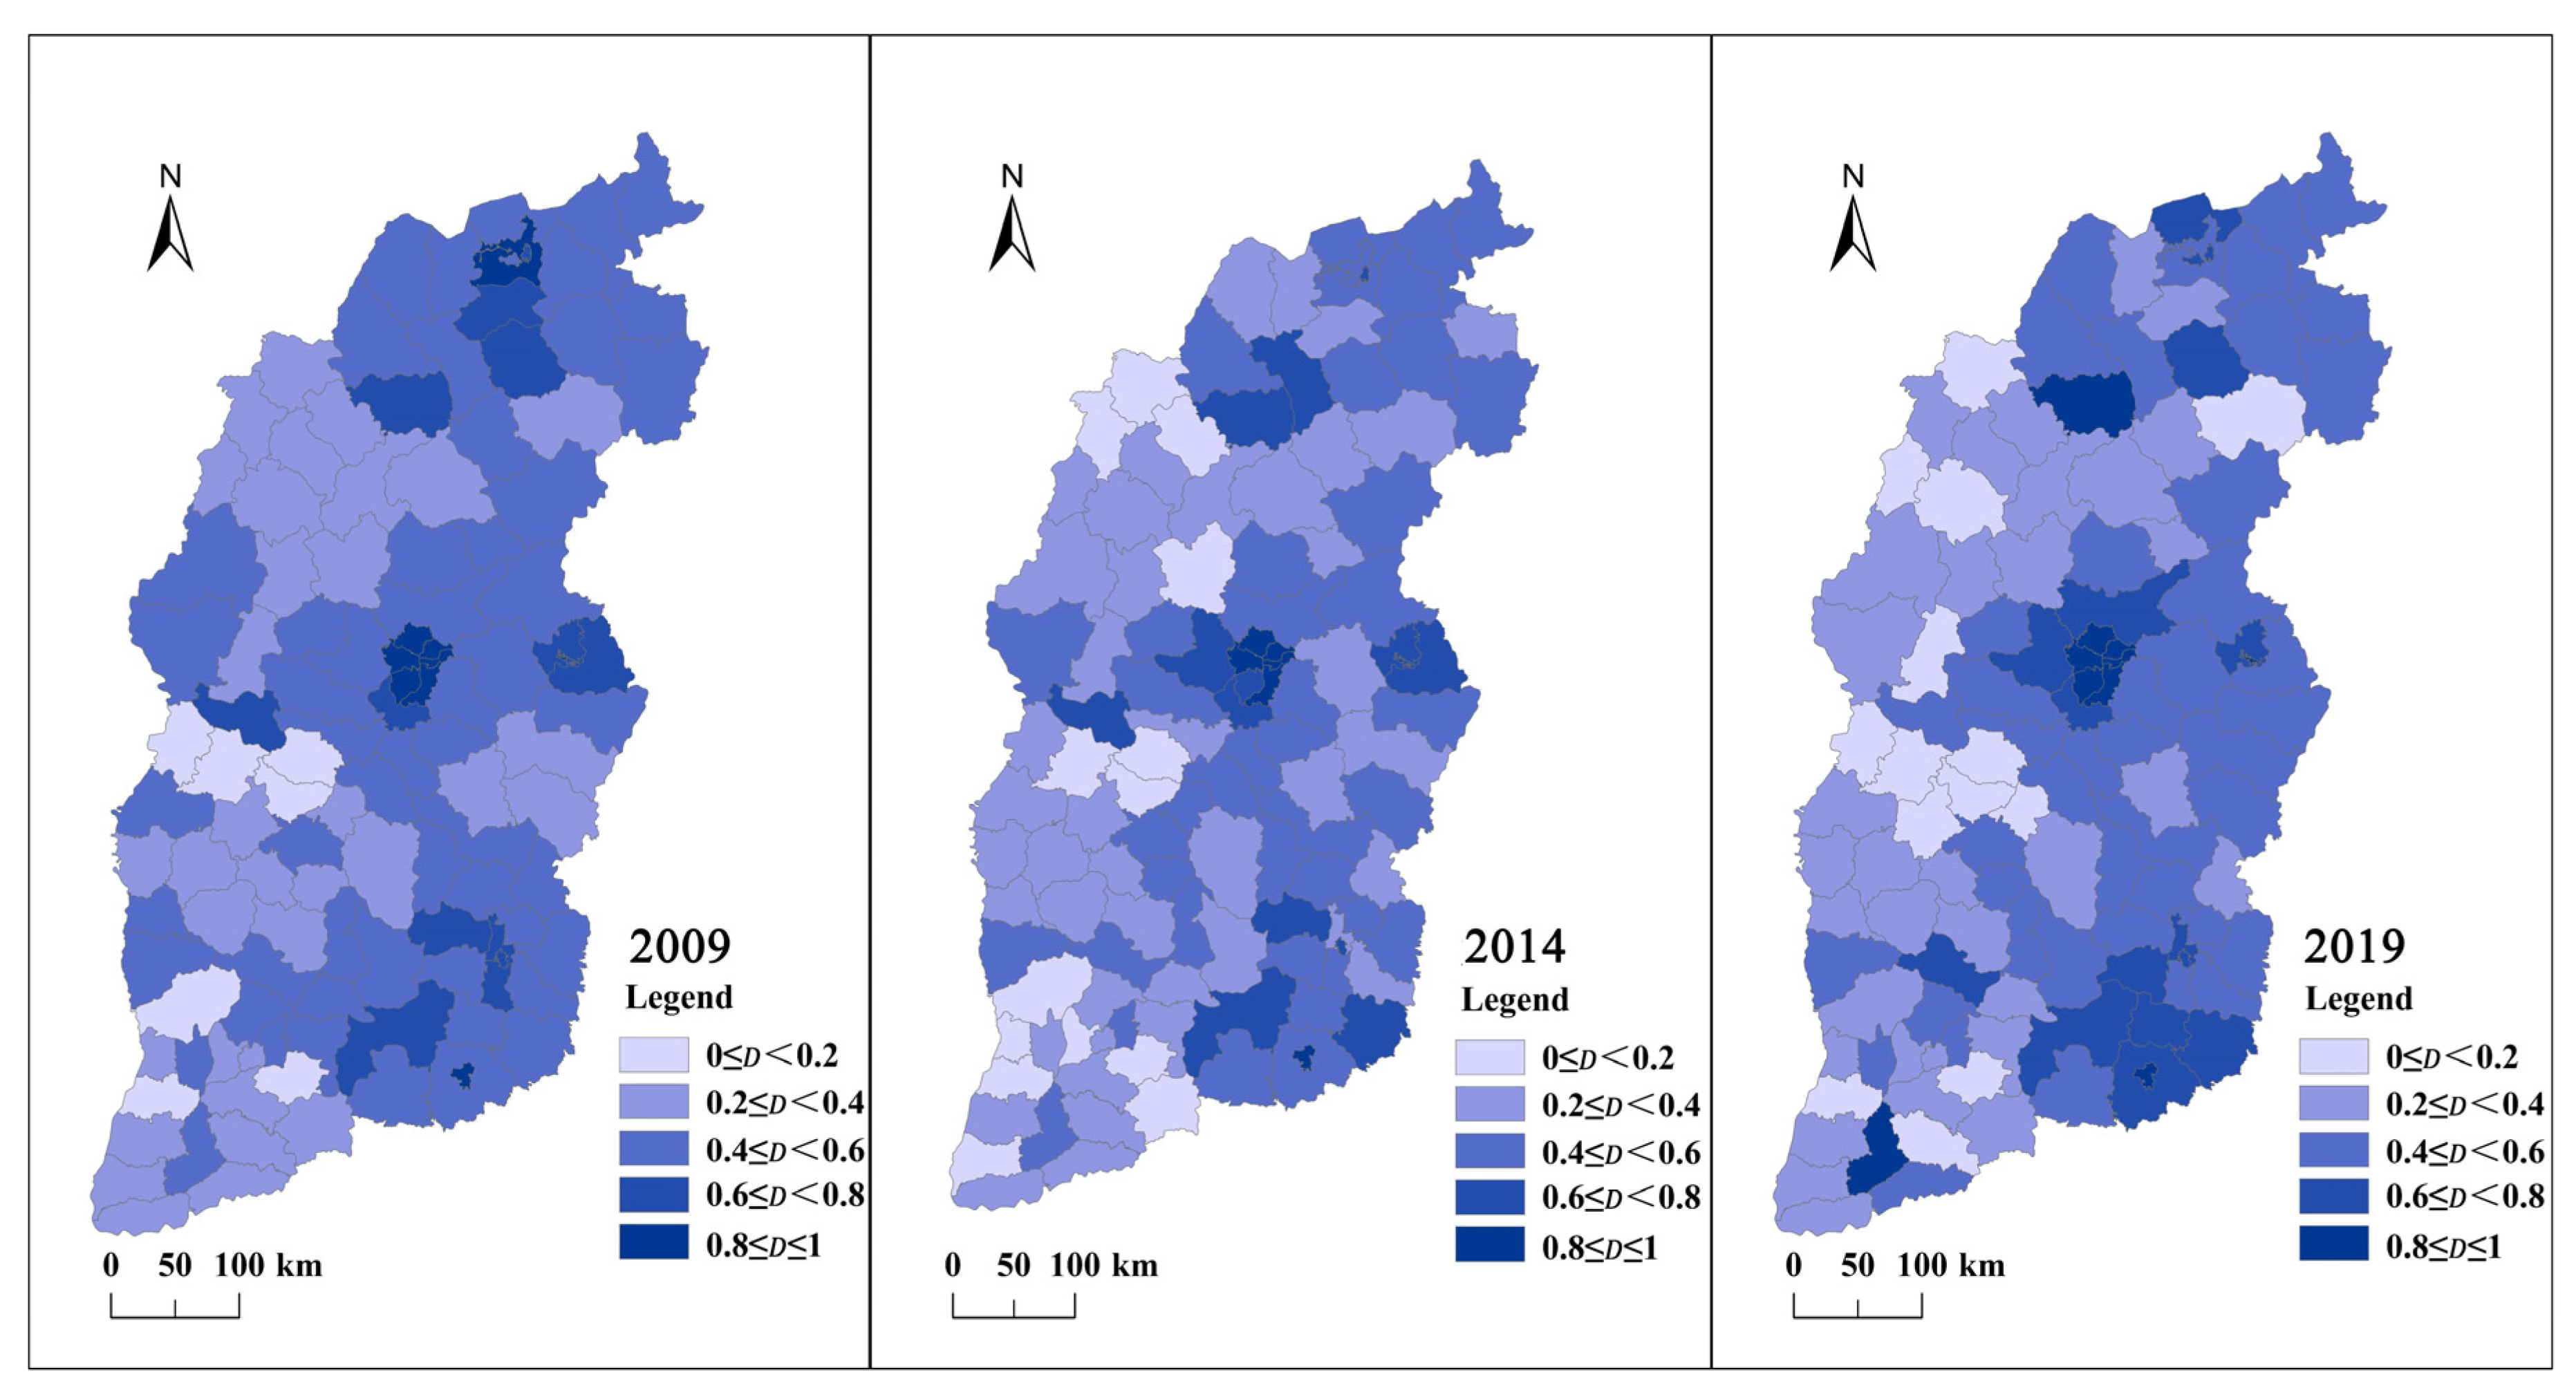
Figure 6 shows the spatial pattern evolution of CCD in Shanxi Province in 2000, 2014, and 2019. The high-value areas of CCD are consistent with UC and ULUE. In 2009, the development of CCD in the province was relatively average, and from a spatial perspective, the cities with a lack of coordination were mainly concentrated in the western part of the central region, with Shuozhou, Lvliang, and Yuncheng being the most prominent. The cities with higher coordination levels were concentrated in the urban areas of Datong, Shuozhou, Taiyuan, Yangquan, Changzhi, and Jincheng. By 2014, the number of cities with high coordination levels had decreased, while the number of cities with an extreme lack of coordination had suddenly increased, presenting a scattered and disorderly layout.
Although the overall average level of the province in 2019 showed a primary coordination state compared with the previous two years, there was an imbalance in development; that is, the proportion of quality coordination increased, and the number of cities with a lack of coordination also increased. The low-value areas were mainly concentrated along the Yellow River in the western part of Shanxi Province.
4.3.2. Coupling-Coordination Types of Urban Compactness and Land-Use Efficiency
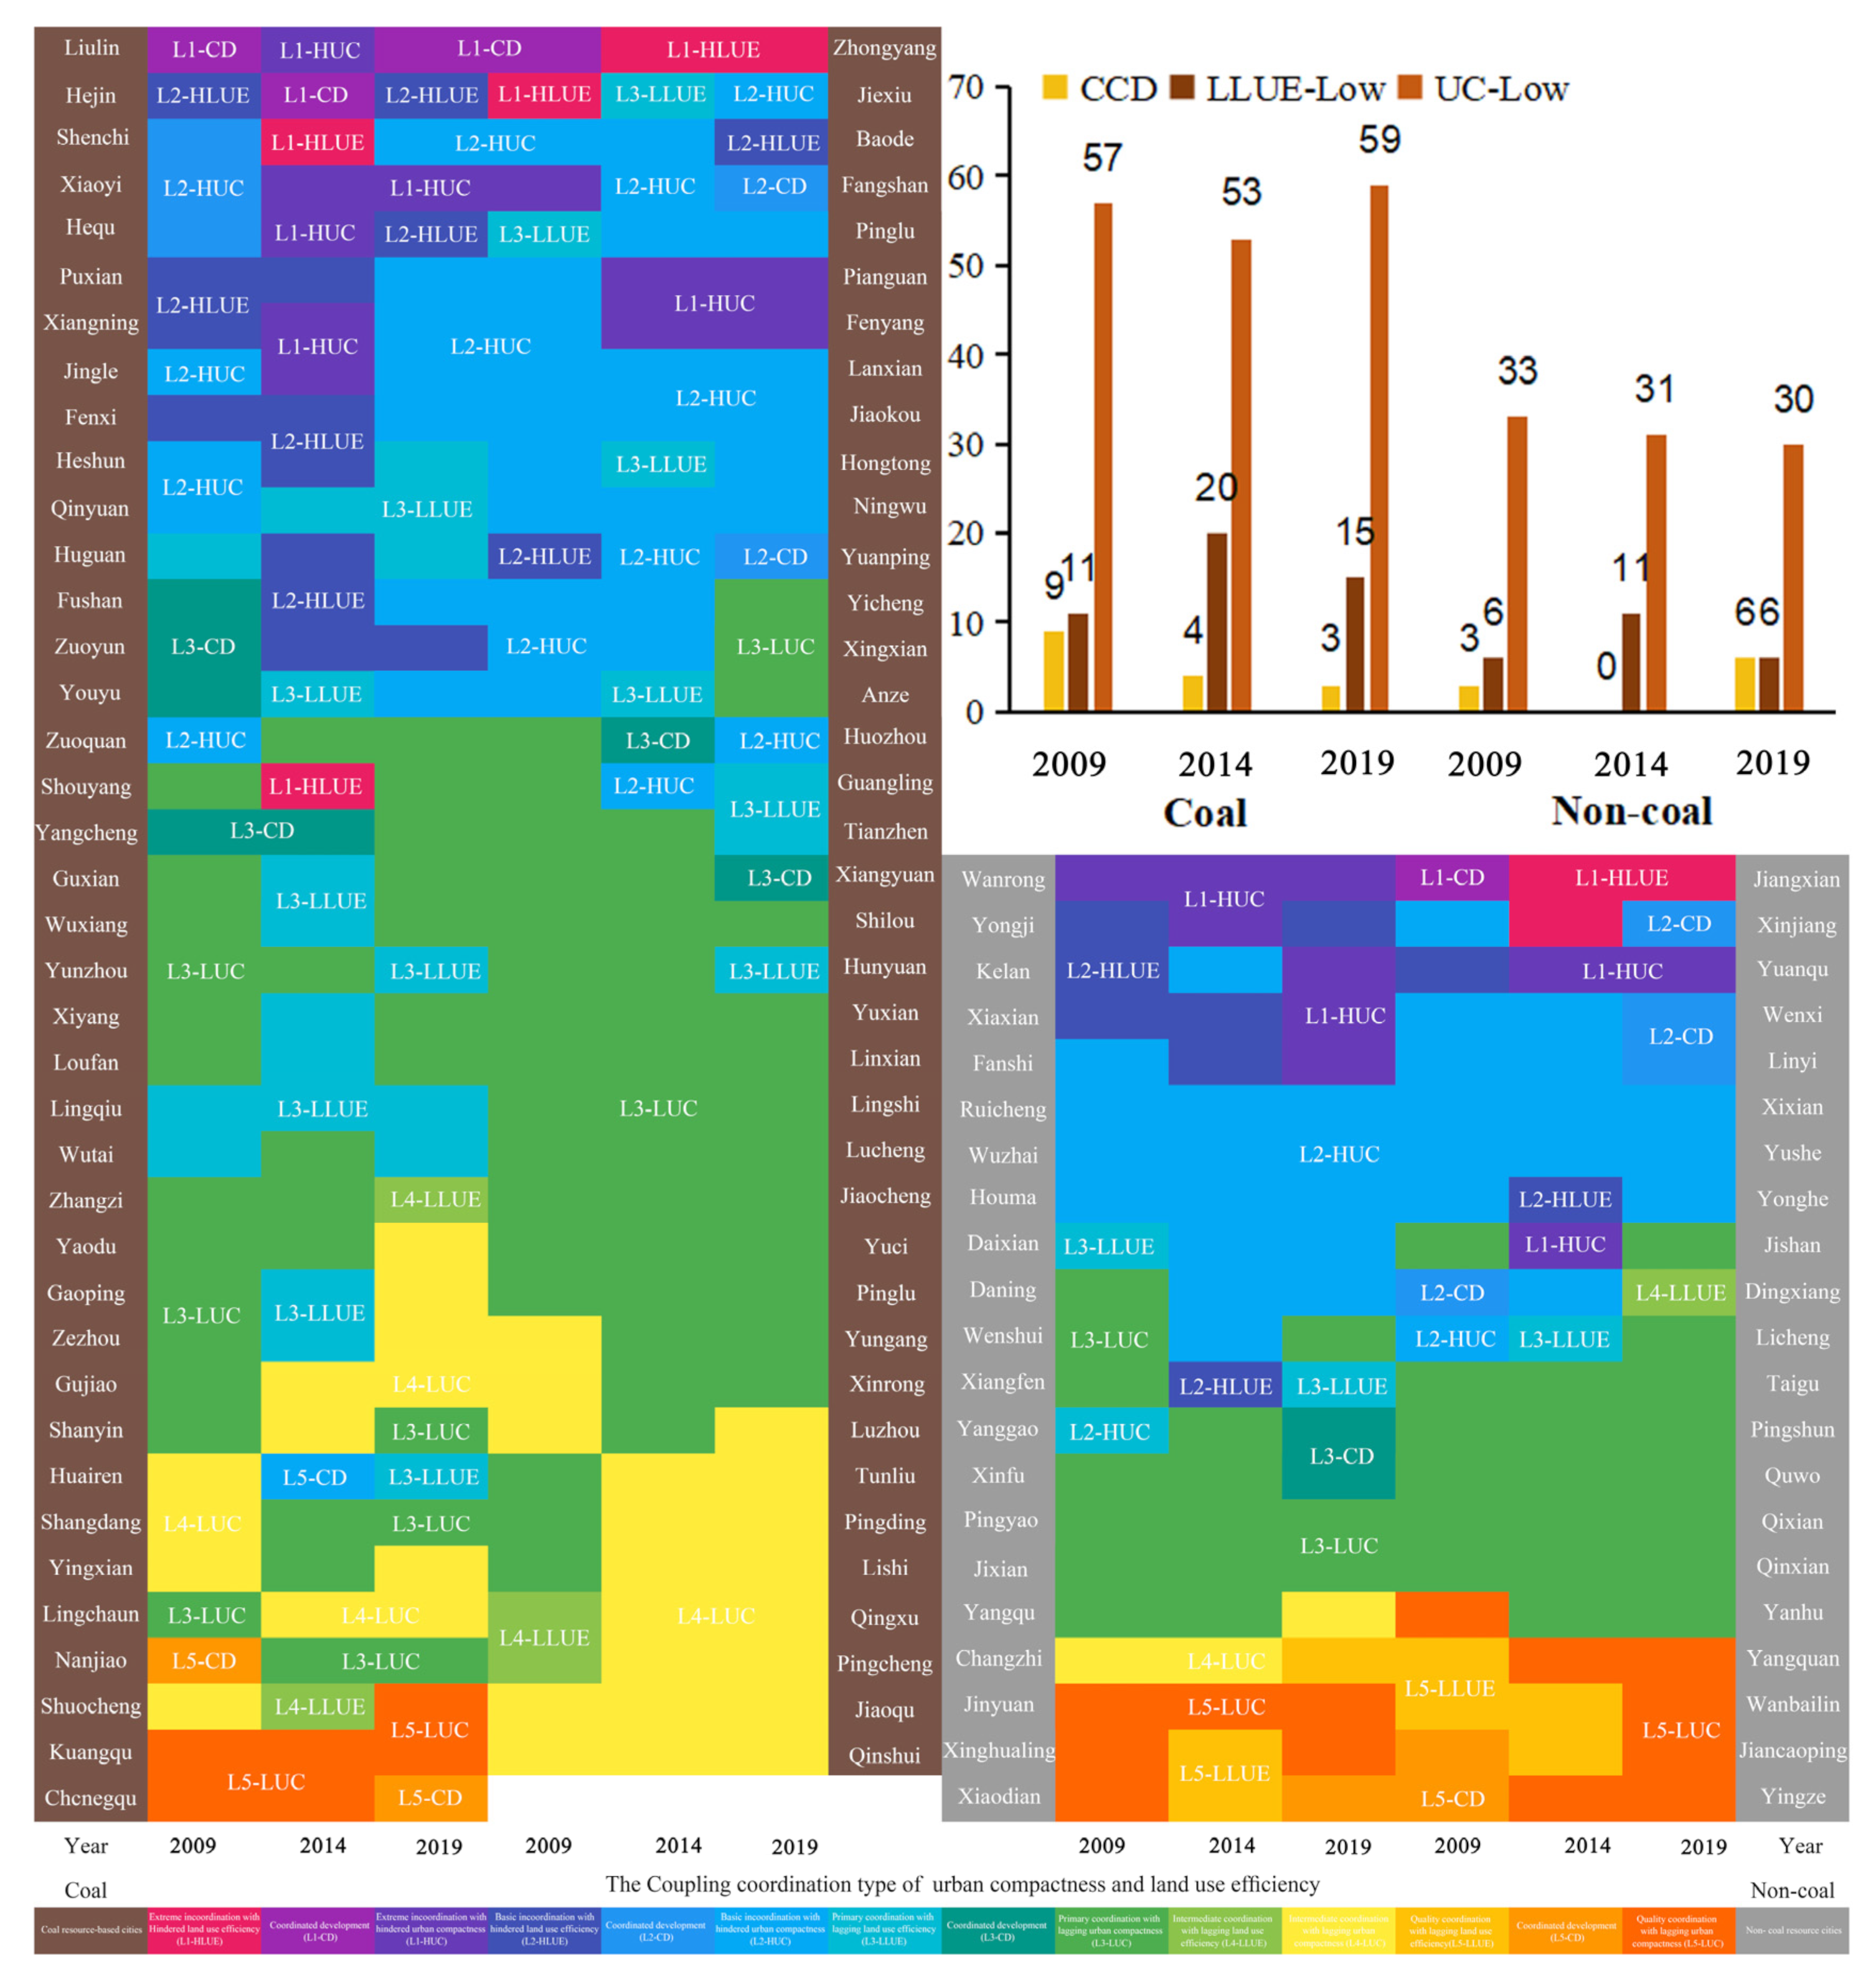
Based on the analysis of CCD changes in Shanxi Province in the previous section, further classification of the coupling-coordination types of each county in the province is carried out. As shown in
Figure 7, currently, half of the cities in Shanxi Province have entered the primary coordination state, which indicates that the relationship between UC and ULUE is becoming closer, and the development of UC is bound to promote the improvement of ULUE.
From a longitudinal perspective, the overall development of UC in coal-based cities was lagging behind from 2009 to 2019, but in 2014, ULUE was in an overall state of lagging development. From 2009 to 2019, the UC in non-coal-based cities remained at a relatively low level of development and fluctuated between different types of UC lag. From a horizontal perspective, both coal-based and non-coal-based cities mainly exhibited two types: basic lack of coordination with hindered urban compactness and primary coordination with lagging urban compactness; in terms of CCDs, in L1 and L2 coordination types, ULUE’s development lagged behind, while it was not significant in L4 and L5.
Overall, the main contradiction in the coupled and coordinated development of UC and ULUE in Shanxi Province is that UC lags behind. In recent years, Shanxi Province has vigorously carried out land spatial governance actions and taken measures such as optimizing land-use types and ecological transformation and restoration in response to a series of low-efficiency uses of land caused by mining. However, it is still necessary to strengthen the planning of intensive and compact urban land layout in the aspect of the urban spatial structure.
4.4. Hot-Spot Analysis
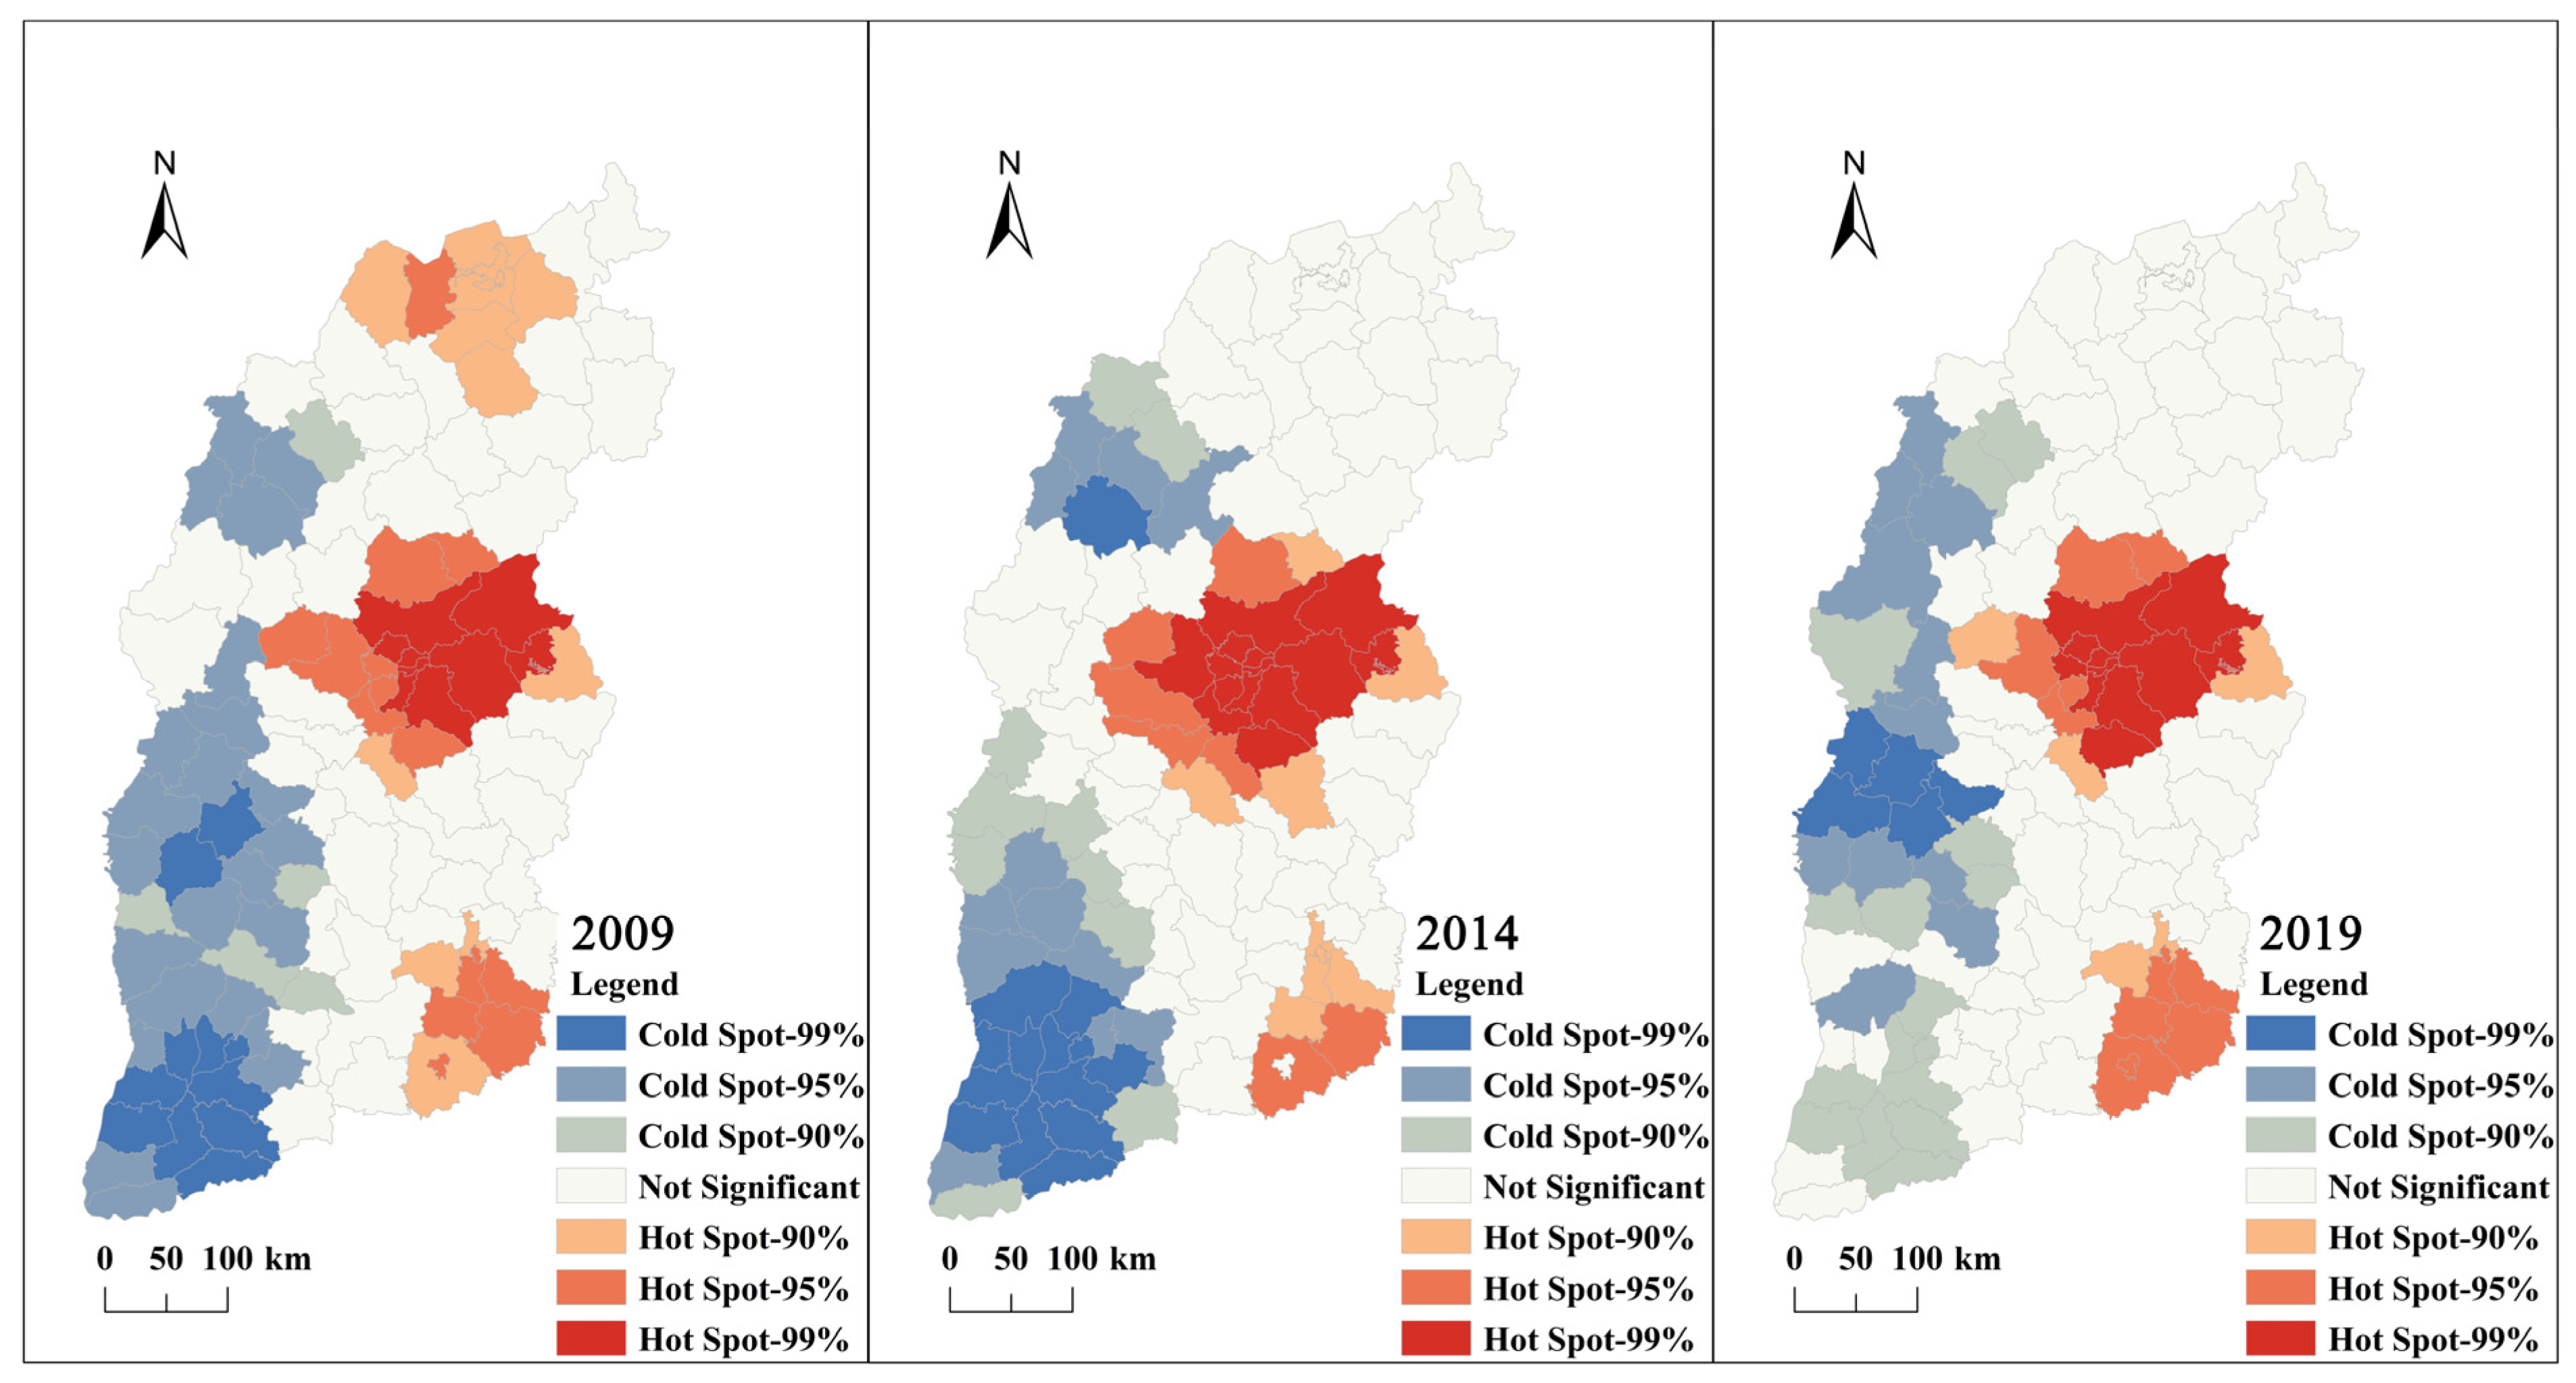
By calculating the distribution of cold and hot spots of the CCD of UC and ULUE, it can be seen from
Figure 8 that the CCD hot spots in Shanxi Province are mainly distributed in the districts and counties of cities such as Taiyuan, Yangquan, Jincheng, and Datong. The cold-spot area is concentrated east of Shanxi Province, mainly in the districts and counties of cities such as Yuncheng, Linfen, Luliang, and Xinzhou. The spatial pattern of cold and hot spots in the three years is consistent.
Specifically, in 2009, the significant area of cold and hot spots was large and distributed in a point-like manner, and most of them were more than 95% significant and distributed in the north, middle, and south. In 2014, the range of hot spots and cold spots changed significantly, the point distribution was strengthened, and the proportion of cold spots and hot spots significantly increased to 99%. That is, the polarization was strengthened. The hot spots were mainly concentrated in the city limits of Taiyuan and Yangquan, with sporadic distribution in Jincheng, and the scope was expanded. The cold spots were mainly distributed in Yuncheng, Linfen, and Shuozhou (
Figure 8).
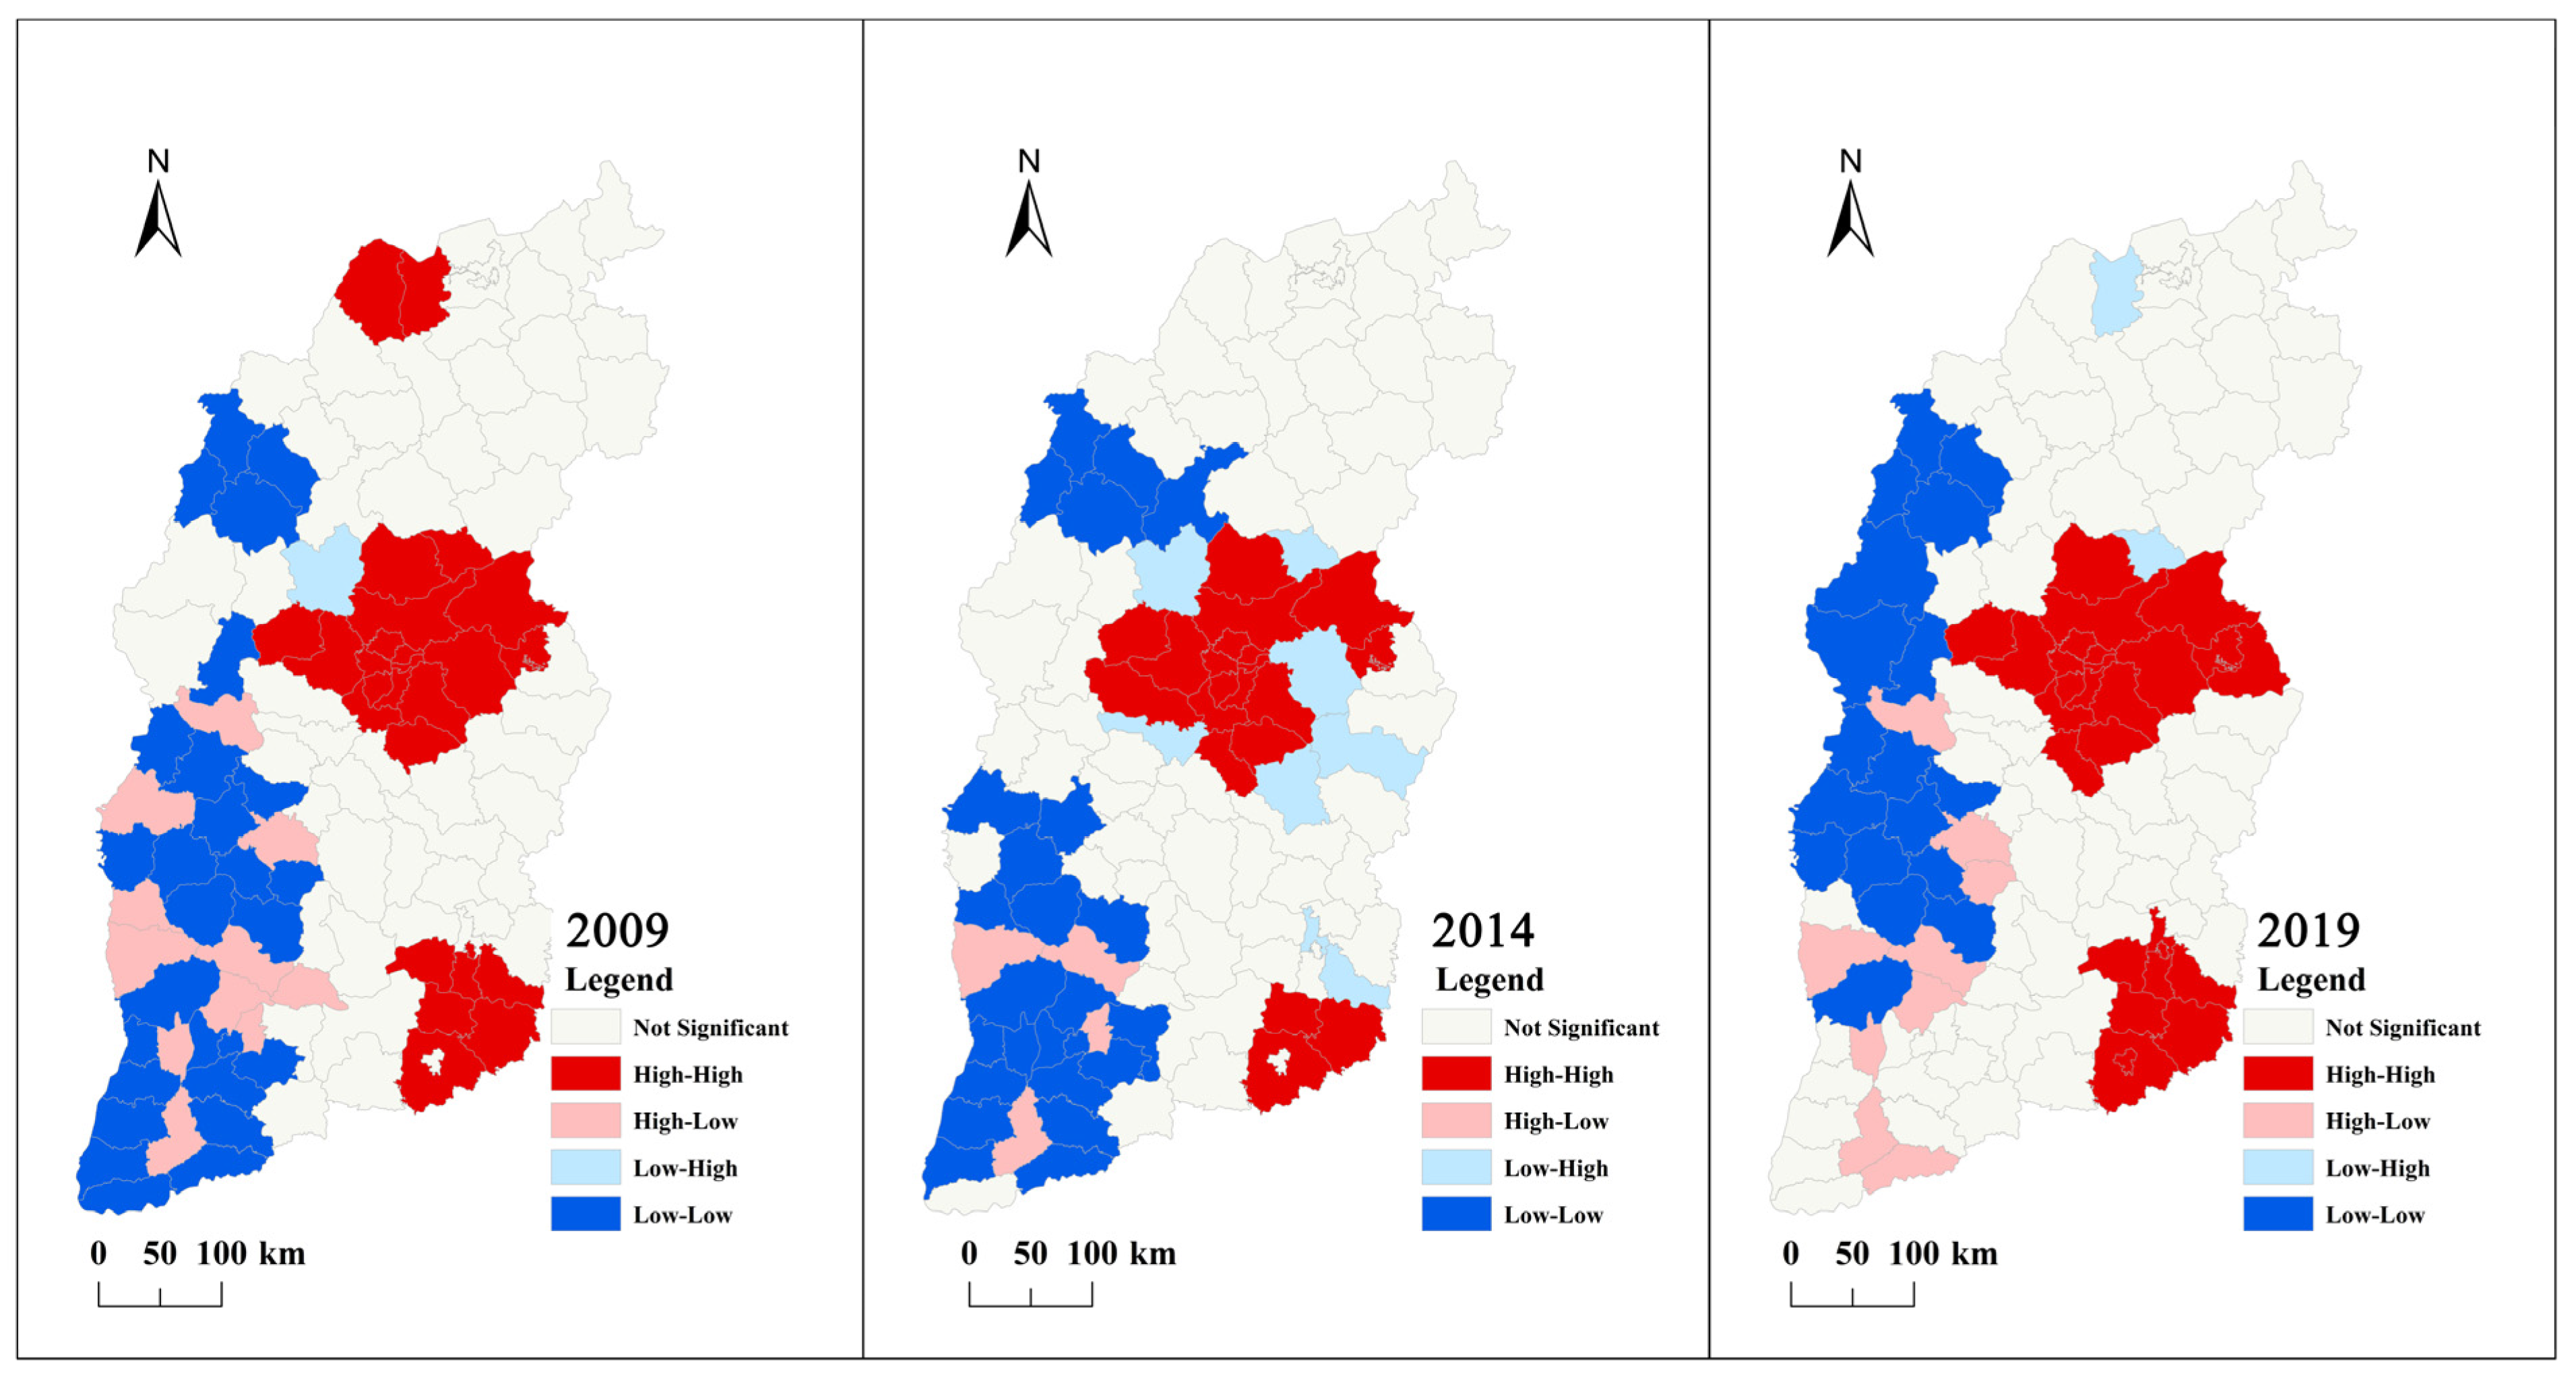
4.5. Spatial Divergence Characterization Analysis
As seen from
Figure 9, the spatial differentiation of CCD values in the three years is significant, mainly high–high and low–low types, which are roughly consistent with the spatial distribution of hot spots. In 2009, there were high–low types in some non-coal-resource-based cities in the west of Shanxi Province, but the surrounding coal-resource-based cities showed low–low types. That is, the coupling and coordination relationship between UC and ULUE in this region is insufficient to drive the development of surrounding cities.
In 2014, the aggregation type in the west of Shanxi Province gradually changed from high–low to low–low, and the point distribution was obvious. The number of high–high-type cities in the north, middle, and south decreased, and the central cities were surrounded by surrounding low–high types. From the change of spatial divergence characteristics, the overall CCD of the province in this stage was on a downward trend, and the lag of coal resource cities was more pronounced.
In 2019, the high–high type of CCD in Shanxi Province increased, and the surrounding low–high type decreased significantly. However, from the west side of the low-value aggregation, the low–low aggregation type gradually increased and moved northward and developed spatially in a belt-like contiguity. Meanwhile, the low-value area was surrounded by high-value areas, which laterally reflects that the coupling-coordination level of compactness and land-use efficiency had improved. However, there was still a lag in the regional CCD of coal resource aggregation.
5. Discussion
Urban compact development and land use exert mutual influence and mutual restriction [
62]. In the context of stock land renewal, improving land-use efficiency and promoting the compactness of spatial structure play an essential role in cities’ healthy and sustainable development. However, existing studies have focused on metropolitan areas, urban agglomerations, and cities in eastern China at a higher development stage [
63]. No relevant studies have been conducted on resource-based cities that face serious spatial structure and land-use problems. Thus, this study takes 119 counties and districts in Shanxi Province which are rich in mineral resources as a case study. By analyzing the interaction between UC and ULUE, the problems in compact urban development and land-use efficiency in resource-based areas can be accurately identified.
5.1. Changes in Urban Compactness
From the perspective of the entire research period, the urban compact development in Shanxi Province has declined. This phenomenon is pronounced in coal-based-areas, where the poorer development is concentrated in the relatively backward economy and complex terrain of mountainous areas. Although the urban area is slightly better than the county, it is still at a lower level than are the non-coal-based-areas. This also indicates that under resource depletion in resource-based areas, the initially vigorous mining areas have continued to suffer economic downturns as the population flows into urban areas and other areas, which is associated with an imbalance of the dual structure. Since some residents of mining areas still need to rely on their old way of life, the imperfect production and living functions in resource-depleted mining areas have increased the interaction between mining areas and urban areas. However, behind this passive association, in exchange for additional time and capital costs, it also increases the environmental burden and waste of resources. Assuming that the essential material living requirements of the populace remain unfulfilled, basic service facilities are inequitably distributed, and there is an emphasis on intensified and condensed urban development, the enhancement of the spatial configuration within this particular resource-dependent urban context would be hindered. Based on the current research on UC, ULUE, and the CCD between the two, the overall UC and ULUE levels in Shanxi Province are relatively lagging behind in China. Despite the existence of numerous coal-resource-based cities in China, Shanxi Province remains at a relatively lower level compared to the eastern Huang–Huai region, northeastern region, Shaanxi Province, and Inner Mongolia Autonomous Region. This is directly related to the wide coverage of resources and the dominant position of the secondary industry. At present, there is relatively limited research on UC and ULUE in resource-based cities. However, based on the relevant studies, cities with higher ULUE levels are generally concentrated in economically developed areas with a reasonable industrial structure and relatively concentrated population, while smaller towns and remote areas tend to have lower ULUE levels. Similarly [
64,
65,
66], UC also exhibits similar patterns in the aforementioned cities [
67,
68,
69].
5.2. Changes in Land-Use Efficiency
Coal-resource-based cities have produced many subsidence lands, tailing ponds, and gangue dumps during mining. These passive and extensive land types are not only difficult to use but also require a large amount of capital investment for renovation, which seriously restricts the improvement of land-use efficiency. According to the research, the overall land-use efficiency of Shanxi Province is at a relatively low level, and there is a gap relative to neighboring Shaanxi, Henan, and Shandong. At the same time, the urban land-use efficiency along the Yellow River in the province is slightly lower than that in the east. Although the province’s ULUE level is relatively low, the ULUE level in Shanxi Province has generally stabilized in the past ten years when faced with the need for transformation, development and governance of many abandoned industrial lands. Under the guidance of the territorial spatial planning system in Shanxi Province, mining land has been improved, the effective use of land has been promoted, and the supply capacity of ecological products has been comprehensively enhanced.
5.3. Changes in Coupling-Coordination Degree
Through the CCD research investigating the relationship between UC and ULUE, we found that the gap between the CCD of coal-based areas and non-coal-based areas in Shanxi Province has gradually widened since 2014, and the spatial imbalance has become increasingly obvious. The high CCD values are concentrated in the central, northeast and southeast regions of Shanxi Province. These cities have relatively high economic and technological levels relative to the province, and local governments have relatively sufficient financial resources to allocate resources rationally. At the same time, most of this area is located in low mountains and plains, urban land management is relatively convenient, and the governance models are diverse. Low CCD values are concentrated in cities with a low level of development, among which mining cities account for a large proportion. Such cities have loose urban–mining dual structure, a single industrial structure, severe population loss, and low urban vitality while facing more serious ecological and environmental problems. Not only is the financial support insufficient, but more land needs to be devoted to ecological compensation, resulting in fewer direct economic benefits.
In general, when the urban spatial structure develops in a scattered and disorderly manner, this will result in irrational land use, affecting land-use efficiency. The coupled and coordinated relationship between the two systems will be broken. Research shows that the two systems’ coupling-coordination relationship is stagnant. Resource-based cities have long formed urban spatial structures and land-use attributes that cannot be effectively improved quickly. It is not easy quickly to achieve output greater than input. In facing the problem of spatial structure and land use in resource-based cities, we must first understand that intensive and compact urban development is an important driving force for efficient land use and focus on the coordination between the two. The second point is to focus on funding and policy support at the county level. In the case of Shanxi province, the low-value areas of CCD are mainly concentrated in economically underdeveloped counties. Finally, to achieve the positive and balanced development of CCD at the provincial level, it is necessary to have a long-term vision and understand that the transformation and development of cities in resource-based areas is a complex and sustainable path.
5.4. Spatial Autocorrelation Analysis
This study analyzed the spatio-temporal dynamics of CCD spatial distribution patterns from two perspectives: identifying clustering areas with similar CCD values and identifying CCD spatial correlation structure patterns by combining the cold hot-spot analysis and the spatial divergence analysis. Overall, the distribution of hot spots of CCD in Shanxi Province gradually decreased. The distribution of cold spots gradually expanded, and they were distributed in bands in the cities along the Yellow River. The local spatial autocorrelation of CCD is characterized by small aggregation and large dispersion. Low-value aggregation is found within the less economically developed areas and the mineral resource-rich areas. Affected by mining activities and related factors, CCD in Shanxi Province has LL aggregation as the primary trend. Therefore, in the later territorial spatial planning at all levels, the scale of urban construction should be strictly controlled, the layout of coal-based land should be optimized, and the intensive use of urban land should be promoted. It would be best to strengthen the circulation and drive of factors between regions to promote the HH gathering of CCD.
6. Conclusions
This study constructs a comprehensive evaluation model of the coupling-coordination level of urban compactness and land-use efficiency at both the global scale and a small scale from the perspective of urban space and land-use problems in resource-based areas. This study used the D–S evidence theory and the two-stage network super-EBM model considering undesirable outputs to measure the CD and ULUE of 119 counties and urban areas in Shanxi Province for three years. Compared with previous ULUE measures, the ULUE measure used in this paper can more accurately reflect the characteristics of land-use stages such as land-damage output, land-treatment input and benefit output after the treatment caused by mining activities in cities in resource-based areas. Finally, coupling-coordination degree and spatial autocorrelation methods are applied to explore the coupling-coordination relationship and spatial divergence characteristics between UC and ULUE.
The research results show that: (1) The UC of Non-coal urban areas and counties in Shanxi Province in the three years selected is higher than that of Coal, while Non-coal shows an upward trend, and Coal shows a downward trend. (2) In the three years selected, the two types of cities have pronounced spatio-temporal heterogeneity. The province-wide CCD low values developed from disorder to increased order in the west, and less so in the east. The CCD of Coal and Non-coal was coordinated mainly during 2009. However, from 2014 to 2019, the CCD of Non-coal showed an upward trend, while that of Coal showed a downward trend. (3) The spatial divergence of CCD in Shanxi Province is significant. The hot spots are concentrated in the central and southeast, and the cold spots are concentrated in the cities along the west side of Shanxi Province. High–high and low–low types dominated the spatial differentiation characteristics, with little change in the three years. However, there is a trend of decreasing the high–high range and increasing the low–low range with a band development.
Since 2009, 50% of the coal mines in Shanxi Province have been shut down, one after another. The suspension of production in the mines has aggravated the stability of the urban spatial structure in a short period. The government needs to invest time, finance, and technology to improve the coordinated development of the dual structure of cities and mines. By gradually improving the negative factors that coal mining brings to cities and strengthening the radiating and driving effect of non-coal mining areas, we can jointly promote the high-quality and sustainable development of resource-based areas.
Therefore, under the context of China vigorously promoting the development of new urbanization, compact urban construction, as an effective means to address land-use issues during the urbanization process, plays an indispensable role in comprehensively advancing land-use efficiency; meanwhile, the enhancement of land-use efficiency also provides an intensive and rational land space for compact urban development, and the coordinated development of both will better support urban construction. However, the current compactness of cities (UC) and urban land-use efficiency (ULUE) coordination and control degrees (CCD) in most cities still need improvement. Based on the relevant research of this article, the following recommendations are proposed:
(1) Scientific planning guidance and optimized land-use layout. This can be achieved by adjusting the urban land-use structure, developing high-density mixed-use areas, increasing the degree of mixed use, and achieving smart growth. This avoids blind expansion, utilizes land extensively, and meets the economic development needs of the region.
(2) Promoting industrial structural adjustment and renewal. For non-coal-resource-based cities, the development of modern service industries and high-tech industries should be vigorously pursued. For coal-resource-based cities, industrial transformation should be deepened; mature resource-based cities should adjust their production and employment structures appropriately and strengthen the upstream and downstream industries of the coal industry; resource-exhausted cities should break free from the influence of the coal industry, accelerate the development of emerging industries, and gradually achieve synchronized and coordinated development of efficient land use and compact cities.
(3) Strengthening regional coordinated development. Currently, there are significant differences in economic compactness among different regions and cities of different scales, showing a decreasing trend from east to west and with cities’ scale; policies should be provided to support the economic development of economically developed urban areas, and economic, environmental, and social costs of urban development should be reduced.
(4) In the process of compact urban construction and enhancing land-use efficiency, the lack of coordinated development between the two will not only affect urban development but also lead to decreases in residents’ quality of life and happiness. For different cities, blindly pursuing unlimited improvement in the coordination between the two and continuously increasing urban compactness will only result in excessive resource waste. Actual city needs should be considered, and different development policies should be formulated.
Moreover, it should be stated that this study has some shortcomings. The research content only covers the temporal and spatial differences and changing characteristics of UC and ULUE, along with their coupling-coordination types. However, it has not yet delved into the analysis of influencing factors and more complex coupling mechanisms. Therefore, in future research, a more in-depth exploration of the interactive relationship between UC and ULUE is required.


