
Delineation of Urban Development Boundary and Carbon Emission Effects in Xuzhou City, China
by
 ,
,
Haitao Ji
1,
Xiaoshun Li
1,2,
Yiwei Geng
1,
Xin Chen
3,4,*,
Yuexiang Wang
1,
Jumei Cheng
1 and
Zhuang Chen
1 1
School of Public Policy and Management, China University of Mining and Technology, Xuzhou 221116, China
2
Research Center for Transition Development and Rural Revitalization of Resource-Based Cities in China, China University of Mining and Technology, Xuzhou 221116, China
3
Ministry of Education Key Laboratory for Earth System Modeling, Department of Earth System Science, Tsinghua University, Beijing 100084, China
4
Institute of Loess Plateau, Shanxi University, Taiyuan 030006, China
*
Author to whom correspondence should be addressed.
Land 2023, 12(9), 1819; https://doi.org/10.3390/land12091819
Submission received: 9 August 2023
/
Revised: 2 September 2023
/
Accepted: 12 September 2023
/
Published: 21 September 2023
(This article belongs to the Special Issue Feature Papers for Land Systems and Global Change Section)
Abstract
:Urban development boundary (UDB) has always served as a crucial aspect of urban sprawl research. The objective of this paper is to investigate boundary delineation and carbon emission effects. Firstly, we examined the patterns of land use changes. Additionally, this paper utilized the FLUS model and land use carbon emission calculation model to delineate UDB and calculate carbon emission effects within UDB under typical scenarios. The research results are as follows: (1) Xuzhou city witnessed a significant increase in both forest land and construction land from 2010 to 2020. (2) Under the CPS, the area of cultivated land increased by 217.05 km2 compared to the NDS. The UDB area under the NDS and CPS was 971.50 km2 and 968.99 km2, respectively. (3) Compared to the NDS, the CPS led to a net carbon emission increase of 4759.93 t within the UDB. Therefore, we should enhance the carbon sequestration and emission reduction capacity of the agricultural system. This study is beneficial for expanding the depth of research on the UDB and guiding the low-carbon urban development. We sincerely encourage readers to download this paper to improve this paper.
1. Introduction
Since the Industrial Revolution, urbanization has been accelerating globally [1]. Indeed, urban land expansion was occurring at a much faster rate than population growth [2], with China being particularly pronounced in this aspect. Since the implementation of economic reform and opening up, the urbanization rate in China has significantly increased by 3.6 times from 1978 to 2022. The construction area has also expanded from 0.7 × 10⁴ km2 in 1981 to 6.2 × 10⁴ km2 in 2021. Unplanned urban expansion has brought significant social and environmental challenges on a global scale [3]. Many cities are experiencing uncontrolled land development and excessive sprawl of urban land, resulting in a severe imbalance in urban development patterns. This has led to various issues such as biodiversity loss, deterioration of natural environment, increased air pollution, soil degradation, and a reduction in cultivated land [4,5,6]. Therefore, there is growing recognition for the need to control the uncontrolled and rapid expansion of cities and guide their orderly expansion, aiming for sustainable urban spatial development. As a result, the urban development boundary (UDB) has become a crucial measure for regulating urban sprawl and achieving optimized urban spatial planning. At the same time, it is particularly noteworthy that rapid and chaotic urban expansion caused an increase in greenhouse gas emission, which is impacting climate change [7] and accelerating global warming [8], posing a great threat to both the natural world and humanity [9]. A great deal of global carbon dioxide emissions can be attributed to urban areas, and this proportion might rise further with ongoing urbanization [10]. At the same time, China has already surpassed other countries to become the world’s largest annual emitter of carbon dioxide [11]. In order to address this urgent situation and achieve the coordinated pattern between urban expansion and low-carbon development, China has announced its commitment to strive for dual carbon goal [12]. This solemn commitment imposes new requirements on the urban sprawl pattern and management. Therefore, integrating the UDB with carbon emission effects and systematically exploring the carbon emission effects after the delineation of the UDB is crucial. This is an important approach to reconcile the conflicting goals of urban sprawl and low-carbon development, and to address the crucial issue and prerequisite of regulating the orderly and low-carbon sprawl of urban space.
Through reading a large amount of literature, we found that many existing studies primarily concentrate on defining the concept of UDB and delineating it through simulation. With regard to the conceptual definition of the UDB, the concept of urban development boundary (UDB) originated from urban growth boundary (UGB) and has been widely recognized as one of the most useful tools globally to manage and restrict urban sprawl [13]. It was derived from the “Garden City” theory proposed by European scholar Howard in the 19th century. The research on the conceptual definition of UDB can generally be divided into two primary areas. On the one hand, from the physical boundary perspective, it is considered that the UDB is seen as limits or restrictions that determine where urban settlements should not exceed [14]. It can also refer to the boundaries where there is a clear distinction in construction density between inside and outside the boundary [15]. On the other hand, from the practical function perspective, it is considered that the UDB is effective for controlling the urban sprawl and protecting non-urban land beyond the city’s territory [16,17], which is conducive to the coordination of the conflicts between land use plans [18]. Building on these studies, this paper considered UDB as regional limit that guides and regulates urban development within a specific time period, particularly for urban development and construction.
With regard to the simulation delineation of UDB, the first delineation of UDB occurred in Salem, USA, in 1976, as a means to address conflicts between urban and rural land management [19]. In China, the content regarding the delineation of UDB in central urban areas first appeared in the “Urban Planning Compilation Methods” implemented on 1 April 2006 [20]. Upon reviewing the existing literature, we found that the methods and criteria for delineating urban development boundary have not been fully clarified and standardized, which can be mainly divided into two primary areas. On the one hand, from the ecological security perspective, methods such as ecological suitability assessment, resource and environmental carrying capacity assessment, or landscape safety pattern establishment [21,22] are employed to preliminarily determine ecologically fragile areas (such as restricted or prohibited development zones), which in turn influence the scope of urban sprawl. On the other hand, from the inherent urban sprawl perspective, models such as the ANN model [23], CA model [24], CLUE-S model [25], SLEUTH model [26], and the FLUS model [27] are utilized to simulate urban expansion in terms of construction land spatial growth.
From the above literature review, we concluded that scholars dedicated significant research efforts to conceptualizing and simulating the delineation of the UDB [28,29]. However, the impact and effects after the boundary delineation have received limited attention in the existing literature [30], particularly regarding carbon emission effects. Therefore, considering the needs of low-carbon development in the current context and the existing research shortcomings, this study aims to carry out the research on the carbon emission effect after the UDB delineation, which is conducive to deepening the research content of UDB and regulating the orderly and low-carbon expansion of urban space.
In view of this, this paper focused on Xuzhou City and examined the land use changes from 2010 to 2020. Simultaneously, by setting the NDS and the CPS, we utilized the FLUS model to delineate the UDB under different scenarios. Furthermore, we calculated the carbon emission effects within UDB using the land use carbon emission calculation model. This study is beneficial for enriching the research on UDB, providing strategic recommendations for constraining urban expansion in Xuzhou City and contributing to the achievement of low-carbon development and the “dual carbon” goal.
2. Materials and Methods
2.1. Study Area
Xuzhou is located in Jiangsu Province, China, and is situated in the Huang Huai Plain. It is divided into five municipal districts, namely Tongshan, Jiawang, Quanshan, Gulou, and Yunlong (Figure 1). The city boasts diverse landforms, expansive plains, and abundant natural, cultural, and tourist resources. As a major regional center and a resource-exhausted city [31], Xuzhou is the central city of the Huaihai Economic Zone. It acts as a national comprehensive transportation hub, connecting the railroad network in all directions. Xuzhou is a significant old industrial base, energy supply base, and power transmission and distribution base in China. With strong momentum in urbanization, the city is experiencing rapid development. From 2000 to 2020, the built-up area of Xuzhou City experienced a significant expansion, increasing from 71.7 km2 to 289.6 km2, experiencing a fourfold increase. This growth propelled Xuzhou City to become the fourth largest city in Jiangsu Province, following Nanjing, Suzhou, and Wuxi.
2.2. Data and Preprocessing
Considering the physical conditions of the study area and accessibility of the research date, this paper mainly utilized data from four parts and the details are shown in Table 1. The land use data were reclassified according to the Current Land Use Classification (GB/T 21010-2017) into seven types, namely cultivated land (L1), garden land (L2), forest land (L3), grass land (L4), construction land (L5), water area (L6), and other land (L7). All the driving factor data underwent normalization processing (Figure 2). The projection coordinate system used was WGS_1984_UTM_Zone_50N. The resolution of all grid data was uniformly set at 30 × 30 m, with consistent row and column numbers. It is worth noting that the land use data were provided by the China Land Surveying and Planning Institute, which is an official government department in China. The terrain factor data were sourced from Geospatial Data Cloud, a big data platform created by the Chinese Academy of Sciences. Therefore, the accuracy of the land use data and terrain factor data can be guaranteed.
2.3. Methodology
This paper utilized methods such as the land use transfer matrix, land use dynamic degree, FLUS model, and the land use carbon emission calculation model. We analyzed the land use changes, delineated the UDB, and explored the carbon emission effects within the UDB under different scenarios. To present the research methodology and approach in more clear manner, this paper incorporated a flowchart illustrating the framework of the research methodology (Figure 3).
2.3.1. Scenario Setting
(1) Scenario 1: Natural Development Scenario (NDS). The basis for setting the NDS is that it does not consider artificial planning control, protected areas, or limitations on the conversion between different types. It solely focuses on the development of cities within the framework of the existing natural conditions.
(2) Scenario 2: Cultivated Land Protection Scenario (CPS). The basis for setting the CPS was conducted by introducing permanent basic cultivated land data as a restricting conversion factor into the model for the simulation, and strictly prohibited the situation that permanent basic cultivated land converts to other types.
2.3.2. Methodology for Land Use Change Analysis
(1) Land Use Transfer Matrix
The land use transfer matrix can describe the conversion between different types during a specific period [32], and has been widely used in many countries such as China [33], Japan [34], Rwanda [35], and Turkey [36]. It can indicate the transfer and changes during the study period [37]. The calculation formula is as follows:
where represents the convert area of land use type to type ; represents the number of land use types.
(2) Land Use Dynamic Degree
Land use dynamic degree can reflect the speed and magnitude of changes in various types over a certain period of time [38,39], and has been widely used in many countries such as China [40], Greece [41], and India [42]. This includes both comprehensive and single land use dynamic degrees. The former refers to the speed of change in all types over a certain study period, while the latter refers to the changes in a specific type. The calculation formula is as follows:
where represents the comprehensive land use dynamic degree; represents the single land use dynamic degree of the i-th land use type; represent the study period; represents the changed area.
2.3.3. FLUS Model
The FLUS model, developed by Liu et al. in 2017 [43], is a simulation model for predicting future land use changes. In 2018, Liang et al. further expanded the model by adding the UGB (urban growth boundary) module [44], which enables effective land use simulation and UDB delineation. Due to the advantages of higher accuracy, faster processing speed, and ease of use, the FLUS model has gained widespread use in many countries such as China [45], Myanmar [46], Turkey [47], and Colombia [48]. The FLUS model consists of three components: (1) Probability-of-occurrence estimation using artificial neural network; (2) Cellular automata based on self-adaptive inertia and competition mechanism; (3) Boundary delineation based on morphological erosion and dilation. For detailed formulas, please see the references [43,44].
2.3.4. Calculation of Land Use Carbon Emission
Land use carbon emission can be divided into direct carbon emission and indirect carbon emission [49], and has been widely used in many countries such as China [50] and India [51]. Direct carbon emission from land use refers to those generated by human activities on the land. The calculation formula is as follows:
where represents the direct carbon emission from land use; represents the land use type; represents the area; represents the carbon emission coefficient. Due to the inherent characteristics of L1, L2, L3, L4, L6, and L7, their carbon emission and absorption rates change minimally over a certain period. Therefore, for the study period, the carbon emission coefficient for L1, L2, L3, L4, L6, and L7 is assumed to be constant. Based on previous research findings [52,53], the coefficients for L1, L2, L3, L4, L6, and L7 are shown in Table 2.
Indirect carbon emission from land use primarily refers to the carbon emission associated with construction land. These emissions are estimated indirectly by considering the consumption of different energy types [54]. The calculation formula is as follows:
where represents the carbon emissions from construction land; , , , , represent the energy source type, the number of energy source types, the consumption, the carbon emission coefficient, and the coal equivalent coefficient, respectively. The coal equivalent coefficients are sourced from the “China Energy Statistical Yearbook 2013”, which lists the coal equivalent coefficients for various energy source types. Due to the study area being the municipal district of Xuzhou City, it is difficult to obtain comprehensive and accurate data on energy consumption. Therefore, this paper indirectly estimated the carbon emission from construction land in the municipal district of Xuzhou City by using the ratio of GDP between the municipal district and the entire city of Xuzhou [55]. Based on the result from construction land in Xuzhou City from 2005 to 2020, the GM(1,1) model was used for grey prediction, combined with the projected construction land area in Xuzhou City in 2035, yielding a coefficient value of approximately 15,468.33 t C/km2 for the construction land in Xuzhou City in 2035.
3. Results
3.1. Analysis of the Status of Land Use Change
3.1.1. Changes in Land Use Area
Firstly, we reclassified the original land use data of Xuzhou City for the periods of 2010, 2015, and 2020 into seven types (Figure 4). From Figure 4, we found that the land use types in Xuzhou are predominantly composed of L1, L5, and L6. In the year 2020, these three types collectively constituted around 84.58% of the total area. On the other hand, L3, L2, L7, and L4 were relatively small in area, comprising only 15.42%. The land use area in Xuzhou experienced different degrees of change, leading to a transformation in the whole structure. The areas of L1, L7, L6, L4, and L2 decreased by 131.40 km2, 26.66 km2, 23.52 km2, 10.41 km2, and 0.69 km2, respectively. However, L3 and L5 increased by 142.31 km2 and 50.37 km2, respectively. Among them, L3 increased most prominently with a growth rate of 127.39% over the 10-year period. On the other hand, there was a dramatic decrease in the area of L7, with a decrease of 32.55%. The area of garden land slightly decreased, but overall, the change was the least significant compared to other types.
3.1.2. Changes in Land Use Type Transition
From Table 3, we found that from 2010 to 2020, Xuzhou City experienced significant land use transitions, especially with frequent conversions among L1, L3, and L5. In terms of land area transferred out, the types with the largest to smallest transfer amounts were as follows: L1 > L5 > L6 > L2 > L7 > L4 > L3. Cultivated land was the dominant type, accounting for 40.63% of the transferred-out area. On the other hand, in terms of land area transferred in, the types with the largest to smallest transfer amounts were as follows: L1 > L5 > L3 > L6 > L > L7 > L4. Construction land was the main recipient, accounting for 25.65% of the transferred-in area.
In general, the land use transitions were primarily focused on L1, L5, and L3. Therefore, the analysis focused on these three types. Regarding L1, from 2010 to 2020, 24.13% of L1 had converted to other land types, with the majority of it being converted to L5. From L1 to L5, the transferred-out area reached 144.96 km2. Regarding L5, a total of 230.75 km2 of land from other land use types had converted to L5. This indicated a high level of urban expansion in Xuzhou City. Regarding L3, from 2010 to 2020, a total of 163.03 km2 of land from other types had converted to L3. This is strongly related to the implementation of Xuzhou City’s policy of promoting afforestation and artificial forestation.
3.1.3. Changes in Land Use Dynamic Degree
The land use dynamic degree is an indicator that reflects the speed of land use change. Based on the Equations (2) and (3), we obtained the land use dynamic degree in Xuzhou (Table 4).
From the perspective of comprehensive land use dynamic degree, the speed of land use change in Xuzhou was constantly changing. From 2010 to 2015, the degree in Xuzhou was 0.24%, indicating a relatively slow rate. However, from 2015 to 2020, the degree in Xuzhou city increased to 1.09%. Compared to the period of 2010 to 2015, the rate of change in land use types exhibited an increasing trend, suggesting that socioeconomic activities had a greater influence on the land pattern during the period of 2015 to 2020. From the perspective of single land use dynamic degree, the various types of land use exhibit dynamic fluctuations in trends during the study period. Among them, forest land changed the most, with a dynamic degree of 12.74%, while the smallest change was in garden land, with an intense degree of −0.07%. Forest land and construction land demonstrated an upward trend, while other types decreased. Among them, other land experienced the most significant decline, showing a considerable decrease with a dynamic degree of −3.26%.
3.2. Delineation of UDB in Xuzhou City under Multiple Scenarios
3.2.1. Model Accuracy Verification
Firstly, we simulated the spatial distribution of different land use types in 2015 (Figure 5b) based on the date of 2010. Subsequently, compared to the actual data of 2015 (Figure 5a), it can be observed that the simulated results generally correspond to the distribution of different types in the actual data. Afterwards, we selected 10% of the total number of simulated results’ pixels for accuracy verification. By calculating accuracy verification metrics, we obtained that the Kappa value is 0.7618 and the overall accuracy is 0.8427. This result suggested that FLUS model exhibited a high accuracy level in simulating urban land use changes. Therefore, we can utilize the model to simulate changes in various types in Xuzhou city, and it serves as an important foundational model for this study.
3.2.2. Future Land Use Simulation
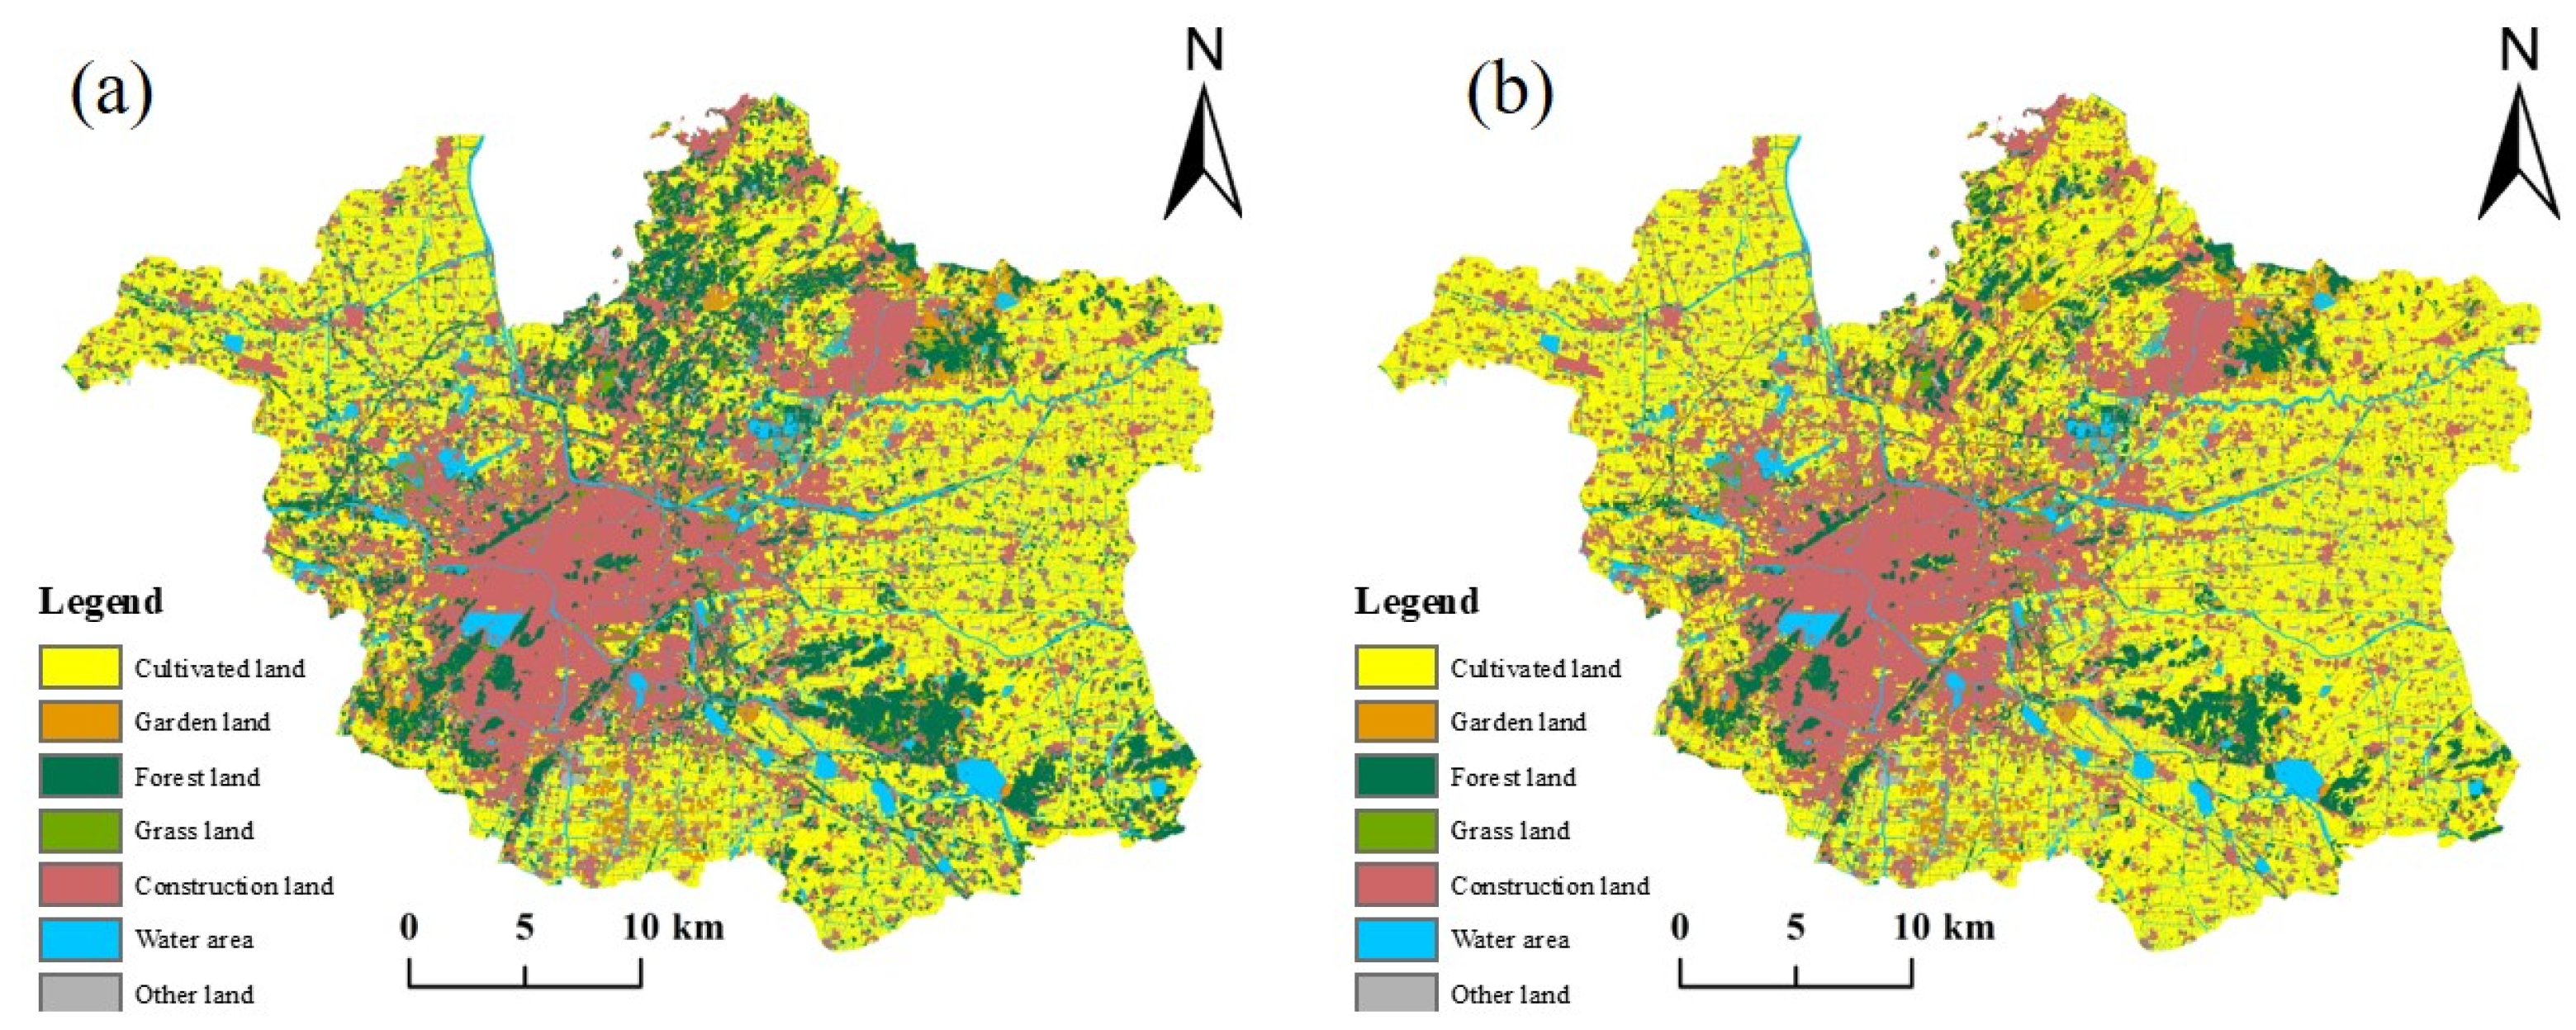
Firstly, we estimated the probability-of-occurrence in 2020 based on the real data in 2020 of Xuzhou. Secondly, based on the land use data of 2015 and 2020 of Xuzhou City, we used the built-in Markov chain module in the GeoSOS-FLUS software v. 2.4.1. for determining the pixel count of each type in Xuzhou City in 2035. Finally, the FLUS model was applied to simulate the future land use in Xuzhou in 2035 under different scenarios (Figure 6).
It can be observed that L1 and L3 show significant changes under different scenarios. In the NDS, compared to the current area of Xuzhou City in 2020, there is a decreasing trend in L1 and L7. Specifically, the L1 area has decreased most, by 197.49 km2. Moreover, the L3, L5, L4, and L2 show an increasing trend. Among them, L3 shows a particularly evident upward trend, with an increase in area of 191.70 km2, representing a growth rate of 75.47%. The water area (L6) remained relatively stable. In the CPS, compared to the current area of Xuzhou City in 2020, there is a decreasing trend in L6, L2, L7, and L4. The reduction in water area is particularly significant, with a decrease of 30.08 km2, representing a reduction rate of 9.98%. Moreover, the L1, L3, and L5 show an increasing trend. Specifically, the L1 area has increased by 19.56 km2. It is worth emphasizing that, compared to the simulation results of the NDS in 2035, there is an additional increase of 217.05 km2 in the L1 area. This indicates that the CPS can effectively achieve the expected goal of cultivated land protection.
3.2.3. Delineation of Urban Development Boundary (UDB)
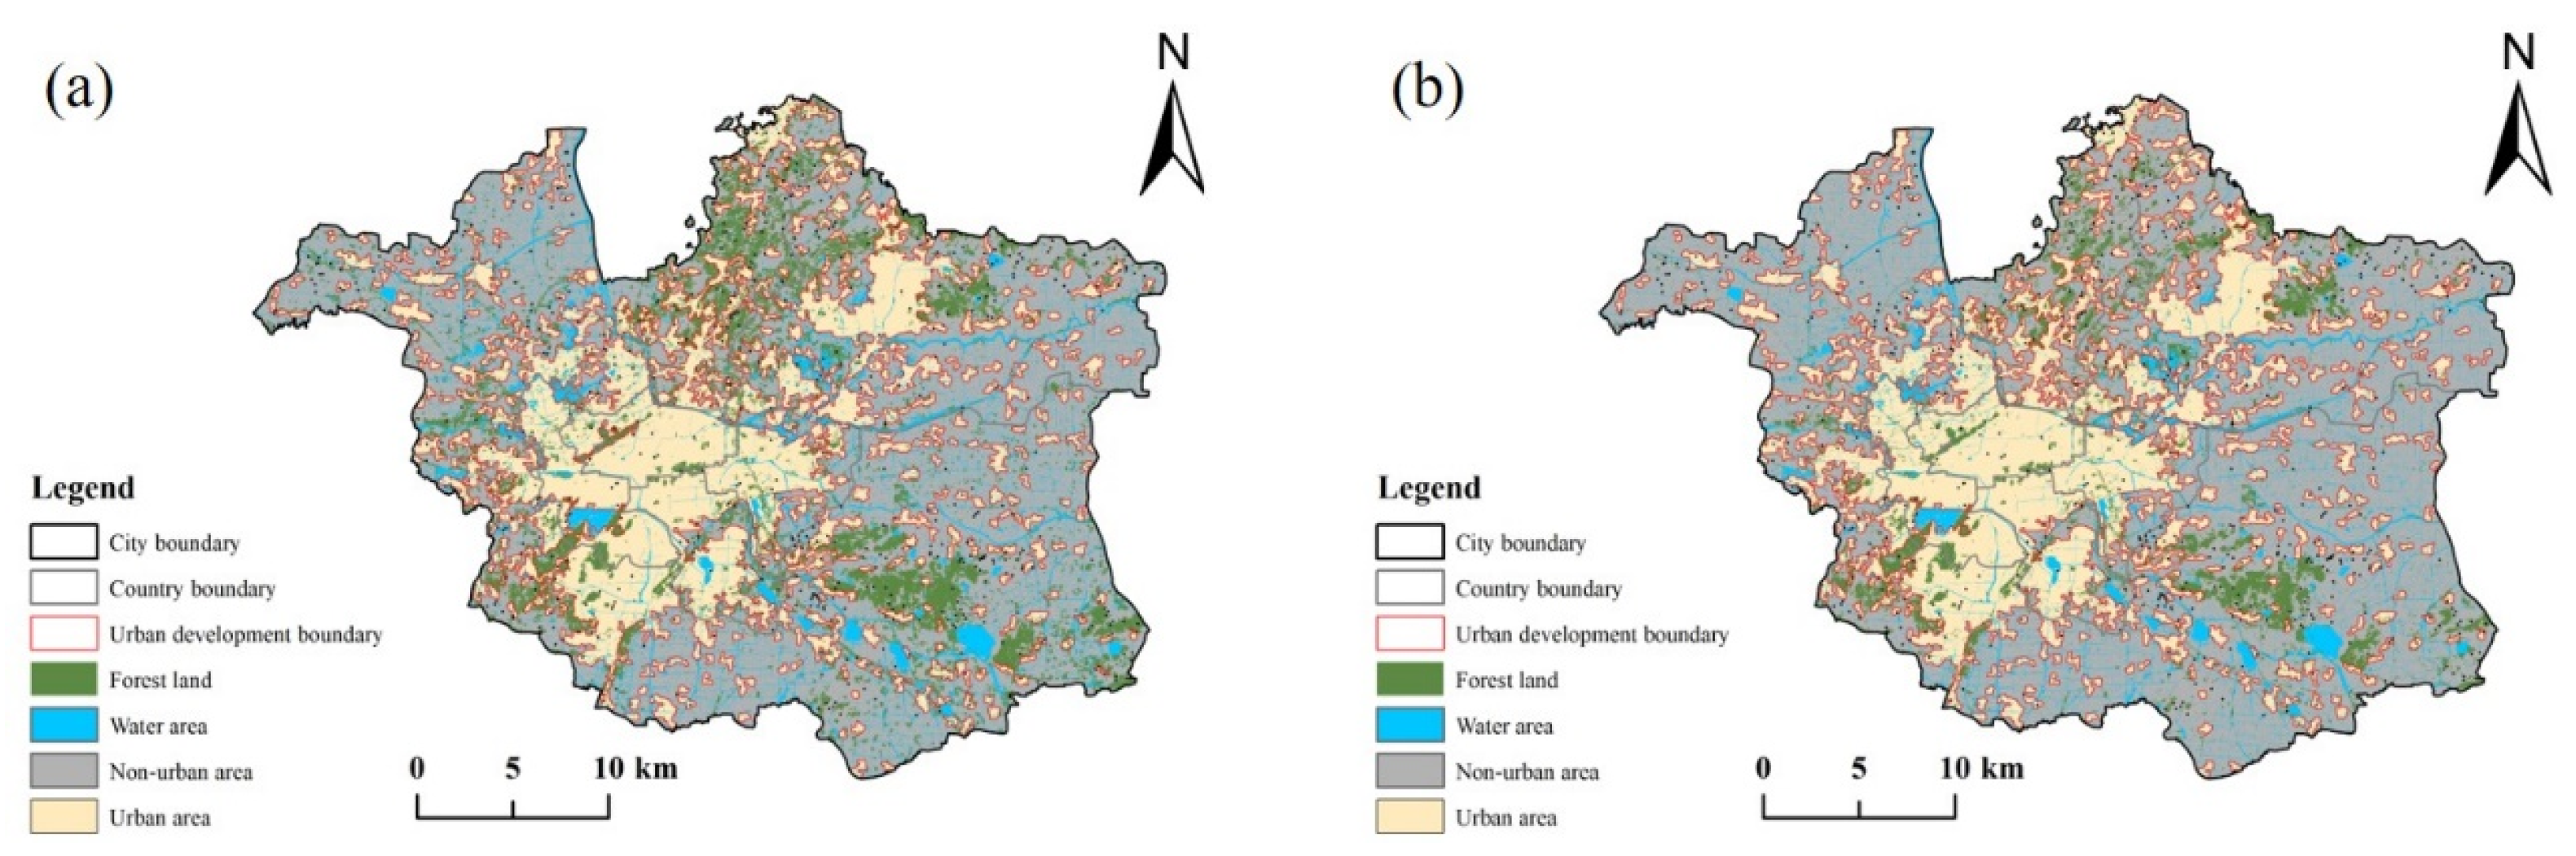
The UDB is delineated based on the future land development status of the city. In this paper, we utilized the UGB module in the GeoSOS-FLUS software to delineate the UDB under different scenarios in Xuzhou City, using morphological erosion and dilation operations in the opening–closing mathematical operation method.
Through comprehensive comparison of the results obtained using 3 × 3, 5 × 5, 7 × 7, and 9 × 9 structuring elements, it was found that using the 7 × 7 structuring element for delineating the UDB results in a smoother and more continuous boundary. The boundary line can better integrate with the urban area contours. Therefore, a window size of 7 × 7 was chosen for boundary delineation. Additionally, considering the actual situation, we removed scattered patches (less than or equal to 0.4 km2) and filled in small patches within large patches. The delineation results are shown in Figure 7.
From Figure 7, it can be observed that the UDB of Xuzhou in 2035 demonstrates a strong concentration and integrity. The main distribution is in Tongshan District and Jiawang District, while the UDB areas covered by the Yunlong District, Quanshan District, and Gulou District were quite similar. Under the NDS, the UDB area of Xuzhou City was 971.50 km2, accounting for 32.82% of the total area of Xuzhou. Under the CPS, the UDB area of Xuzhou City was 968.99 km2, accounting for 32.74% of the total area of Xuzhou City. The UDB area under the CPS was reduced by 2.51 km2 compared to the NDS. This indicated that the CPS can better control urban land sprawl, resulting in a lower proportion of boundary area to the total area.
3.3. Carbon Emission Effects within UDB under Different Scenarios
3.3.1. Aggregate Analysis of Carbon Emission Effects
According to the results of UDB delineation in Xuzhou City in 2035, we extracted the spatial distribution and area of different types within the UDB under the NDS and the CPS. These data were then incorporated into the calculation model to obtain the carbon emission effects within the UDB of Xuzhou City in 2035 (Table 5).
Regarding the net carbon emission, under the NDS, the net carbon emission within the urban development boundary of Xuzhou City in 2035 was estimated to be 10,470,405.55 t. Under the CPS, the result was 10,475,165.47 t. The CPS showed an increase of 4759.93 t compared to the NDS. This is mainly because the CPS can effectively protect cultivated land, while cultivated land exhibits carbon source characteristics, leading to higher net carbon emission compared to the NDS. Regarding the perspective of carbon source, the carbon source under the NDS and the CPS were estimated to be 10,478,062.42 t and 10,481,475.48 t, respectively. L1 and L5 are both carbon sources, with L5 being the main contributor, accounting for 99.95% of the total carbon source. Regarding the carbon sink, the carbon sink under the NDS and the CPS were estimated to be 7656.88 t and 6310.01 t, respectively. The L2, L3, L4, L6, and L7 act as carbon sinks. Among them, L3 was the main source of carbon sink. Under the NDS, L3 accounted for 61.49% of the total carbon sink, while under the CPS, L3 accounted for 57.19% of the total carbon sink.
3.3.2. Analysis of Regional Differences in Carbon Emission Effects
In this paper, we utilized ArcGIS software v.10.8.2 to partite the UDB of Xuzhou city under the NDS and CPS in 2035. Following that, we calculated the carbon emission effects in each municipal district within the UDB of Xuzhou city. In terms of net carbon emission, the municipal districts within the urban development boundary showed regional differentiation with Tongshan > Jiawang > Gulou > Quanshan > Yunlong District under both the NDS and the CPS. Among them, Tongshan District had the highest net carbon emission, reaching 4,602,517.47 t under the NDS, accounting for 43.96% of the total net carbon emission, and, reaching 4,560,670.41 t under the CPS, accounting for approximately 43.54% of the total net carbon emission. In terms of per-unit net carbon emission intensity, the municipal districts within the urban development boundary of Xuzhou city exhibited regional differentiation with Gulou > Quanshan > Yunlong > Jiawang > Tongshan District under both the NDS and the CPS. Among them, Gulou District had the highest per-unit net carbon emission intensity, reaching 12,819.09 tC/km2 under the NDS and 12,466.28 tC/km2 under the CPS. This is mainly because Gulou District serves as the main and central urban area of Xuzhou city, with active socioeconomic activities and a dense population, resulting in the highest carbon emission intensity.
In terms of carbon source, the municipal districts still exhibited the same regional differentiation as the total net carbon emissions, with Tongshan > Jiawang > Gulou > Quanshan > Yunlong District, and Tongshan District was the largest carbon source district. In terms of carbon sink, under the NDS, the municipal districts within the urban development boundary of Xuzhou city exhibited regional differentiation with Tongshan > Jiawang > Yunlong > Quanshan > Gulou District. Under the CPS, the municipal districts exhibited regional differentiation with Tongshan > Jiawang > Gulou > Yunlong > Quanshan District, where Yunlong District’s rank had changed significantly. Under the NDS, the carbon sink in Yunlong District reached 572.18 t, accounting for approximately 7.47% of the total carbon sink. Under the CPS, it reached 489.91 t, accounting for 7.76% of the total carbon sink. This is mainly because Yunlong District has various natural attractions such as Yunlong Mountain and Dalong Lake, which have strong carbon sequestration capability and high carbon sink value. It is worth noting that analyzing regional Differences facilitates the development of more targeted measures.
4. Discussion
4.1. Significance and Innovation
The delineation and management of UDB serve as effective tools to guide city development and restrict unplanned urban sprawl [56], contributing to sustainable urban development and more rational spatial planning [27]. Since the initiation of land spatial planning in China [57], UDB has been an integral part of the work. Increasingly, scholars have conducted in-depth research on this topic [58,59]. Existing studies have explored the definition of urban development boundary and have investigated how to utilize higher-precision models or more comprehensive data to achieve more accurate boundary delineation. However, some of the existing studies only considered the delineation of flexible boundary under the state of natural urban development [17], without taking into account major national strategies such as cultivated land protection. Based on this, this paper set up CPS, and substituted permanent basic cultivated land as the data restricting the transformation into the model for simulation [60], which realized in the combination of rigid boundary and flexible boundary. Based on the study results, compared to the NDS, it can be observed that the area of the cultivated land increased by 217.05 km2 and the area of UDB decreased by 2.51 km2 under the CPS. The CPS demonstrated better control over urban land sprawl while fully achieving the objective of cultivated land protection. The findings are consistent with the previous study [61].
Moreover, we found that there has been limited exploration of the effects of UGB delineation in existing studies [30]. Only a limited number of studies had examined the impact of UDB on land prices and housing prices [62,63]. Therefore, the innovative contribution of this paper lies in combining the urban development boundary with carbon emission effects, in line with China’s recent “dual carbon” goal. This paper utilized the land use carbon emission calculation model to estimate carbon emissions within the boundary, with the intention of achieving both rational and orderly urban expansion while evaluating carbon emissions levels. This evaluation enabled the adoption of targeted low-carbon development measures, thereby reconciling conflicts between urban expansion and low-carbon development. This paper seeks to guide a low-carbon and orderly expansion of urban space, ultimately achieving sustainable urban development. This represents the significance and innovation of this study. Indeed, due to the carbon source attribute of cultivated land as a whole [50], the CPS led to an increase of 4759.93 t carbon emission compared to the NDS. Therefore, in subsequent policy recommendations, it is crucial to focus on strengthening the efficient use of cultivated land, enhancing the carbon sequestration and emission reduction capacity of the agricultural land system [64] and supporting low-carbon development in cities.
4.2. Policy Proposals for the Future Development of Cities
Based on the results of this paper, the following policy proposals are proposed to realize the future low-carbon sustainable development of cities:
(1) During the process of delineating and managing UDB, it is important to integrate regional circumstances and base the delineation on accuracy. Furthermore, efforts should be made to strengthen the construction of management and control mechanisms. We should enhance the professional competence of planning and management personnel to ensure that the urban development boundary effectively fulfills their intended purpose and achieves rational control over the urban sprawl.
(2) It is important to innovate the methods and approaches for land spatial planning from the perspective of low carbon [65]. This involves the rational planning of future land use layout and methods, as well as precise delineation of UDB. By doing so, the delineation of low-carbon urban development boundary becomes more targeted, enabling low-carbon and sustainable urban development.
(3) We should develop strategies to enhance carbon sequestration and emission reduction based on the carbon source and sink attributes of different types. On one hand, efforts should be made to further promote efficient and intensive use of cultivated land and construction land [66], strengthen low-carbon agricultural technology innovation, promote industrial upgrading and transformation, and reduce regional carbon emission. On the other hand, we need increase the proportion of forest land and other carbon sink types, and enhance the region’s carbon sequestration and sink capacity.
4.3. Problem Statement and Future Work
Although this paper explored the carbon emission effects of urban development boundary delineation under different scenarios in Xuzhou City in 2035, there are still some problems that need to be stated and some future works that need to be conducted. Firstly, this paper only investigated the carbon emission effects within urban development boundary from a top-down perspective, without approaching it from a bottom-up perspective to study the delineation of urban development boundary under low-carbon constraints [65]. This limitation of the study contributes to the lack of more targeted policies and should be considered as the future research direction. Secondly, due to limitations in data availability, only the NDS and CPS were considered without fully considering other scenarios such as ecological conservation scenarios [19,22]. This limitation of the study contributes to the lack of more comprehensive policies and needs to be further explored in future research. Thirdly, the accuracy of future land simulation can be improved by considering additional influencing factors or using more precise data to achieve more accurate boundary delineation.
5. Conclusions
This paper took Xuzhou City as an example and adopted various methods to analyze the land use changes in Xuzhou City from 2010 to 2020, to delineate the UDB in Xuzhou City in 2035, and to explore the carbon emission effects within the UDB under different scenarios. The main conclusions are as follows:
(1) From 2010 to 2020, there was an increasing trend in forest land and construction land. Forest land showed the greatest changes from 2010 to 2020. It can be seen that Xuzhou’s urban sprawl is dramatic. Additionally, due to the implementation of afforestation policies, the area of forest land experienced substantial growth in Xuzhou City.
(2) Compared to the NDS, the CPS leaded to an increase of 217.05 km2 in cultivated land area. This indicated that the CPS has effectively achieved the intended goal of cultivated land protection. Moreover, the delineation of UDB in Xuzhou City in 2035 showed that compared to the NDS, the CPS can better control urban sprawl.
(3) The analysis of total carbon emissions showed that CPS produced more carbon emission than NDS due to the fact that cultivated land as a whole behaves as a carbon source. Therefore, in addition to implementing urban development boundary delineation, it is crucial to strengthen the efficient use of cultivated land, enhance the carbon sequestration and emission reduction capacity of the cultivated land system, and contribute to the low-carbon development of the city.
In conclusion, the main contribution of this paper lies in exploring the carbon emission effects after the delineation of UDB, bridging the gap in existing research. It provides valuable insights for the rational regulation of low-carbon urban development and lays a foundation for achieving the ‘dual carbon’ goal successfully.
Author Contributions
Conceptualization, H.J. and X.L.; methodology, H.J., Y.G. and Y.W.; software, H.J. and Y.W.; validation, H.J., J.C. and X.C.; formal analysis, H.J. and X.C.; investigation, H.J. and Z.C.; resources, H.J., X.L. and Z.C.; data curation, H.J.; writing—original draft preparation, H.J.; writing—review and editing, H.J. and Y.G.; visualization, X.L.; supervision, X.L.; project administration, X.L. and J.C.; funding acquisition, X.L., X.C., Y.W. and J.C. All authors have read and agreed to the published version of the manuscript.
Funding
This research was funded by National Natural Science Foundation Program (Grant No. 71874192; No. 42201279), Fundamental Research Funds for the Central Universities (Grant No. 2020ZDPY0219; No. 2022ZDPYSK08), Major Project of philosophy and Social Science Research in Colleges and Universities of Jiangsu Province (Grant No. 23WTA-001), Huai’an Natural Science Research Program Joint Special (HABL202201) and Graduate Research and Innovation Projects of Jiangsu Province (Grant No. KYCX23_2628).
Informed Consent Statement
Informed consent was obtained from all subjects involved in the study.
Data Availability Statement
The data used in this study can be found in the relevant publications and have already been cited in the text for illustration. The data presented in this study are available on request from the corresponding author.
Conflicts of Interest
The authors declare no conflict of interest.
References
- Seto, K.C.; Sánchez-Rodríguez, R.; Fragkias, M. The New Geography of Contemporary Urbanization and the Environment. Annu. Rev. Environ. Resour. 2010, 35, 167–194. [Google Scholar] [CrossRef]
- Angel, S. Urban Forms and Future Cities: A Commentary. Urban Plan. 2017, 2, 1–5. [Google Scholar] [CrossRef]
- Liu, Y.; Gao, Y.; Liu, L.; Song, C.; Ai, D. Nature-based solutions for urban expansion: Integrating ecosystem services into the delineation of growth boundaries. Habitat Int. 2022, 124, 102575. [Google Scholar] [CrossRef]
- Liu, X.; Ou, J.; Li, X.; Ai, B. Combining system dynamics and hybrid particle swarm optimization for land use allocation. Ecol. Model. 2013, 257, 11–24. [Google Scholar] [CrossRef]
- Peng, J.; Zhao, S.; Dong, J.; Liu, Y.; Meersmans, J.; Li, H.; Wu, J. Applying ant colony algorithm to identify ecological security patterns in megacities. Environ. Model. Softw. 2019, 117, 214–222. [Google Scholar] [CrossRef]
- Ren, Q.; He, C.; Huang, Q.; Zhang, D.; Shi, P.; Lu, W. Impacts of global urban expansion on natural habitats undermine the 2050 vision for biodiversity. Resour. Conserv. Recycl. 2023, 190, 106834. [Google Scholar] [CrossRef]
- Chen, X.; Yu, L.; Du, Z.; Liu, Z.; Qi, Y.; Liu, T.; Gong, P. Toward sustainable land use in China: A perspective on China’s national land surveys. Land Use Policy 2022, 123, 106428. [Google Scholar] [CrossRef]
- Luo, M.; Lau, N.C. Urban Expansion and Drying Climate in an Urban Agglomeration of East China. Geophys. Res. Lett. 2019, 46, 6868–6877. [Google Scholar] [CrossRef]
- Sun, W.; Huang, C. How does urbanization affect carbon emission efficiency? Evidence from China. J. Clean. Prod. 2020, 272, 122828. [Google Scholar] [CrossRef]
- Guo, S.; Zhang, Y.; Qian, X.; Ming, Z.; Nie, R. Urbanization and CO2 emissions in resource-exhausted cities: Evidence from Xuzhou city, China. Nat. Hazards 2019, 99, 807–826. [Google Scholar] [CrossRef]
- Cai, B.; Liu, H.; Zhang, X.; Pan, H.; Zhao, M.; Zheng, T.; Nie, J.; Du, M.; Dhakal, S. High-resolution accounting of urban emissions in China. Appl. Energy 2022, 325, 119896. [Google Scholar] [CrossRef]
- Wu, H.; Fang, S.; Zhang, C.; Hu, S.; Nan, D.; Yang, Y. Exploring the impact of urban form on urban land use efficiency under low-carbon emission constraints: A case study in China’s Yellow River Basin. J. Environ. Manag. 2022, 311, 114866. [Google Scholar] [CrossRef] [PubMed]
- Tan, R.; Liu, P.; Zhou, K.; He, Q. Evaluating the effectiveness of development-limiting boundary control policy: Spatial difference-in-difference analysis. Land Use Policy 2022, 120, 106229. [Google Scholar] [CrossRef]
- Gennaio, M.-P.; Hersperger, A.M.; Bürgi, M. Containing urban sprawl—Evaluating effectiveness of urban growth boundaries set by the Swiss Land Use Plan. Land Use Policy 2009, 26, 224–232. [Google Scholar] [CrossRef]
- Tayyebi, A.; Perry, P.C.; Tayyebi, A.H. Predicting the expansion of an urban boundary using spatial logistic regression and hybrid raster–vector routines with remote sensing and GIS. Int. J. Geogr. Inf. Sci. 2013, 28, 639–659. [Google Scholar] [CrossRef]
- Hepinstall-Cymerman, J.; Coe, S.; Hutyra, L.R. Urban growth patterns and growth management boundaries in the Central Puget Sound, Washington, 1986–2007. Urban Ecosyst. 2013, 16, 109–129. [Google Scholar] [CrossRef]
- Tayyebi, A.; Pijanowski, B.C.; Tayyebi, A.H. An urban growth boundary model using neural networks, GIS and radial parameterization: An application to Tehran, Iran. Landsc. Urban Plan. 2011, 100, 35–44. [Google Scholar] [CrossRef]
- Wang, W.; Jiao, L.; Zhang, W.; Jia, Q.; Su, F.; Xu, G.; Ma, S. Delineating urban growth boundaries under multi-objective and constraints. Sustain. Cities Soc. 2020, 61, 102279. [Google Scholar] [CrossRef]
- Han, N.; Hu, K.; Yu, M.; Jia, P.; Zhang, Y. Incorporating Ecological Constraints into the Simulations of Tropical Urban Growth Boundaries: A Case Study of Sanya City on Hainan Island, China. Appl. Sci. 2022, 12, 6409. [Google Scholar] [CrossRef]
- Wang, S.-N.; Liu, C.-G.; Sun, W. Simulation research of urban development boundary based on ecological constraints: A case study of Nanjing. J. Nat. Resour. 2021, 36, 2913–2925. [Google Scholar] [CrossRef]
- Ouyang, X.; Xu, J.; Li, J.; Wei, X.; Li, Y. Land space optimization of urban-agriculture-ecological functions in the Changsha-Zhuzhou-Xiangtan Urban Agglomeration, China. Land Use Policy 2022, 117, 106112. [Google Scholar] [CrossRef]
- Yang, X.; Bai, Y.; Che, L.; Qiao, F.; Xie, L. Incorporating ecological constraints into urban growth boundaries: A case study of ecologically fragile areas in the Upper Yellow River. Ecol. Indic. 2021, 124, 107436. [Google Scholar] [CrossRef]
- Bakshi, A.; Esraz-Ul-Zannat, M. Application of urban growth boundary delineation based on a neural network approach and landscape metrics for Khulna City, Bangladesh. Heliyon 2023, 9, e16272. [Google Scholar] [CrossRef] [PubMed]
- Chen, Y.; Li, X.; Liu, X.; Huang, H.; Ma, S. Simulating urban growth boundaries using a patch-based cellular automaton with economic and ecological constraints. Int. J. Geogr. Inf. Sci. 2018, 33, 55–80. [Google Scholar] [CrossRef]
- Huang, D.; Huang, J.; Liu, T. Delimiting urban growth boundaries using the CLUE-S model with village administrative boundaries. Land Use Policy 2019, 82, 422–435. [Google Scholar] [CrossRef]
- Liu, J.; Zhang, G.; Zhuang, Z.; Cheng, Q.; Gao, Y.; Chen, T.; Huang, Q.; Xu, L.; Chen, D. A new perspective for urban development boundary delineation based on SLEUTH-InVEST model. Habitat Int. 2017, 70, 13–23. [Google Scholar] [CrossRef]
- Liu, X.; Wei, M.; Li, Z.; Zeng, J. Multi-scenario simulation of urban growth boundaries with an ESP-FLUS model: A case study of the Min Delta region, China. Ecol. Indic. 2022, 135, 108538. [Google Scholar] [CrossRef]
- Xu, H.; Song, Y.; Tian, Y. Simulation of land-use pattern evolution in hilly mountainous areas of North China: A case study in Jincheng. Land Use Policy 2022, 112, 105826. [Google Scholar] [CrossRef]
- Zhang, D.; Liu, X.; Lin, Z.; Zhang, X.; Zhang, H. The delineation of urban growth boundaries in complex ecological environment areas by using cellular automata and a dual-environmental evaluation. J. Clean. Prod. 2020, 256, 120361. [Google Scholar] [CrossRef]
- Tan, R.; Liu, Y.; Liu, Y.; He, Q. A literature review of urban growth boundary: Theory, modeling, and effectiveness evaluation. Prog. Geogr. 2020, 39, 327–338. [Google Scholar] [CrossRef]
- Liang, X.; Ji, X.; Guo, N.; Meng, L. Assessment of urban heat islands for land use based on urban planning: A case study in the main urban area of Xuzhou City, China. Environ. Earth Sci. 2021, 80, 308. [Google Scholar] [CrossRef]
- Chen, L.; Zhou, B.; Man, W.; Liu, M. Landsat-Based Monitoring of the Heat Effects of Urbanization Directions and Types in Hangzhou City from 2000 to 2020. Remote Sens. 2021, 13, 4268. [Google Scholar] [CrossRef]
- Chen, X.; Yu, L.; Cao, Y.; Xu, Y.; Zhao, Z.; Zhuang, Y.; Liu, X.; Du, Z.; Liu, T.; Yang, B.; et al. Habitat quality dynamics in China’s first group of national parks in recent four decades: Evidence from land use and land cover changes. J. Environ. Manag. 2023, 325, 116505. [Google Scholar] [CrossRef]
- Guan, D.; Gao, W.; Watari, K.; Fukahori, H. Land use change of Kitakyushu based on landscape ecology and Markov model. J. Geogr. Sci. 2008, 18, 455–468. [Google Scholar] [CrossRef]
- Li, C.; Yang, M.; Li, Z.; Wang, B. How Will Rwandan Land Use/Land Cover Change under High Population Pressure and Changing Climate? Appl. Sci. 2021, 11, 5376. [Google Scholar] [CrossRef]
- Reis, S. Analyzing Land Use/Land Cover Changes Using Remote Sensing and GIS in Rize, North-East Turkey. Sensors 2008, 8, 6188–6202. [Google Scholar] [CrossRef]
- Cao, J.; Li, T. Analysis of spatiotemporal changes in cultural heritage protected cities and their influencing factors: Evidence from China. Ecol. Indic. 2023, 151, 110327. [Google Scholar] [CrossRef]
- Xiao, X.; Huang, X.; Jiang, L.; Jin, C. Empirical study on comparative analysis of dynamic degree differences of land use based on the optimization model. Geocarto Int. 2022, 37, 9847–9864. [Google Scholar] [CrossRef]
- Zhao, Y.; Li, R.; Wu, M. Correlation Studies between Land Cover Change and Baidu Index: A Case Study of Hubei Province. ISPRS Int. J. Geo-Inf. 2020, 9, 232. [Google Scholar] [CrossRef]
- Chen, W.; Chi, G.; Li, J. The spatial association of ecosystem services with land use and land cover change at the county level in China, 1995–2015. Sci. Total Environ. 2019, 669, 459–470. [Google Scholar] [CrossRef]
- Sklavou, P.; Karatassiou, M.; Parissi, Z.; Galidaki, G.; Ragkos, A.; Sidiropoulou, A. The Role of Transhumance on Land Use/Cover Changes in Mountain Vermio, Northern Greece: A GIS Based Approach. Not. Bot. Horti Agrobot. Cluj-Napoca 2017, 45, 589–596. [Google Scholar] [CrossRef]
- Yadav, V.; Ghosh, S.K. Assessment and prediction of urban growth for a mega-city using CA-Markov model. Geocarto Int. 2019, 36, 1960–1992. [Google Scholar] [CrossRef]
- Liu, X.; Liang, X.; Li, X.; Xu, X.; Ou, J.; Chen, Y.; Li, S.; Wang, S.; Pei, F. A future land use simulation model (FLUS) for simulating multiple land use scenarios by coupling human and natural effects. Landsc. Urban Plan. 2017, 168, 94–116. [Google Scholar] [CrossRef]
- Liang, X.; Liu, X.; Li, X.; Chen, Y.; Tian, H.; Yao, Y. Delineating multi-scenario urban growth boundaries with a CA-based FLUS model and morphological method. Landsc. Urban Plan. 2018, 177, 47–63. [Google Scholar] [CrossRef]
- Liao, W.; Liu, X.; Xu, X.; Chen, G.; Liang, X.; Zhang, H.; Li, X. Projections of land use changes under the plant functional type classification in different SSP-RCP scenarios in China. Sci. Bull. 2020, 65, 1935–1947. [Google Scholar] [CrossRef] [PubMed]
- Jin, Y.; Li, A.; Bian, J.; Nan, X.; Lei, G. Modeling the Impact of Investment and National Planning Policies on Future Land Use Development: A Case Study for Myanmar. ISPRS Int. J. Geo-Inf. 2023, 12, 22. [Google Scholar] [CrossRef]
- Şenik, B.; Kaya, H.S. Landscape sensitivity-based scenario analysis using flus model: A case of Asarsuyu watershed. Landsc. Ecol. Eng. 2021, 18, 139–156. [Google Scholar] [CrossRef]
- Cuellar, Y.; Perez, L. Assessing the accuracy of sensitivity analysis: An application for a cellular automata model of Bogota’s urban wetland changes. Geocarto Int. 2023, 38, 2186491. [Google Scholar] [CrossRef]
- Zhao, L.; Yang, C.-H.; Zhao, Y.-C.; Wang, Q.; Zhang, Q.-P. Spatial Correlations of Land Use Carbon Emissions in Shandong Peninsula Urban Agglomeration: A Perspective from City Level Using Remote Sensing Data. Remote Sens. 2023, 15, 1488. [Google Scholar] [CrossRef]
- Zhang, P.; He, J.; Hong, X.; Zhang, W.; Qin, C.; Pang, B.; Li, Y.; Liu, Y. Carbon sources/sinks analysis of land use changes in China based on data envelopment analysis. J. Clean. Prod. 2018, 204, 702–711. [Google Scholar] [CrossRef]
- Ghosh, S.; Dinda, S.; Chatterjee, N.D.; Dutta, S.; Bera, D. Spatial-explicit carbon emission-sequestration balance estimation and evaluation of emission susceptible zones in an Eastern Himalayan city using Pressure-Sensitivity-Resilience framework: An approach towards achieving low carbon cities. J. Clean. Prod. 2022, 336, 130417. [Google Scholar] [CrossRef]
- Rong, T.; Zhang, P.; Zhu, H.; Jiang, L.; Li, Y.; Liu, Z. Spatial correlation evolution and prediction scenario of land use carbon emissions in China. Ecol. Inform. 2022, 71, 101802. [Google Scholar] [CrossRef]
- Sun, H.; Liang, H.; Chang, X.; Cui, Q.; Tao, Y. Land Use Patterns on Carbon Emission and Spatial Association in China. Econ. Geogr. 2015, 35, 154–162. [Google Scholar] [CrossRef]
- Zhao, C.; Liu, Y.; Yan, Z. Effects of land-use change on carbon emission and its driving factors in Shaanxi Province from 2000 to 2020. Environ. Sci. Pollut. Res. Int. 2023, 30, 68313–68326. [Google Scholar] [CrossRef] [PubMed]
- Zhang, C.-Y.; Zhao, L.; Zhang, H.; Chen, M.-N.; Fang, R.-Y.; Yao, Y.; Zhang, Q.-P.; Wang, Q. Spatial-temporal characteristics of carbon emissions from land use change in Yellow River Delta region, China. Ecol. Indic. 2022, 136, 108623. [Google Scholar] [CrossRef]
- Schuster Olbrich, J.P.; Vich, G.; Miralles-Guasch, C.; Fuentes, L. Urban sprawl containment by the urban growth boundary: The case of the Regulatory Plan of the Metropolitan Region of Santiago of Chile. J. Land Use Sci. 2022, 17, 324–338. [Google Scholar] [CrossRef]
- Yue, W.; Hou, B.; Ye, G.; Wang, Z. China’s land-sea coordination practice in territorial spatial planning. Ocean Coast. Manag. 2023, 237, 106545. [Google Scholar] [CrossRef]
- He, F.; Yang, J.; Zhang, Y.; Sun, D.; Wang, L.; Xiao, X.; Xia, J. Offshore Island Connection Line: A new perspective of coastal urban development boundary simulation and multi-scenario prediction. GIScience Remote Sens. 2022, 59, 801–821. [Google Scholar] [CrossRef]
- Ma, S.; Zhao, Y.; Tan, X. Exploring Smart Growth Boundaries of Urban Agglomeration with Land Use Spatial Optimization: A Case Study of Changsha-Zhuzhou-Xiangtan City Group, China. Chin. Geogr. Sci. 2020, 30, 665–676. [Google Scholar] [CrossRef]
- Ouyang, X.; He, Q.; Zhu, X. Simulation of Impacts of Urban Agglomeration Land Use Change on Ecosystem Services Value under Multi-Scenarios: Case Study in Changsha-Zhuzhou-Xiangtan Urban Agglomeration. Econ. Geogr. 2020, 40, 93–102. [Google Scholar] [CrossRef]
- Lai, Z.; Chen, C.; Chen, J.; Wu, Z.; Wang, F.; Li, S. Multi-Scenario Simulation of Land-Use Change and Delineation of Urban Growth Boundaries in County Area: A Case Study of Xinxing County, Guangdong Province. Land 2022, 11, 1598. [Google Scholar] [CrossRef]
- Mathur, S. Impact of an urban growth boundary across the entire house price spectrum: The two-stage quantile spatial regression approach. Land Use Policy 2019, 80, 88–94. [Google Scholar] [CrossRef]
- Ball, M.; Cigdem, M.; Taylor, E.; Wood, G. Urban growth boundaries and their impact on land prices. Environ. Plan. A Econ. Space 2014, 46, 3010–3026. [Google Scholar] [CrossRef]
- Zhang, L.; Lin, X.; Xiao, Y.; Lin, Z. Spatial and structural characteristics of the ecological network of carbon metabolism of cultivated land based on land use and cover change: A case study of Nanchang, China. Environ. Sci. Pollut. Res. Int. 2023, 30, 30514–30529. [Google Scholar] [CrossRef] [PubMed]
- Li, J.; Guldmann, J.M.; Gong, J.; Su, H. Urban growth boundaries optimization under low-carbon development: Combining multi-objective programming and patch cellular automata models. J. Environ. Manag. 2023, 340, 117934. [Google Scholar] [CrossRef]
- Wu, H.; Qiu, Y.; Yin, L.; Liu, S.; Zhao, D.; Zhang, M. Effects of China’s land-intensive use on carbon emission reduction: A new perspective of industrial structure upgrading. Front. Environ. Sci. 2022, 10, 1073565. [Google Scholar] [CrossRef]
Figure 1.
Location map of the study area.
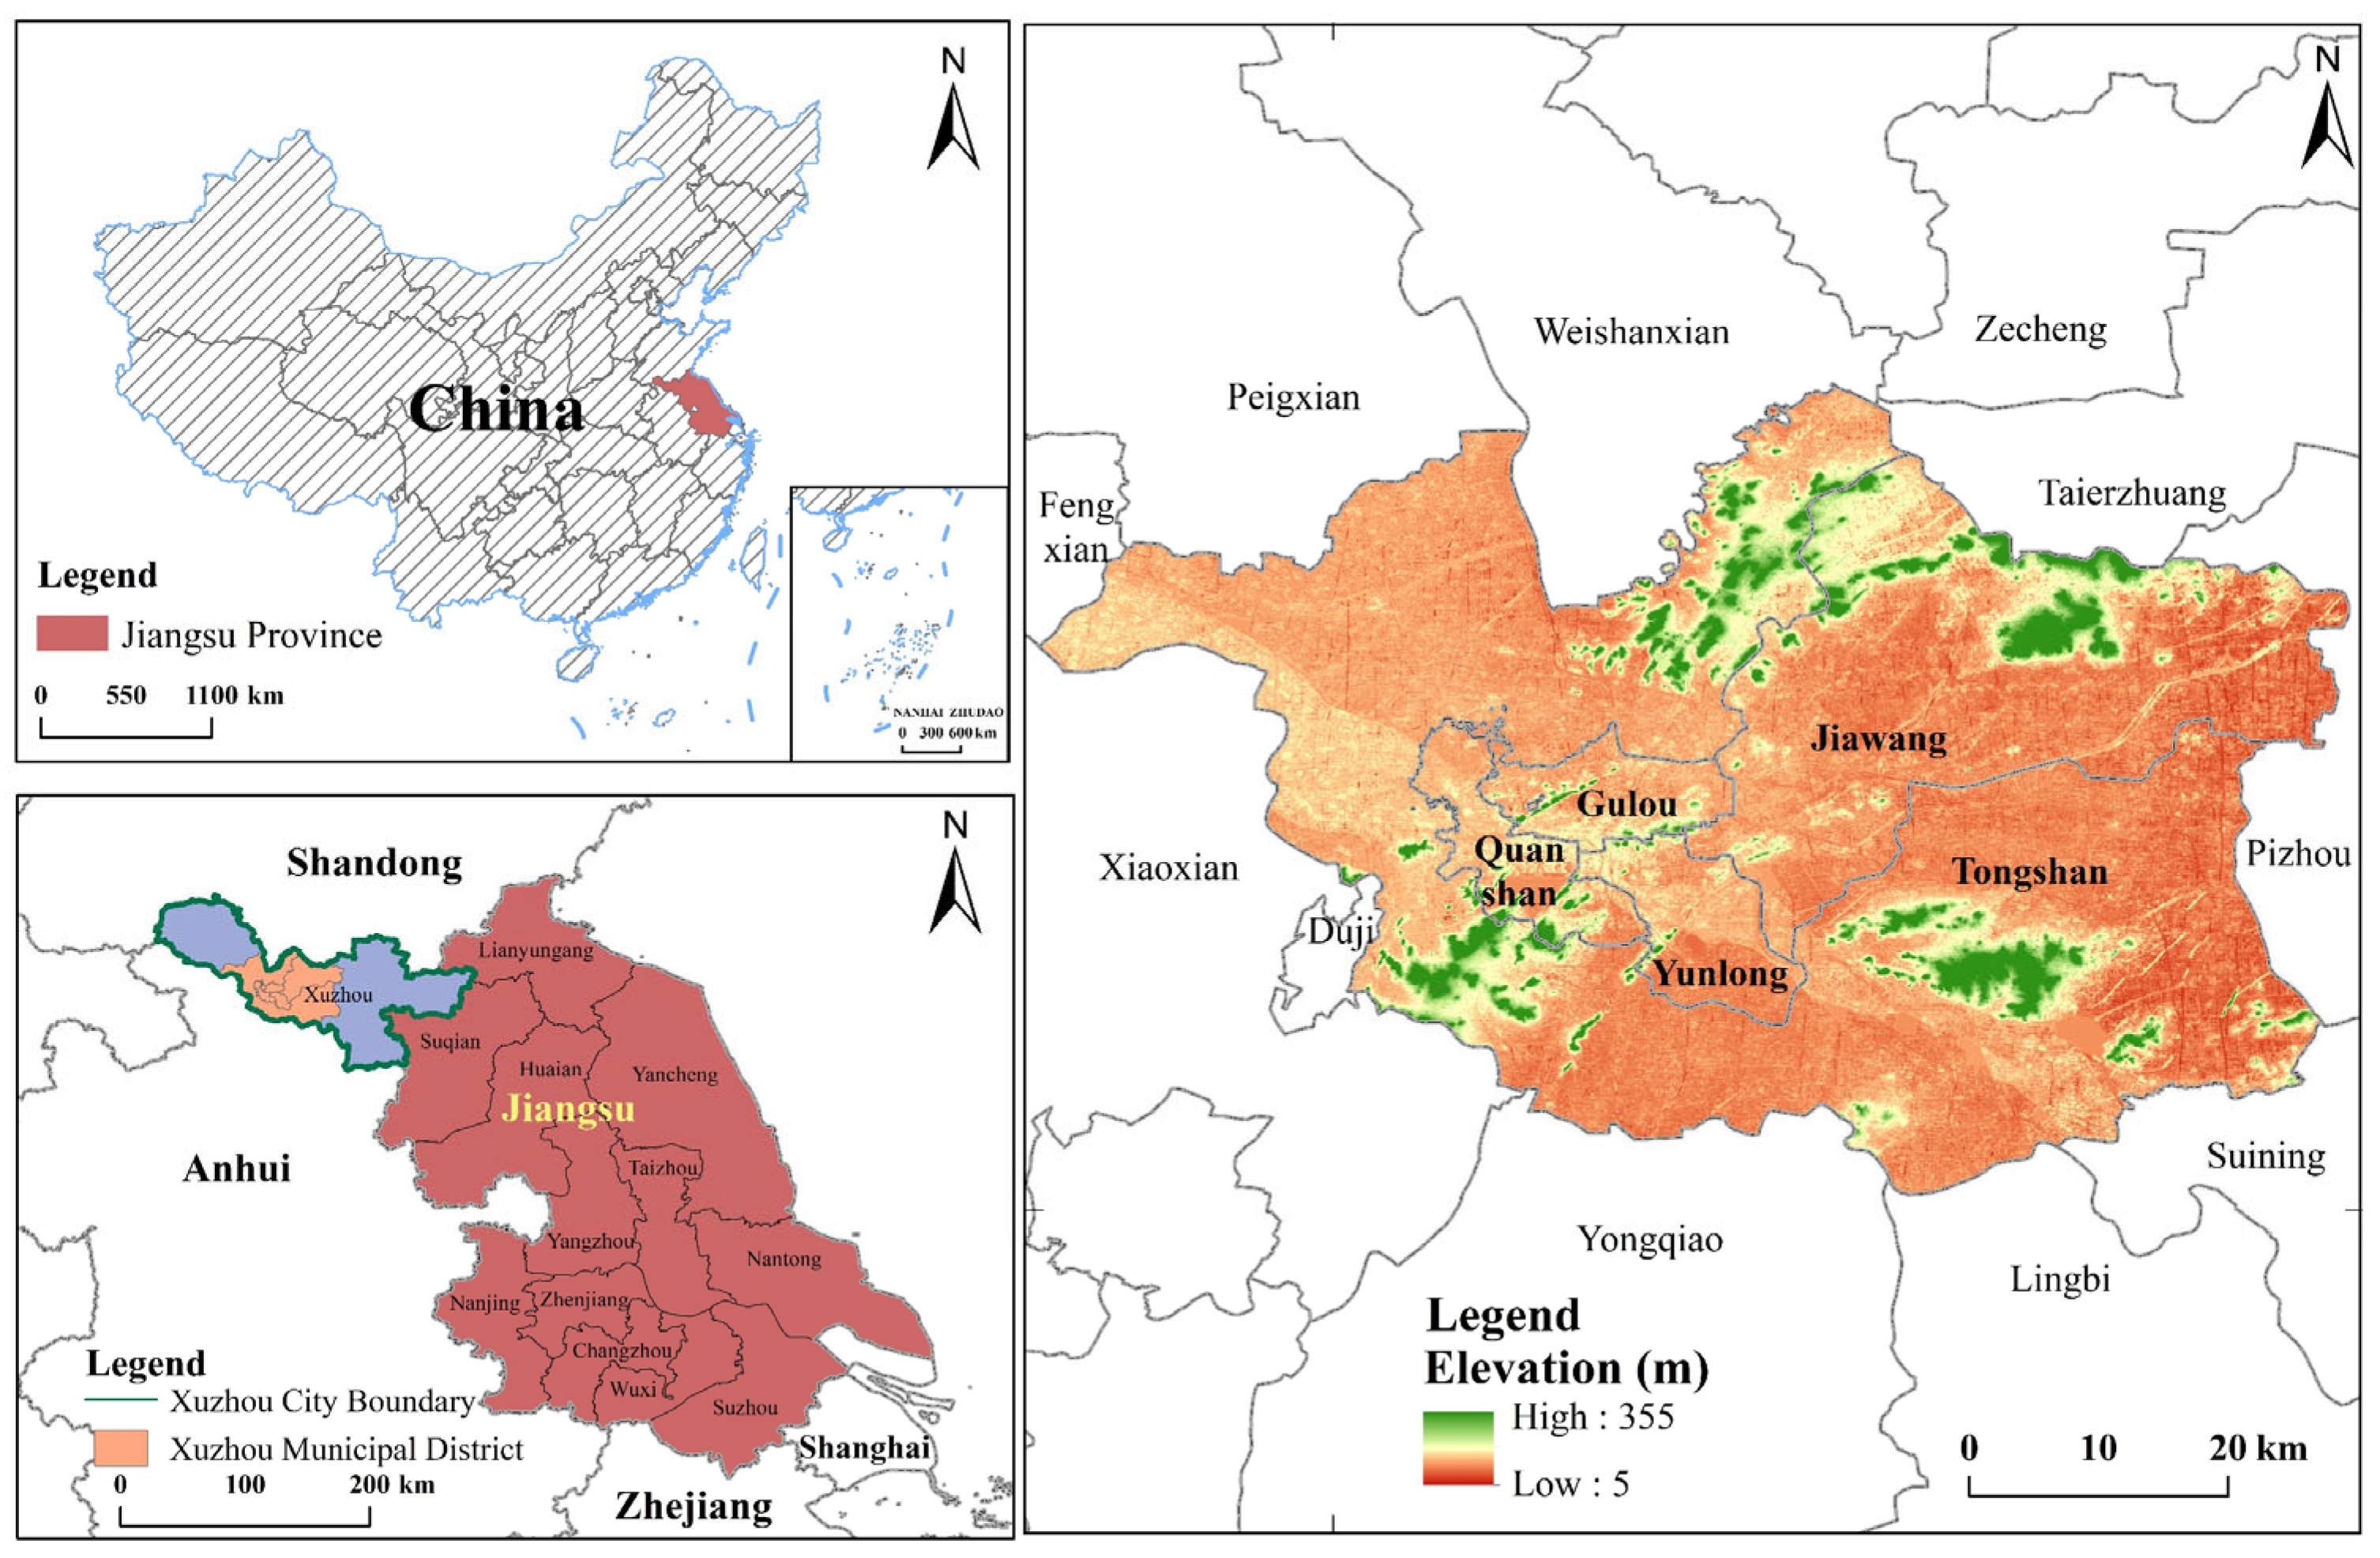
Figure 2.
Land use driving factors.
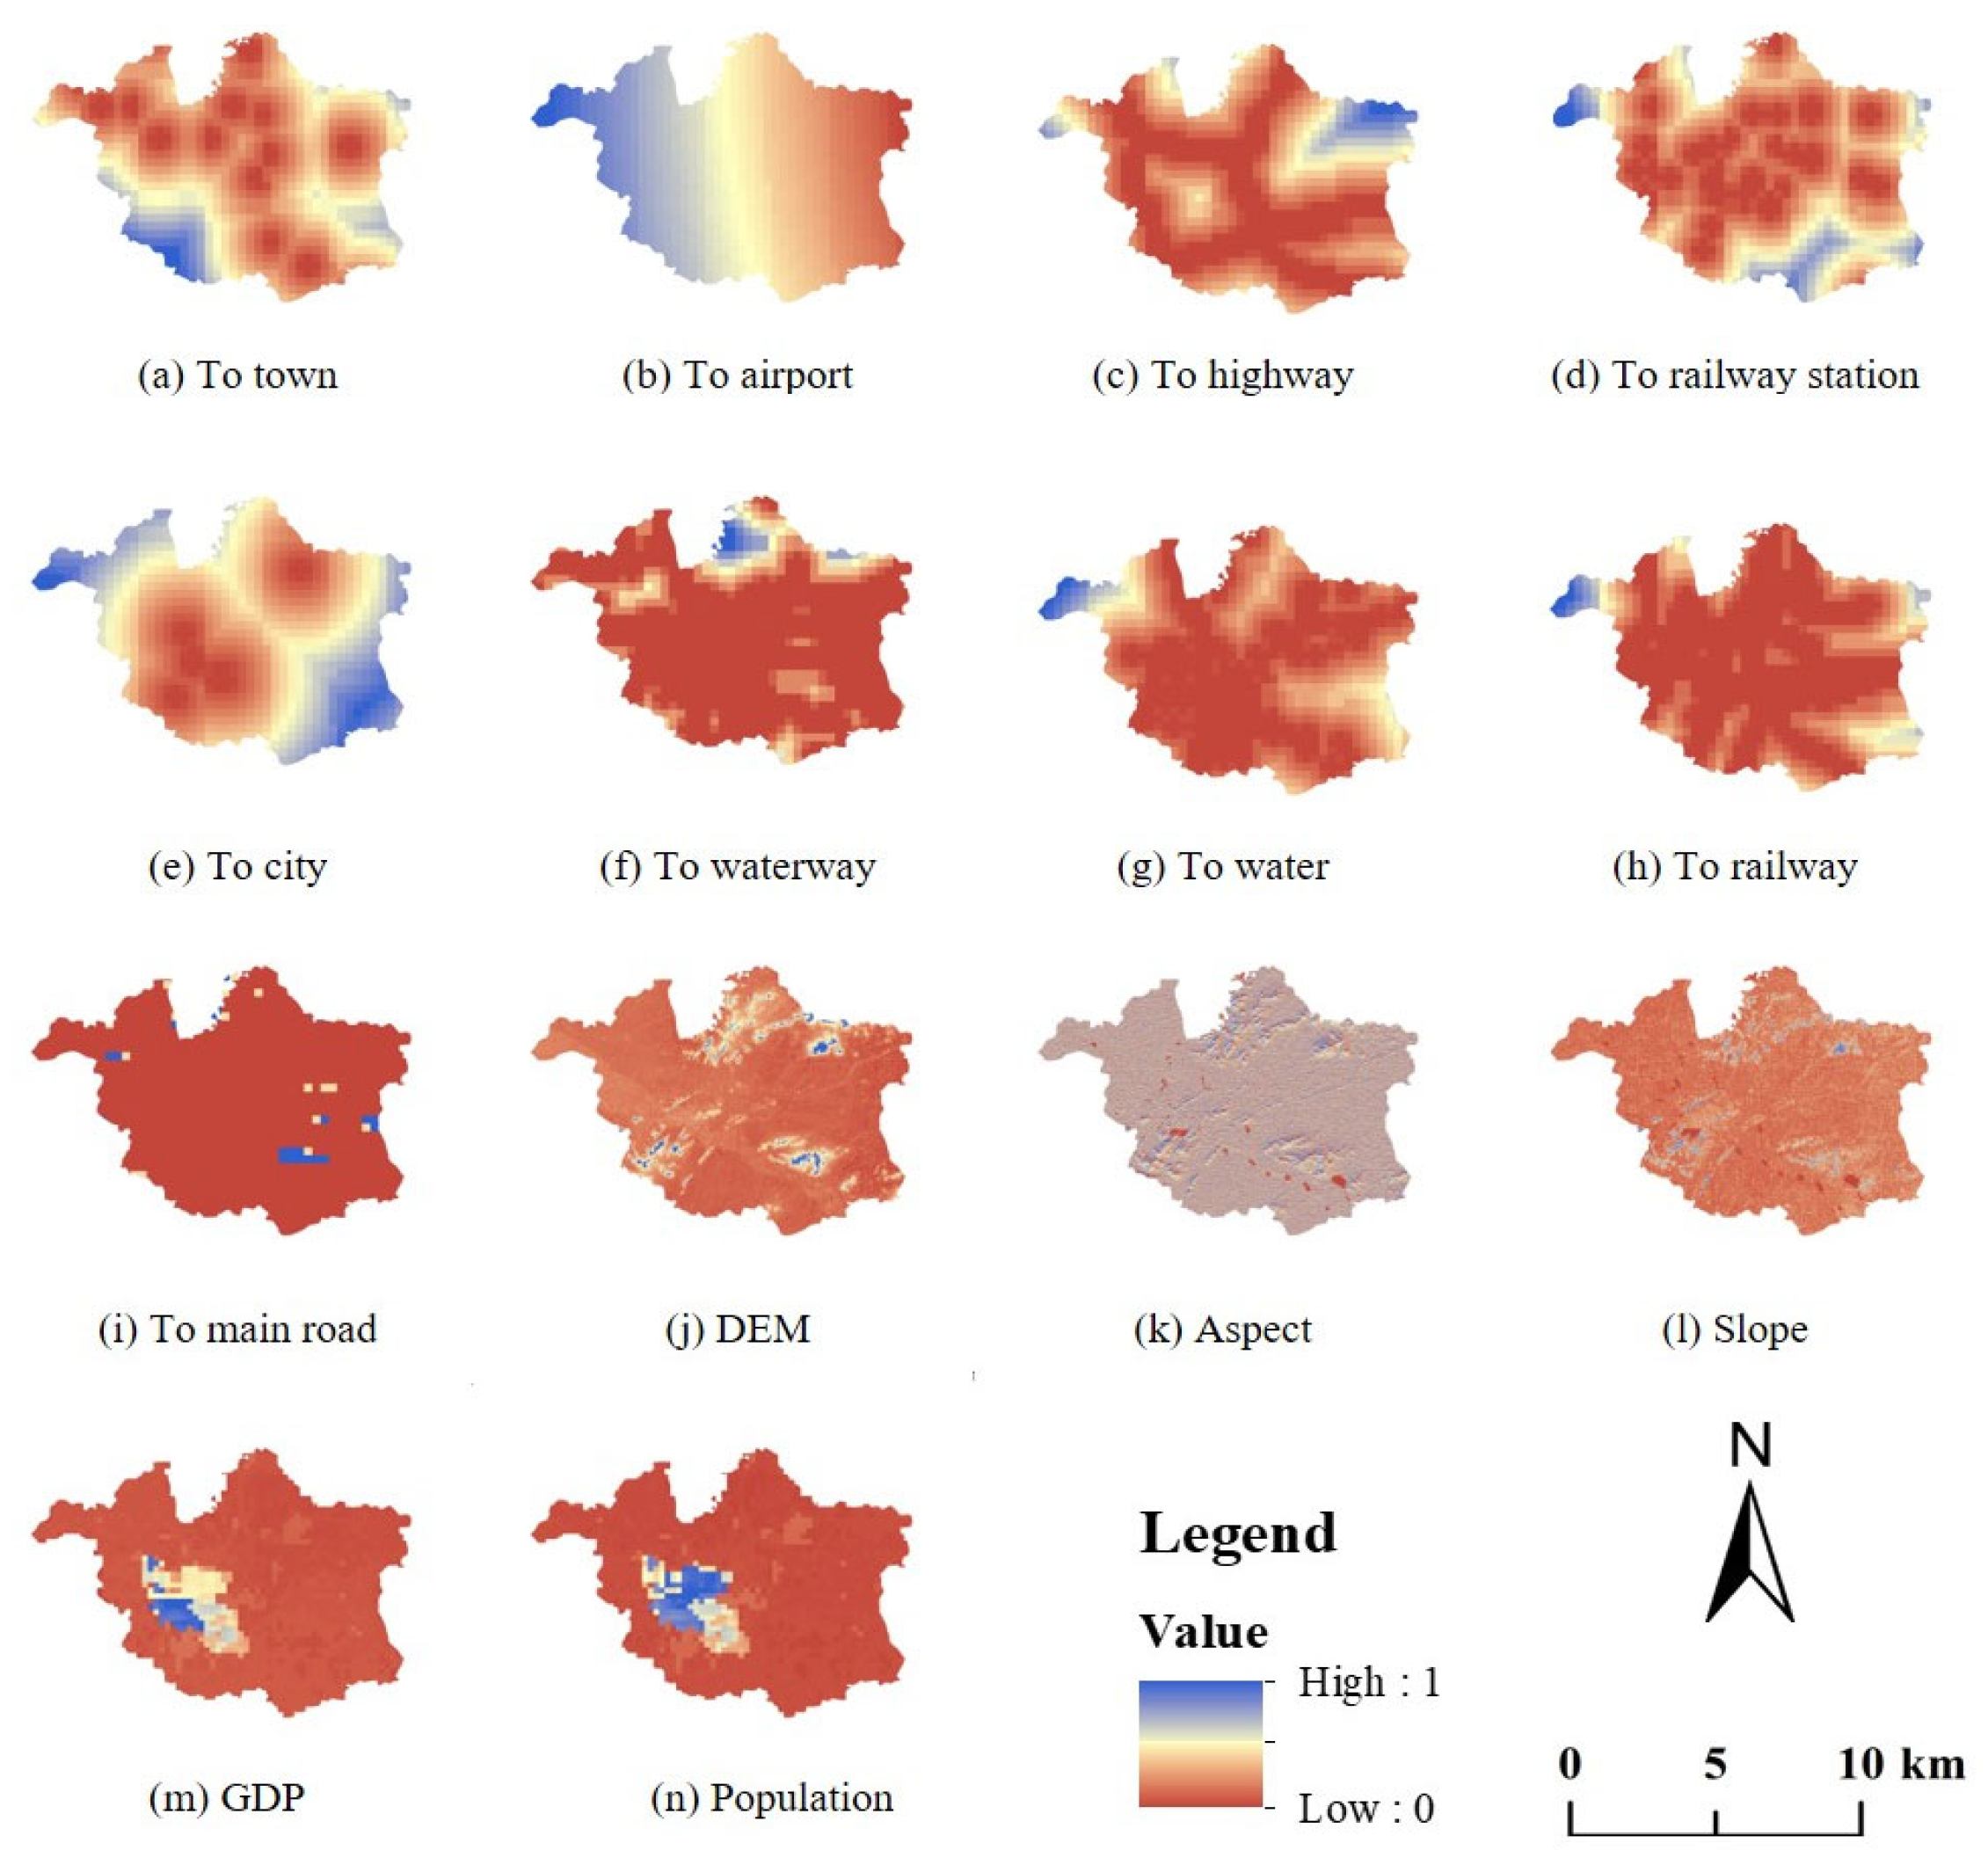
Figure 3.
The flowchart of the methodology.
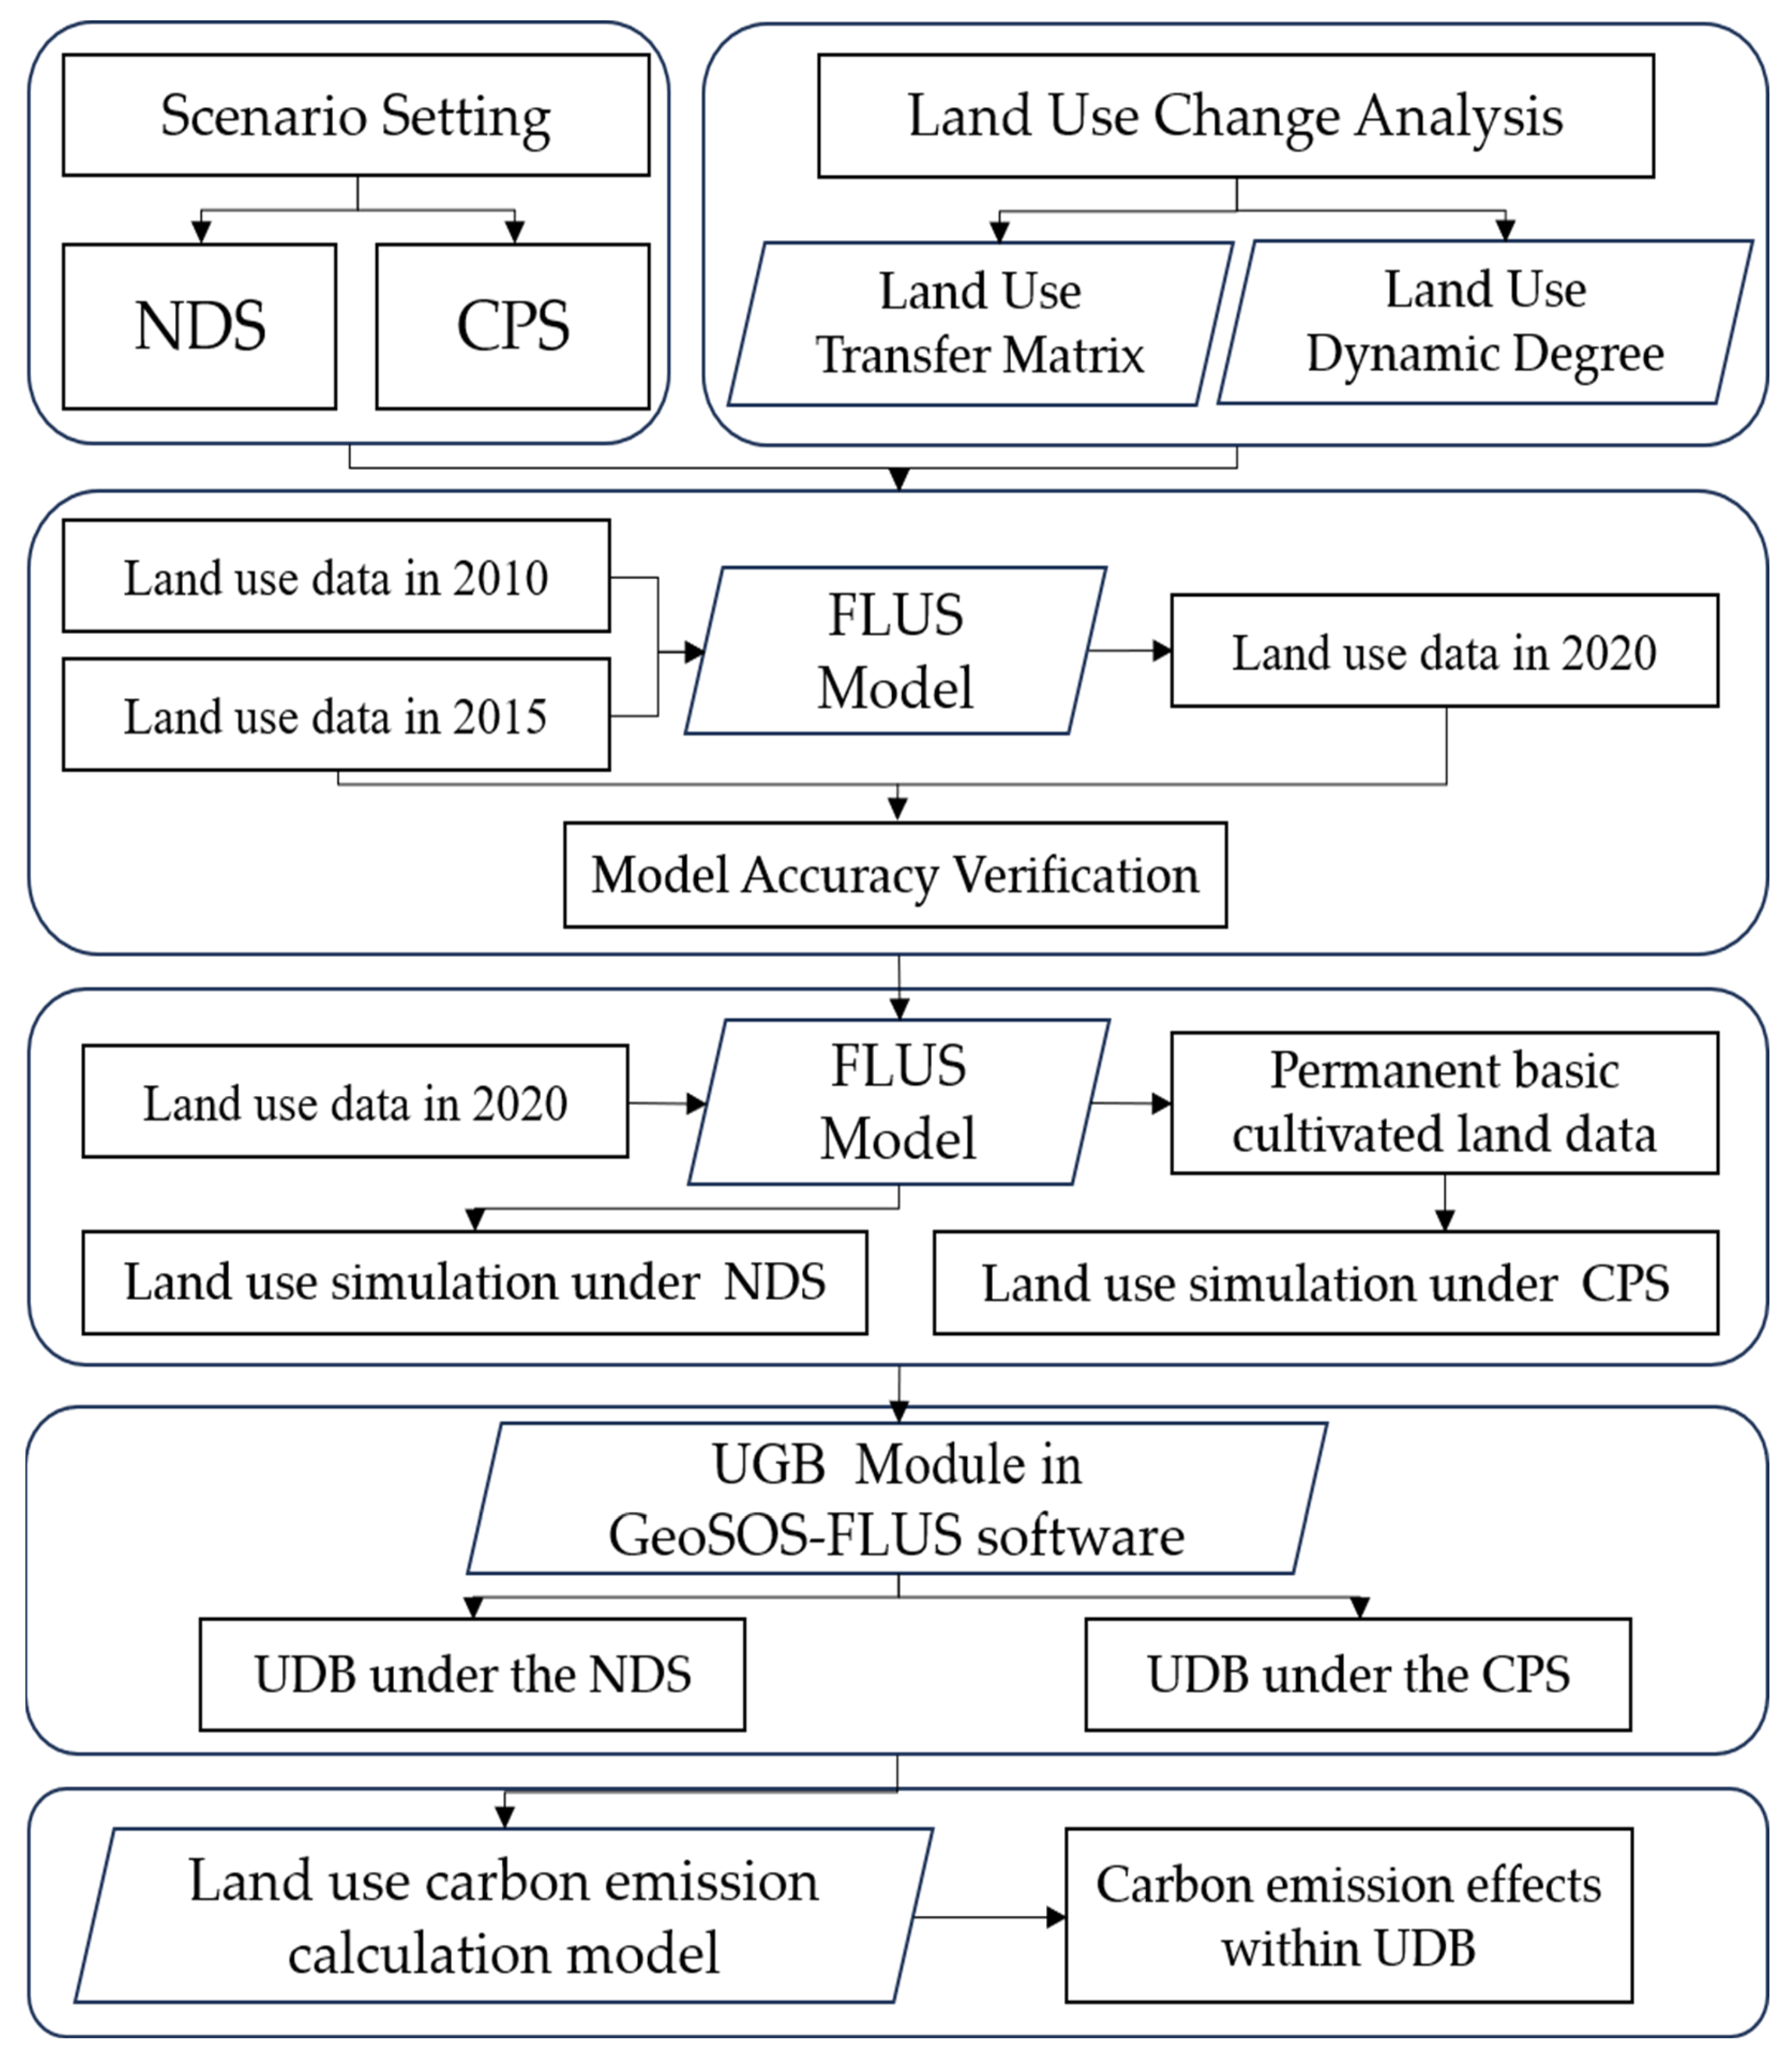
Figure 4.
The land use types in Xuzhou City in 2010, 2015, and 2020. (a) Land use types in Xuzhou City in 2010; (b) Land use types in Xuzhou City in 2015; (c) Land use types in Xuzhou City in 2020.
Figure 4.
The land use types in Xuzhou City in 2010, 2015, and 2020. (a) Land use types in Xuzhou City in 2010; (b) Land use types in Xuzhou City in 2015; (c) Land use types in Xuzhou City in 2020.
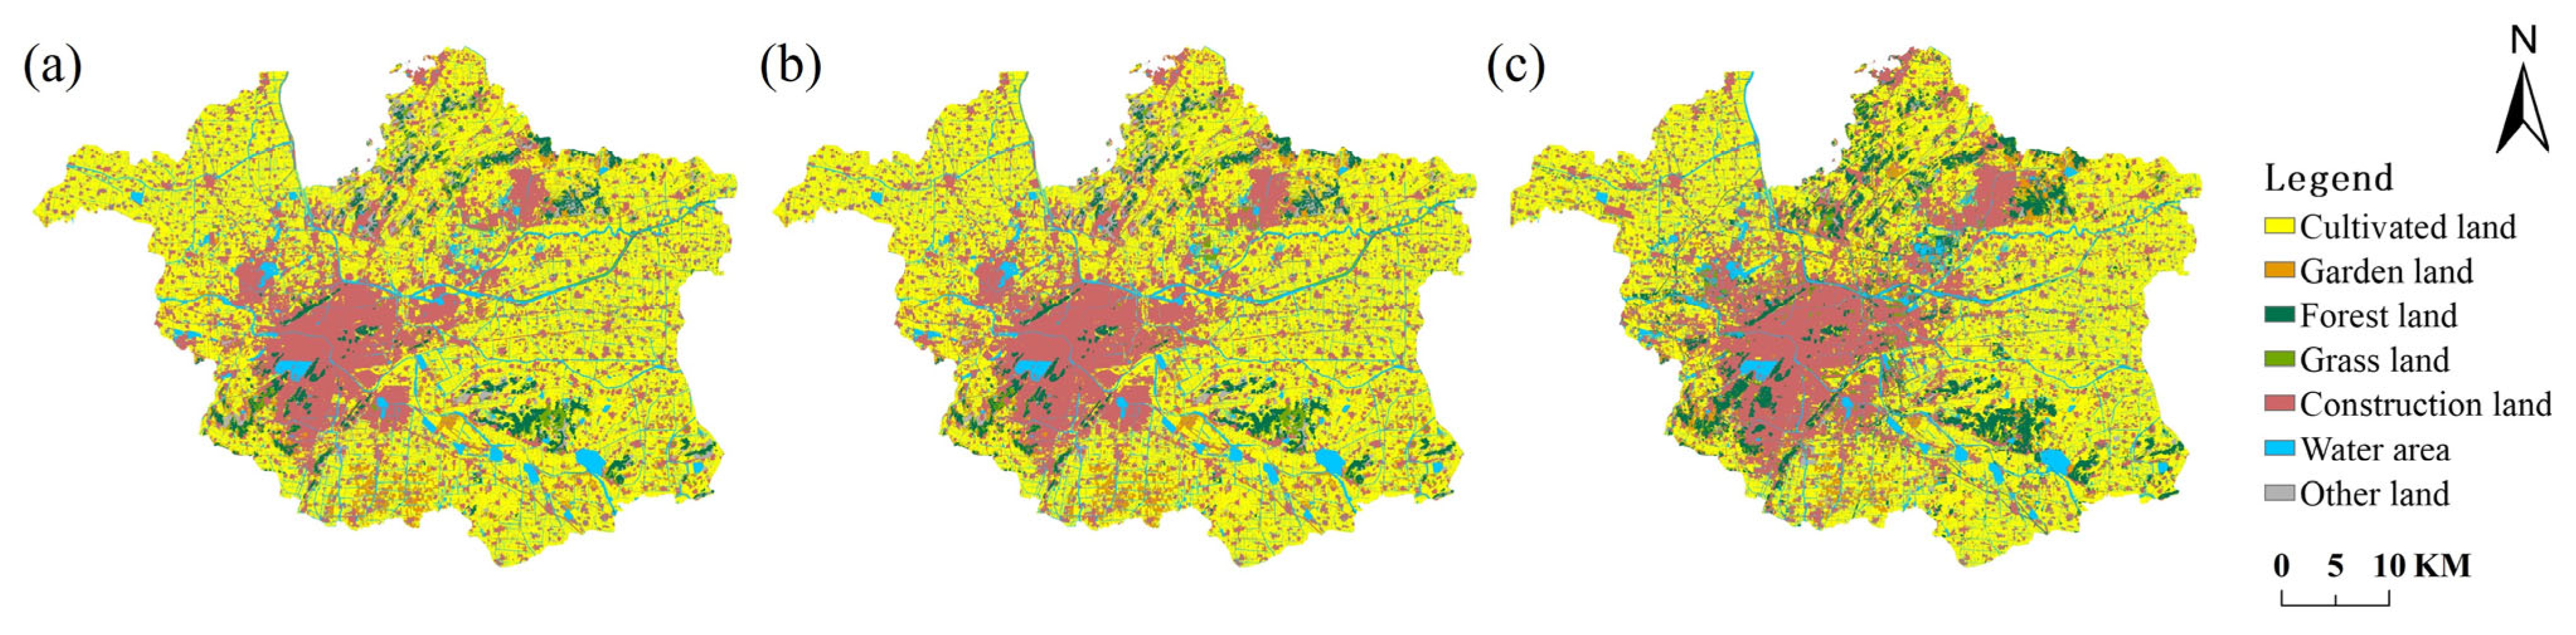
Figure 5.
Comparison of real and simulated land use in Xuzhou City in 2015. (a) Real land use types in Xuzhou City in 2015; (b) Simulated land use types in Xuzhou City in 2015.
Figure 5.
Comparison of real and simulated land use in Xuzhou City in 2015. (a) Real land use types in Xuzhou City in 2015; (b) Simulated land use types in Xuzhou City in 2015.
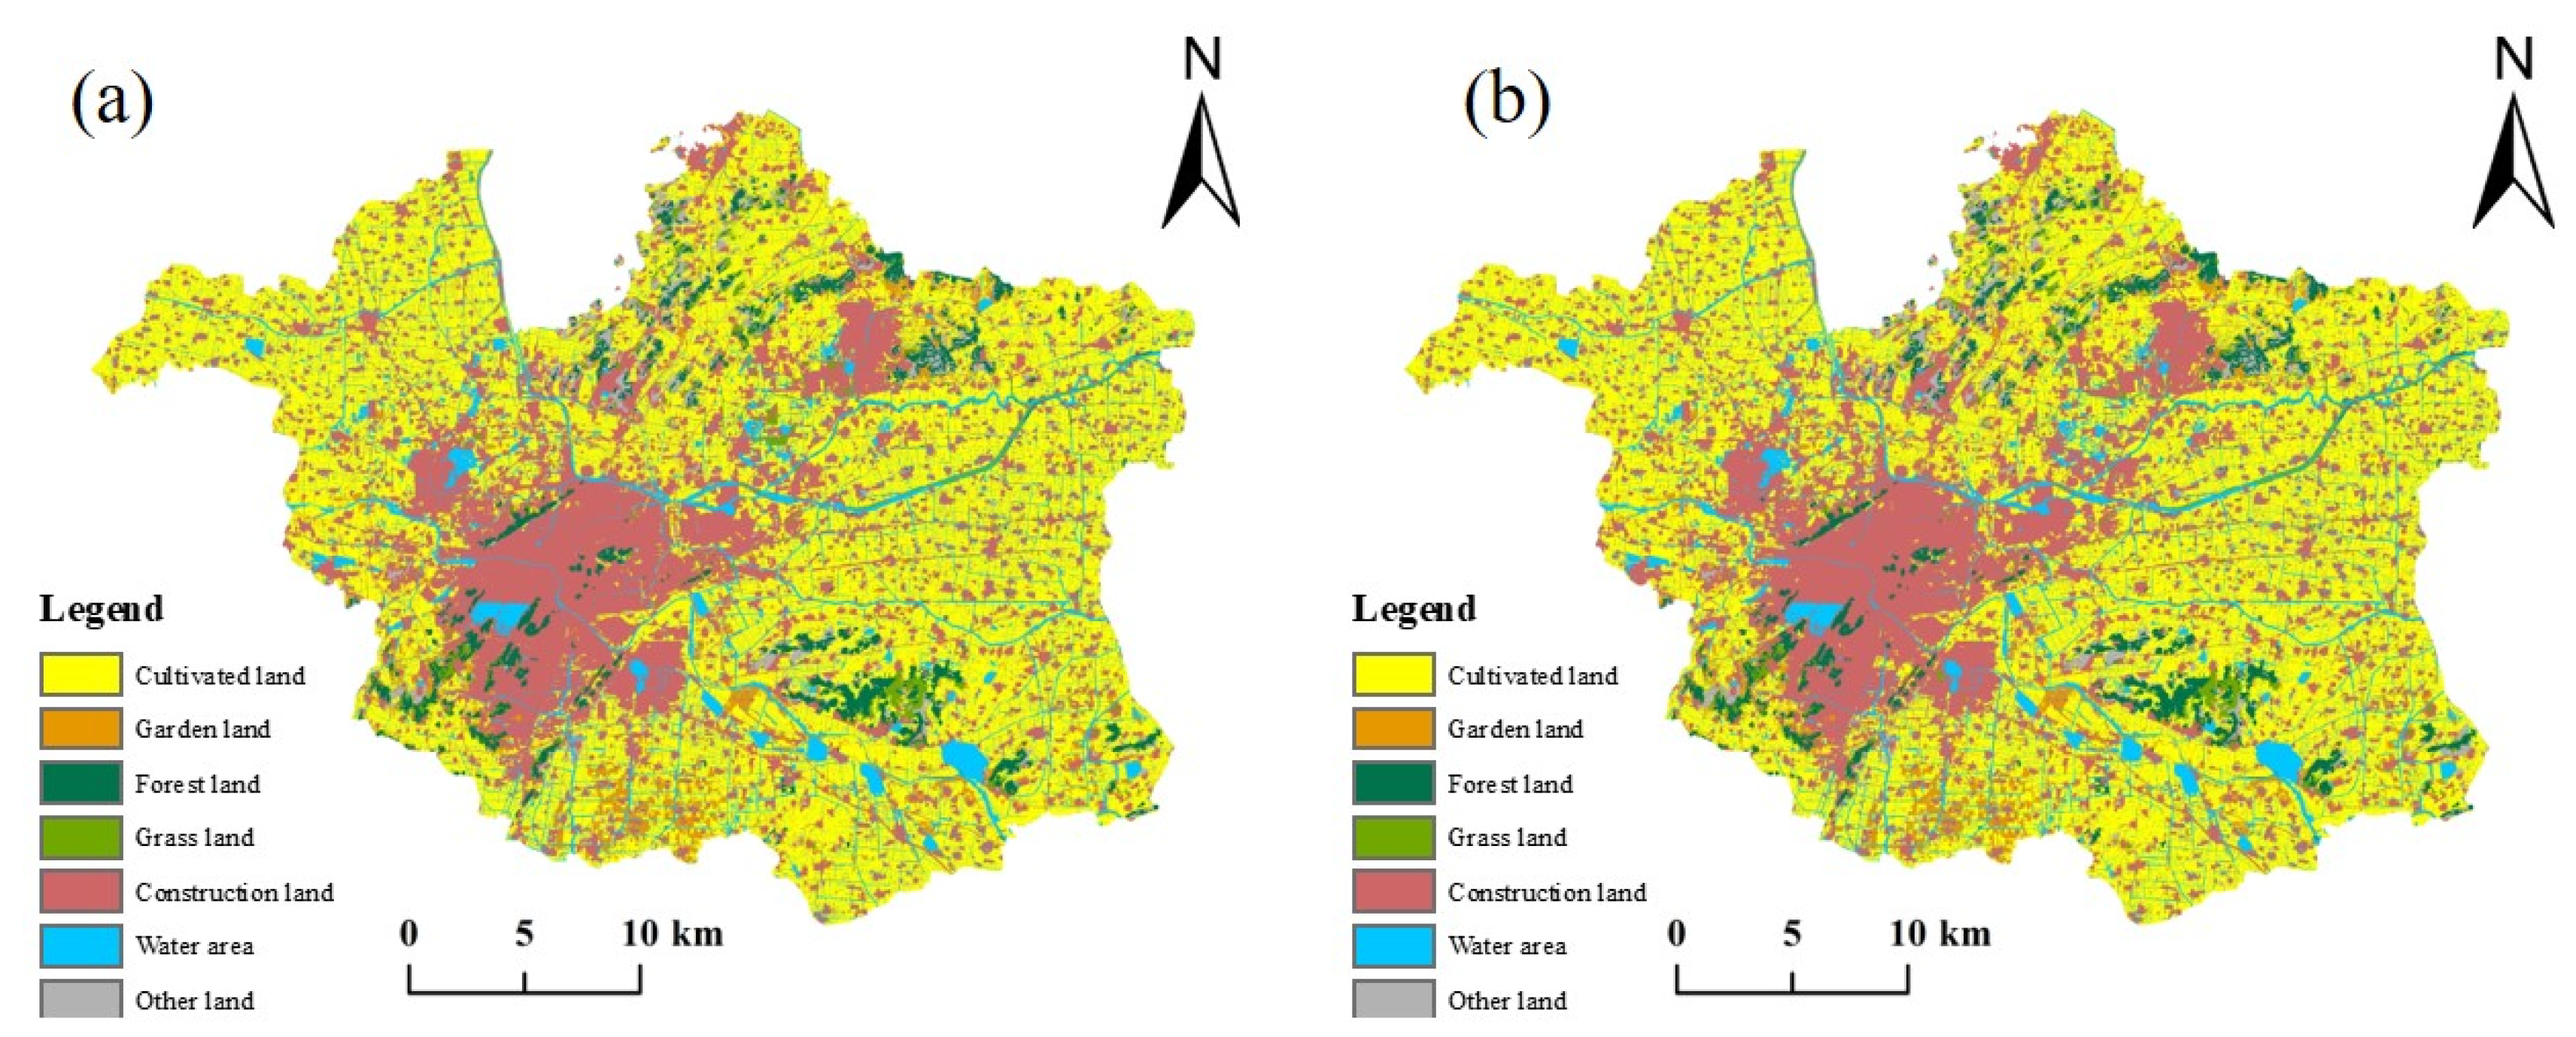
Figure 6.
Simulation of land use in Xuzhou City in 2035. (a) Land use simulation under NDS; (b) Land use simulation under CPS.
Figure 6.
Simulation of land use in Xuzhou City in 2035. (a) Land use simulation under NDS; (b) Land use simulation under CPS.

Figure 7.
UDB under different scenarios in 2035. (a) UDB under the NDS; (b) UDB under the CPS.

Table 1.
Information on data sources.
| Data Attribute | Data Name | Data Source |
|---|---|---|
| Land use data | Land use data of Xuzhou in 2010, 2015, and 2020 | China Land Surveying and Planning Institute |
| Terrain factor data | DEM | Geospatial Data Cloud (https://www.gscloud.cn/, accessed on 18 April 2022) |
| Aspect | ||
| Slope | ||
| Transportation accessibility factor data | To town | Open Street Map (https://www.openstreetmap.org/, accessed on 17 April 2022) |
| To airport | ||
| To highway | ||
| To railway station | ||
| To city | ||
| To waterway | ||
| To water | ||
| To railway | ||
| To main road | ||
| Socio-economic factor data | 1 km × 1 km grid level GDP | Resource and Environment Science and Data Center (https://www.resdc.cn/, accessed on 19 April 2022) |
| 1 km × 1 km grid level population |
Table 2.
Carbon emission coefficient for land use.
| Land Use Type | Carbon Emission Coefficient | Unit |
|---|---|---|
| L1 | 42.2 | t C/km2 |
| L2 | −73 | t C/km2 |
| L3 | −57.8 | t C/km2 |
| L4 | −2.1 | t C/km2 |
| L6 | −25.2 | t C/km2 |
| L7 | −0.5 | t C/km2 |
Table 3.
Xuzhou City Land Use Transfer Matrix from 2010 to 2020 (km2).
| L1 | L2 | L3 | L4 | L5 | L6 | L7 | Total | |
|---|---|---|---|---|---|---|---|---|
| L1 | 1148.95 | 50.12 | 65.50 | 3.62 | 144.96 | 76.64 | 24.64 | 1514.43 |
| L2 | 40.40 | 27.95 | 10.39 | 0.98 | 13.38 | 7.50 | 2.70 | 103.29 |
| L3 | 6.21 | 1.71 | 89.53 | 2.89 | 8.19 | 1.36 | 2.06 | 111.96 |
| L4 | 12.88 | 2.96 | 18.04 | 8.02 | 7.29 | 2.10 | 1.40 | 52.68 |
| L5 | 77.50 | 10.01 | 30.77 | 17.50 | 609.60 | 36.11 | 5.02 | 786.51 |
| L6 | 79.64 | 6.31 | 11.68 | 3.28 | 44.29 | 161.62 | 3.00 | 309.82 |
| L7 | 15.82 | 3.78 | 26.65 | 5.86 | 12.65 | 1.76 | 13.83 | 80.35 |
| Total | 1381.40 | 102.84 | 252.56 | 42.14 | 840.35 | 287.10 | 52.65 | 2959.03 |
Table 4.
Xuzhou City Land Use Dynamic Degree from 2010 to 2020 (%).
| Period | Single Land Use Dynamic Degree | Comprehensive Land Use Dynamic Degree | ||||||
|---|---|---|---|---|---|---|---|---|
| L1 | L2 | L3 | L4 | L5 | L6 | L7 | ||
| 2010–2015 | −0.30 | −0.42 | −0.36 | −0.02 | 0.88 | −0.58 | 0.34 | 0.24 |
| 2015–2020 | −1.48 | 0.30 | 26.30 | −3.88 | 0.38 | −0.89 | −6.74 | 1.09 |
| 2010–2020 | −0.88 | −0.07 | 12.74 | −1.94 | 0.64 | −0.72 | −3.26 | 0.65 |
Table 5.
Carbon Emission Effects within UDB under Different Scenarios (t).
| Scenario | Carbon Emission of Different Land Use Types within UDB | Net Carbon Emission | Carbon Source | Carbon Sink | ||||||
|---|---|---|---|---|---|---|---|---|---|---|
| L1 | L2 | L3 | L4 | L5 | L6 | L7 | ||||
| NDS | 4641.80 | −1477.59 | −4708.43 | −35.79 | 10,473,420.62 | −1430.61 | −4.45 | 10,470,405.55 | 10,478,062.42 | −7656.88 |
| CPS | 5702.13 | −1387.19 | −3608.42 | −34.63 | 10,475,773.36 | −1275.73 | −4.04 | 10,475,165.47 | 10,481,475.48 | −6310.01 |
Disclaimer/Publisher’s Note: The statements, opinions and data contained in all publications are solely those of the individual author(s) and contributor(s) and not of MDPI and/or the editor(s). MDPI and/or the editor(s) disclaim responsibility for any injury to people or property resulting from any ideas, methods, instructions or products referred to in the content. |
© 2023 by the authors. Licensee MDPI, Basel, Switzerland. This article is an open access article distributed under the terms and conditions of the Creative Commons Attribution (CC BY) license (https://creativecommons.org/licenses/by/4.0/).
Share and Cite
MDPI and ACS Style
Ji, H.; Li, X.; Geng, Y.; Chen, X.; Wang, Y.; Cheng, J.; Chen, Z. Delineation of Urban Development Boundary and Carbon Emission Effects in Xuzhou City, China. Land 2023, 12, 1819. https://doi.org/10.3390/land12091819
AMA Style
Ji H, Li X, Geng Y, Chen X, Wang Y, Cheng J, Chen Z. Delineation of Urban Development Boundary and Carbon Emission Effects in Xuzhou City, China. Land. 2023; 12(9):1819. https://doi.org/10.3390/land12091819
Chicago/Turabian StyleJi, Haitao, Xiaoshun Li, Yiwei Geng, Xin Chen, Yuexiang Wang, Jumei Cheng, and Zhuang Chen. 2023. "Delineation of Urban Development Boundary and Carbon Emission Effects in Xuzhou City, China" Land 12, no. 9: 1819. https://doi.org/10.3390/land12091819
Note that from the first issue of 2016, this journal uses article numbers instead of page numbers. See further details here.