
Land Surface Temperature Changes in Different Urbanization Increments in China since 2000
by
 , ,
, ,
Sisi Yu
1,2,3,†,
Zijuan Zhu
1,†,
Zengxiang Zhang
4,
Shangshu Cai
2,5,*,
Fang Liu
4,
Xiaoli Zhao
4,
Xiao Wang
4 and
Shunguang Hu
4 1
Institute of Spatial Information for School of Planning and Design, Hangzhou City University, Hangzhou 310015, China
2
Research Institute of Natural Protected Area, Chinese Academy of Forestry, Beijing 100091, China
3
Key Laboratory of Forest Protection of National Forestry and Grassland Administration, Beijing 100091, China
4
Aerospace Information Research Institute, Chinese Academy of Sciences, Beijing 100094, China
5
Key Laboratory of Forestry Remote Sensing and Information System, National Forestry and Grassland Administration, Beijing 100091, China
*
Author to whom correspondence should be addressed.
†
These authors contributed equally to this work.
Land 2024, 13(4), 417; https://doi.org/10.3390/land13040417
Submission received: 10 January 2024
/
Revised: 8 March 2024
/
Accepted: 12 March 2024
/
Published: 25 March 2024
Abstract
:In the rapidly urbanizing world, as one of the distinct anthropogenic alterations of global climate change, global warming has attracted rising concerns due to its negative effects on human well-being and biodiversity. However, existing studies mostly focused on the difference in temperature elevation among urbanized areas and non-urbanized areas, i.e., rural or suburban areas. The allometric urban warming at intra-urban scales was overlooked. This research aimed to expand our understanding of urbanization–temperature relationships by applying a concept of a “previous-new” dichotomy of urbanized areas. To quantify the land surface temperature (LST) dynamics of 340 cities in China, we analyzed the LST of different land use types through trend analysis and absolute change calculation models. The urban heat island (UHI) effect of two spatial units, i.e., newly expanded urbanized area (“new UA” hereinafter) during 2000–2015 and previously existing urbanized area (“previous UA” hereinafter) in 2000, were compared and discussed. Our findings reveal that urban growth in China coincided with an LST increase of approximately 0.68 °C across the entire administrative boundary, with higher increases observed in regions between the Yellow River and Yangtze River and lower increases in other areas. Moreover, the new UA exhibited significantly greater LST increases and urban heat island intensity (HUII) compared to the previous UA. The dynamics of LST corresponded to the speed and scale of urban growth, with cities experiencing higher growth rates and percentages exhibiting more pronounced LST increases. This study reveals the impact of the underlying surface on human settlements on a large scale.
1. Introduction
Since entering the 21st Century, global urbanization has witnessed an active development, profoundly shaping human well-being [1]. Human activities associated with urbanization, ranging from deforestation and agricultural reclamation to advancements in transportation and communication, have significantly altered the Earth’s surface landscape [2,3]. This inevitably triggered a series of negative effects on human well-being, such as vegetation degradation, water pollution, air noise, and temperature elevation. Among these impacts, the most serious is the uncontrolled increase in land surface temperature (LST), which has been confirmed to cause melting glaciers, heat waves, heavy rainfall, extreme cold, epidemics, and food crises [4,5,6,7]. Governments participating in the Paris Summit reached a consensus that the LST increase should be strictly controlled below 2 °C compared to the Industrial Revolution stage for the purpose of a “safe world”.
The development of remote sensing technology and the geographical information system (GIS) provides an opportunity to monitor the LST dynamic, which serves as the necessary premise for designing macro-controlling measures of urban warming. Remotely sensed images applied to such research are multiple, involving MODIS LST products at low spatial resolutions [8,9], Landsat thermal infrared bands at medium spatial resolutions [10], and Ziyuan-3 (ZY-3) at high spatial resolutions [11], among others. Despite the trend of LST change in individual cities, the spatial heterogeneity of LST variations at the internal city scale has also be widely depicted. One of the research hotspots is the urban heat island (UHI) effect, which is characterized as the phenomenon of urban areas exhibiting higher temperatures than their suburban and rural surroundings. For instance, by combining in situ and remote sensing observations, Huidong et al. [12] reported the spatial consistency of the UHI effect and aerosol pollution during summer in Berlin. Zhengtong et al. [13] monitored the aggravating UHI effect in New York and New Jersey and found that human’s feeling uncomfortable presented an upward trend along with an increasing UHI intensity (UHII). Xueqin et al. [14] conducted an empirical investigation on the decreasing UHII of Kampala and suggested that urbanization does not always lead to the deterioration of environmental conditions. This finding aligns with the similar result reported by Wemegah et al. [15] in the greater Accra region. While the trends of UHI dynamics varied across different study areas, a consensus emerged from the literature review and found that urban areas consistently exert more pronounced thermal effects on the surface compared to their surroundings.
In view of the existing publications, the driving factors leading to diverse UHI and UHII could be multifaceted. For instance, 40-year monitoring data (i.e., during 1978–2017) from 2421 meteorological stations in China [16] implied that urbanization accelerated urban warming by changing wind speed. An investigation of 70 European cities showed that cities with cooler climates or higher urban greenspace proportions were more affected by additional heat during heat waves [17]. Pengke et al. [18] conducted a global spatiotemporal analysis on urban warming and found that impervious surface percentage and surface energy balance jointly contributed to the aggravation of UHI. Especially, research on the thermal properties of asphalt concrete [19] reported that manmade materials and anthropogenic heat production were major causes of UHI. Some researchers explored the impact of land use/cover change-induced UHI. For instance, Wang and Murayama [20] examined the changes in LST and land cover types in Sapporo, Japan based on Landsat series images. Results of his study revealed that green space and water areas could help to cool the city, while urban expansion presented the opposite effect. By conducting a customized water body evaporation model, Han et al. [21] revealed that UHII can be regulated by water evaporation. A consistent conclusion was also reported by Liu, Huang, Yang, and Cao [11], who conducted a quantitative analysis of the relationship between vegetation, artificial surfaces, and LST in 35 major cities in China using Ziyuan-3 (ZY-3) high-resolution satellite observations. These studies suggested a positive correlation between urban expansion and urban heat environment, as well as a negative correlation between forest degradation and LST increase. Beyond those, population size and economic development, as representative indicators of urbanization, have also been proven as pivotal driving factors of UHI footprint and intensity in limited studies [22,23].
The existing literature on UHI and UHII predominantly focuses on allometric LST growth between urban and non-urban areas, typically adopting an “urban-rural” or “urban-suburban” dichotomy [24,25]. However, the intra-urban scale, particularly the difference in LST growth between newly expanded urbanized areas (“new UA”) and previously existing urbanized areas (“previous UA”), remains inadequately explored. The coexistence of new UA and previous UA is a prevalent phenomenon in urban development, showcasing distinctions in urban landscape, residential density, socio-economic factors, and microclimate, consequently influencing heat stress. Pioneering efforts have investigated LST disparities and UHII in specific cities, yet comprehensive larger-scale conclusions are lacking [11,26,27]. Moreover, a comprehensive examination of UHI and UHII variations across cities at different developmental stages and rates is notably absent from the existing research landscape.
Given these aforementioned research gaps, we aimed to expand our understanding of urbanization–temperature relationships at the national scale. As the driving mechanisms of urban warming have been widely illustrated in the existing literature, our research paid major attention to the resultant manifestation of urbanization-induced LST dynamics at intra-urban scales. We selected 340 cities in China as the study area and conducted an interannual investigation at two spatial units, i.e., the previous UA in 2000 and the new UA expanded during 2000–2015. By employing the UHII index for both the previous UA and the new UA, we planned to answer two questions. (1) How does LST act in times of urban growth at the onset of the 21st Century? (2) Are there disparities in LST dynamics among the previous UA and new UA? In this regard, our research objective is to elaborate on the spatiotemporal dynamics of LST in China and reveal the difference in LST dynamics between the previous UA and the new UA. Our study has two contributions. Firstly, this research applied the concept of the “previous–new UA” dichotomy and provided a demonstration study on 340 cities in China. China, acting as one hotspot nation of global urbanization in the 21st Century, is an ideal study area with abundant city sizes and urbanized processions [28,29]. The results of this research could expand our understanding of the relationships between urbanization and climate change. Secondly, this research proposed a reproducible workflow for depicting the spatiotemporal characteristics of UHII at intra-urban scales.
2. Materials and Methods
2.1. Study Area
This study monitored the changeable LST in China. There are a total of 340 established administrative units, including 293 cities at the prefecture level, 7 prefectures, 30 autonomous prefectures, 3 leagues, 4 municipalities, 2 special administrative regions, and Taiwan Province. For simplification, we apply the term “cities” to indicate all these administrative units. Although Taiwan Province, the municipalities, and special administrative regions belong to the provincial level, we regarded them as cities in this study, considering that their administrative coverages are closer to the city level. The selection of established administrative units was based on the “Administrative Division of the People’s Republic of China Handbook 2015” [30].
2.2. Data and Data Preprocessing
The global MYD11A2 products (Table 1) in 2003–2018 were applied to monitor the dynamic of land surface temperature (LST) and its response to urban expansion. The MYD11A2 LST dataset has a spatial resolution of 1 km and is provided by the National Aeronautics and Space Administration accessed on 4 July 2019 (NASA, https://ladsweb.modaps.eosdis.nasa.gov/) for free. In addition, the products have been validated. Each pixel value in this dataset is an average of daytime or nighttime LST collected within an 8-day period. Owing to its high accuracy and applicability for indicating LST dynamic and urban heat island effects [31,32], the dataset has been widely used by existing studies [33,34] (Meng et al., 2018; Yang et al., 2019). Considering the fact that settlements’ production and activities majorly happen in the daytime, we only focus on the dynamic of annual daytime LST. Data preprocessing mainly referred to [16], who masked the cloud cover and converted the Fahrenheit (°F) to Celsius (°C). The LST dataset was converted to Albers projection at the WGS-84 coordinate before performing trend analysis. We used ArcGIS 10.8 software to combine vector and remote sensing images so that we can calculate the temperature of each city based on the city boundaries.
The urban land dataset was extracted from the national land use/cover database of China (NLUD-C) at a 1:100,000 scale [35]. The NLUD-C database (Table 1) was visually interpreted from multi-source remotely sensed images (e.g., Landsat, CBERS, and Huanjing-1) by the Aerospace Information Research Institute of the Chinese Academy of Sciences. In this database, urban land is defined as the place for urban resident life and activities [35]. Meantime, the minimal urban land patch is determined as 400 m2 in this database. The cross-validation shows that the overall accuracy of urban land exceeds 90%. Urbanization is a complex process involving multiple aspects, such as population growth, urban expansion, and socio-economic development, among others. In this study, we characterized the urbanization-induced LST dynamic from the intra-urban perspective. We based the monitoring and analysis of the LST dynamic on two spatial units, i.e., the previous UA in 2000 and the new UA expanded during 2000–2015. The administrative boundaries applied to delineate the previous UA and new UA at the city scale were obtained from the Resource and Environment Science and Data Center (http://www.resdc.cn/data.aspx/) accessed on 5 January 2019. The population at the city scale in 2015 was from the National Bureau of Statistics (http://www.stats.gov.cn/ (accessed on 5 January 2019)).
2.3. Methodology
2.3.1. Delineation of the Spatial Units for Analysis
This study majorly focused on the LST dynamic in China and its response to urbanization. The comparative analysis of the LST dynamic mainly considered two aspects, containing (1) the basic characteristics of the LST dynamic in China and (2) the difference in LST dynamics among different urbanized areas. Regarding the LST dynamic at the national level, we performed statistics within the entire boundary of China. From the perspective of urban forms and functions, we followed the “previous-new” dichotomy, where both the previous UA and new UA were treated as whole spatial units against each other. Specifically, we understand the previous UA as the region that suffered early urbanization until 2000 and has already accumulated a certain size of urban dwellers. The business and political activities mostly happened in the previous UA. Differently, we understand the new UA as the region that suffered land conversion of the vegetated surface (or other non-urbanized) to the built-up surface during the period of 2000–2015. Generally, the expansion of urbanized areas stimulates urban population increase at the same time. In this regard, the urbanization progress of the previous UA and new UA are different. In view of the analysis on the city scale, the previous UA and new UA were extracted by spatial overlay analysis. Beyond that, the expansion of urban land is diverse across Chinese cities and thus impacts LST. For the purpose of further exploring the LST dynamic related to urbanization increments, we based our analysis on two urbanization indicators, i.e., urban growth speed and urban expansion percentage. Accordingly, the 340 cities in China were divided into 9 levels of urban growth speed and 9 levels of urban expansion percentage, respectively. The divisions of urban growth speed and expansion percentage are shown in Figure 1. For simplification, we apply the terms “Speed Level One-Nine” and “Percentage Level One-Nine”.
2.3.2. Quantification of the Urban Heat Island Intensity (UHII)
The urban heat island effect is defined as the phenomenon that urban areas tend to have higher LST compared to the whole administrative boundary [36]. Accordingly, we applied Formula (1) to calculate the urban heat island intensity (UHII) of the previous UA and new UA.
Where indicates the UHII of the previous UA or new UA; indicates the LST of the previous UA or new UA; and indicates the LST within the entire administrative boundary. The should be positive if the urban heat island existed.
For the purpose of distinguishing the response of the LST dynamic to urbanization increment, we quantified the difference of UHII between the previous UA and new UA in Formula (2).
where indicates the difference in UHII between the previous UA and new UA and and indicate the UHII of the previous UA and new UA, respectively.
In order to impair the impact of abnormal LST values on the calculation of absolute LST change at city scales, we used a three-year average to replace the LST in single years.
2.3.3. Quantification of the LST Dynamic Trend
The LST dynamic trend from 2003 to 2018 was quantified using the Mann–Kendal (MK) and Sen’s slope estimator nonparametric test models, and the feasibility for trend analysis of short time series has been widely validated and approved [29,37] because it does not rely on any hypotheses about the variables and is suitable for data in a random order [38,39]. Sen’s slope was calculated in Formula (3).
where indicates Sen’s slope of the annual LST and and indicate the LST in the th year and th year, respectively. A positive value of means an increased trend in the LST, and vice versa.
The MK model assumes that there was no significant dynamic trend of the LST from 2003 to 2018. However, this assumption would be rejected when the significance level was below 0.05 in a two-tailed t-test. Accordingly, the dynamic trend of the LST was recognized into significant increase, non-significant increase (“slight increase” hereinafter), significant decrease, and non-significant decrease (“slight decrease” hereinafter).
3. Results
3.1. Basic Characteristics of the LST Dynamic in China
The dynamic of LST in China showed an apparent difference in space (Figure 2a). In general, the LST in flat areas tended to increase, while the terrains with higher altitudes showed a decreasing trend. From 2003 to 2018, the high absolute increase in the LST mainly occurred in the North China Plain, Inner Mongolia, Pearl River Delta, and parts of Tibet and Sichuan Provinces. These regions mostly suffered high urbanization and fast economic development during the past years owing to the approval of national urban agglomerations and new areas [40], including but not limited to the Yangtze River Delta Urban Agglomerations, Pearl River Delta Urban Agglomerations, Chengdu-Chongqing Urban Agglomerations, and Xiong’an New Area. The low absolute decrease in LST could be found in the northeast of China, Xinjiang, the Yunnan–Guizhou Plateau and its surroundings, and parts of the Qinghai–Tibet Plateau and Loess Plateau. Such regions are majorly located in high altitudes or latitudes, where urban settlements and urbanization activities are relatively rare.
Temporally, the average LST in China could be divided into three stages (Figure 2b). In the first stage in 2003–2008, the average LST in China increased relatively slowly. In the second stage in 2008–2011, the average LST in China suffered a serious decrease. In the third stage in 2011–2018, the average LST in China showed a fast increase. In total, the average LST in China increased from 22.36 °C in 2003 to 23.04 °C in 2018, with an absolute increase of nearly 0.68 °C in total. The slope of linear regression is close to 0.02. According to the previous publications [41,42], the decrease in the LST circa 2009–2010 could be attributed to the sustained cold winter in Northeast China, which suffered abnormal circulation from the Pacific Sea and Atlantic Sea. Spatially, over half of the land in China exhibited an increasing trend, i.e., 48.16% showed a slight increasing trend and 6.98% showed a significant increasing trend (Figure 2c). Additionally, nearly 4.71% of the land in China showed a slight decreasing trend. The significant decreasing trend occurred in only 4.71% of the land in China.
3.2. Interannual UHII at National Scale
The dynamic of HUII in urbanized areas was similar to the entire administrative boundary of China, increasing from 2003 to 2018 with the “valley” values occurring during 2009–2011 (Figure 3a). However, urban areas suffered a heavier LST increase than the AB. In the previous UA, the slope of linear regression was close to 0.04 and the absolute increase in LST during 2003–2018 exceeded 0.89 °C. Compared to the previous UA, the LST increase in the new UA was more apparent, with a linear regression slope of over 0.12 and an absolute increase high to 1.80 °C.
Both the previous UA and new UA exhibited obvious urban heat island effects. Figure 2b shows that the UHII of the previous UA remained positive from 2003 to 2018, similar to that of the new UA. This phenomenon implies that the LST in urban areas was still higher than the suburban and rural areas. During the monitoring phase, the lowest UHII exceeded 2 °C and occurred in 2006. Afterwards, the HUII soared in fluctuance, with three “peak” values occurring in 2009, 2012, and 2015, respectively. The HUII of the previous UA grew from 2.32 °C in 2003 to 2.53 °C in 2018, while that of the new UA increased from 2.09 °C to 3.21 °C. As a conversion from natural land cover to an impervious surface, the new UA suffered the most active urbanization construction during the past years. The slopes of the linear regression indicate that the HUII of the new UA (slope 0.10) increased faster than the previous UA (slope 0.03). Moreover, the difference of UHII between the new UA and the previous UA presented a stable increasing trend (Figure 2c). In 2003, the UHII in the previous UA was a little higher than the new UA, with a difference of nearly 0.24 °C. Since 2008, the UHII in the new UA surpassed the previous UA and showed a linear increase with a slope of nearly 0.07. In addition, the area proportion of the LST increase trend in urban areas was much larger than in the entire administrative unit of China (Table 2). In the previous UA, the area proportion of the significant and slight increasing trends is 30.78% and 43.96%, respectively. LST increase trends are more serious in the new UA, with an area proportion of over 94%.
3.3. LST Dynamic across Cities in China
Distinct differences in the LST dynamic could be seen across cities in China (Figure 4). Cities with a high LST increase could be found in the central and eastern parts of China. These cities are mostly located in provinces bordering the middle and lower reaches of the Yellow River and Yangtze River, including Shandong, Jiangsu, Zhejiang, Anhui, Henan, Hubei, Hunan, Chongqing, the south of Shanxi, and the east of Sichuan. Additionally, cities in the southeast coastal and Pearl River Delta also presented relatively high LST increases. All these abovementioned regions are in relatively flat terrains that suffered faster urbanization and economic development. Meantime, the population of these cities is denser than in other cities. In comparison, cities located in the northeast, north, and west of China showed lower LST increases. Case cities even suffered an LST decrease. The famous Qinghai–Tibet Plateau and Inner Mongolia Plateau are located here. Spatially, the city-scale patterns of LST absolute changes in the previous UA and new UA were similar. Numerically, the absolute increase in the LST in the new UA tended to be higher than the previous UA from 2003 to 2018. Specifically, the LST increase of the previous UA was close to 0.59 °C per city on average. Meanwhile, that of the new UA reached 1.08 °C, nearly 1.83 times that of the previous UA.
Figure 5 exhibits the area proportions of different LST dynamic trends at city scales during 2003–2018. The area proportions of LST dynamic trends across Chinese cities corresponded well with their absolute changes. In terms of the previous UA (Figure 5a–d), cities in Shandong, Jiangsu, and Henan Provinces showed higher area proportions of significant LST increase. Those in Liaoning, Hebei, Shanxi, Sichuan, Hubei, Hunan, Jiangxi, Guangdong, and Fujian Provinces showed higher area proportions of slight LST increase. Cities in other regions of China were dominated by a slight or significant LST decrease trend. In total, this spatial distribution implies that the LST increase drops from the central and eastern of China to the surroundings. The spatial distribution of four LST dynamic trends in the previous UA was similar to the new UA (Figure 5e–h). However, the LST increase was quantified and more apparent. For instance, compared to the previous UA as shown in Figure 5a, cities dominated by a significant LST increase trend occupied larger space in the new UA, as shown in Figure 5e. In reverse, those dominated by a significant and slight LST decrease trend occurred in fewer cities in the new UA (Figure 5g,h) than in the previous UA (Figure 5d,c).
3.4. City-Scale UHII Related to Urban Growth Speed
Based on our statistics, the number of cities expanded by Speed Level One-Nine are 116, 87, 40, 29, 17, 11, 9, 9, and 22, respectively (as shown in Figure 1a). These data indicate that most cities in China expanded by less than 5 km2 per year. Such cities were distributed widely in space and mainly dominated western and northeastern China. Cities, expanded with a higher speed of over 10 km2 per year, mainly concentrated in eastern China. In central, western, and northeastern China, cities that expanded with a speed of over 10 km2 per year were mostly provincial capitals and municipalities. Spatially, the distributions of Speed Level One-Nine show relatively strong correlations with the LST dynamics, as shown in Figure 4.
The correlations were further supported in Figure 6, which exhibits the mean UHII of cities carrying different urban growth speeds. An apparent difference in UHII can be seen across Speed Level One-Nine. Specifically, the increase in urban growth speed would enhance the HUII when the urban growth speed is relatively low, i.e., less than 5 km2 per year in Speed Level One-Two. For the previous UA, the HUII increased from 0.21 °C in Speed Level One to 0.39 °C in Speed Level Two. For the new UA, the UHII increased from 0.46 °C in Speed Level One to 0.97 °C in Speed Level Two. Subsequently, the UHII of the previous UA dropped in fluctuance along with the increase in urban growth speed. Meanwhile, the new UA remained the high UHII with slight fluctuance. In total, the difference in UHII between the new UA and the previous UA kept in step with the urban growth speed. In addition, the statistics based on different LST dynamic trends also supported the above speculation (Figure 7). Cities growing at a higher speed always had larger area proportions of the LST increase trend and tended to suffer a significant LST increase. In reverse, cities that have a lower urban growth speed generally showed larger area proportions of LST and a decreasing trend. Beyond that, with respect to Speed Level One-Nine, the new UA showed larger area proportions of LST increase trend than the previous UA and the entire administrative boundary.
3.5. City-Scale UHII Related to Urban Expansion Percentage
The number of cities expanded by Percentage Level One-Nine are 54, 106, 77, 40, 22, 14, 12, 8 and 7, respectively (as shown in Figure 1b). These data indicate that most cities in China expanded by less than 200% from 2000 to 2015. Moreover, nearly 1/3 of the cities in China expanded by 0.5~1 times their basic urban lands in 2000. Such cities had a wide distribution in space, i.e., they dominated central, western, and northeastern China. Cities with higher urban expansion percentages exceeding 300% could be categorized into two kinds. The first kind is mainly clustered in the highly urbanized regions and their surroundings, such as Zhejiang Province, the southeast coast, and the Pearl River Delta. Cities located in these regions are in an active urbanization status and have expanded relatively fast. The second kind is mainly clustered in the regions with low urban land sizes, such as Yunnan and Ningxia Provinces in western China. For these cities, the ratio of the new UA to the limited previous UA is relatively high. Compared to urban growth speed, the urban expansion percentage showed weaker correlations with the LST dynamics, as shown in Figure 4.
Figure 8 displays the mean UHII of cities carrying different urban expansion percentages. To a certain extent, the UHII in both the previous UA and new UA kept step with the increase in urban expansion percentages. This phenomenon was especially apparent when the urban expansion percentage ranged from 0 to 300%. However, when the urban expansion percentage surpassed 300%, the UHII in the new UA decreased significantly. Meanwhile, the UHII in the previous UA remained increasingly stable. Therefore, the UHII difference between the new UA and previous UA presented a decreasing trend. According to the statistics based on different LST dynamic trends (Figure 9), the area proportions of increasing trends in the new UA, previous UA, and administrative boundary all stopped increasing when the urban growth percentage was larger than 300%.
4. Discussion
4.1. Comparisons of This Work to Other Existing Studies
In this study, we monitored the LST dynamic in China and analyzed its response to urban growth. Based on the MODIS LST products and land use database, we tried to answer the two questions proposed in the Introduction. The data processing and analysis were different from the existing publications in several details.
Firstly, for the LST dynamic in China, we quantified both the absolute change and the dynamic trend of the LST. Compared to most existing studies that only focused on one aspect as elaborated in the Introduction, the synergistic application of both aspects could validate the credibility of the results and lead to a relatively reasonable analysis.
Secondly, in view of the existing studies, the UHII was usually calculated as the LST in urban areas was higher than in suburban or rural areas. Given the diversity of settlements’ life and activity within urban areas, our analysis was based on two spatial units of the urban land that already existed at the beginning of the monitoring phase (i.e., 2000) and newly developed urban land during the monitoring phase (i.e., 2000–2015). That is, the previous UA is considered to be a relatively mature urban area that developed earlier and has already accumulated large amounts of urban residents, while the new UA is regarded as a newly developed urban area that has suffered denser urbanization construction accompanied with increasing urban residents and urban activities during the past years. In this way, the quantified results could reveal the LST dynamic in response to various urbanization activities.
Thirdly, the divisions of suburban and rural areas were various in the existing publications, such as a certain proportion of impervious surface [36] or certain buffer zones away from the urban core [25]. Moreover, the urban areas were sometimes delineated from the nighttime light images, which generally led to a larger coverage than the reality [43]. In this study, the previous UA and new UA were both extracted from the land use database with a high accuracy of over 90%. That is, the border of the urban areas was strictly in accordance with the reality, which led to a more appropriate UHII at the national and city scales. Despite the UHIIs of both the previous UA and the new UA, we also analyzed the difference in LST increase between these two spatial units aimed at digging out more abundant information.
4.2. LST Dynamic Related to Urban Growth in China
The changing of albedo, vegetation activity, impervious surface density, and anthropogenic heat emissions are the major factors affecting the LST dynamic in China. Results of this study presented a strong regularity that the LST increase in the new UA was always ahead of the previous UA, although the HUII of the previous UA was higher than the new UA before 2008 (Figure 2b). At the beginning of the monitoring phase during 2003–2008, the impervious surface within the previous UA was apparently denser than the new UA, which indicated a lower albedo with higher heat storage and less heat loss [44]. Additionally, the previous UA had a denser population accompanied by more anthropogenic heat emissions from production and living. Along with urban growth, the albedo and vegetation activity in the new UA changed drastically. That means, compared to the previous UA, whose urbanization activity had entered a relatively stable status, the increase in urbanization activity and loss of trees and grasslands was especially apparent in the new UA. In response, the increase in vehicle and burning coal emissions in the new UA was more serious than in the previous UA. Therefore, the faster LST increase in the new UA from 2003 to 2018 was rational. This finding also supported the previous studies [45,46].
The economic development, grain product, and source of the new UA also influence the LST dynamic greatly. In view of the spatiotemporal characteristic shown in Figure 3 and Figure 4, we found that cities of eastern China and central China had a higher LST increase than others, especially those concentrated in Shandong, Jiangsu, Zhejiang, Anhui, Henan, Hubei, Hunan, and so on. These provinces, bordering the Yellow River to the north and the Yangtze River to the south, have flatter terrains and abundant rivers and lakes. Due to the superior heat and precipitation conditions, they are recognized as the famous grain-producing areas of China that have a dense population in urban areas and have suffered faster urbanization progress. Both in the previous UA and new UA, the economic development and population density in these cities are much more compared to other regions in China. Researchers [47] elaborated that the new UA in the north plain, middle, and lower reaches of the Yangtze River and Yellow Plateau was mainly converted from the cropland. These regions were consistent with the distribution of the aforementioned cities in space, which showed high LST increases and UHIIs during the monitoring phase. This implies that cropland loss due to urban expansion might lead to a higher LST increase than other land cover types. Fall et al. [48] conducted a comparative estimation of the urban expansion in the USA and found that the new UA, by occupying the cropland, exhibited a higher LST increase (nearly 0.103 °C) than those from forests (0.066 °C). This estimate strongly supported our findings.
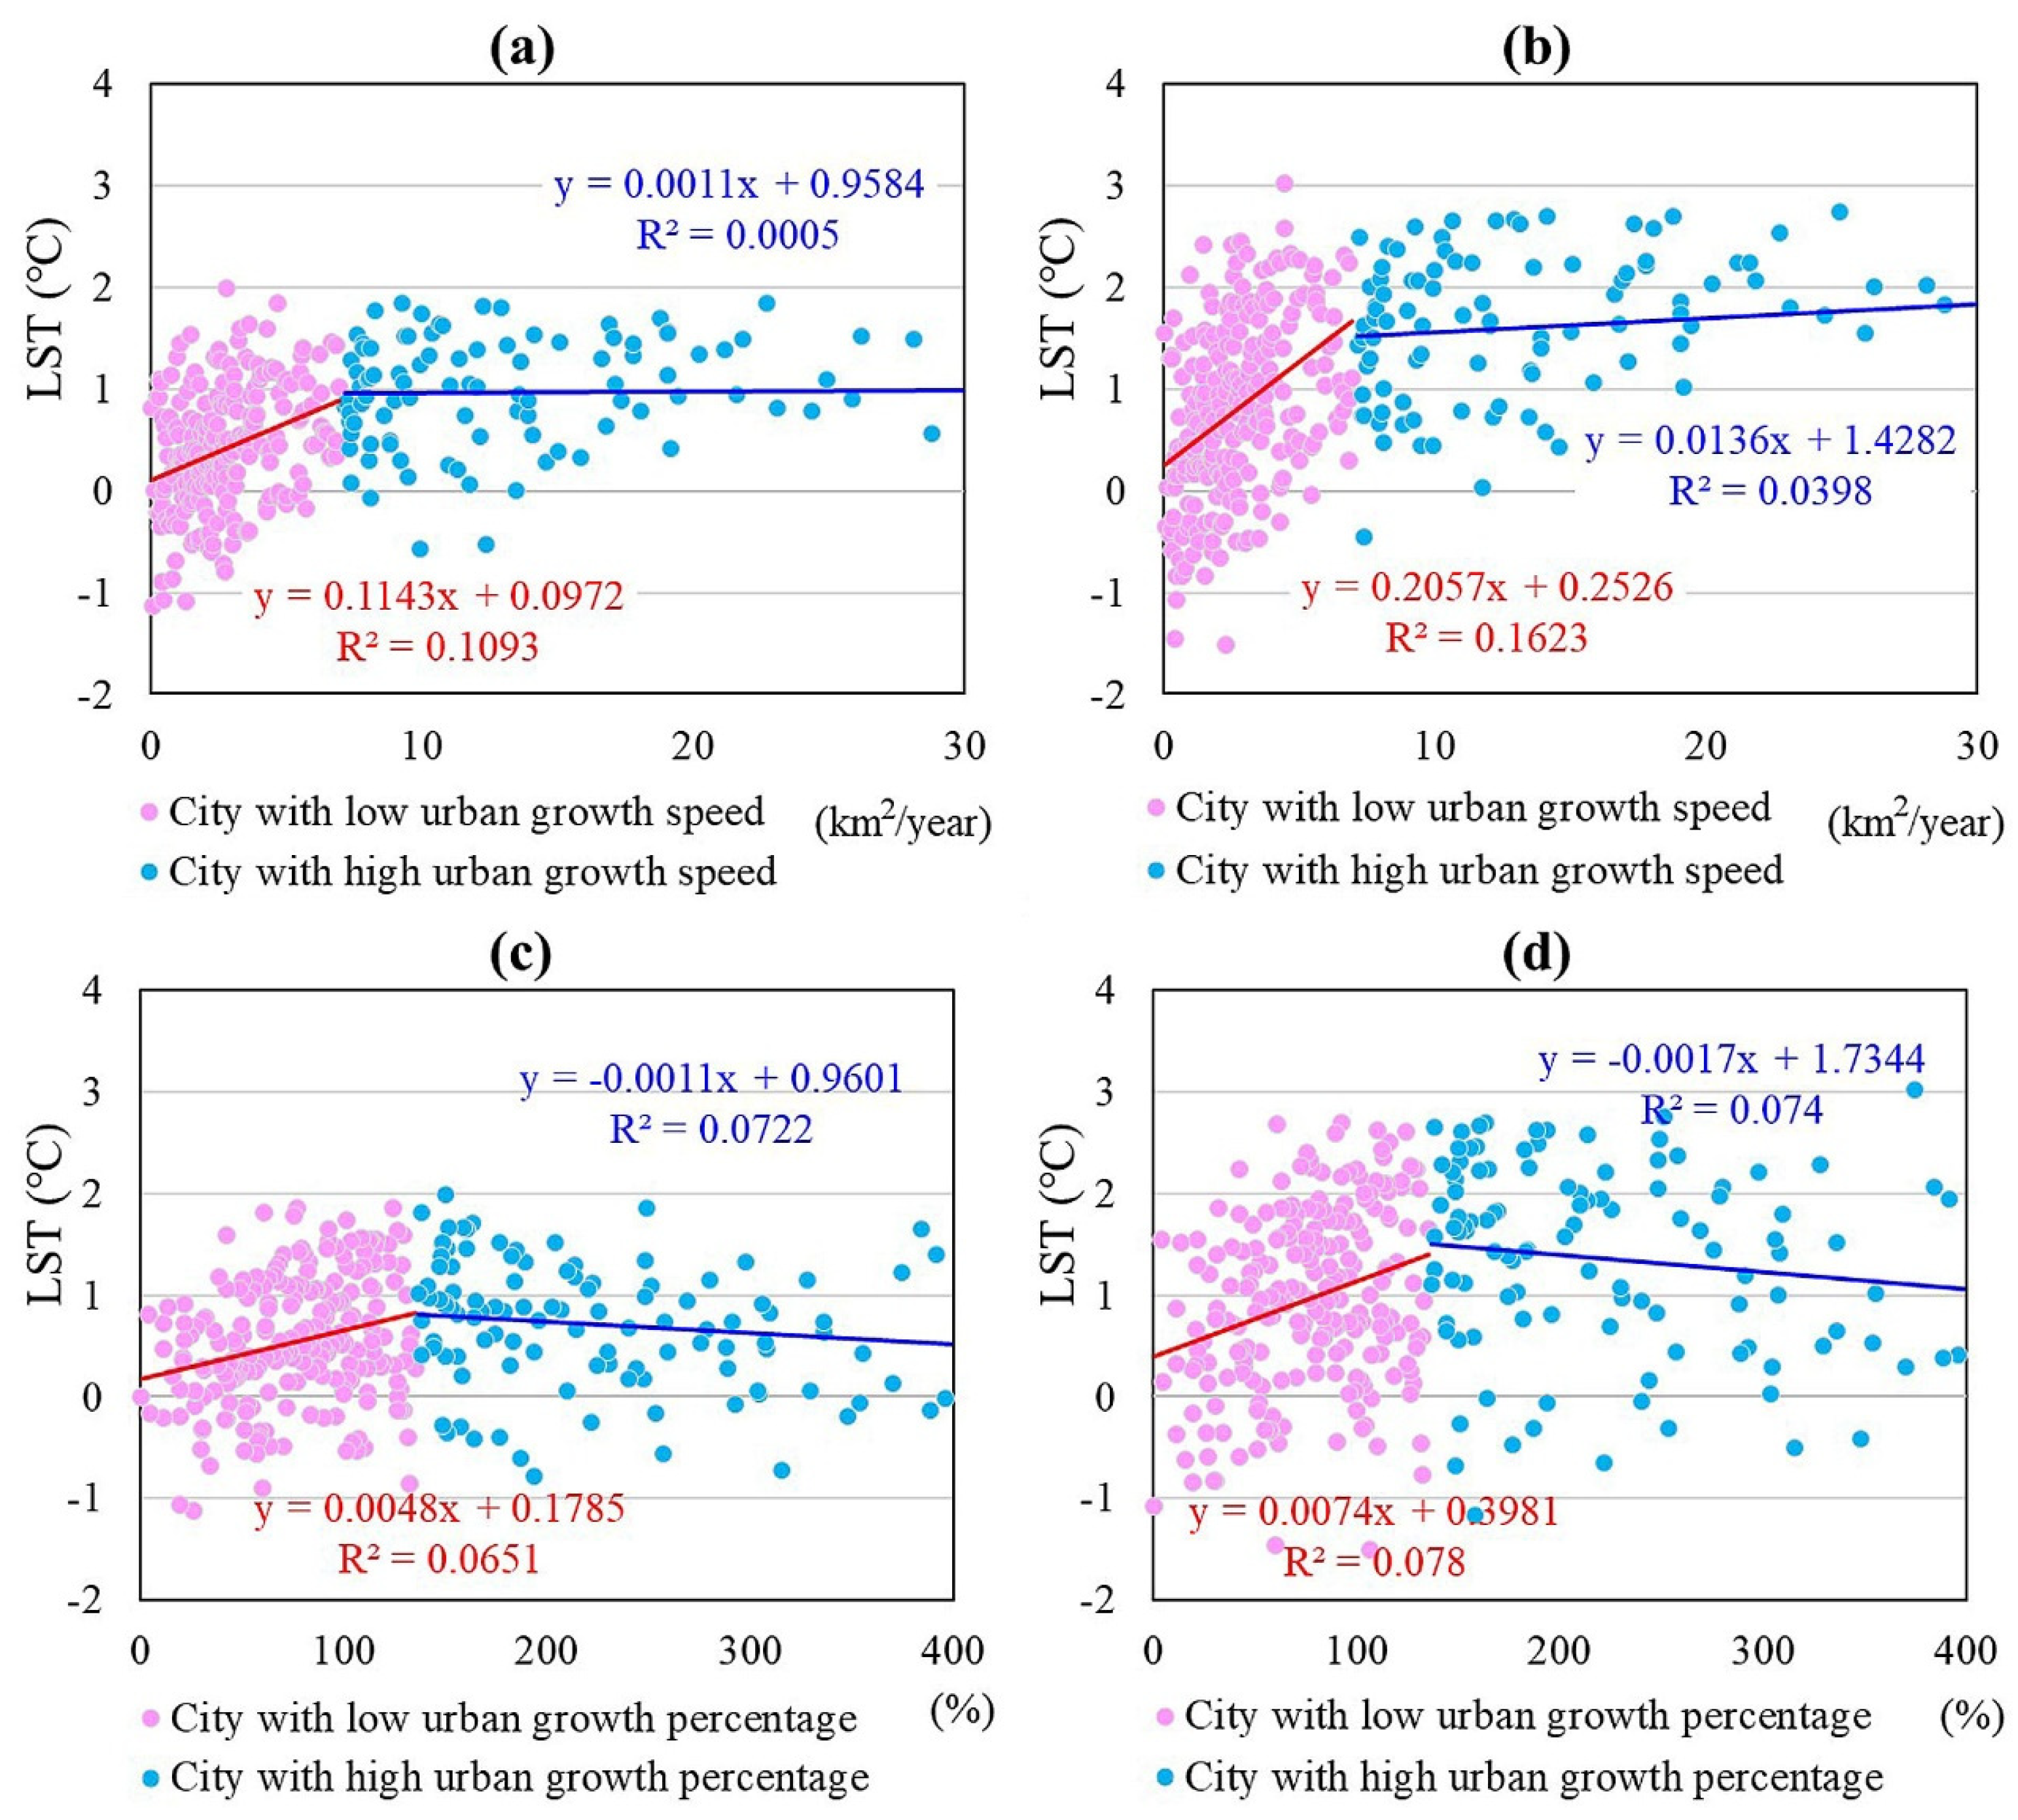
In addition, according to the statistics of Speed Level One-Nine and Percentage Level One-Nine, the increase in the UHIIs kept in step with the rise of urban growth speed and scale to a certain extent. Along with the rise of urban growth speed from less than 2.5 km2 to over 20 km2 per year, as well as the urban growth percentage from less than 50% to 300%, the difference in LST between the new UA and previous UA presented a rising trend. Despite the qualitative analysis in Section 4.3, we tried to quantify the relationships between the LST dynamic and urban growth. The 340 cities were coarsely divided into different categories based on their average urban growth speed (6.92 km2 per year) and percentage (137.20%). Figure 10 shows that cities with low urban growth speeds and percentages below the averages generally exhibited faster LST increases. Meanwhile, cities with high urban growth speeds and percentages above the averages usually presented a slower LST increase or even an LST decrease phenomenon. Moreover, both the increase and decrease trends of the new UA were much more apparent than the previous UA. The assessments further explained the spatial pattern of LST increase in China. This study reveals that the newly developed urban area exhibits lower temperatures compared to the older urban area, which is consistent with the findings of Liu, Huang, Yang, and Cao [11]. In contrast to Liu’s research, our paper investigates the patterns and features of land surface temperature (LST) changes throughout the process of urbanization, considering diverse perspectives and scales. Specifically, we compare the new urban areas characterized by land cover-driven urbanization with the older urban areas influenced predominantly by population and industry. Liu’s study primarily elucidated the temperature variations between the old and new urban areas based on distinctions in climate, geographical locations, and altitudes [11].
In summary, the factors affecting the LST dynamic were various, including the speed and scale of urban growth, the activity of urbanization construction, and the density of human life and production, as well as the resources of the new UA. In response, targeted measures should be implemented for the purpose of containing the LST increase to a suitable degree.
4.3. Limitations and Outlook
This study aims to address existing research gaps by enhancing our comprehension of the relationship between urbanization and temperature on a national scale. Focusing on the manifestation of urbanization-induced LST dynamics at intra-urban scales, we selected 340 cities in China as the study area. This study, spanning the period from 2000 to 2015, focused on two spatial units: the previous UA in 2000 and the new UA expanded during 2000–2015. Utilizing the UHII index for both areas, we sought to answer questions regarding LST behavior during urban growth at the turn of the 21st Century and the disparities in LST dynamics between the previous UA and the new UA. The research contributes by introducing the concept of a “previous–new UA” dichotomy in a demonstration study involving 340 Chinese cities, providing insights into the urbanization–climate change relationship. Additionally, this study proposes a reproducible workflow for illustrating the spatiotemporal characteristics of UHII at intra-urban scales, with readily available and extensible research datasets.
However, this study still has some limitations. The assessment of the LST dynamic was based on the MODIS LST products with 1 km spatial resolutions due to its high applicability in presenting spatiotemporal patterns of the changeable LST and UHII. The division of the previous UA and new UA was based on the land use database, which was visually interpreted from Landsat images with 30 m spatial resolutions with a high accuracy of over 90%. Although the feasibility and credibility of the dataset have been proven by the consistent results in this work with other existing publications, the uncertainties could not be ignored for cities with quite limited urban areas. For instance, cities in Xinjiang and Tibet Provinces generally have small urban land patches, which might lead to a statistic of the LST with low accuracy. Therefore, remotely sensed images with higher spatial resolutions should be applied to the western cities for the purpose of a more precise analysis in the next work. In addition, the results of this work provided basic information on the LST dynamic and its response to urban growth in China, which can serve as a valuable supplement to relevant knowledge in China. Based on this information, the categorization of cities should be executed in the next work in order to provide target areas for designing suitable urban planning measures. Meanwhile, the main constraints for urban sustainability, from the perspective of LST macro-controlling, should be further figured out by digging for more information in detail.
In addition, in the examination of factors contributing to warming, this study distinguishes between new and old urban areas to elucidate the role of underlying surfaces but does not differentiate between population and economy. Undoubtedly, urbanization induces warming, yet the relationship between warming and urbanization (surface, population, and economy) is intricate [49]. Some scholars posit that population growth leads to warming due to increased building density encroaching on vegetation coverage. Conversely, the level of economic development exhibits a negative correlation with temperature, as economically developed urban areas with higher incomes tend to possess more vegetation cover and maintain a more sustainable energy and economic structure, thereby reducing land surface temperature (LST) [22,50]. However, it is important to acknowledge that a region’s economy and population are typically positively correlated, indicating that economically developed regions tend to be more densely populated, and population growth tends to promote economic growth. Therefore, further investigation is necessary to fully comprehend the relationship between these factors and human well-being.
5. Conclusions
In this study, we quantitatively analyzed the changeable LST of 340 cities in China from the perspective of surface urbanization, different urban development stages, and different urban areas. Given the various urbanization statuses, we conducted statistics on two spatial units of urban areas, i.e., the new UA during 2000–2015 and the previous UA in 2000. Three conclusions are summarized as follows. (1) Overall, during the past years, the LST in China suffered a significant increase from 22.36 °C to 23.04 °C. Cities located between the Yellow River and Yangtze River presented higher LST and UHII increases than other regions. (2) In the comparison of multiple angles, the new UA showed a faster increase in LST and UHII compared to the previous UA due to carrying more drastic urbanization construction. It shows that the change in land cover is the main cause of warming. (3) Fast-growing cities demonstrated a steeper slope in LST increase between new and old urban areas compared to slow-growing cities, indicating a relationship between the stage of urban development and the rate of temperature change. In densely populated areas, such as the North China Plain and the Yangtze River Delta, the temperature increase is particularly pronounced. Notably, the warming observed in old urban areas highlights the significant impact of urbanization concentration on temperature rise, as these areas are not influenced by underlying surfaces. Based on these findings, targeted macro-control measures, like appropriate urban green space, should be designed to foster livable urban environments and sustainable urban development.
This research provides valuable insights into temperature changes in both new and old urban areas, revealing their spatial distribution characteristics and correlations. It also analyzes the characteristics and trends of urban temperature changes from the perspectives of different urban development stages and speeds. The next steps involve studying the factors contributing to changes in the urban thermal environment, including variations in albedo, vegetation activity, impermeable surface density, and anthropogenic heat emissions.
Author Contributions
Conceptualization, F.L.; methodology, S.Y.; software, S.Y.; validation, S.H.; formal analysis, Z.Z. (Zijuan Zhu); investigation, S.Y.; resources, S.C.; data curation, X.Z.; writing—original draft preparation, S.Y.; writing—review and editing, Z.Z. (Zijuan Zhu); visualization, S.C.; supervision, X.W.; project administration, Z.Z. (Zengxiang Zhang); funding acquisition, Z.Z. (Zijuan Zhu). All authors have read and agreed to the published version of the manuscript.
Funding
This study is supported by the National Key R&D Program of China (Project No. 2022YFC3800700) and the Natural Science Foundation of Hubei Province (Grant No. 2023AFB149).
Data Availability Statement
The original contributions presented in the study are included in the article, further inquiries can be directed to the corresponding author.
Acknowledgments
The authors thank all researchers involved in data acquisition, image registration, and verification. They were members and students at the Renewable Resources Laboratory, Aerospace Information Research Institute, Chinese Academy of Sciences.
Conflicts of Interest
The authors declare no conflict of interest.
References
- Angel, S.; Parent, J.; Civco, D.L.; Blei, A.; Potere, D. The dimensions of global urban expansion: Estimates and projections for all countries, 2000–2050. Prog. Plan. 2011, 75, 53–107. [Google Scholar] [CrossRef]
- Taubenboeck, H.; Droin, A.; Standfuss, I.; Dosch, F.; Sander, N.; Milbert, A.; Eichfuss, S.; Wurm, M. To be, or not to be ‘urban‘? A multi-modal method for the differentiated measurement of the degree of urbanization. Comput. Environ. Urban Syst. 2022, 95, 101830. [Google Scholar] [CrossRef]
- He, B.-J.; Wang, J.; Zhu, J.; Qi, J. Beating the urban heat: Situation, background, impacts and the way forward in China. Renew. Sustain. Energy Rev. 2022, 161, 112350. [Google Scholar] [CrossRef]
- Angelil, O.; Stone, D.; Wehner, M.; Paciorek, C.J.; Krishnan, H.; Collins, W. An Independent Assessment of Anthropogenic Attribution Statements for Recent Extreme Temperature and Rainfall Events. J. Clim. 2017, 30, 5–16. [Google Scholar] [CrossRef]
- Cheng, X.; Lan, T.; Mao, R.; Gong, D.-Y.; Han, H.; Liu, X. Reducing air pollution increases the local diurnal temperature range: A case study of Lanzhou, China. Meteorol. Appl. 2020, 27, e1939. [Google Scholar] [CrossRef]
- Hallegatte, S.; Green, C.; Nicholls, R.J.; Corfee-Morlot, J. Future flood losses in major coastal cities. Nat. Clim. Chang. 2013, 3, 802–806. [Google Scholar] [CrossRef]
- Murray, V.; Ebi, K.L. IPCC Special Report on Managing the Risks of Extreme Events and Disasters to Advance Climate Change Adaptation (SREX). J. Epidemiol. Community Health 2012, 66, 759–760. [Google Scholar] [CrossRef]
- Nguyen, O.V.; Kawamura, K.; Trong, D.P.; Gong, Z.; Suwandana, E. Temporal change and its spatial variety on land surface temperature and land use changes in the Red River Delta, Vietnam, using MODIS time-series imagery. Environ. Monit. Assess. 2015, 187, 11. [Google Scholar] [CrossRef]
- Westermann, S.; Langer, M.; Boike, J. Systematic bias of average winter-time land surface temperatures inferred from MODIS at a site on Svalbard, Norway. Remote Sens. Environ. 2012, 118, 162–167. [Google Scholar] [CrossRef]
- Khan, R.; Li, H.; Basir, M.; Chen, Y.L.; Sajjad, M.M.; Ul Haq, I.; Ullah, B.; Arif, M.; Hassan, W. Monitoring land use land cover changes and its impacts on land surface temperature over Mardan and Charsadda Districts, Khyber Pakhtunkhwa (KP), Pakistan. Environ. Monit. Assess. 2022, 194, 409. [Google Scholar] [CrossRef]
- Liu, Y.; Huang, X.; Yang, Q.Q.; Cao, Y.X. The turning point between urban vegetation and artificial surfaces for their competitive effect on land surface temperature. J. Clean Prod. 2021, 292, 11. [Google Scholar] [CrossRef]
- Li, H.; Meier, F.; Lee, X.; Chakraborty, T.; Liu, J.; Schaap, M.; Sodoudi, S. Interaction between urban heat island and urban pollution island during summer in Berlin. Sci. Total Environ. 2018, 636, 818–828. [Google Scholar] [CrossRef] [PubMed]
- Yin, Z.; Liu, Z.; Liu, X.; Zheng, W.; Yin, L. Urban heat islands and their effects on thermal comfort in the US: New York and New Jersey. Ecol. Indic. 2023, 154, 110765. [Google Scholar] [CrossRef]
- Li, X.; Stringer, L.C.; Chapman, S.; Dallimer, M. How urbanisation alters the intensity of the urban heat island in a tropical African city. PLoS ONE 2021, 16, e0254371. [Google Scholar] [CrossRef]
- Wemegah, C.S.; Yamba, E.I.; Aryee, J.N.A.; Sam, F.; Amekudzi, L.K. Assessment of urban heat island warming in the greater accra region. Sci. Afr. 2020, 8, e00426. [Google Scholar] [CrossRef]
- Qiao, Z.; Wang, N.; Chen, J.; He, T.; Xu, X.; Liu, L.; Sun, Z.; Han, D. Urbanization accelerates urban warming by changing wind speed: Evidence from China based on 2421 meteorological stations from 1978 to 2017. Environ. Impact Assess. Rev. 2023, 102, 107189. [Google Scholar] [CrossRef]
- Ward, K.; Lauf, S.; Kleinschmit, B.; Endlicher, W. Heat waves and urban heat islands in Europe: A review of relevant drivers. Sci. Total Environ. 2016, 569–570, 527–539. [Google Scholar] [CrossRef] [PubMed]
- Shen, P.; Zhao, S.; Ma, Y.; Liu, S. Urbanization-induced Earth’s surface energy alteration and warming: A global spatiotemporal analysis. Remote Sens. Environ. 2023, 284, 113361. [Google Scholar] [CrossRef]
- Mohajerani, A.; Bakaric, J.; Jeffrey-Bailey, T. The urban heat island effect, its causes, and mitigation, with reference to the thermal properties of asphalt concrete. J. Environ. Manag. 2017, 197, 522–538. [Google Scholar] [CrossRef]
- Wang, R.C.; Murayama, Y. Geo-simulation of land use/cover scenarios and impacts on land surface temperature in Sapporo, Japan. Sustain. Cities Soc. 2020, 63, 11. [Google Scholar] [CrossRef]
- Chen, H.; Huang, J.J.; Li, H.; Wei, Y.; Zhu, X. Revealing the response of urban heat island effect to water body evaporation from main urban and suburb areas. J. Hydrol. 2023, 623, 129687. [Google Scholar] [CrossRef]
- Yang, B.; Yang, X.; Leung, L.R.; Zhong, S.; Qian, Y.; Zhao, C.; Chen, F.; Zhang, Y.; Qi, J. Modeling the Impacts of Urbanization on Summer Thermal Comfort: The Role of Urban Land Use and Anthropogenic Heat. J. Geophys. Res. Atmos. 2019, 124, 6681–6697. [Google Scholar] [CrossRef]
- Yao, L.; Sun, S.; Song, C.; Wang, Y.; Xu, Y. Recognizing surface urban heat ‘island’ effect and its urbanization association in terms of intensity, footprint, and capacity: A case study with multi-dimensional analysis in Northern China. J. Clean Prod. 2022, 372, 133720. [Google Scholar] [CrossRef]
- Zhou, D.; Bonafoni, S.; Zhang, L.; Wang, R. Remote sensing of the urban heat island effect in a highly populated urban agglomeration area in East China. Sci. Total Environ. 2018, 628–629, 415–429. [Google Scholar] [CrossRef] [PubMed]
- Zhou, D.C.; Zhao, S.Q.; Liu, S.G.; Zhang, L.X.; Zhu, C. Surface urban heat island in China’s 32 major cities: Spatial patterns and drivers. Remote Sens. Environ. 2014, 152, 51–61. [Google Scholar] [CrossRef]
- Ge, J.; Wang, H.; He, S. Seasonal-Spatial Distribution and Driving Forces of Land Surface Temperature in the Urban Development Area of Wuhan. Resour. Environ. Yangtze Basin 2021, 30, 351–360. [Google Scholar]
- He, B.; Zhao, W.; Li, A.; Feng, W.; Tan, J.; Lei, G.; Nan, X. Comparative Study on Thermal Environment between Old Urban Areas and New Urban Areas based on Landsat 8Remote Sensing Image: A Case Study of Chengdu City. Remote Sens. Technol. Appl. 2017, 32, 1141–1150. [Google Scholar]
- Sun, Z.; Du, W.; Jiang, H.; Weng, Q.; Guo, H.; Han, Y.; Xing, Q.; Ma, Y. Global 10-m impervious surface area mapping: A big earth data based extraction and updating approach. Int. J. Appl. Earth Obs. Geoinf. 2022, 109, 102800. [Google Scholar] [CrossRef]
- Yu, S.; Tobias, L.; Zhang, Z.; Liu, F.; Wang, X.; Yan, X.; Hannes, T. Does urban growth mean the loss of greenness? A multi-temporal analysis for Chinese cities. Sci. Total Environ. 2023, 898, 166373. [Google Scholar] [CrossRef]
- Press, S. Administrative Division of the People’s Republic of China Handbook 2015, 1st ed.; SinoMaps Press: Beijing, China, 2015; p. 167. [Google Scholar]
- Wan, Z.M.; Li, Z.L. A physics-based algorithm for retrieving land-surface emissivity and temperature from EOS/MODIS data. IEEE Trans. Geosci. Remote Sens. 1997, 35, 980–996. [Google Scholar] [CrossRef]
- Zhang, Y.Z.; Jiang, X.G.; Wu, H. A Generalized Split-window Algorithm for Retrieving Land Surface Temperature from GF-5 Thermal Infrared Data. In Proceedings of the Progress in Electromagnetics Research Symposium—Spring (PIERS), St. Petersburg, Russia, 22–25 May 2017; pp. 2766–2771. [Google Scholar] [CrossRef]
- Meng, Q.; Zhang, L.; Sun, Z.; Meng, F.; Wang, L.; Sun, Y. Characterizing spatial and temporal trends of surface urban heat island effect in an urban main built-up area: A 12-year case study in Beijing, China. Remote Sens. Environ. 2018, 204, 826–837. [Google Scholar] [CrossRef]
- Yang, Q.; Huang, X.; Tang, Q. The footprint of urban heat island effect in 302 Chinese cities: Temporal trends and associated factors. Sci. Total Environ. 2019, 655, 652–662. [Google Scholar] [CrossRef]
- Zhang, Z.X.; Wang, X.; Zhao, X.L.; Liu, B.; Yi, L.; Zuo, L.J.; Wen, Q.K.; Liu, F.; Xu, J.Y.; Hu, S.G. A 2010 update of National Land Use/Cover Database of China at 1:100000 scale using medium spatial resolution satellite images. Remote Sens. Environ. 2014, 149, 142–154. [Google Scholar] [CrossRef]
- Imhoff, M.L.; Zhang, P.; Wolfe, R.E.; Bounoua, L. Remote sensing of the urban heat island effect across biomes in the continental USA. Remote Sens. Environ. 2010, 114, 504–513. [Google Scholar] [CrossRef]
- Thompson, J.A.; Paull, D.J. Assessing spatial and temporal patterns in land surface phenology for the Australian Alps (2000–2014). Remote Sens. Environ. 2017, 199, 1–13. [Google Scholar] [CrossRef]
- Fernandes, R.; Leblanc, S.G. Parametric (modified least squares) and non-parametric (Theil-Sen) linear regressions for predicting biophysical parameters in the presence of measurement errors. Remote Sens. Environ. 2005, 95, 303–316. [Google Scholar] [CrossRef]
- Planque, C.; Carrer, D.; Roujean, J.-L. Analysis of MODIS albedo changes over steady woody covers in France during the period of 2001–2013. Remote Sens. Environ. 2017, 191, 13–29. [Google Scholar] [CrossRef]
- Mu, X.; Fang, C.; Yang, Z. Spatio-temporal evolution and dynamic simulation of the urban resilience of Beijing-Tianjin-Hebei urban agglomeration. J. Geogr. Sci. 2022, 32, 1766–1790. [Google Scholar] [CrossRef]
- Jiang, Z.; Wu, Y.; Liu, Z.; Wen, N. A diagnostic analysis of air temperature anomaly mode over china in 2009/2010 winter based on generalized equilibrium feedback assessment(gefa) method. J. Trop. Meteorol. 2013, 29, 28–36. [Google Scholar]
- Zhang, Y.; Yu, J.; Liu, Z.; Wu, Y.; Li, F.; Li, M. Winter 2009/2010 temperature anomaly in China and its remote response to sea surface temperature. Clim. Environ. Res. 2013, 18, 626–638. [Google Scholar]
- Chen, J.Q.; Wei, H.; Li, N.; Chen, S.Q.; Qu, W.Q.; Zhang, Y. Exploring the Spatial-Temporal Dynamics of the Yangtze River Delta Urban Agglomeration Based on Night-Time Light Remote Sensing Technology. IEEE J. Sel. Top. Appl. Earth Observ. Remote Sens. 2020, 13, 5369–5383. [Google Scholar] [CrossRef]
- Rahaman, Z.A.; Kafy, A.; Saha, M.; Rahim, A.A.; Almulhim, A.I.; Rahaman, S.N.; Fattah, M.A.; Rahman, M.T.; Kalaivani, S.; Abdullah-Al-Faisal, A.; et al. Assessing the impacts of vegetation cover loss on surface temperature, urban heat island and carbon emission in Penang city, Malaysia. Build. Environ. 2022, 222, 109335. [Google Scholar] [CrossRef]
- Lim, Y.K.; Cai, M.; Kalnay, E.; Zhou, L.M. Observational evidence of sensitivity of surface climate changes to land types and urbanization. Geophys. Res. Lett. 2005, 32, 4. [Google Scholar] [CrossRef]
- Yu, S.; Zhang, Z.; Liu, F.; Wang, X.; Hu, S. Assessing Interannual Urbanization of China′s Six Megacities Since 2000. Remote Sens. 2019, 11, 2138. [Google Scholar] [CrossRef]
- Ju, H.; Zhang, Z.; Zhao, X.; Wang, X.; Wu, W.; Yi, L.; Wen, Q.; Liu, F.; Xu, J.; Hu, S.; et al. The changing patterns of cropland conversion to built-up land in China from 1987 to 2010. J. Geogr. Sci. 2018, 28, 1595–1610. [Google Scholar] [CrossRef]
- Fall, S.; Niyogi, D.; Gluhovsky, A.; Pielke, R.A., Sr.; Kalnay, E.; Rochon, G. Impacts of land use land cover on temperature trends over the continental United States: Assessment using the North American Regional Reanalysis. Int. J. Climatol. 2010, 30, 1980–1993. [Google Scholar] [CrossRef]
- Huang, G.; Cadenasso, M.L. People, landscape, and urban heat island: Dynamics among neighborhood social conditions, land cover and surface temperatures. Landsc. Ecol. 2016, 31, 2507–2515. [Google Scholar] [CrossRef]
- Yin, C.; Yuan, M.; Lu, Y.; Huang, Y.; Liu, Y. Effects of urban form on the urban heat island effect based on spatial regression model. Sci. Total Environ. 2018, 634, 696–704. [Google Scholar] [CrossRef]
Figure 1.
Distribution of Chinese cities applied in this study: (a) urban growth speed, (b) urban expansion percentage, and (c) divisions at nine levels.
Figure 1.
Distribution of Chinese cities applied in this study: (a) urban growth speed, (b) urban expansion percentage, and (c) divisions at nine levels.
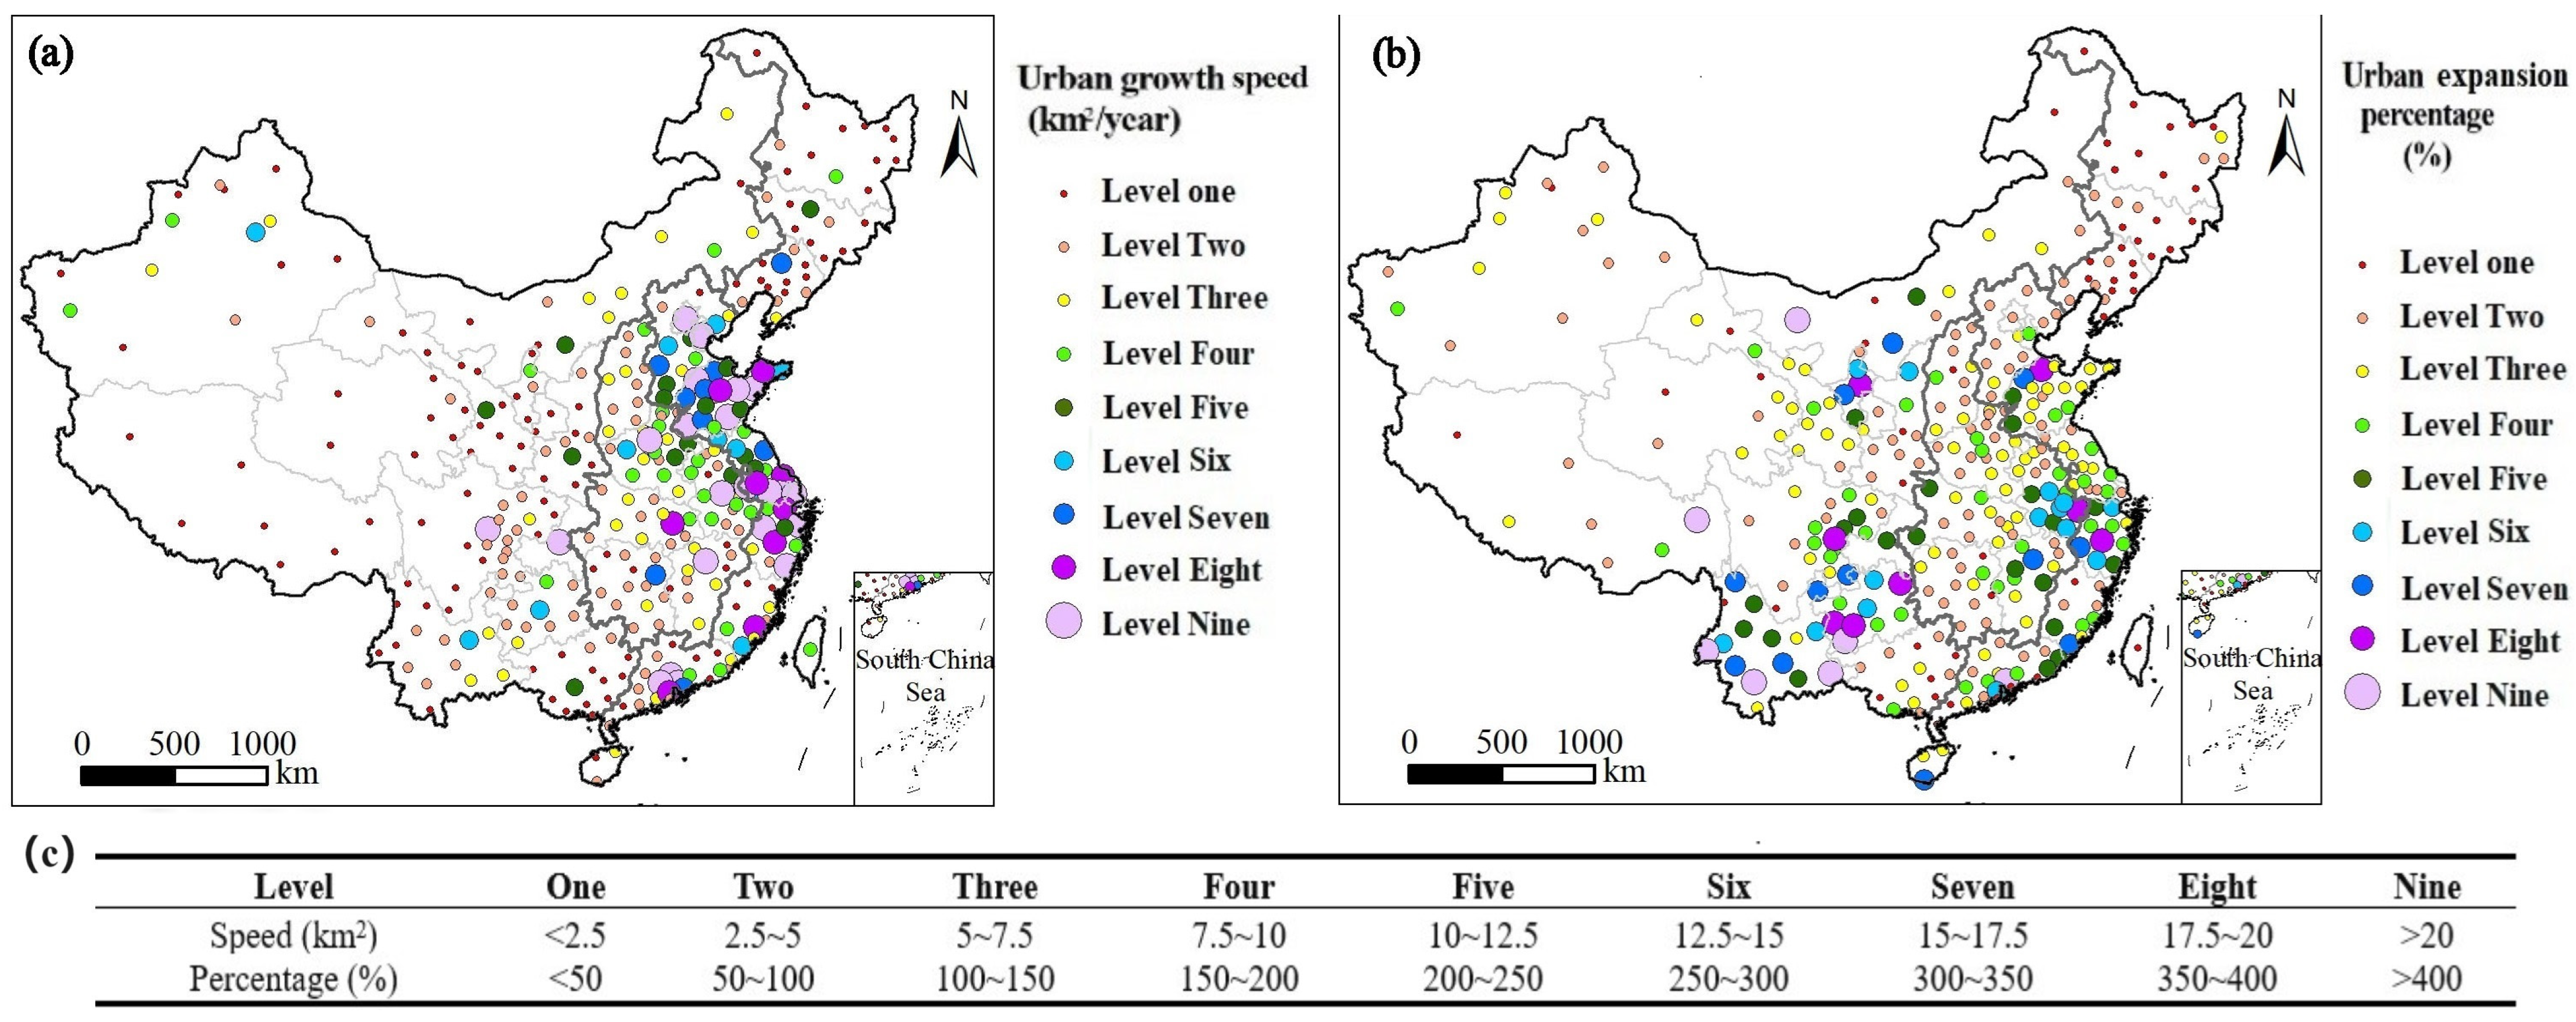
Figure 2.
The basic dynamic of land surface temperatures (LST) in China during 2003–2018: (a) spatial distribution of absolute changes, (b) annual LST in average, and (c) area proportions of different trends.
Figure 2.
The basic dynamic of land surface temperatures (LST) in China during 2003–2018: (a) spatial distribution of absolute changes, (b) annual LST in average, and (c) area proportions of different trends.
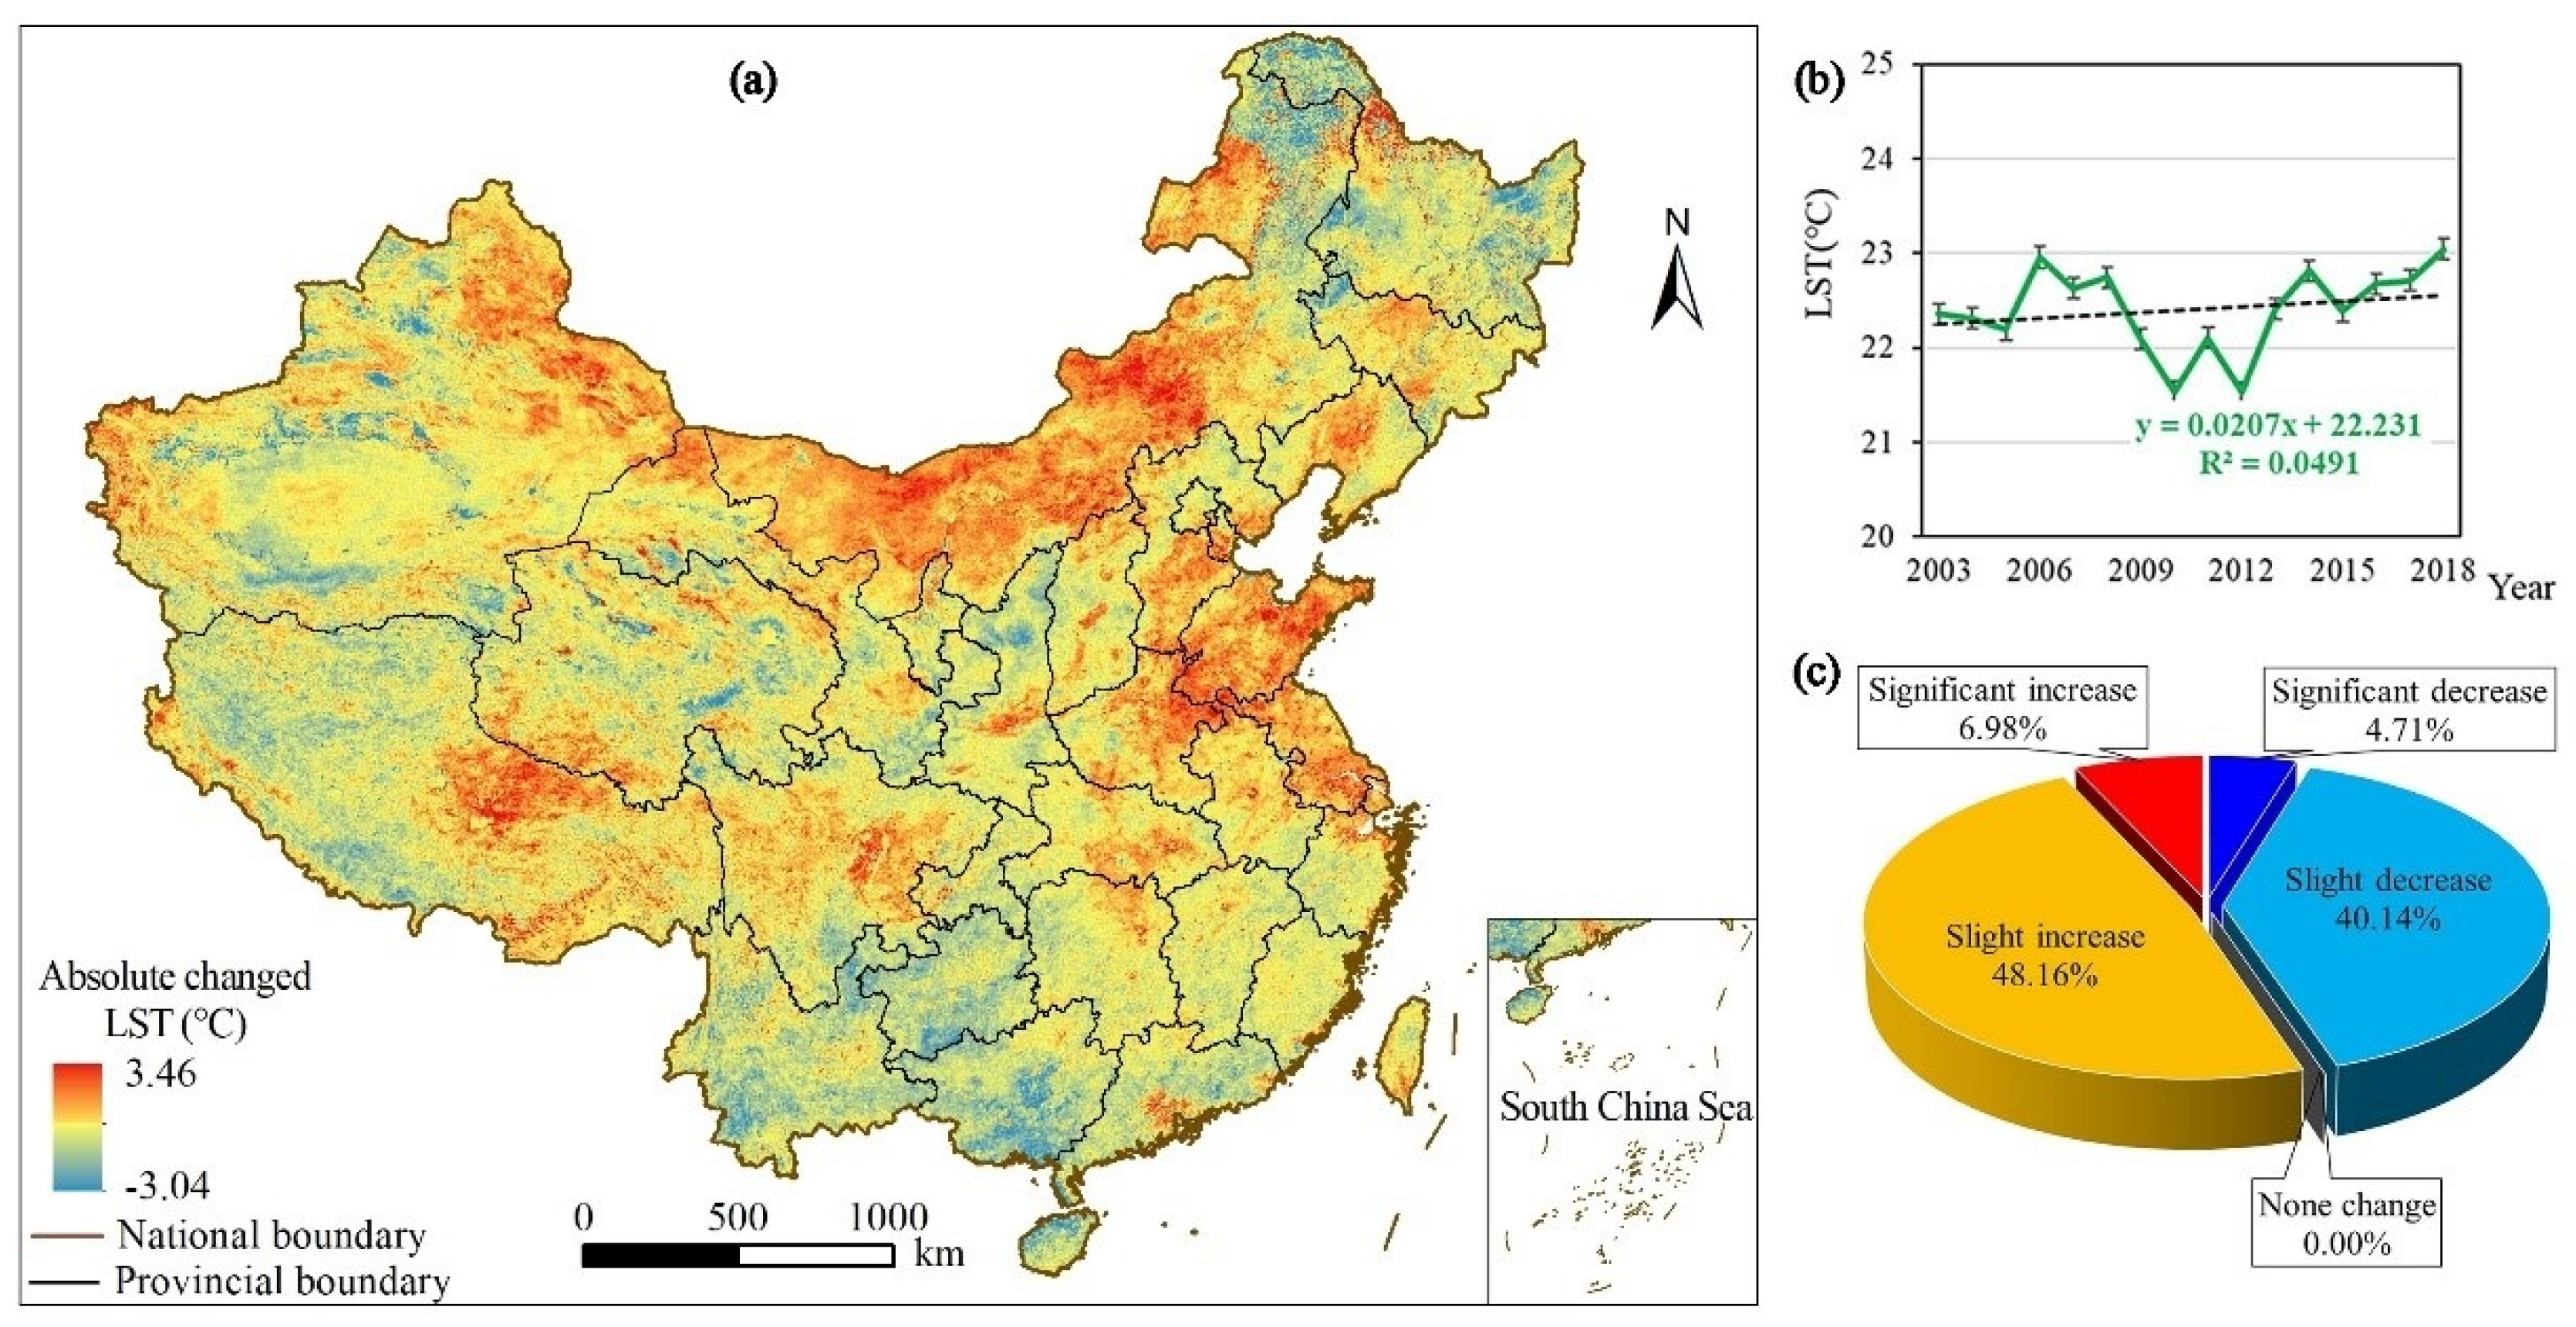
Figure 3.
Interannual UHII at the national scale during 2003–2018: (a) annual LST in the previous UA and new UA, (b) urban heat island intensity (UHII) of the previous UA () and new UA (), (c) difference of UHII between the new UA and previous UA ().
Figure 3.
Interannual UHII at the national scale during 2003–2018: (a) annual LST in the previous UA and new UA, (b) urban heat island intensity (UHII) of the previous UA () and new UA (), (c) difference of UHII between the new UA and previous UA ().
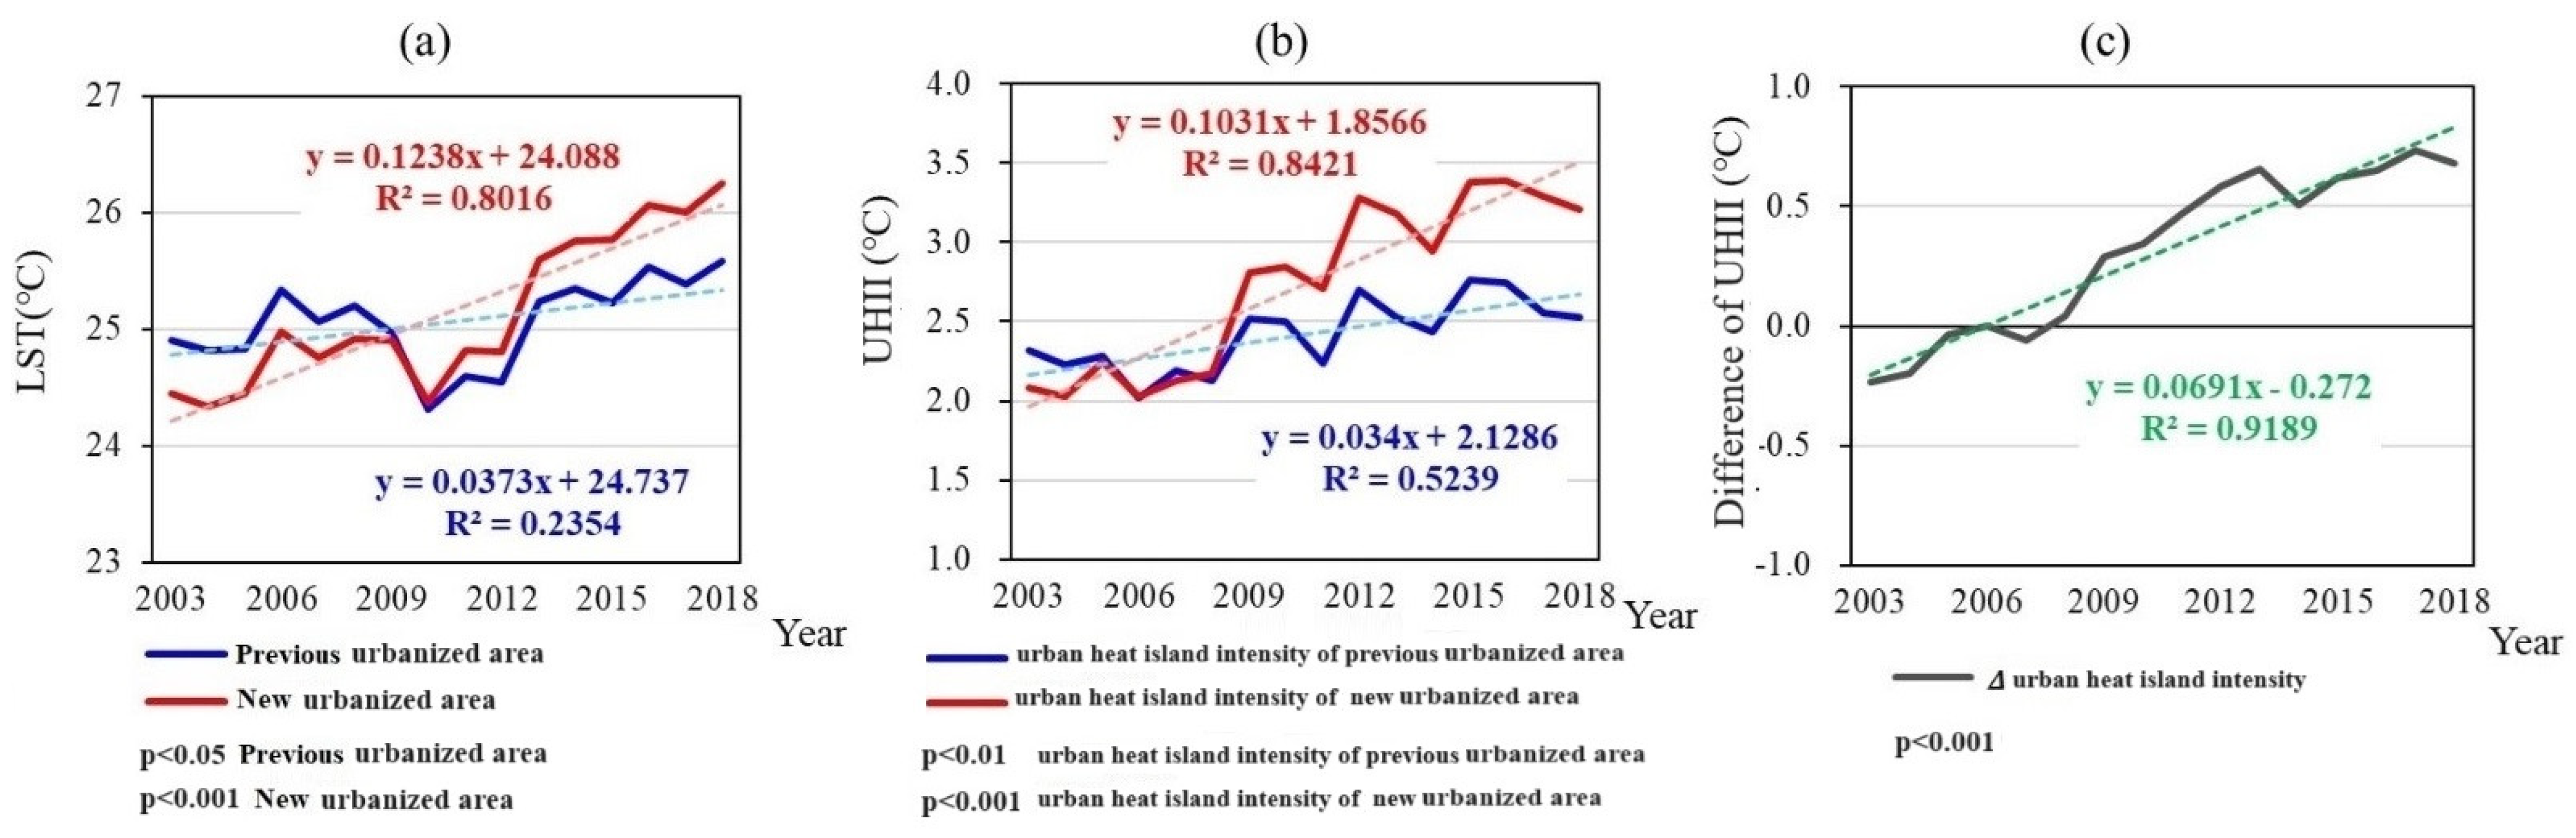
Figure 4.
Spatial distributions of absolute LST changes from 2003 to 2018 at city scales: (a) the previous UA and (b) new UA.
Figure 4.
Spatial distributions of absolute LST changes from 2003 to 2018 at city scales: (a) the previous UA and (b) new UA.

Figure 5.
Area proportions of different land surface temperature (LST) dynamic trends at city scales during 2003–2018: (a–d) the previous UA and (e–h) new UA.
Figure 5.
Area proportions of different land surface temperature (LST) dynamic trends at city scales during 2003–2018: (a–d) the previous UA and (e–h) new UA.
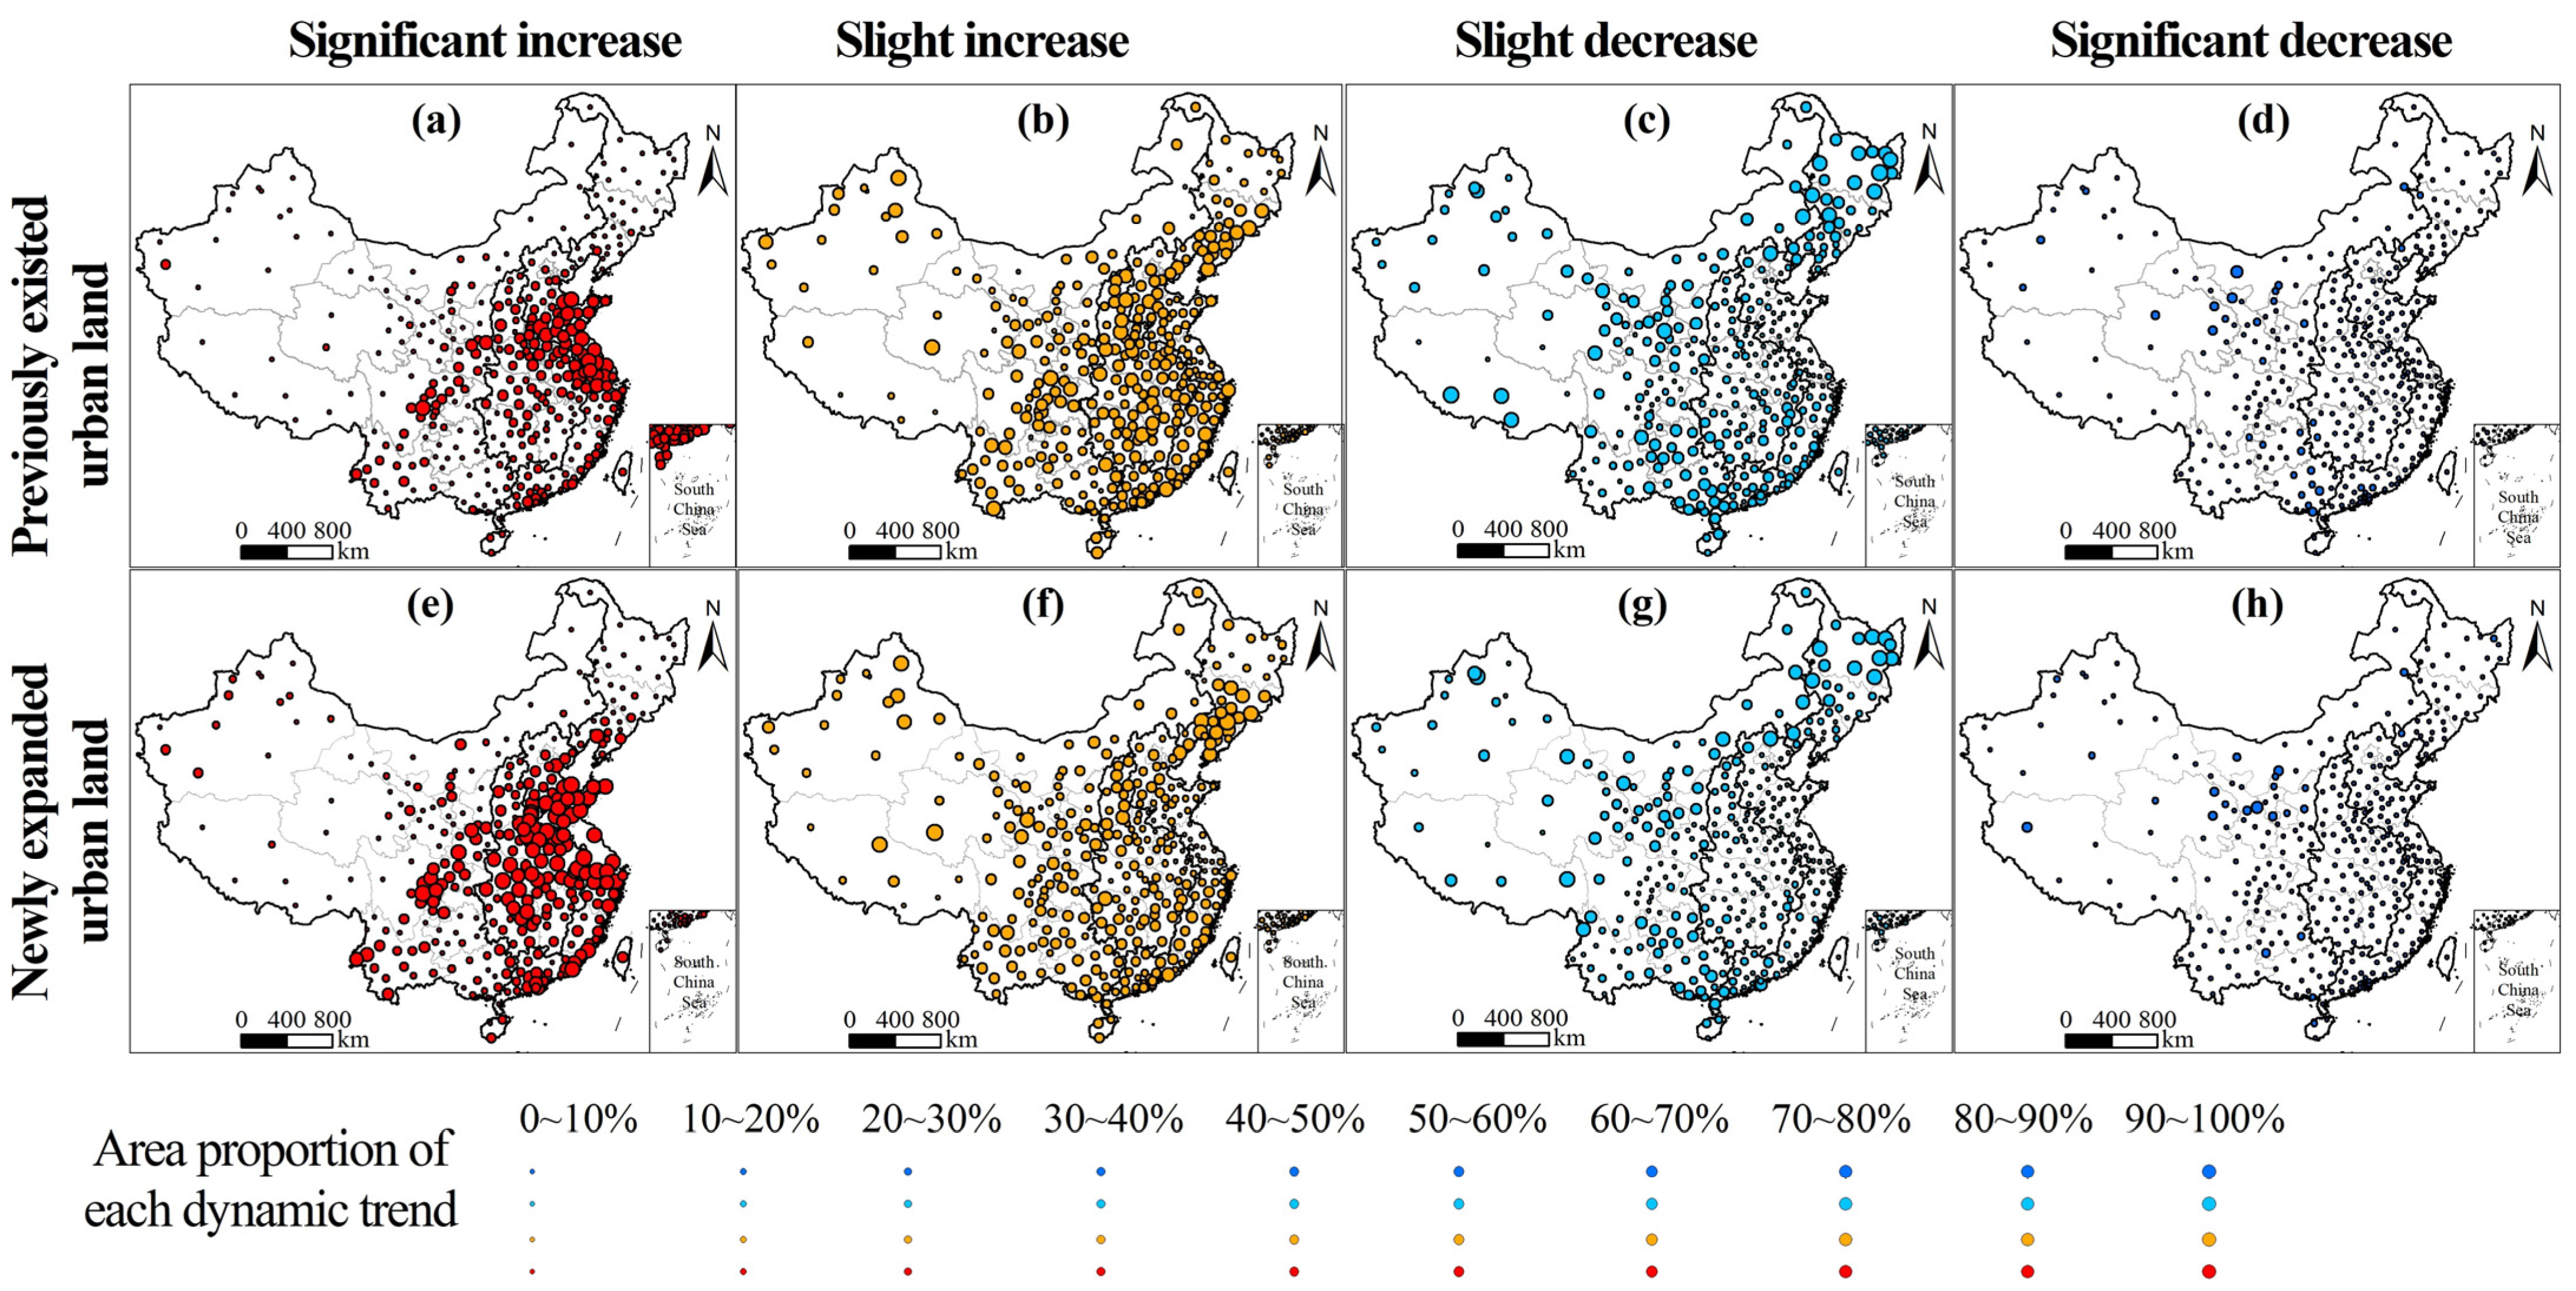
Figure 6.
Urban heat island intensity (UHII) of the previous UA and new UA related to urban growth speed.
Figure 6.
Urban heat island intensity (UHII) of the previous UA and new UA related to urban growth speed.
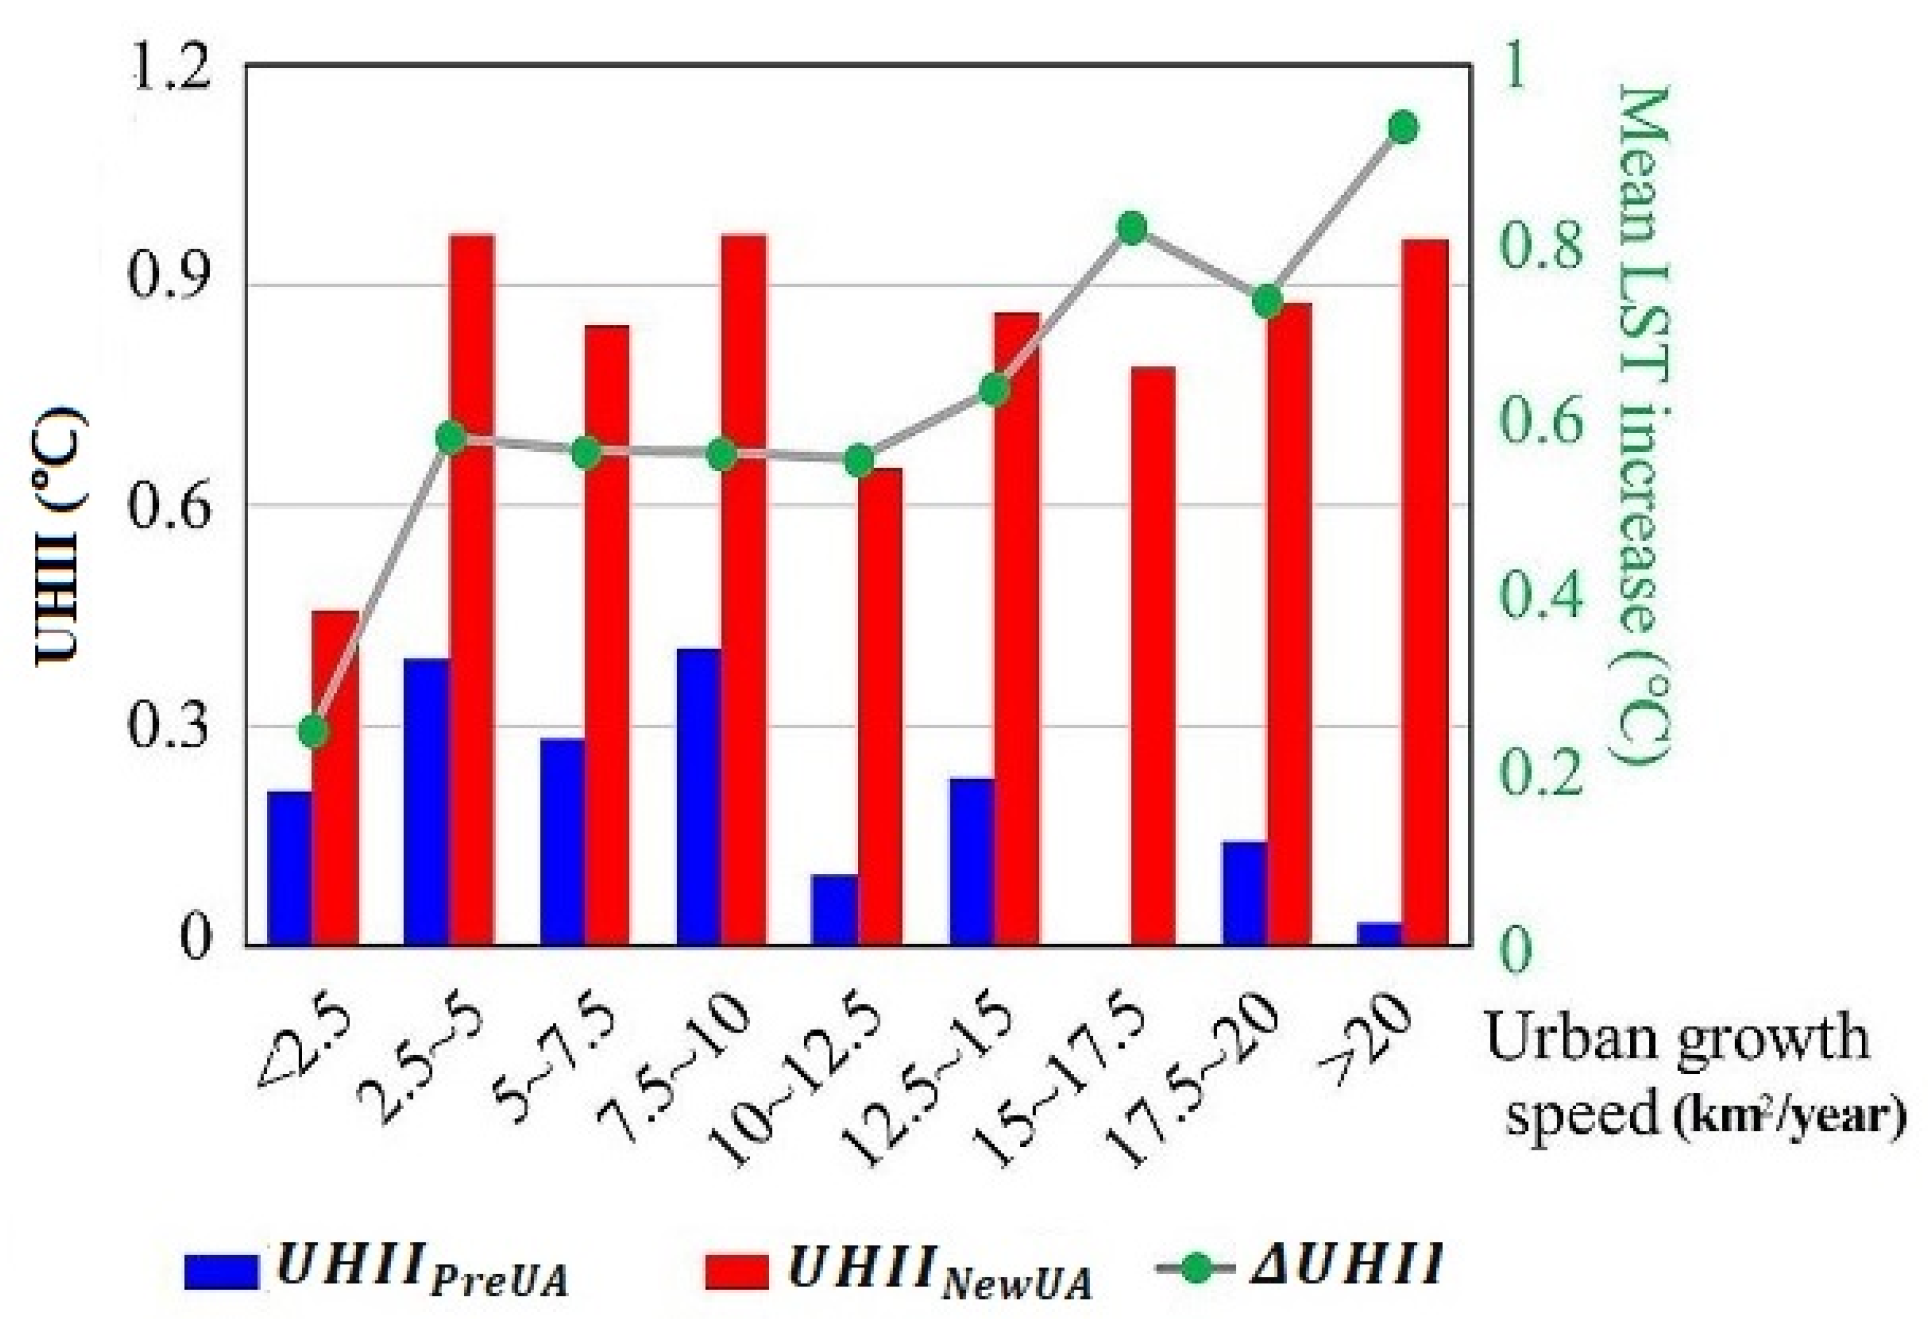
Figure 7.
Area proportions of different LST dynamic trends in response to urban growth speed: (a) administrative boundary, (b) previous UA, and (c) new UA.
Figure 7.
Area proportions of different LST dynamic trends in response to urban growth speed: (a) administrative boundary, (b) previous UA, and (c) new UA.

Figure 8.
Urban heat island intensity (UHII) of the previous UA and new UA related to urban expansion percentage.
Figure 8.
Urban heat island intensity (UHII) of the previous UA and new UA related to urban expansion percentage.
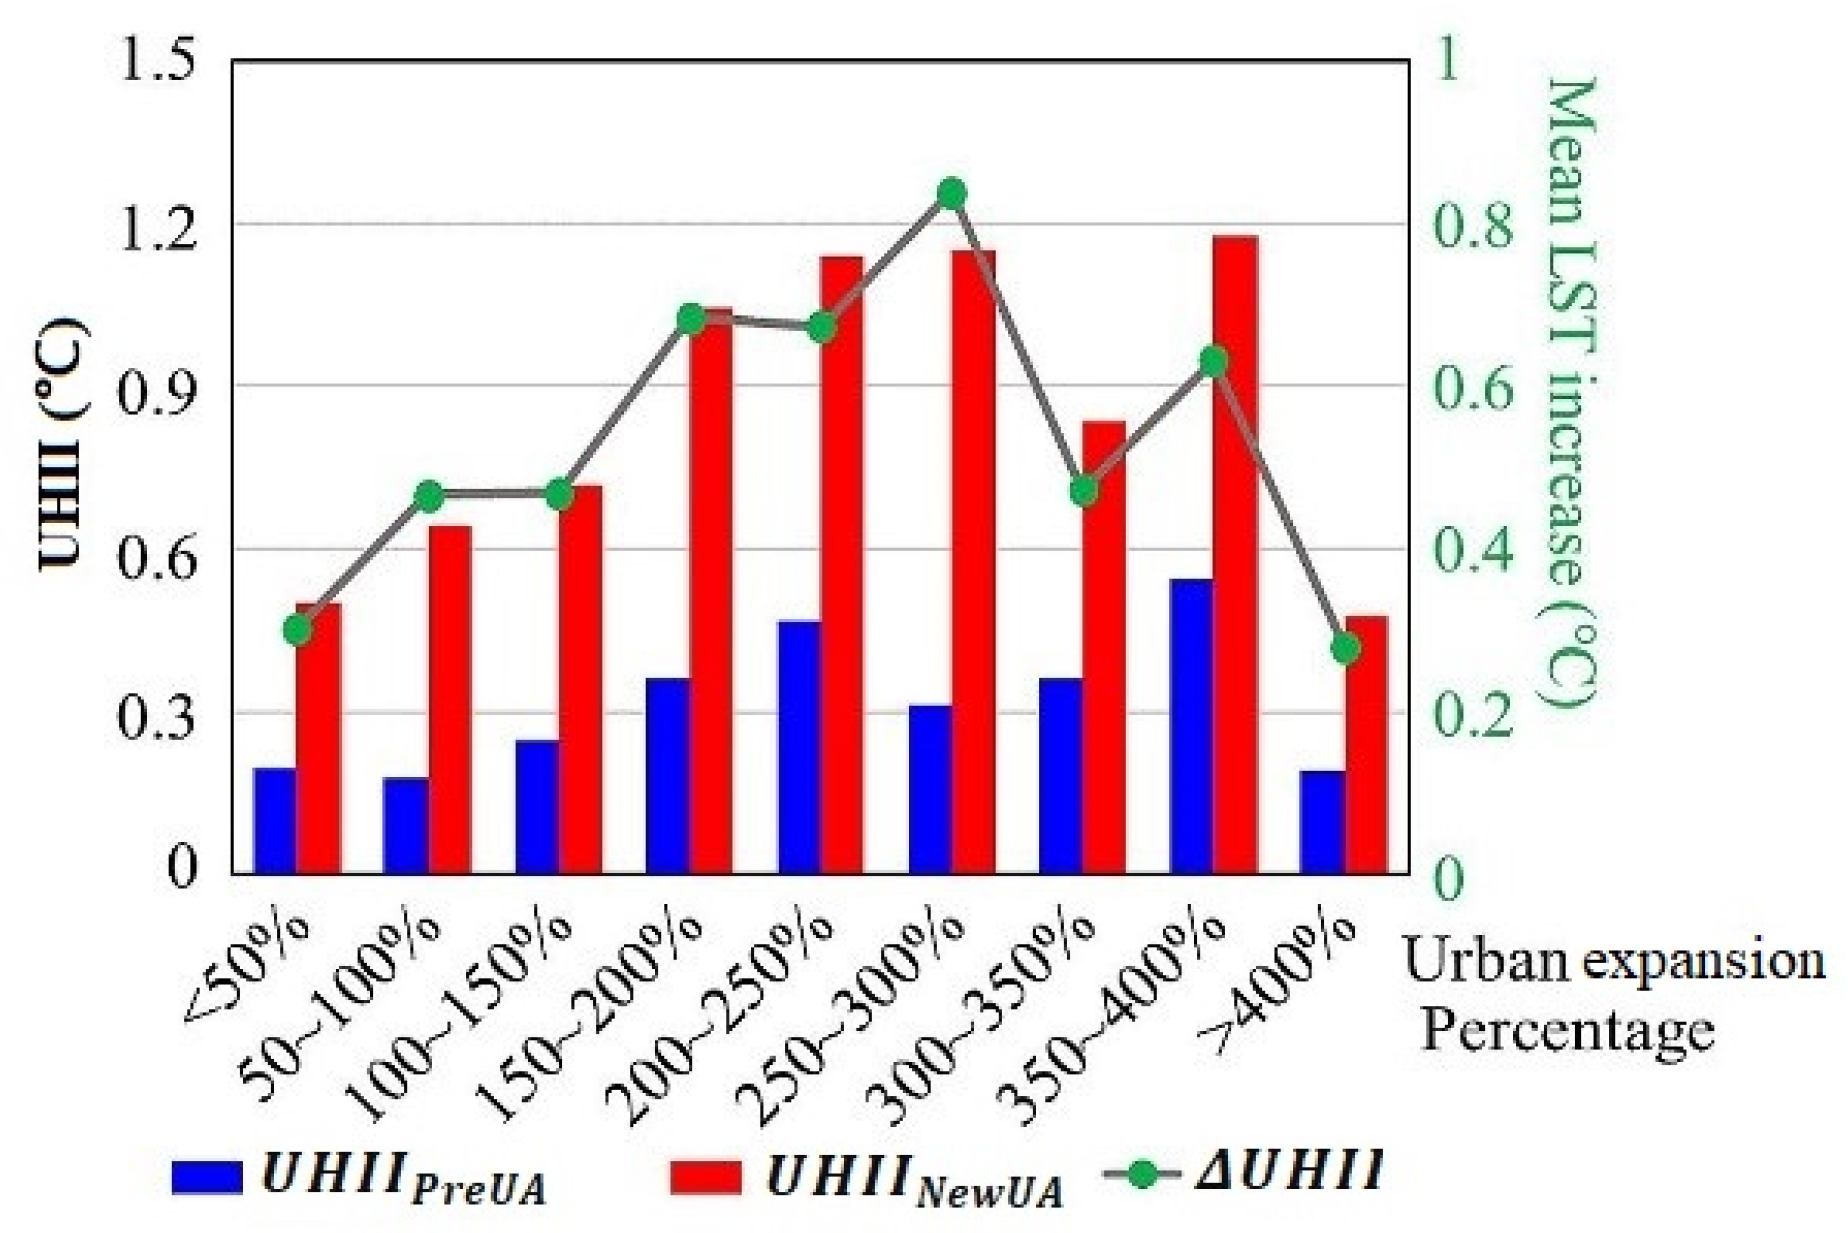
Figure 9.
Area proportions of different LST dynamic trends in response to urban expansion percentage: (a) administrative boundary, (b) previous UA, and (c) new UA.
Figure 9.
Area proportions of different LST dynamic trends in response to urban expansion percentage: (a) administrative boundary, (b) previous UA, and (c) new UA.

Figure 10.
Correlations between LST increase and urban growth in the (a,c) previously existing urban land (previous UA) and (b,d) newly expanded urban land (new UA).
Figure 10.
Correlations between LST increase and urban growth in the (a,c) previously existing urban land (previous UA) and (b,d) newly expanded urban land (new UA).

Table 1.
Features of data.
| Product | MYD11A2 | NLUD-C |
|---|---|---|
| Band | LST_Day_1 km | Land use/cover |
| Time resolution | 8 days | 5 years |
| Spatial resolution | 1 km | ----- |
| Time period | 2003.01.01–2018.12.31 | 2000–2015 |
| Coverage scope | China | China |
Table 2.
Area proportions of different dynamic trends in urban areas.
| Urbanized Areas | Area Proportions of Decreasing Trend (%) | Area Proportions of Increasing Trend (%) | ||
|---|---|---|---|---|
| Significant | Slight | Significant | Slight | |
| Previous UA | 1.95 | 23.31 | 30.78 | 43.96 |
| New UA | 1.42 | 11.61 | 63.95 | 31.32 |
Disclaimer/Publisher’s Note: The statements, opinions and data contained in all publications are solely those of the individual author(s) and contributor(s) and not of MDPI and/or the editor(s). MDPI and/or the editor(s) disclaim responsibility for any injury to people or property resulting from any ideas, methods, instructions or products referred to in the content. |
© 2024 by the authors. Licensee MDPI, Basel, Switzerland. This article is an open access article distributed under the terms and conditions of the Creative Commons Attribution (CC BY) license (https://creativecommons.org/licenses/by/4.0/).
Share and Cite
MDPI and ACS Style
Yu, S.; Zhu, Z.; Zhang, Z.; Cai, S.; Liu, F.; Zhao, X.; Wang, X.; Hu, S. Land Surface Temperature Changes in Different Urbanization Increments in China since 2000. Land 2024, 13, 417. https://doi.org/10.3390/land13040417
AMA Style
Yu S, Zhu Z, Zhang Z, Cai S, Liu F, Zhao X, Wang X, Hu S. Land Surface Temperature Changes in Different Urbanization Increments in China since 2000. Land. 2024; 13(4):417. https://doi.org/10.3390/land13040417
Chicago/Turabian StyleYu, Sisi, Zijuan Zhu, Zengxiang Zhang, Shangshu Cai, Fang Liu, Xiaoli Zhao, Xiao Wang, and Shunguang Hu. 2024. "Land Surface Temperature Changes in Different Urbanization Increments in China since 2000" Land 13, no. 4: 417. https://doi.org/10.3390/land13040417
Note that from the first issue of 2016, this journal uses article numbers instead of page numbers. See further details here.