
Leveraging Reed Bed Burnings as Indicators of Wetland Conversion in Modern Greece

Department of the Environment, University of the Aegean, 81100 Mytilene, Lesvos, Greece
*
Author to whom correspondence should be addressed.
Land 2024, 13(4), 538; https://doi.org/10.3390/land13040538
Submission received: 2 March 2024
/
Revised: 8 April 2024
/
Accepted: 15 April 2024
/
Published: 18 April 2024
(This article belongs to the Special Issue Land Use/Land Cover and Natural Hazards: Interactions, Changes, and Impacts II)
Abstract
:This study explores the historical occurrence of wetland ecosystems in Greece by using recurring Phragmites australis (common reed) burnings as an indicator. Phragmites australis, a plant closely associated with wetlands, provides excellent insights into wetland distribution. We establish a substantial association between reed fires and historical wetland existence in Greece using geographical and statistical analysis, with these fires exhibiting remarkable constancy across time. Using Corine land-cover (CLC) data, we extend our analysis into land-use dynamics, demonstrating that places with the highest reed-bed-fire rates were originally wetlands, particularly those converted into permanent irrigated land and areas with complex agriculture patterns. We find spatial commonalities between reed fires and past wetland existence by analyzing fire occurrence across three main categories: reed fires, agricultural land fires, and grassland fires. Historical records of wetland conversion into agricultural land (or land reclamation works) in locations such as Yianitsa and Kopaida give context to our findings. Visualizations confirm the clustering of reed fires around these converted agricultural regions. In summary, our study offers a unique indicator based on Phragmites australis burnings that can be used to identify previous wetland-type ecosystems, with Mediterranean-wide implications. Despite data constraints, this study adds to the conversation about wetland preservation and sustainable land-use management.
Keywords:
wetland; Phragmites australis; land reclamation; land use; fire statistics; burning; Corine data1. Introduction
Land-use (LU) and land-use–cover change (LUCC) science has skyrocketed during the last half-century (exponential growth r = 6.57/year). From a few tens of publications/year in the 1970s and 1980s to several tens of thousands/year in the last decade (Web of Science records, ca 350,000 publications as of the end of 2023). From an epistemic point of view, almost 99% of the abundant LU/LUCC literature has traditionally used case-study approaches for in-depth investigations of land-use change processes and impacts rooted in a particular place and context but inherently limited to the historical and social-ecological contexts of the case [1]. Complementary meta-analysis and meta-studies [2,3,4] aim to synthesize case study findings to uncover statistical regularities and fit individual empirical cases in a certain common framework, methodologically and conceptually, regarding, e.g., deforestation, urbanization, desertification, or agricultural change [5,6,7,8]. From a thematic point of view, emphasis is mainly given to biogeochemical cycles and processes [9], eco-system service valuation [10], and their connection to human well-being [11].
Corresponding research on wetlands is at most 3.6% of the total LU/LUCC literature. This might appear at first sight paradoxical, given that (1) wetland losses, conversion, or degradation occur worldwide, sometimes at excessively high rates, although slight regional deviations might exist, peaking among ecosystem types, with up to 87% of global wetland resources having been lost since 1700 CE [12]; (2) the average annual rate of natural wetland loss is over three times faster than the average annual rate of loss of natural forests, i.e., −0.78%/year vs. −0.24%/year, respectively [13,14]; (3) rates of natural wetland loss have accelerated to −1.60%/year since 2000 [15]; (4) wetlands (coastal wetlands, freshwater swamps and marshes, and peatlands) encompass about 8% of the earth’s terrestrial surface and account for about 45% of the total economic value of all global ecosystems [16], initially estimated at ca 5000 × 109 USD (1994)/year [17]. Such an astronomical amount comes from the functions and processes wetlands contribute to human well-being, e.g., wildlife habitat support, water supply, carbon sequestration, the purification and filtration of agricultural pollutants, foods, medicine, and different recreational facilities [11,12]. One should notice that the cultural services of wetlands [18], among those of scientific interest, rank highly after utilitarian ones, e.g., for water regulation or waste management [17]. However, one should avoid misunderstandings or misinterpretations of the multifaceted study of wetlands despite its limited relative percentage within overall the LU/LUCC literature. It promotes or produces notable progress in fields supporting the specific interest of this article, e.g., remote sensing [19,20], ecology and biology of hydrophilous species, or focused conservation practices and guidelines [21,22].
Wetlands have been drained, converted, or filled in for centuries, with the anthropogenic drivers being agricultural and industrial production, urbanization, infrastructure development, water-use and -availability changes, disease control, and aquaculture, aggravated under climate change pressures [23,24,25,26]. Within that context, in a thorough analysis of the future of Mediterranean wetlands that could serve as a methodological guide worldwide, 50 key issues are cataloged and classified as conservation research priorities [27]. Among issues considered as “overlooked”, i.e., likely to have a significant impact on Mediterranean wetlands but which are currently not well known in this regional context, increased fire risk within Mediterranean wetlands and their watershed figures are the highest-scoring issue within the physical environment and climate change issue cluster. The low-intensity prescribed fires in non-inundation periods are also reported as one conservation practice to control invasive species and increase wetland vegetation coverage and diversity [28].
Given the above, the present case study intends to explore the combination of four disparate sources of evidence of original wetland distribution in Greece. First, the pyrogeography [29] of reed bed fires in Greece; second, the use of Phragmites australis as a wetland habitat condition indicator species [30]; third, the Hellenic Firefighting Corp statistics—following the European harmonized classification scheme of fire causes protocol [31]; and fourth, the history of large-scale hydraulic works (called land reclamation works) undertaken during the last two centuries in Greece, i.e., the emergence and expansion of Greece as a modern nation state (1830).
The fundamental evolution of the modern Greek state is intricately connected to the extensive drainage of its wetlands [32]. Historical records indicate that the nascent government faced significant challenges in fostering the country’s development. In response to the demand for real estate and agricultural land and securing food resources for its growing population, the state resorted to the systematical drainage of its wetlands until the 1960s. An estimated loss of 63% of the original wetland areas in Greece has occurred over the twentieth century [33]. This historical context is essential for comprehending that wetlands once characterized Greece’s landscape despite its mountainous terrain or the dominant public perception as an insular setup. These former wetlands now constitute the existing plains and agricultural lands that play a crucial role in the country’s current landscape and farming practices [34,35,36]. Today, about 400 large and small wetlands are inventoried in Greece. Despite the heavy losses during the last two centuries, their total area remains large (210,000 ha) [33]. Noteworthily, coastal and insular wetlands also suffer from multiple threats, mainly, relating to tourism development [37], although they are pivotal in ensuring functional connectivity for trans-Saharan migratory birds’ flyways [38].
The detailed recordings of the recurring burnings of resilient reed beds, including the geographic coordinates, area, and duration of individual fire events, help approximate the original distribution of wetlands in Greece. We hypothesize that the geography of reed bed fires or burnings, a “weed control” practice extensively applied wherever common reed stands recover, might allow the initial wetlands’ distribution to be reconstructed before the most extensive land-use–cover change processes initiated in modern Greece. Regarding the scientific method we follow, it embodies empiricism, careful observation, and rigorous reasoning. One might risk qualifying this approach as an attempt to exploit solid bodies of knowledge and techniques, e.g., remote sensing, species biology, and conservation practices, to advance our understanding of wetland history and conservation. Therefore, the focus is synthesizing verisimilar storytelling of wetlands’ fate in modern Greece rather than developing or improving technical aspects or data.
The spatial distribution of reed bed fires or burnings is contrasted with known land reclamation projects in Greece to control for the validity of the rationale that reed bed burnings might approximate historical wetland conversion into other land uses. For that purpose, Corine land-use data from two flag cases of drained lakes and marshes in Greece vs. two existing wetlands serve as a platform for the current situation in the corresponding geographical scale.
The paper develops around the following questions:
- What is the spatial distribution and magnitude of reed bed fires in Greece between 2000 and 2022?
- Is it feasible to construct pyrogeographic maps of high resolution for reed beds?
- Are there specific land-cover types, such as permanent irrigated land and areas with complex cultivation patterns, that exhibit a high frequency of recorded reed bed fires?
- How does the historical context of land conversion initiatives in land-reclaimed areas relate to the current distribution of reed bed fires?
Through these questions, we aim to quantify and establish the connection between these periodic burnings and degraded wetlands to contribute to the conversation surrounding land conversion and its potential long-term effects on different ecosystems. Acknowledging an area’s past geomorphological and ecological characteristics is crucial for reclamation works since long-term effects must be assessed for feasible, sustainable development scenarios. Ultimately, the hypothesis was that the current interaction between humans and natural land expressed through fire allows for reconstructing a past image of Greek wetlands.
2. Materials and Methods
This section addresses the various clusters of biological and historical information and actual fire statistics integrated into a verisimilar narrative to establish the potential of recurrent reed bed burnings to reconstruct the original wetland distribution in Greece. Before delving into the core content of this research paper, it is imperative to provide some preliminary remarks that offer clarity and context for our study. These remarks serve as a foundational guide for readers to navigate the language, calculations, and terminologies utilized throughout the paper.
2.1. Terminology
Here, we provide definitions of terms central to our narrative. Specifically, they are as follows:
Original Wetlands: “original wetlands” denote the wetland areas that existed in their natural state before changing due to human activities, including drainage and conversion into other land-use types.
Reed Fires: Throughout this study, we refer to “reed fires” as incidents involving the burning of Phragmites australis, a common reed species. This terminology is used interchangeably with “reed bed fires” and encompasses fires occurring within wetland-type environments, affecting other helophytes.
Corine Land-Use (CLU) Data: The Corine land-use dataset classifies various land-cover categories, offering a comprehensive understanding of land-use dynamics. This dataset encompasses diverse classes, from urban areas to natural vegetation, aiding in analyzing land-use changes.
Stremma: The term “stremma” is a unit of surface measurement used in Greece, equivalent to 1000 m2 or 0.1 hectares or 0.001 sq. km. This paper uses this unit to quantify the area affected by fires and land-cover classifications according to the Hellenic Statistic Service (ELSTAT) accounting metric system.
NUTS: NUTS is a geographical nomenclature subdividing the economic territory of the European Union (EU) for statistical purposes into a hierarchical system divided into three levels since 2003. NUTS 1: major socio-economic regions, NUTS 2: essential regions for applying regional policies, NUTS 3: small regions for specific diagnoses. A NUTS 0 level, usually co-incident with national boundaries, is also available. A NUTS 3 level for Greece is equivalent to the former 51 prefectures. This number climbs to 74 when individual islands, administratively combined into a single prefecture, are listed separately.
Pyrogeography: “An emerging discipline that provides the intellectual framework to understand the complexity of fire on Earth” [29], whose scientific program’s core mission is the understanding and interpretation of the spatial (local to global) and temporal scales and patterns of the combustion of biomass.
2.2. Phragmites australis (Common Reed): Traits and Reed Bed Burnings
In this paper, we refer to Phragmites australis (common reed) in the sense of morphospecies, adopting the Oxford Reference definition in the Dictionary of Plant Species: “a group of biological organisms whose members differ from all other groups in some aspect of their form and structure (see morphology), but are so similar among themselves that they are lumped together for the purposes of analysis”. We consider that the morphospecies taxonomy best matches the level of knowledge of the average firefighter recording the fire event in the field. P. australis is a cosmopolitan wetland grass typically associated with standing water up to 1 m deep or even as a floating mat but also with damp ground or wet soil, a proxy indication of previously inundated land. The connection between the presence and abundance of P. australis and wetland soil types is well established, as a voluminous literature is available on the strong correlation between the two [39,40,41,42,43,44,45,46]. In suitable habitat conditions, e.g., hot summers and fertile growing conditions, P. australis effectively spreads (5 m or more per year) through a strong network of rhizomes, horizontal runners putting down roots at regular intervals, and a rich-soil seedbed. P. australis may be used as a species indicator of the specific type of ecosystem. Appearances of P. australis in reclaimed-land and drained-wetland locations may assimilate natural-wetland periodic-fluctuating conditions during the year when the soils are unsaturated and aerated [44].
Its competition-related functional phenotypic traits [47,48], e.g., fast growth rate, low wood density, high leaf area, and fast recovery after disturbance, besides its worldwide spread, may explain “reeds” sensu lato persistence, expansion, and invasiveness [46,47,48,49,50,51,52,53]. Then, one might easily identify the polysemic status of the species in the literature according to authors’ research and conceptual priorities, e.g., conservation or biogeochemistry [54,55]. Similar divergences might be identified in the ecosystem services and socio-economic domains [47,48,49]. On the contrary, from the ecological engineering perspective, P. australis is often hailed in phytoremediation and greywater treatments [46]. Overall, the actual relationship, at least at the utilitarian or practical level, between P. australis and humans competing for wetland habitats can be described as “good” and “bad” news, depending on the circumstance [36,46]. Therefore, the adaptive feature of the plant allows it to regrow from its rich seedbed [46] routinely over one or three years, making its control follow the same pattern of reoccurrence. Appropriate indicators of wetland fire resilience should consider that fire-impacted wetland rapidly recovers plant cover, not carbon storage and plant biomass [52]. The common reed is a food source in grazing-marsh livestock or even for humans following certain diets and presents significant carbon dioxide uptake [54,55]. When considered as a non-native species or in land-reclaimed locations, it is perceived as a pest to be controlled [56].
Since no biological control methods for Phragmites are currently available, landowners have resorted to routine burns of reeds to prepare their land for its appropriate use [57]. The need to control Phragmites in some places has resulted in the need for proportionate legislation. Such a need is found in the US, where, as described in A Landowner’s Guide to Phragmites Control, a burn permit must be issued from the local fire department for a routine extraction [58,59]. Burning is the lowest-cost method for landowners as other pesticides are highly damaging to the surrounding environment or ineffective on the reed population [60]. As previously mentioned, the recommended control method is to impose numerous stressors on the plants, but while burning is the most cost-effective and environmentally sound practice, we discover the current condition within Greece, where a significant quantity of data has been documented on the routine burning of reed beds [58].
2.3. Reed Bed Burnings as Mediators for Inference of Wetland Distribution
The methodological substratum of our exercise relates to the issue of inferring human–P. australis interactions (or wetlands in extenso), as actors historically competing for land, from spatial reed-bed-burning data [60]. As an axiom, we assume that the spatial distribution of any taxon, P. australis hereto results from all abiotic and biotic ecological interactions. Consequently, an (or some) underlying, potentially dynamic probability distribution that predicts and explains the taxon distribution should exist [59,61,62]. Then, identifying the principal factors and their relative impact that constrain the occurrence of P. australis might permit a better understanding and model of the current and future distribution of the species, as current research in ecology and biogeography steadily enforces [62,63,64], but also its past distribution, as we try to accomplish here. In this case, biotic interaction limitedly implies the P. australis—human interaction through burning, and abiotic interaction implies wetland-type soil and hydrological conditions and the presence of the indicator species.
Theoretically, the challenge is to calculate the joint probability distribution P(W,R), where W represents a “wetland”, and R is a reed fire event over a space, Greece hereto, using data from arbitrary spatial resolution [65]. We divided Greece into uniform square spatial cells, xα, and counted the Boolean variables (presence/absence) of W and R over the grid. Using Bayes’ theorem, this joint probability is formulated as
and the posterior conditional probability distribution P(W|R) is as follows:
In our case, the goal is to calculate the prior probability distribution P(W) given the information R via the likelihood P(W|R) and the evidence P(R), according to the available data. Using the Naïve Bayes’ approximation [66]:
where N is the number of grid cells considered.
It is almost self-evident that this formulation needs more depth since it is based on official fire statistics data collected by non-specialist firefighters. For instance, more than ten Corine Label 3 LU categories, e.g., estuaries, water bodies, inland marshes, etc., are cataloged as single “wetlands” in the Firefighting Corp database. Notice that in the Greek literature on wetlands (primarily coordinated by Gerakis PA since 1993), 27 types of natural and artificial wetlands are listed. The same applies to identifying other helophytes, e.g., Scirpus sp. or Typha sp., occurring (or co-occurring) in “wetlands”. The orthodox formulation would include Wi and Ri as the various alternatives for wetland types and different taxa. Furthermore, the alternative features of W are considered independent.
The most exciting part of this approach is the calculation of the probabilities of co-occurrence P(W,R) and P(W|R). Both are approximated as relative frequencies over N cells, i.e.,
However, regarding information, the probability P(, i.e., the complement probability of absence of a “wetland”, is equally important. Then, as [62] proposed, the evidence function P(R) is often not relevant for classification, with a score function as follows:
Then, when S(W|R) > 0 per cell, one might interpret this condition of reed bed burning, i.e., the wetland indicator species, in areas that are currently converted wetlands as a strong indication of the existence of original wetland habitats.
One might plausibly hypothesize that P(W|R) will have a high value in cells, including elements of the hydrographic network, the “wetlands” that are characterized as Ramsar wetlands, and the wetland-related LUs as recorded in the Corine Label 3 maps (Figure 1a–c).
2.4. Fire Statistics in Greece
Fire data have been recorded in Greece since 1955 [68]. Since 2000, the wildfire database has been adapted to the European Fire Fighting Information System (EFFIS) and integrated into the Copernicus platform [69]. Table 1 presents the typical recording of any single fire event.
As pointed out earlier, wetland drainage and conversion were a core governmental strategy in Greece, addressing the need for agricultural land, primary sector productivity, and public health, especially in controlling malaria and other mosquito-borne diseases in rural populations [70]. Large-scale, costly works that transformed Greece’s landscape are presented in Table 2. One should notice, however, that although mainly small-sized wetlands have continued to suffer losses in recent decades, primarily due to inadequate environmental governance and landowners’ delinquency, hydraulic works are shifting towards dam construction, water reservoirs, and channels, or flood control mainly for irrigation and water supply purposes. Artificial lakes, i.e., Lake Kerkini in Northern Greece, are listed as Ramsar wetlands of international importance. Further, more than 800 wetlands on 75 islands in the Aegean and the Ionian archipelago have been discovered and detailed, and a Presidential Decree signed in June 2012 strictly protects 380 of these minor (<8 hectares) natural island wetlands [71].
2.5. Large Wetland Reclamation Works in Greece (1830–1960)
For almost a century, converting extensive wetlands, mostly marshes and lakes, into agricultural land was a timeless central choice regardless of the governments in power. A total of ≈3,300,000 stremmas (or 330,000 ha) of wetlands have been actively converted into agricultural land through large-scale “land reclamation works”. This has occurred regardless of the thousands of minor-scale interventions originating from local authorities, individuals or co-operatives of farmers, tourism developers, etc. The core assumption of our approach is that reed bed burnings are expected to cluster, primarily along locations visualized in Figure 1a–c and the locations of drained wetlands in agricultural areas. For further details, see Table 2.
2.6. Indexes, Hypotheses, and Statistics
This sub-section presents the primary index used in fire suppression statistics, i.e., the fire severity index (SI). SI is calculated as the ratio between the total area burned during a certain period, usually a year or a month, per vegetation type and the corresponding number of fire events (frequency) in this type. Furthermore, SI may be calculated at various NUTS levels, e.g., administrative divisions (country, region, prefecture) or a certain geographical grid cell. SI and its component values help establish and test three null hypotheses related to the spatial and temporal patterns of reed bed burning. First, anthropogenic reed bed burnings present the lowest SI value among vegetation types, eventually of the same order as crop residue agricultural burnings. This mainly concerns sporadic appearances of post-burning recovering reed stands within agricultural lands. Second, the time series of SI, at any scale, is stationary, suggesting a constancy in basic statistical parameters, e.g., the mean and variance of the SI distribution.
The third hypothesis relates to the differing behavior of SI time series at various time scales. Metaphorically, burning reed beds signals an episode of human-nature interaction in the specific ecological setup of wetlands converted to agricultural land or suffering a plethora of pressures [24]. Suppose one imagines this setup as a single field driven by verisimilar human activities or processes at random locations. In that case, the genuine question is whether there is autocorrelation between burning events and the scale or time lag. In practice, this autocorrelation hypothesis could be controlled through autocorrelation and partial autocorrelation functions in ARIMA (p,d,q)—with or without seasonality decomposition—modeling and the Ljung–Box test, or white noise Fisher’s kappa test. We run these tests at two data samples: (1) a yearly scale, i.e., 23 (2000–2022) SI/year data series; and (2) a monthly scale, i.e., 276 SI/month data series.
Concerning the spatial pattern, the complementary prediction is that the distribution of reed bed burnings matches the hydrographic network and, most importantly, clusters in current agricultural areas that correspond to the original wetlands. This pattern is examined at two scales. First is the national scale, where reed bed burnings are associated with the hydrographic network. Second, at the scale of two symbolic drained wetlands, i.e., Lake Kopaida (the first major land reclamation work) and the Yiannitsa marshes (one of the most significant land reclamation works attempted) in modern Greece (Table 2).
Integrating the Corine land-use (CLU) dataset (levels 1 and 3) provides a comprehensive classification of land-cover categories, enabling a systematic understanding of land-use dynamics. This dataset encompasses various classes that describe distinct land-cover types, ranging from urban areas to agricultural fields, natural vegetation, water bodies, and wetlands (Appendix A). Corine land-use data intersection with reed fires in Greece offers a unique avenue to ascertain the present status of once-wetland areas. By integrating Corine land-use classes with reed fire occurrences, it becomes possible to discern how these areas have evolved, transitioning from wetlands to their current land-use categories. This alignment provides an insightful lens to investigate the contemporary condition of former wetland areas, thereby contributing to a comprehensive understanding of the dynamic interplay between land-use changes, fire incidents, and ecological shifts, as well as the crossover of historical insight in the socioeconomic aspect of the phenomenon.
Hypotheses and predictions are controlled after data are processed using R Statistical Software (v4.1.2). ArcGIS (v. 10.8.2) is then employed for visualizations through coordinates per fire event available (2020–2022) that pinpoint fire distribution trends and clusters. Stationarity and time series statistics were controlled using R (series, v0.10–48), SPSS v.28 forecast functions, XLSTAT time series, and spectral density analyses, including Fast Fourier Transform smoothing. More specifically, the reed fire area dataset was treated to the Augmented Dickey–Fuller (ADF) test to determine its stationarity, critical for making accurate assumptions regarding temporal trends. Furthermore, ADF findings were controlled with the ARIMA model’s stationary R-squared values, previously used to predict the reed fire area time series. To attain stationarity, the ARIMA model, dubbed V2-Model_1, includes a comprehensive set of autoregressive (AR) and moving average (MA) terms and a differentiation step. Finally, the spatial distribution of reed fires and agricultural land utilization is examined through visual cluster land-use (CLU) analysis, where high-density reed fire clusters are identified, pinpointing areas of significant burning incidents. This integrated approach offers precise insights into wetland transformations, aiding informed policymaking for targeted conservation efforts and land management strategies in Greece.
3. Results
3.1. General Description of the Reed-Bed-Fire Phenomenon
During 23 years of observation, 248,537 fire events were recorded in the rural space of Greece; they burned a total of 13,526,844 stremma (or 1,352,685 ha or 13,526.8 sq. km) of various types of vegetation (excluding parklands or spinneys). Reed bed burning corresponds to 15.9% of events and 1.8% of burned areas. To better grasp the hidden significance of such pressures and economic and productive effects, notice that the average rural household farmland ownership is 53.8 stremma when the corresponding European average is 166. Figure 2 presents the relative frequencies of wildfires in various vegetation types and the reed fire size distribution. This information will differentiate the initial causes and effects of reed fires of multiple magnitudes. Notice here that our goal is not technical. In other words, to precisely calculate the value of the scaling factor γ of the classic frequency–size distribution, approximating the power law curve between the lower limit (smaller size) of burned area min and the upper limit, smax (which is de facto truncated) [72,73,74,75,76,77]. Our goal is to propose categories of reed-bed-burning sizes and potential, but not definitive, explanations of the underlying mechanisms in each category.
We call an “individual level event” (grey tone A, left panel, Figure 2) the case of the application of fire to eradicate sparse, rare individuals of P. australis. It corresponds to ≤0.1 stremma (or 0.01 ha) events. Such individual plants might be remnants of earlier burnings or new invading individuals, mainly in agricultural lands. The “point event” corresponds to burnings ≤1 stremma (or 0.1 ha). Most likely, they are a kind of “regrow”, a strip of densely growing reed beds at the edges of agricultural lands near watercourses or artificial irrigation canals. The “local event” corresponds to burnings ≤10 stremma (1 ha). Most likely, they correspond to recovering reed beds, 3–5 years after a similar burning event, most likely of a single farmland owner. The “co-operative event” corresponds to the same condition as the previous one, but most likely is organized and applied by a group of farmers over multiple farm properties. “Watershed events” and “mega-fire events” correspond to large-scale wildfires (order of sq. km.) ravaging various types of vegetation (forests, forested areas, groves, agricultural lands) and the wetland-related vegetation that is situated within the burned area, i.e., existing wetlands or reed beds occupying converted wetland soil types. For instance, the upper-limit-size truncation, smax, in reed burning, i.e., 20,000 stremma (or 2000 ha), occurred in Greece on 23–27 August, mainly in the Peloponnese (Appendix B, NASA Terra satellite image) [78]. There, this mega-fire event burned 1500 km² of forests, accounting for 4% of Greece’s total forest area; more than 1500 houses; and caused 68 human casualties.
Similarly interesting is the spider chart (Figure 3), where frequencies, total area burned, and the severity index for various Corine Label 3 NUTS 0 wetland (existing or converted) Lus are compared. The most intriguing finding that differentiates reed bed burning from other vegetation type Lus is that although the frequency and total area “snowflakes” are somewhat similar in shape, the SI snowflake presents a different morphology, indicating higher severity in existing wetlands rather than in converted ones: the role of human control over reed bed burning in converted wetlands seems indirectly highlighted here.
3.2. Comparison of Wildfire Severity Indexes vs. Agricultural Burnings
Statistical and geographical analysis results confirm the core hypotheses’ validity, as announced in Section 2.4. Specifically, this is as follows:
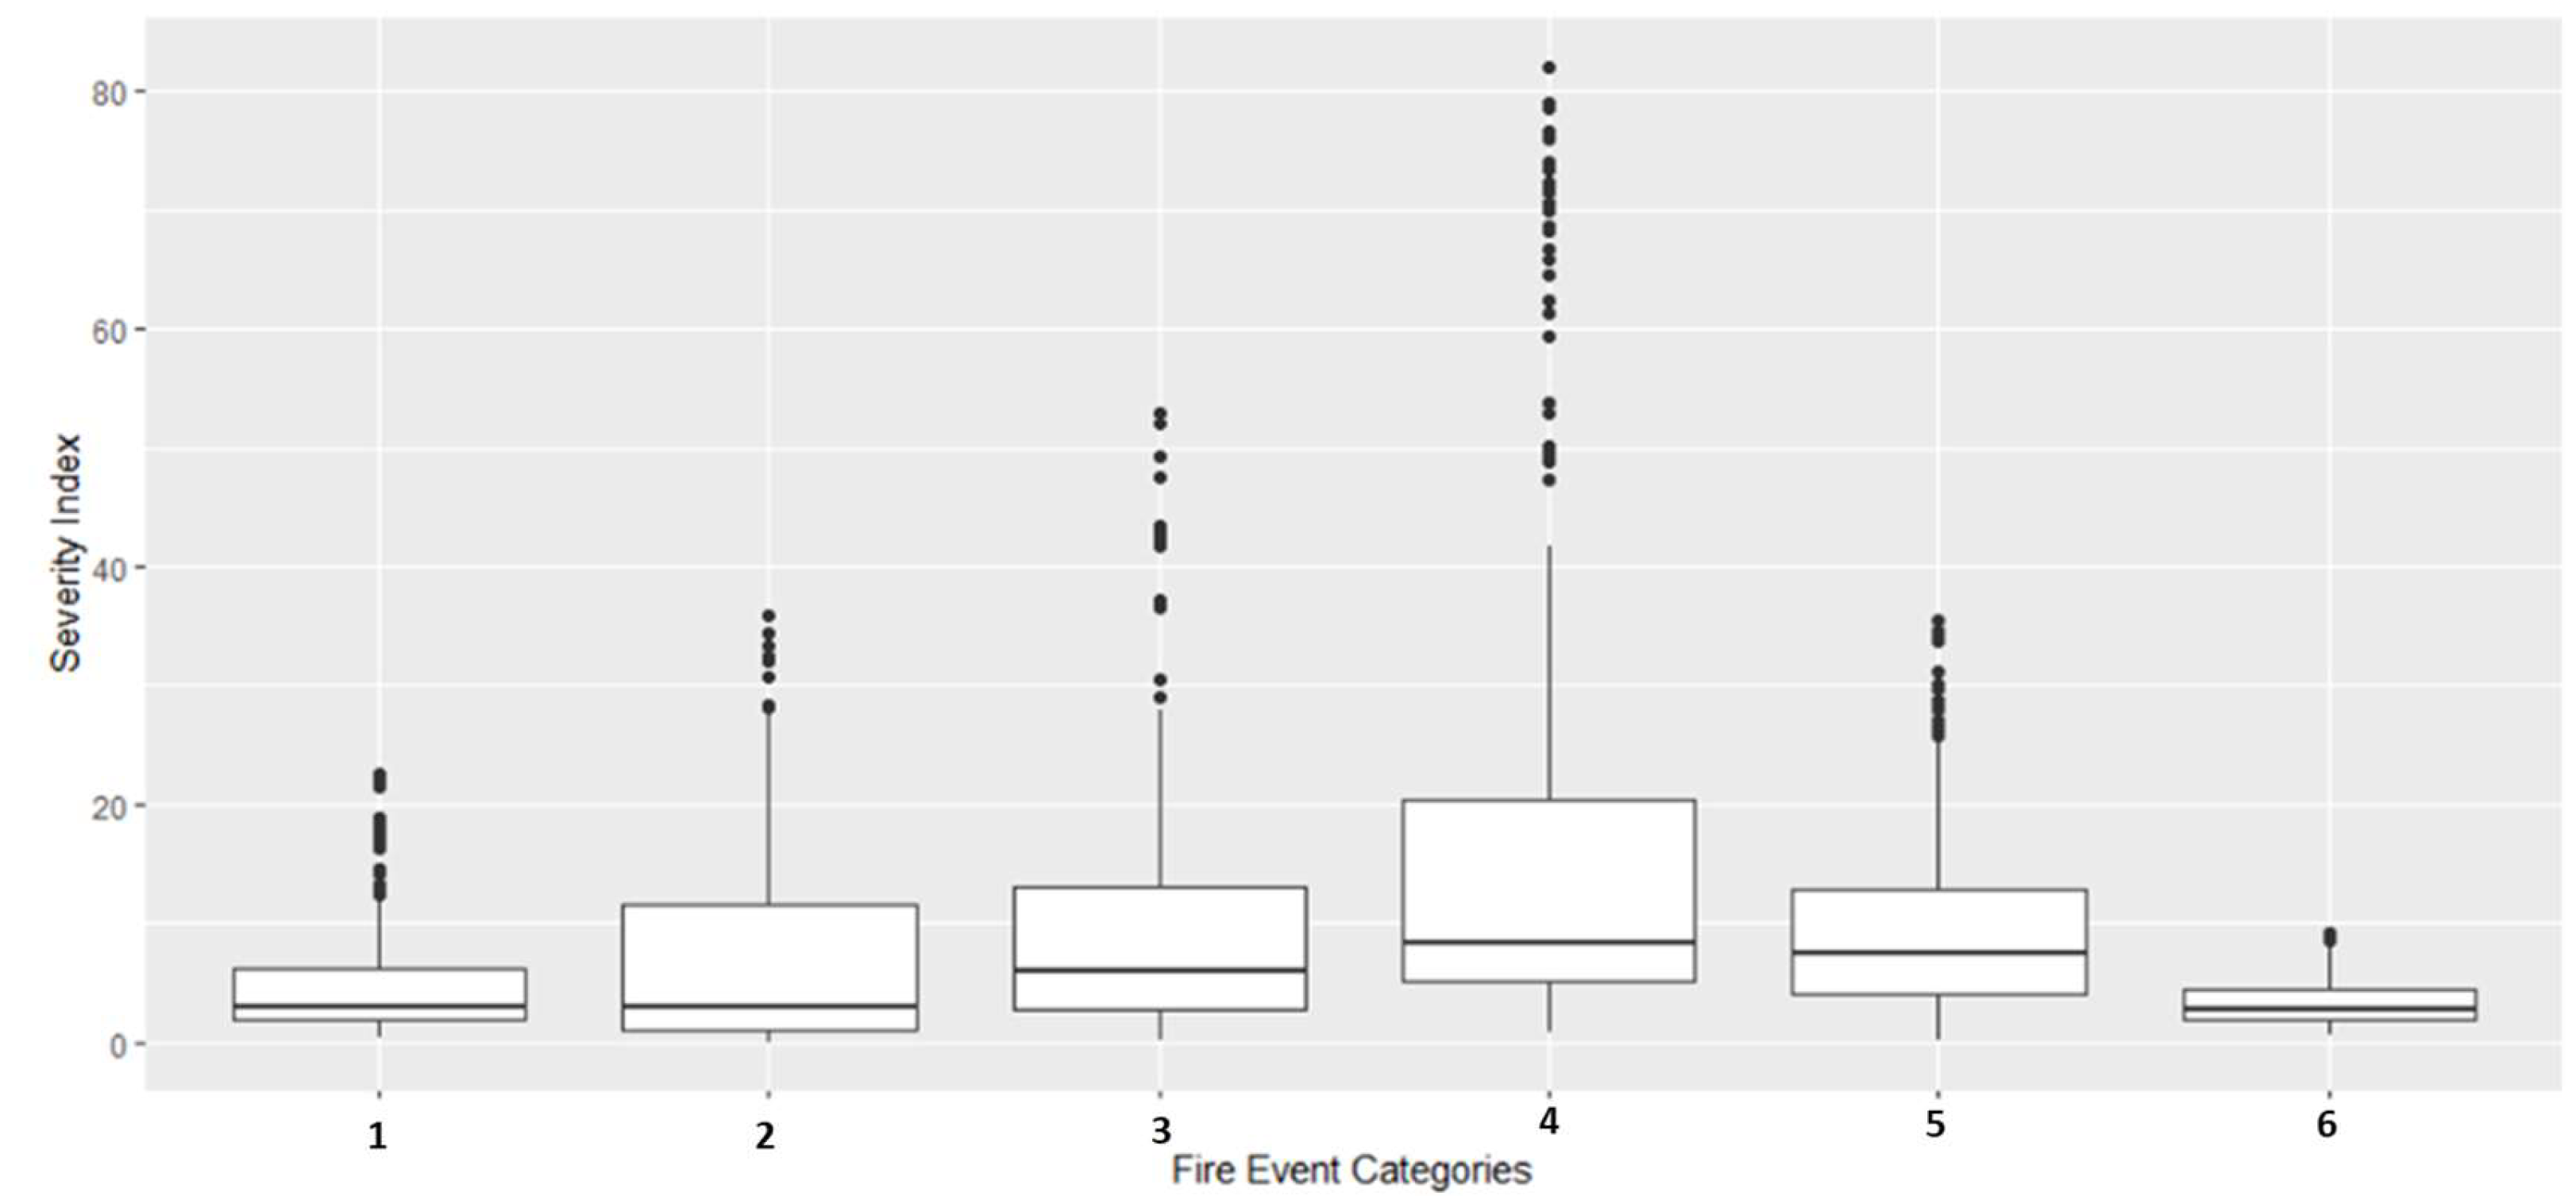
The severity index of reed bed burnings presents the lowest value (μ ± SD) compared to that of other vegetation types, especially crop residue burnings. Figure 4 presents summary descriptives of the Sis of wildfires per vegetation type in Greece during 2000–2022, i.e., six series of 276 measurements each. No series is normal (Kolmogorov–Smirnov test: p < 0.001, a = 0.05), variances of Sis are not equal (Levene statistic p < 0.001), and parametric one-way ANOVA with contrasts is significant (p < 0.001). Tukey’s test indicates a significant difference between distributions of reed bed burnings and forest wildfires.
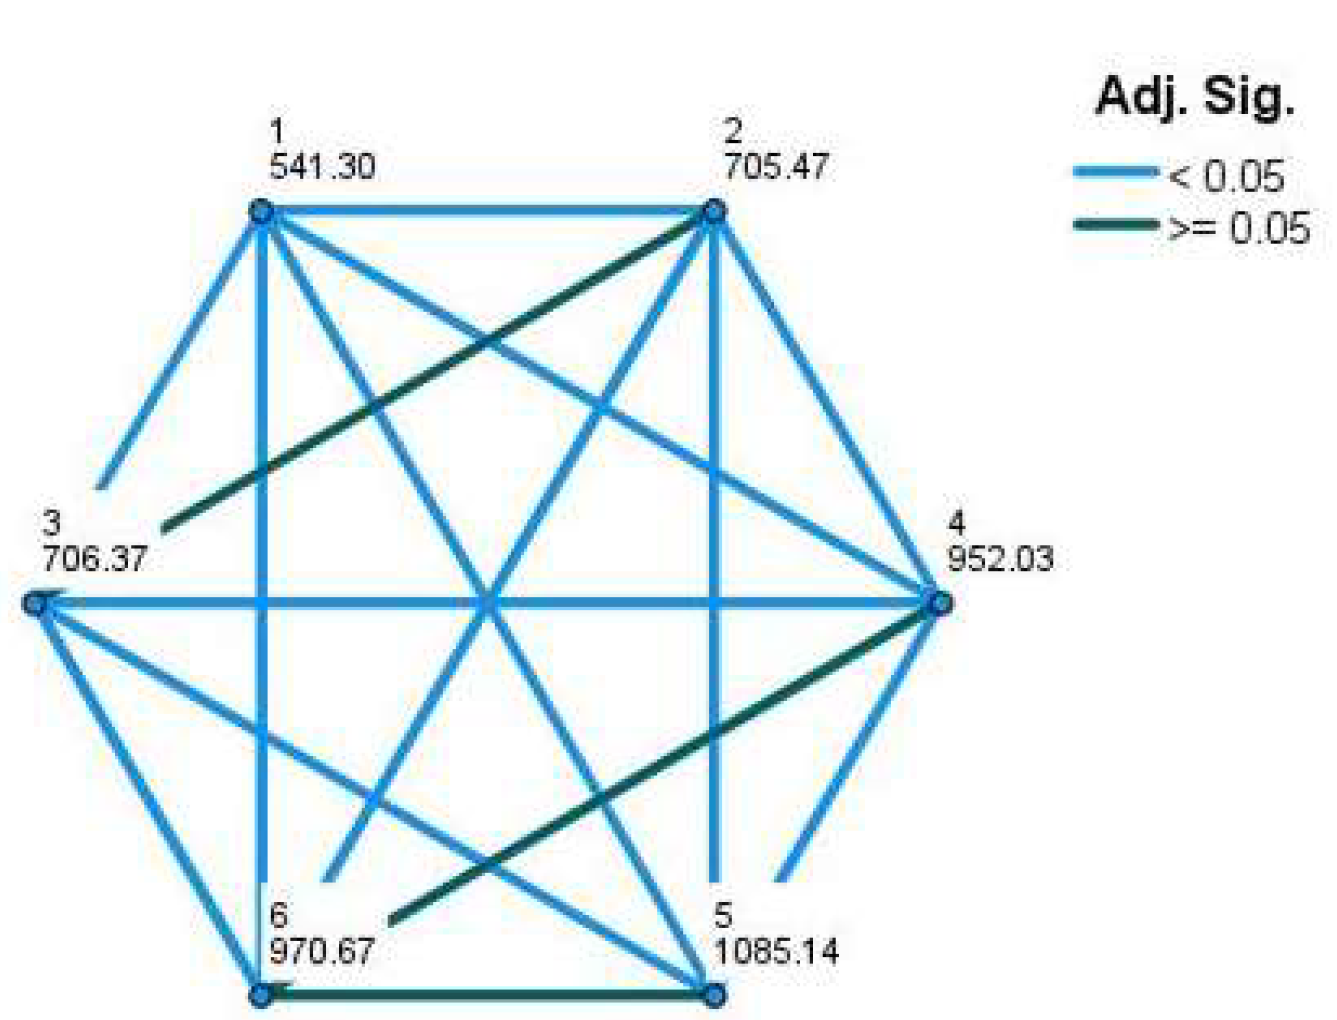
Non-parametric test (independent sample median test and independent sample Kruskal–Wallis test, i.e., same median and same distribution across vegetation types’ Sis, respectively) results rejected the null hypothesis (p < 0.001, a = 0.05). Figure 5 presents the significance of pairwise comparisons of Sis after Kruskal–Wallis independent samples tests. The reed-bed-burning SI differs significantly from all other vegetation types’ Sis, including crop residue burnings.
3.3. Stationarity of Reed-Bed-Burning Time Series
Time series analysis of reed-bed-burning data confirms the hypothesis of the stationarity of the SI of reed bed burnings and its components (area and frequencies/month at NUTS 0). Interestingly, the reed-bed-burning SI is stationary, i.e., its statistical properties, such as mean, variance, and covariance, are independent of the point in time at which they are observed without any data transformation. However, for comparison between the SI series of different vegetation types, data were natural-logarithm-transformed, linear trends were factored out (first-degree differencing), and outliers were removed. In most cases, SI outliers were related to extreme mega-fire events ravaging large areas indistinctively of vegetation types, e.g., the 2007 Peloponnese or the 2021 Attica and Evia events [70,79]. Figure 6 presents the reed-bed-burning series (SI, total area, and frequency/month) during 1/2000–12/2022 at NUTS 0, with natural-logarithm-transformed data and first-degree differencing.
The reed bed monthly burning dataset was subjected to the Augmented Dickey–Fuller (ADF) test to check for stationarity. The Dickey–Fuller statistic for the total area/month is −33.453 with a corresponding p < 0.01; for the frequency/month, the ADF statistic is −6.3751, p < 0.01; for the SI/month, the ADF statistic is −6.5328, p < 0.01. In all cases, the lag order = 6. Then, the null hypothesis of non-stationarity may be rejected, implying that the dataset does display stationary behavior. The significance of the p-value, which is less than the customary threshold of 0.05, emphasizes the resilience of the stationarity observed in the reed-burning dataset.
3.4. Time Series Analysis, Periodograms, and Spectral Analysis in Reed-Bed-Burning SI Series
Autocorrelation and partial autocorrelation in SI reed-bed-burning data series were extensively studied through several ARIMA (p,1,q) models, tested as the value of AR and MA values, and the lags that are taken into consideration (lag 1 to 24). This exercise aimed to examine the behavior of the Ljong–Box statistic, given the ecologically meaningful lags and plausible values of AR and MA. The main finding is that the time pattern of reed burnings differs remarkably when time scale enters into play. To attain stationarity, the ARIMA model, dubbed V2-Model_1, includes a comprehensive set of autoregressive (AR) and moving average (MA) terms and a differencing step. Such a model verifies the stationarity found in the ADF test findings.
Table 3 summarizes the time series analyses, spectral density, and FFT smoothing results at two time scales. The results in Table 3 resemble a verisimilar “umbrella” of slightly differing versions in the computational calculations of various parameters of statistical methods and techniques typically used in time series analysis. The core results can be summarized as follows: First, different-scale time series behave differently, i.e., monthly vs. yearly, as per serial correlations. Monthly-scale series with quarterly periodicity show autocorrelation according to the inclusion of seasonal periodicity or not; the yearly scales do not show serial correlations.
Second, as expected, Ljong–Box and white noise tests, at the yearly scale, concur that the series is significantly different from white noise at a significance level of 0.05. Figure 7 presents indicative graph examples of the above analyses. Overall, one might detect two periodicities in reed bed burning. One relates to local small-scale events, most likely regarding human agricultural burning and management activities (scale of a few ha). The second refers to quasi-decade large-scale wildfires, ravaging complex landscapes, part of which are wetland systems (scale of square kilometers). In both time scales and burning areas, the effect of the 2007 mega-fire event is evident, as well as the return period of such events, that is, of ≤3 years for small-scale events and ≈8 years for large events.
3.5. Spatial Patterns of Reed Bed Burnings
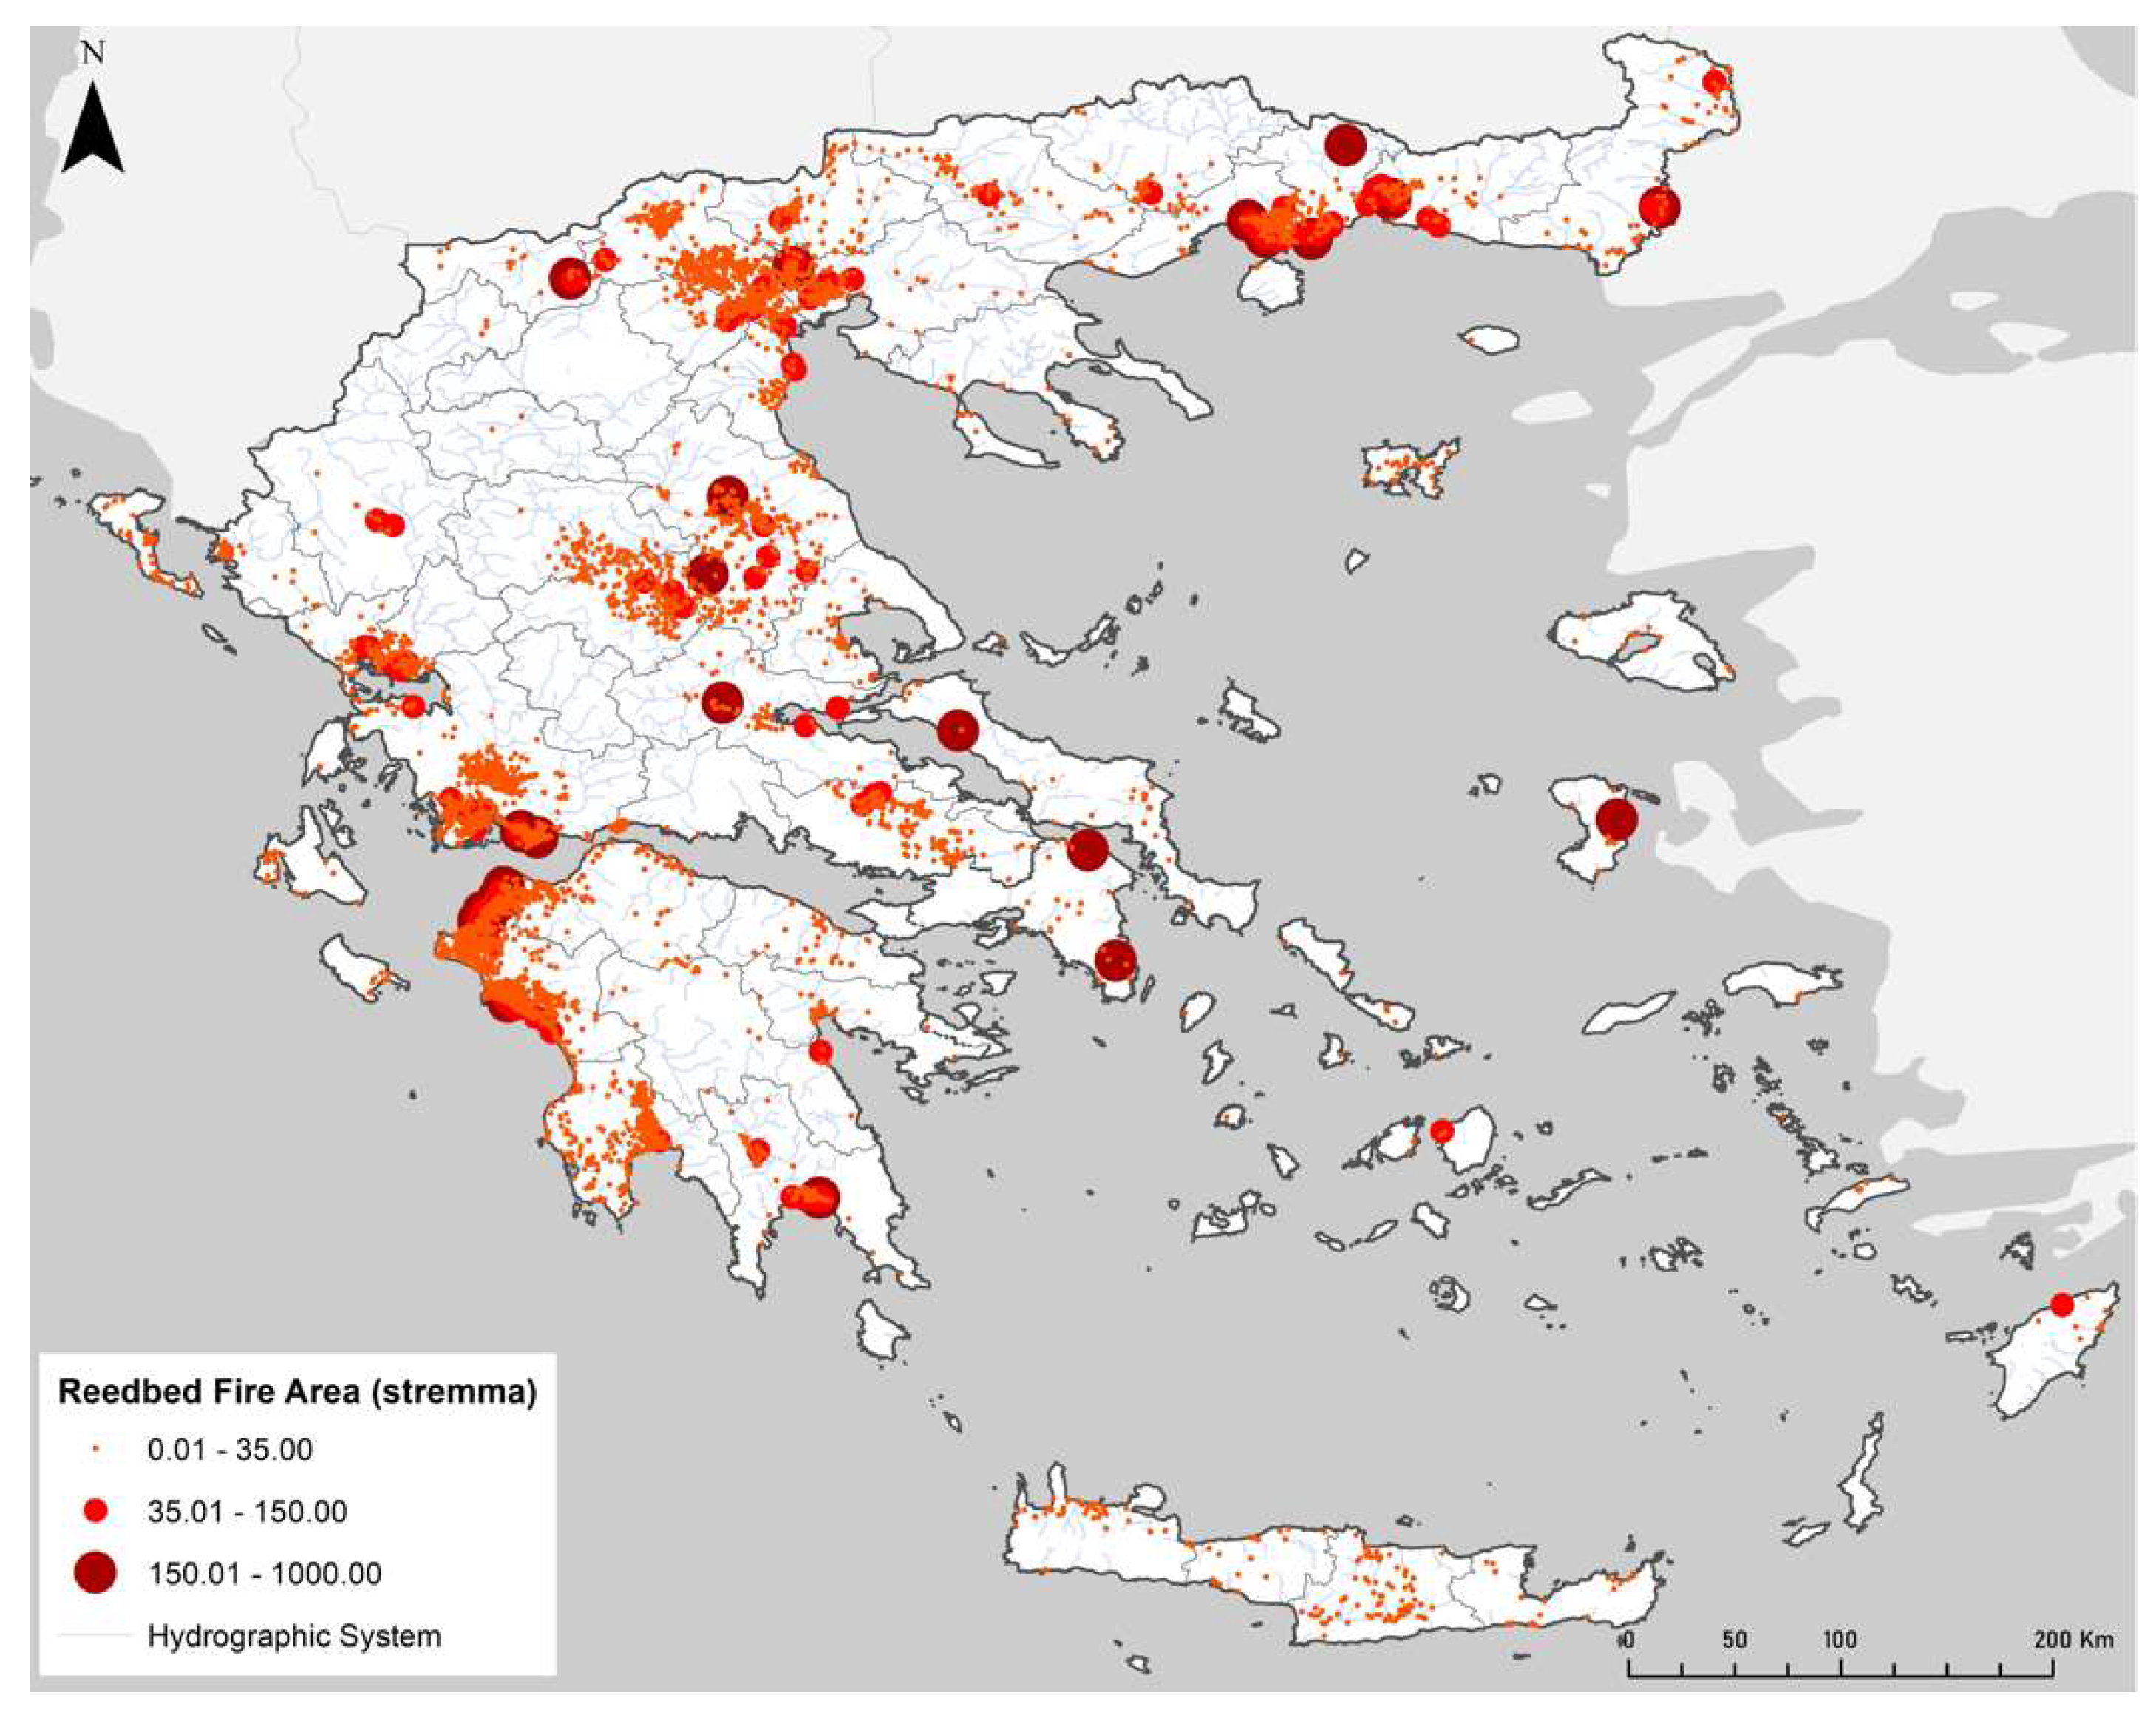
This section focuses on spatial patterns of reed bed burnings, i.e., the complementary aspect of the pyrogeographic analysis. To that end, we present two maps. Map 1 (or Figure 8) presents the totality of reed-bed-burning events (in x/y coordinates) during 2020–2022, for which such data are available in the EFFIS system. One might interpret this figure as the map of reed-bed-burning hotspots in Greece.
Map 2 (or Figure 9) presents the fine-scale distribution of reed burnings in two converted wetlands and two existing wetlands over a Corine Label 3 LU background at a NUTS 0 level. Yiannitsa area is one of the most extensive “land reclamation works”, and Copaida is Greece’s first large-scale lake drainage work (see Table 2). Thrace and Ileia are existing Ramsar wetlands of international importance in the Ramsar Convention list. The reed-burning dots are georeferenced on extracts from the pyrographic data throughout 2020–2022, illustrating the precise locations and intensity of burning events in these wetlands.
“Hotspot” is used here in a casual and evocative manner. Hotspot encapsulates the meaning of an area of elevated burning incidence or prevalence or a geographic cluster of reed-bed-burning cases. It also indicates an area with a high frequency of occurrence or re-occurrence of burning events.
All wetlands suffer extensive reed bed burning, indicating the recovery potential of the indicator species P. australis and the need to apply fire in the converted wetlands as an agricultural management practice. Most importantly, the status of the protected area in the Ramsar wetlands is ineffective since in Thrace (Lake Ismarida, Porto, and lagoons) and Ileia (Cothychi), the density of the recurring reed burnings is practically higher than in the converted wetlands. Therefore, besides the value of reed burnings as an indicator of wetland conditions, these results are a “metric” of bad environmental governance in the country, even today.
Map 3 (or Figure 10) presents the results of applying the score function.
(See the analysis and rationale in Section 2.2 above.) Black-bordered polygons are neighboring grid cells delimiting those areas in Greece where the human–P. australis (‘wetlands’) interactions were continuous during the existence of modern Greece as a nation state.
4. Discussion
The results allow for building storytelling to provide a verisimilar, credible, but not mispresented [80,81] interpretation of the complex evolving phenomenon of human–wetland interactions into simpler components [82]. Hopefully, this might help inspire future alternatives to socially relevant LU/LUCC scientific research in the polysemic perception of P. australis and, eventually, its companion species as an indicator of wetlands’ spatial dynamics and uses.
At the nucleus of the present discussion puts forth the value of storytelling as a structured narrative [81] on wetlands’ use—and abuse—trajectory in the case study of modern Greece. Storytelling might appear to deviate from the systematic and logical approach to discovering characteristics of the noble method of science, especially after the Popperian paradigm. The genuine scientific scrutiny of this contribution is the assertion that while storytelling and the scientific method may seem different at first glance, e.g., the lack of falsification, replication, or controlled experimentation, they are both essential tools for understanding and explaining the human–wetlands interactions in a country in the process of modernization and growth. They each have their strengths and can be used together to effectively communicate complex ideas and engage a broad audience. One would humbly underscore that our approach is somewhat inspired by the mixed scientific method that acquired its lettres de noblesse after J. Diamond’s works, e.g., Collapse, although it is subject to ongoing debate and criticism in academic circles [83].
The core problem with storytelling constructions such as ours is the validation and limitations of data [84]. As clearly described in the Methods section, data on every fire event are published yearly and standardized under the EFFIS system (Table 1). Then, the categories and classes of fire events records present are uniform at the pan-European level. The same stands true for the causes of fires [31]. As to the limitations of data, possible sources of weak reliability are (1) the lack of standardized topographic data compatible with the modern georeferenced boundaries of converted wetlands in the 19th century and the first half of the 20th century. (2) Limited knowledge of firefighters on the ground as to the taxonomy of wetland keystone plant species. For example, the severity index (SI) mainly orbits around the reliability of data obtained from the Firefighting Corp database, as, at times, the separation of vegetation types is particularly difficult for non-specialists. Future research should include species-specific data to ensure the distinction between the types of fires and species and enhance the indicator’s accuracy. This is why we adopted the morphospecies taxonomy of P. australis as the indicator of this category of helophytes. (3) Geographic coordinates of fire events have been kept on record since 2020. This is important for the systematic monitoring of reed bed fires or burnings, which are abundant in yearly frequency but of small size per event (Figure 2 and Figure 4, Section 3). However, the pyrogeographic map of reed bed fires or burnings presents interannual consistency (Map 1, Figure 8).
The association of P. australis with wetland conditions, existing presently or converted in the past, appears well established in spatial, ecological, and time scales, as well as in land-use conditions. As strongly stated in earlier sections, the conversion of wetlands into agricultural land was inextricably intertwined with the establishment and development of modern Greece (especially the period 1830–1960). However, apprehending post-1960s reed bed burning as an exclusive agricultural practice like crop residue clearing in cereals’ and industrial crops’ cultures, e.g., cotton, tobacco, and biofuel-transformable plants, is a limited or narrow explanation of the dynamics of the phenomenon in the terrain. Although agriculture-related uses, as classified in the Corine NUTS 3 level, dominate the reed-bed-fire frequency, total area, and SI, it is remarkable that infrastructure, tourism-related, or semi-industrial activities present significant parts in the non-converted wetland reed-bed-fire phenomenon. For instance, in island setups, airfields are often situated in flat sea-shore areas that, in most cases, are or were coastal wetlands. Repeatedly burning the rapidly recovering reed beds is a safety measure for airplanes’ movements in these airports (Map 2, Figure 9).
Our storytelling explanation articulates the hypotheses announced and explained in Methods Section 2.5. At first, anthropogenic reed bed burnings present the lowest severity index (SI) value among all vegetation types, more or less of the same order as crop residue agricultural burnings. This mainly concerns the sporadic appearance of post-burning recovering reed bed stands within agricultural lands. Second, the time series of SI, at any scale, is stationary (Figure 6), suggesting a constancy in the basic statistical parameters, e.g., the mean and variance of the SI distribution. However, it should be noted that two periodicities in the SI variation might be identified. The first relates to very small or small reed bed burnings; in such cases, the return time of the phenomenon is ~3 years. The second refers to large reed bed fires as parts of wetland watershed wildfires or mega-fires; in such cases, the return time has ~7–8 years in Greece since 2000 (Figure 7). Regarding the spatial pattern of reed bed burnings or fires, “hotspots”, i.e., areas of elevated burning incidence or prevalence or a geographic cluster of reed-bed-burning cases, are discernable (Map 1, Figure 8).
Although indirectly suggested in the previous sections, one might attempt to complement the storytelling on reed bed burning as an indicator of the dynamics of the wetlands in modern Greece with a series of questions open for future research, either at the national or the international level. We focus on the following priorities:
- Ecological Repercussions: while mainly affecting the keystone indicator species, reed bed burning impacts the broader wetland ecosystem. It influences the intricate web of biodiversity and ecosystem services, potentially impacting water quality, habitat availability, and overall resilience. Understanding these ecological implications is crucial for devising conservation strategies that address the multifaceted dynamics of wetland ecosystems.
- Climate Change Resilience: Exploring the role of reed bed burning within climate change mitigation policies unveils its potential contributions to adaptive wetland management. Assessing its impact on carbon sequestration, water regulation, and ecosystem stability provides insights into whether this practice aligns with broader climate change mitigation goals. Acknowledging and evaluating the intricate relationship between reed bed burning and climate resilience is pivotal for sustainable land-use planning.
- Policy and Management Recommendations: This research underscores the need for comprehensive policy frameworks and adaptive management strategies to balance agricultural, infrastructural, and conservation interests. By recommending nuanced approaches that integrate ecological sensitivity with socio-economic needs, this study underlines the need to develop effective wetland management plans. The presence of these historical, currently converted wetlands plays a significant role in recognizing the natural state of areas to avoid and prevent the destruction of human infrastructure, which in most cases would be flooding since wetlands are natural systems created in drainage basins.
- Emphasizing the importance of collaborative governance ensures the sustainability of wetland ecosystems in the face of evolving land-use dynamics. An outstanding example certainly is the recent flooding of Lake Karla (September 2023), located in Thessaly (EM-DAT platform on natural hazards and disaster, record 2023-0582-GRC), i.e., one of the last large-scale drainage or land reclamation works (Table 2, Methods section). During the “Daniel storm”, the original lake regained its initial place and area in less than two days (1,900,000 stremma flooded after precipitations >1000 tons/stremma). Efforts have been made during the last decades to correct the damage from such initial extensive drainage works, thus emphasizing the importance of collaborative governance between farmers, scientists, planners, and politicians to ensure the sustainability of wetland ecosystems in the face of evolving land-use dynamics and climate change pressures. This was going in the right direction but was also too late and too slow as a process.
- Global Relevance: Extending the proposed indicator’s applicability to a global context, the research suggests that insights gained from the study can inform wetland conservation efforts worldwide. By highlighting the index’s transferability to diverse socio-ecological settings, this study emphasizes the potential for international collaboration in addressing the everyday challenges wetland ecosystems face. This global perspective underscores the importance of shared knowledge and cooperative efforts in safeguarding these critical habitats.
- Community Engagement: Recognizing the pivotal role of local communities in wetland conservation, this study advocates for inclusive community engagement. By incorporating traditional ecological knowledge and fostering community-driven initiatives, this research promotes a sense of stewardship among residents. This collaborative approach ensures that wetland conservation aligns with the communities’ values and agricultural land management practices intertwined with these ecosystems.
Expanding the proposed indicator species as a precise “locating device” for estimating converted wetland-type conditions requires a multifaceted approach. Additional parameters and pressures should be systematically incorporated to enhance the indicators’ accuracy and applicability. Key considerations include introducing land-use history data to capture the temporal evolution of converted wetlands, offering a more nuanced understanding of their transformation over time. Hydrological dynamics, such as changes in water flow and soil moisture, should be integrated to provide insights into the ongoing ecological processes within converted wetlands.
Furthermore, socio-economic indicators, including land ownership patterns and agricultural practices, can contribute valuable context to the indicator. Understanding the human dimensions associated with converted wetlands enables a more comprehensive evaluation of the interplay between anthropogenic activities and ecological responses. Leveraging advanced geospatial technologies and machine learning algorithms may facilitate real-time monitoring and predictions of converted wetland conditions, enhancing the indicator’s adaptive management capabilities. Collaborative initiatives involving researchers, land managers, and policymakers are essential to ensure that the index remains relevant, responsive, and effective in promoting sustainable land-use practices and the conservation of converted wetland ecosystems.
Author Contributions
Conceptualization, A.Y.T. and C.M.G.; methodology, A.Y.T.; software, C.M.G. and T.K.; validation, C.M.G., T.K. and A.Y.T.; formal analysis, C.M.G. and A.Y.T.; investigation, C.M.G. and A.Y.T.; resources, T.K.; data curation, C.M.G.; writing—original draft preparation, C.M.G. and A.Y.T.; writing—review and editing, A.Y.T.; visualization, C.M.G., T.K. and A.Y.T.; supervision, A.Y.T.; project administration, A.Y.T. All authors have read and agreed to the published version of the manuscript.
Funding
This research received no external funding.
Data Availability Statement
The data presented in this study are available on request from the corresponding author due to privacy restrictions.
Conflicts of Interest
The authors declare no conflicts of interest.
Appendix A
Appendix A presents a synopsis of spatial pyrogeographic data of a NUTS 3 level (prefectures of Greece), emphasizing the average severity index (2000–2022). Area/prefecture is presented in stremma (0.1 ha). AL: agricultural land; SG: shrubland/grasslands; WER: wetlands. This collection refers primarily to LUs that are prone to “arson” as management practices of farmers and shepherds.

Table A1.
Severity index by prefecture 2000–2022 (stremma).
| Prefecture | Area Stremma | % of AL | % of SG | % of WET | SI AL | SI SG | SI WET |
|---|---|---|---|---|---|---|---|
| Aetolia-Acarnania | 5,461,000 | 32% | 28% | 3% | 33.06 | 17.05 | 10.33 |
| Larissa | 5,381,000 | 52% | 33% | 2% | 34.85 | 66.19 | 0.22 |
| Ioannina | 4,991,000 | 17% | 38% | 4% | 13.91 | 32.85 | 2.09 |
| Phthiotis | 4,441,000 | 42% | 34% | 1% | 14.81 | 44.93 | 7.94 |
| Arcadia | 4,419,000 | 27% | 52% | 1% | 167.13 | 76.76 | 3.10 |
| Evros | 4,242,000 | 52% | 16% | 5% | 54.92 | 65.57 | 2.73 |
| Euboea | 4,167,000 | 32% | 40% | 2% | 6.64 | 12.07 | 15.92 |
| Serres | 3,968,000 | 51% | 17% | 3% | 83.81 | 101.84 | 20.83 |
| Attica | 3,808,000 | 35% | 28% | 4% | 91.74 | 43.45 | 13.10 |
| Thessaloniki | 3,683,000 | 55% | 19% | 2% | 67.35 | 34.91 | 1.92 |
| Laconia | 3,636,000 | 39% | 46% | 3% | 102.35 | 151.99 | 13.69 |
| Kozani | 3,516,000 | 39% | 29% | 9% | 310.03 | 479.58 | 22.52 |
| Drama | 3,468,000 | 20% | 24% | 1% | 576.20 | 274.10 | 112.35 |
| Trikala | 3,384,000 | 28% | 36% | 3% | 16.56 | 6.01 | 2.97 |
| Achaea | 3,271,000 | 38% | 41% | 3% | 52.11 | 71.97 | 35.36 |
| Messenia | 2,991,000 | 54% | 29% | 1% | 15.10 | 24.95 | 22.86 |
| Boeotia | 2,952,000 | 44% | 40% | 1% | 71.57 | 62.40 | 6.36 |
| Chalkidiki | 2,918,000 | 43% | 23% | 0% | 15.16 | 15.92 | 0.71 |
| Dodecanese | 2,714,000 | 26% | 56% | 5% | 30.32 | 6.99 | 5.39 |
| Heraklion (Crete) | 2,641,000 | 59% | 33% | 3% | 23.87 | 34.93 | 15.12 |
| Karditsa | 2,636,000 | 51% | 22% | 1% | 52.03 | 73.87 | 3.35 |
| Magnesia | 2,636,000 | 37% | 41% | 1% | 94.55 | 27.76 | 23.31 |
| Ilia | 2,618,000 | 69% | 20% | 1% | 29.60 | 78.10 | 11.25 |
| Cyclades | 2,572,000 | 31% | 61% | 2% | 6.21 | 15.15 | 0.00 |
| Rhodope | 2,543,000 | 46% | 24% | 3% | 12.02 | 43.55 | 9.65 |
| Kilkis | 2,519,000 | 63% | 13% | 0% | 42.47 | 213.63 | 1.38 |
| Pella | 2,506,000 | 47% | 17% | 1% | 11.89 | 53.64 | 7.46 |
| Chania (Crete) | 2,376,000 | 32% | 50% | 4% | 8.19 | 35.85 | 2.19 |
| Corinthia | 2,291,000 | 41% | 35% | 2% | 696.00 | 190.26 | 35.54 |
| Grevena | 2,291,000 | 34% | 26% | 1% | 14.74 | 63.16 | 5.66 |
| Argolis | 2,154,000 | 39% | 52% | 2% | 28.54 | 17.09 | 17.30 |
| Lesbos | 2,154,000 | 47% | 37% | 1% | 86.00 | 52.68 | 3.72 |
| Phocis | 2,121,000 | 14% | 41% | 3% | 13.65 | 9.46 | 6.18 |
| Kavala | 2,111,000 | 33% | 30% | 3% | 43.54 | 97.57 | 1.56 |
| Florina | 1,924,000 | 34% | 26% | 4% | 22.72 | 39.13 | 17.04 |
| Evrytania | 1,869,000 | 8% | 38% | 3% | 6.48 | 77.54 | 2.07 |
| Lasithi (Crete) | 1,823,000 | 34% | 56% | 5% | 54.36 | 57.65 | 1.89 |
| Xanthi | 1,793,000 | 35% | 18% | 3% | 52.78 | 45.93 | 1.85 |
| Kastoria | 1,721,000 | 29% | 30% | 1% | 23.17 | 56.23 | 5.66 |
| Imathia | 1,701,000 | 50% | 12% | 2% | 9.13 | 35.35 | 0.62 |
| Arta | 1,662,000 | 31% | 42% | 5% | 250.58 | 221.33 | 23.32 |
| Pieria | 1,516,000 | 50% | 8% | 3% | 123.63 | 110.30 | 0.29 |
| Thesprotia | 1,515,000 | 25% | 51% | 3% | 20.29 | 172.49 | 6.67 |
| Rethymno (Crete) | 1,496,000 | 44% | 46% | 5% | 120.60 | 11.46 | 2.05 |
| Preveza | 1,036,000 | 40% | 40% | 6% | 11.00 | 25.53 | 10.92 |
| Chios | 904,000 | 28% | 57% | 10% | 121.41 | 58.83 | 1.47 |
| Kefalonia | 904,000 | 33% | 42% | 2% | 220.29 | 100.31 | 4.60 |
| Samos | 778,000 | 32% | 42% | 6% | 11.99 | 30.47 | 2.81 |
| Corfu | 641,000 | 73% | 13% | 4% | 43.86 | 77.31 | 5.78 |
| Zakynthos | 406,000 | 53% | 35% | 1% | 155.93 | 185.08 | 1.22 |
| Lefkada | 356,000 | 47% | 33% | 1% | 35.42 | 14.83 | 21.05 |
Appendix B
This is a NASA Terra satellite image of the mega-fire conditions in the Peloponnese on 26 August 2007. Coastal wetlands of the prefecture of Ilia burned for more than a week before suppression. It corresponds to the upper-limit truncation, smax, of the frequency–size distribution presented in Figure 2 (main text).
Figure A1.
Satellite image (NASA Terra) of the mega-fire conditions in the Peloponnese on 26 August 2007. Coastal wetlands of the prefecture of Ilia burned for more than a week before suppression.
Figure A1.
Satellite image (NASA Terra) of the mega-fire conditions in the Peloponnese on 26 August 2007. Coastal wetlands of the prefecture of Ilia burned for more than a week before suppression.

References
- Flyvbjerg, B. Five misunderstandings about case-study research. Qual. Inq. 2006, 12, 219–245. [Google Scholar] [CrossRef]
- Rudel, T.K. Meta-analyses of case studies: A method for studying regional and global environmental change. Glob. Environ. Change 2008, 18, 18–25. [Google Scholar] [CrossRef]
- Magliocca, N.R.; Rudel, T.K.; Verburg, P.H.; McConnell, W.J.; Mertz, O.; Gerstner, K.; Heinimann, A.; Ellis, E.C. Synthesis in land change science: Methodological patterns, challenges, and guidelines. Reg. Environ. Chang. 2015, 15, 211–226. [Google Scholar] [CrossRef]
- Van Vliet, J.; Magliocca, N.R.; Büchner, B.; Cook, E.; Benayas, J.M.R.; Ellis, E.C.; Heinimann, A.; Keys, E.; Lee, T.M.; Liu, G.; et al. Meta-studies in land use science: Current coverage and prospects. Ambio 2016, 45, 15–28. [Google Scholar] [CrossRef] [PubMed]
- Rindfuss, R.R.; Entwisle, B.; Walsh, S.J.; An, L.; Badenoch, N.; Brown, D.G.; Deadman, P.; Evans, T.P.; Fox, J.; Geoghegan, J.; et al. Land use change: Complexity and comparisons. J. Land Use Sci. 2008, 3, 1–10. [Google Scholar] [CrossRef] [PubMed]
- Scullion, J.J.; Vogt, K.A.; Drahota, B.; Winkler-Schor, S.; Lyons, M. Conserving the Last Great Forests: A Meta-Analysis Review of the Drivers of Intact Forest Loss and the Strategies and Policies to Save Them. Front. For. Glob. Chang. 2019, 2, 62. [Google Scholar] [CrossRef]
- Fang, X.Z.; Ghazali, S.; Azadi, H.; Skominas, R.; Scheffran, J. Agricultural land conversion and ecosystem services loss: A meta-analysis. Environ. Dev. Sustain. 2023. [Google Scholar]
- Gao, J.; O’Neill, B. Different Spatiotemporal Patterns in Global Human Population and Built-Up Land. Earth’s Future 2021, 9, e2020EF001920. [Google Scholar] [CrossRef]
- Vereecken, H.; Amelung, W.; Bauke, S.L.; Bogena, H.; Brüggemann, N.; Montzka, C.; Vanderborght, J.; Bechtold, M.; Blöschl, G.; Carminati, A.; et al. Soil hydrology in the Earth system. Nat. Rev. Earth Environ. 2022, 3, 573–587. [Google Scholar] [CrossRef]
- Ackerschott, A.; Kohlhase, E.; Vollmer, A.; Hörisch, J.; Von Wehrden, H. Steering of land use in the context of sustainable development: A systematic review of economic instruments. Land Use Policy 2023, 129, 106620. [Google Scholar] [CrossRef]
- Let, M.; Pal, S. Socio-ecological well-being perspectives of wetland loss scenario: A review. J. Environ. Manag. 2023, 326, 116692. [Google Scholar] [CrossRef]
- Kiviat, E. Ecosystem services of Phragmites in North America with emphasis on habitat functions. AoB Plants 2013, 5, plt008. [Google Scholar] [CrossRef]
- IPBES. Global Assessment Report on Biodiversity and Ecosystem Services of the Intergovernmental Science-Policy Platform on Biodiversity and Ecosystem Services; Brondizio, E.S., Settele, J., Díaz, S., Ngo, H.T., Eds.; IPBES Secretariat: Bonn, Germany, 2019. [Google Scholar] [CrossRef]
- FAO. Global Forest Resource Assessment (GFRA) Summary 2015; Food & Agriculture Organization: Rome, Italy, 2016. [Google Scholar]
- Ramsar Convention on Wetlands. Global Wetland Outlook: State of the World’s Wetlands and Their Services to People; Ramsar Convention Secretariat: Gland, Switzerland, 2018. [Google Scholar]
- Mitsch, W.J.; Gosselink, J.G. Wetlands; John Wiley Sons: Hoboken, NJ, USA, 2015. [Google Scholar]
- Costanza, R.; d’Arge, R.; De Groot, R.; Farber, S.; Grasso, M.; Hannon, B.; Limburg, K.; Naeem, S.; O’Neill, R.V.; Paruelo, J.; et al. The value of the world’s ecosystem services and natural capital. Nature 1997, 387, 253–260. [Google Scholar] [CrossRef]
- Romanazzi, G.R.; Koto, R.; De Boni, A.; Palmisano, G.O.; Cioffi, M.; Roma, R. Cultural ecosystem services: A review of methods and tools for economic evaluation. Environ. Sustain. Indic. 2023, 20, 100304. [Google Scholar] [CrossRef]
- Demarquet, Q.; Rapinel, S.; Dufour, S.; Hubert-Moy, L. Long-Term Wetland Monitoring Using the Landsat Archive: A Review. Remote Sens. 2023, 15, 820. [Google Scholar] [CrossRef]
- Abdelmajeed, A.Y.A.; Albert-Saiz, M.; Rastogi, A.; Juszczak, R. Cloud-based Remote Sensing for Wetland Monitoring—A Review. Remote Sens. 2023, 15, 1660. [Google Scholar] [CrossRef]
- Lizotte, R.E.; Smiley, P.C.; Gillespie, R.B.; Knight, S.S. Agricultural Conservation Practices and Aquatic Ecological Responses. Water 2021, 13, 1687. [Google Scholar] [CrossRef]
- Maltby, E. The Wetlands Paradigm Shift in Response to Changing Societal Priorities: A Reflective Review. Land 2022, 11, 1526. [Google Scholar] [CrossRef]
- Reis, V.; Hermoso, V.; Hamilton, S.K.; Ward, D.; Fluet-Chouinard, E.; Lehner, B.; Linke, S. A global assessment of inland wetland conservation status. Bioscience 2017, 67, 523–533. [Google Scholar] [CrossRef]
- Seifollahi-Aghmiuni, S.; Kalantari, Z.; Egidi, G.; Gaburova, L.; Salvati, L. Urbanization-driven land degradation and socioeconomic challenges in peri-urban areas: Insights from Southern Europe. Ambio 2022, 51, 1446–1458. [Google Scholar] [CrossRef]
- White, E.E.; Ury, E.A.; Bernhardt, E.S.; Yang, X. Climate change driving widespread loss of coastal forested wetlands throughout the North American coastal plain. Ecosystems 2022, 25, 812–827. [Google Scholar]
- Richards, D.R.; Friess, D.A. Rates and drivers of mangrove deforestation in Southeast Asia, 2000–2012. Proc. Natl. Acad. Sci. USA 2016, 113, 344–349. [Google Scholar] [CrossRef] [PubMed]
- Taylor, N.G.; Grillas, P.; Al Hreisha, H.; Balkiz, Ö.; Borie, M.; Boutron, O.; Catita, A.; Champagnon, J.; Cherif, S.; Çiçek, K.; et al. The future for Mediterranean wetlands: 50 key issues and 50 important conservation research questions. Reg. Environ. Chang. 2021, 21, 33. [Google Scholar] [CrossRef]
- Xiong, Y.; Mo, S.H.; Wu, H.P.; Qu, X.Y.; Liu, Y.Y.; Zhou, L. Influence of human activities and climate change on wetland landscape pattern—A review. Sci. Total Environ. 2023, 879, 163112. [Google Scholar] [CrossRef] [PubMed]
- Bowman, D.M.J.S.; O’Brien, J.A.; Goldammer, J.G. Pyrogeography and the Global Quest for Sustainable Fire Management. Annu. Rev. Environ. Resour. 2013, 38, 57–80. [Google Scholar] [CrossRef]
- Ludwig, D.E.; Iannuzzi, T.J.; Esposito, A.N. Phragmites and environmental management: A question of values. Estuaries 2003, 26, 624–630. [Google Scholar] [CrossRef]
- Camia, A.; Durrant, T.; San-Miguel-Ayanz, J. Harmonized Classification Scheme of Fire Causes in the EU Adopted for the European Fire Database of EFFIS; Executive Report; European Commission, Joint Research Centre: Luxembourg, 2013. [Google Scholar] [CrossRef]
- Gerakis, A.; Kalburtji, K. Agricultural activities affecting the functions and values of Ramsar wetland sites of Greece. Agric. Ecosyst. Environ. 1998, 70, 119–128. [Google Scholar] [CrossRef]
- Mpeza, P.E. Management and Sustainability of Greek Wetlands. In Protected Area Management—Recent Advances; Suratman, M.N., Ed.; IntechOpen: London, UK, 2022; Volume 368. [Google Scholar] [CrossRef]
- Christopoulou, O.G.; Tsachalidis, E. Conservation Policies for Protected Areas (Wetlands) in Greece: A Survey of Local Residents’ Attitude. Water Air Soil Pollut. Focus 2004, 4, 445–457. [Google Scholar] [CrossRef]
- Zalidis, G.C.; Mantzavelas, A.L.; Gourvelou, E. Environmental impact on Greek wetlands. Wetlands 1997, 17, 339–345. [Google Scholar] [CrossRef]
- Zafeiriou, E.; Andrea, V.; Tampakis, S.; Karanikola, P. Wetlands Management in Northern Greece: An Empirical Survey. Water 2020, 12, 3181. [Google Scholar] [CrossRef]
- Catsadorakis, G.; Paragamian, K. Inventory of the Wetlands of the Aegean Islands: Identity, Ecological Status and Threats; World Wide Fund for Nature—WWF Greece: Athens, Greece, 2007. [Google Scholar]
- Merken, R.; Deboelpaep, E.; Teunen, J.; Saura, S.; Koedam, N. Wetland Suitability and Connectivity for Trans-Saharan Migratory Waterbirds. PLoS ONE 2015, 10, e0135445. [Google Scholar] [CrossRef]
- Ailstock, M.S.; Cente, E. Adaptive strategies of common reed Phragmites australis. In Proceedings of the Role of Phragmites in the Mid-Atlantic Region, Princess Anne, MD, USA, 17 April 2000; Volume 17, pp. 1–7. [Google Scholar]
- Gradstein, S.R.; Smittenberg, J.H. The hydrophilous vegetation of Western Crete. Vegetation 1977, 34, 65–86. [Google Scholar] [CrossRef]
- Dinka, M.; Szeglet, P. Reed (Phragmites australis (Cav.) Trin ex Steudel) growth and production in different habitats of Neusiedlersee (Lake Fertö). SIL Proc. 1922–2010 1998, 26, 1830–1834. [Google Scholar] [CrossRef]
- Goslee, S.C.; Brooks, R.P.; Cole, C.A. Plants as indicators of wetland water source. Plant Ecol. 1997, 131, 199–206. [Google Scholar]
- Mal, T.K.; Narine, L. The biology of Canadian weeds. 129. Phragmites australis (Cav.) Trin. Ex Steud. Can. J. Plant Sci. 2004, 84, 365–396. [Google Scholar] [CrossRef]
- Srivastava, J.; Kalra, S.J.S.; Naraian, R. Environmental perspectives of Phragmites australis (Cav.) Trin. Ex. Steudel. Appl. Water Sci. 2014, 4, 193–202. [Google Scholar] [CrossRef]
- Krzton-Presson, A.; Davis, B.; Raper, K.; Hitz, K.; Mecklin, C.; Whiteman, H. Effects of Phragmites Management on the Ecology of a Wetland. Northeast. Nat. 2018, 25, 418–436. [Google Scholar] [CrossRef]
- Trettin, C.C.; Kolka, R.K.; Marsh, A.S.; Bansal, S.; Lilleskov, E.A.; Megonigal, P.; Stelk, M.J.; Lockaby, G.; D’Amore, D.V.; MacKenzie, R.A.; et al. Wetland and Hydric Soils. In Forest and Rangeland Soils of the United States Under Changing Conditions; Pouyat, R.V., Page-Dumroese, D.S., Patel-Weynand, T., Geiser, L.H., Eds.; Springer Open: Berlin/Heidelberg, Germany, 2020; pp. 99–126. [Google Scholar] [CrossRef]
- Navas, M.L.; Violle, C. Plant traits related to competition: How do they shape the functional diversity of communities? Community Ecol. 2009, 10, 131–137. [Google Scholar] [CrossRef]
- Kunstler, G.; Falster, D.; Coomes, D.A.; Hui, F.; Kooyman, R.M.; Laughlin, D.C.; Poorter, L.; Vanderwel, M.; Vieilledent, G.; Wright, S.J.; et al. Plant functional traits have globally consistent effects on competition. Nature 2016, 529, 204–207. [Google Scholar] [CrossRef]
- Milke, J.; Gałczyńska, M.; Wróbel, J. The Importance of Biological and Ecological Properties of Phragmites australis (Cav.) Trin. Ex Steud., in Phytoremediation of Aquatic Ecosystems—The Review. Water 2020, 12, 1770. [Google Scholar] [CrossRef]
- Cronin, J.T.; Kiviat, E.; Meyerson, L.A.; Bhattarai, G.P.; Allen, W.J. Biological control of invasive Phragmites australis will be detrimental to native P. australis. Biol. Invasions 2016, 18, 2749–2752. [Google Scholar] [CrossRef]
- Alvarez-Cobelas, M.; Sánchez-Carrillo, S.; Cirujano, S.; Angeler, D.G. Long-term changes in spatial patterns of emergent vegetation in a Mediterranean floodplain: Natural versus anthropogenic constraints. Plant Ecol. 2008, 194, 257–271. [Google Scholar] [CrossRef]
- Coffman, G.C.; Ambrose, R.F.; Rundel, P.W. Wildfire promotes dominance of invasive giant reed (Arundo donax) in riparian ecosystems. Biol. Invasions 2010, 12, 2723–2734. [Google Scholar] [CrossRef]
- Kimura, H.; Tsuyuzaki, S. Fire severity affects vegetation and seed bank in a wetland. Appl. Veg. Sci. 2011, 14, 350–357. [Google Scholar] [CrossRef]
- Pérez, M.E.P.; Lindig-Cisneros, R.; Moreno-Casasola, P. Invasiveness of Phragmites australis in communities dominated by native species after fire disturbance under controlled conditions. Hidrobiologica 2018, 28, 201–207. [Google Scholar] [CrossRef]
- Dámaso, W.; Ramirez, G.; Lértora, R.; Pujana, R.R. Phragmites australis effects on vegetation structure and functional diversity of the marsh area in NE Argentina. J. Plant Ecol. 2015, 8, 136–147. [Google Scholar] [CrossRef]
- Link, N.T.; McLaughlin, D.L.; Bush, N.; Wurster, F.C. Phragmites-Fire Feedbacks: The Influence of Fire and Disturbance-Altered Hydrology on the Abundance of Phragmites australis. Biol. Invasions 2024, 26, 135–150. [Google Scholar] [CrossRef]
- Martin, R.M.; Moseman-Valtierra, S. Greenhouse Gas Fluxes Vary Between Phragmites australis and Native Vegetation Zones in Coastal Wetlands Along a Salinity Gradient. Wetlands 2015, 35, 1021–1031. [Google Scholar] [CrossRef]
- Avers, B.; Fahlsing, R.; Kafcas, E.; Schafer, J.; Collin, T.; Esman, L.; Finnell, E.; Lounds, A.; Terry, R.; Hazelman, J.; et al. A Guide to the Control and Management of Invasive Phragmites; Michigan Department of Natural Resources: Lake City, MI, USA, 2013. [Google Scholar]
- Granholm, J.M.; Chester, S.E. A Landowner’s Guide to Phragmites Control; Michigan Department of Environmental Quality (MDEQ): Ann Arbor, MI, USA, 1994; Available online: https://watershedcouncil.org/uploads/7/2/5/1/7251350/deq-ogl-guide-phragmites_204659_7.pdf (accessed on 16 December 2023).
- Catling, P.M.; Mitrow, G.L. Major Invasive Alien Plants of Natural Habitats in Canada. 1. European Common Reed (Often Just Called Phragmites), Phragmites australis (Cav.) Trin. Ex Steud. Subsp. Australis. Can. Field-Nat. 2011, 44, 52–61. [Google Scholar]
- Valkama, E.; Lyytinen, S.; Koricheva, J. The Impact of Reed Management on Wildlife, a Meta-Analytical Review of European Studies. Biol. Conserv. 2008, 141, 364–374. [Google Scholar] [CrossRef]
- Stephens, C.R.; Sánchez-Cordero, V.; Salazar, C.G. Bayesian Inference of Ecological Interactions from Spatial Data. Entropy 2017, 19, 547. [Google Scholar] [CrossRef]
- González-Salazar, C.; Stephens, C.R.; Marquet, P.A. Comparing the relative contributions of biotic and abiotic factors as mediators of species’ distributions. Ecol. Model. 2013, 248, 57–70. [Google Scholar] [CrossRef]
- Stephens, C.R.; González-Salazar, C.; Villalobos-Segura, M.D.; Marquet, P.A. Can ecological interaction be inferred from spatial data? Biodivers. Inform. 2020, 15, 11–54. [Google Scholar]
- Araújo, M.B.; Guisan, A. Five (or so) challenges for species distribution modelling. J. Biogeogr. 2006, 33, 1677–1688. [Google Scholar] [CrossRef]
- Fletcher, R.J.; Hefley, T.J.; Robertson, E.P.; Zuckerberg, B.; McCleery, R.A.; Dorazio, R.M. A practical guide for combining data to model species distributions. Ecology 2019, 100, e02710. [Google Scholar] [CrossRef]
- Openshaw, S. The Modifiable Areal Unit Problem Concepts and Techniques in Modern Geography; Geo Books: Norfolk, UK, 1983. [Google Scholar]
- Hand, D.; Mannila, H.; Smyth, P. Principles of Data Mining; MIT Press: Cambridge, MA, USA, 2001. [Google Scholar]
- Spanos, K.; Gaitanis, D.; Skouteri, A.; Petrakis, P.; Meliadis, I. Implementation of Forest Policy in Greece in Relation to Biodiversity and Climate Change. Open J. Ecol. 2018, 8, 174–191. [Google Scholar] [CrossRef]
- Troumbis, A.Y.; Kalabokidis, K.; Palaiologou, P. Diverging rationalities between forest fire management services and the general public after the 21st-century mega-fires in Greece. J. For. Res. 2022, 33, 553–565. [Google Scholar] [CrossRef]
- Kousoulis, A.A.; Chatzigeorgiou, K.S.; Danis, K.; Tsoucalas, G.; Vakalis, N.; Bonovas, S.; Tsiodras, S. Malaria in Laconia, Greece, Then and Now: A 2500-Year-Old Pattern. Int. J. Infect. Dis 2013, 17, 8–11. [Google Scholar] [CrossRef]
- Palaiologou, P.; Kalabokidis, K.; Troumbis, A.; Day, M.A.; Nielsen-Pincus, M.; Ager, A.A. Socio-Ecological Perceptions of Wildfire Management and Effects in Greece. Fire 2023, 4, 18. [Google Scholar] [CrossRef]
- WWF Greece. Available online: https://www.wwf.gr/en/our_work/nature/terrestrial/protected_areas/island_wetlands/ (accessed on 16 December 2023).
- Troumbis, A.Y.; Gaganis, C.M.; Sideropoulos, H. Probabilistic Wildfire Risk Assessment and Modernization Transitions: The Case of Greece. Fire 2023, 6, 158. [Google Scholar] [CrossRef]
- Song, W.G.; Wang, J.; Satoh, K.; Fan, W.C. Three types of power-law distribution of forest fires in Japan. Ecol. Model. 2006, 196, 527–532. [Google Scholar] [CrossRef]
- Bak, P.; Chen, K.; Tang, C. A Forest-Fire Model and Some Thoughts on Turbulence. Phys. Lett. A 1990, 147, 297–300. [Google Scholar] [CrossRef]
- Newman, M. Power Laws, Pareto Distributions and Zipf’s Law. Contemp. Phys. 2005, 46, 323–351. [Google Scholar] [CrossRef]
- Serra-Peralta, M.; Serra, J.; Corral, A. Lognormals, power laws and double power laws in the distribution of frequencies of harmonic codewords from classical music. Sci. Rep. 2022, 12, 2615. [Google Scholar] [CrossRef] [PubMed]
- Clauset, A.; Shalizi, C.R.; Newman, M.E.J. Power-Law Distributions in Empirical Data. SIAM Rev. 2009, 51, 661–703. [Google Scholar] [CrossRef]
- Wikipedia. Available online: https://en.wikipedia.org/wiki/2007_Greek_forest_fires (accessed on 25 February 2024).
- Ettinger, J.; Otto, F.E.L.; Schipper, E.L.F. Storytelling can be a powerful tool for science. Nature 2021, 589, 352. [Google Scholar] [CrossRef] [PubMed]
- Maditinos, Z.; Vassiliadis, C. Mega Fires: Can They Be Managed Effectively? Disaster Prev. Manag. 2011, 20, 41–52. [Google Scholar] [CrossRef]
- Gause, E. A Critique: Jared Diamond’s Collapse Put in Perspective; Institute of Archaeology: London, UK, 2014; Volume 24, pp. 1–7. [Google Scholar] [CrossRef]
- Blastland, M.; Freeman, A.L.J.; Van der Linden, S.; Marteau, T.M.; Spiegelhalter, D. Five rules for evidence communication. Nature 2020, 587, 362–364. [Google Scholar] [CrossRef]
Figure 1.
Abiotic and biotic conditions in Greece are suitable for reed beds and, indirectly, reed fire burning. (a) The hydrographic network of Greece (4th degree class) https://geodata.gov.gr/maps/?locale=el, accessed on 4 January 2024. (b) The location of the Ramsar wetlands in Greece (purple dots signify Ramsar wetlands of international importance, black dots signify the existence of general wetlands). Source: [67] using http://www.ekby.gr/ekby/en/EKBY_Publications_en.html, accessed on 4 January 2024, Reprinted/adapted with permission from Ref. [67]. (c) Corine Label 3 exclusively presenting LUs relating to current wetland conditions.

Figure 2.
Two versions of the reed-bed-burning frequency vs. size or magnitude rank (in log-log space). Left: the classic power law representation of the frequency–size distribution. Tones of grey indicate hypothetical mechanisms generating different categories of reed bed burning sizes, explanations on the meanings of grey tones are provided in the text below. Right: the proposed categorizing of reed-bed-burning events according to their respective size. For further explanation and details, see the text below.
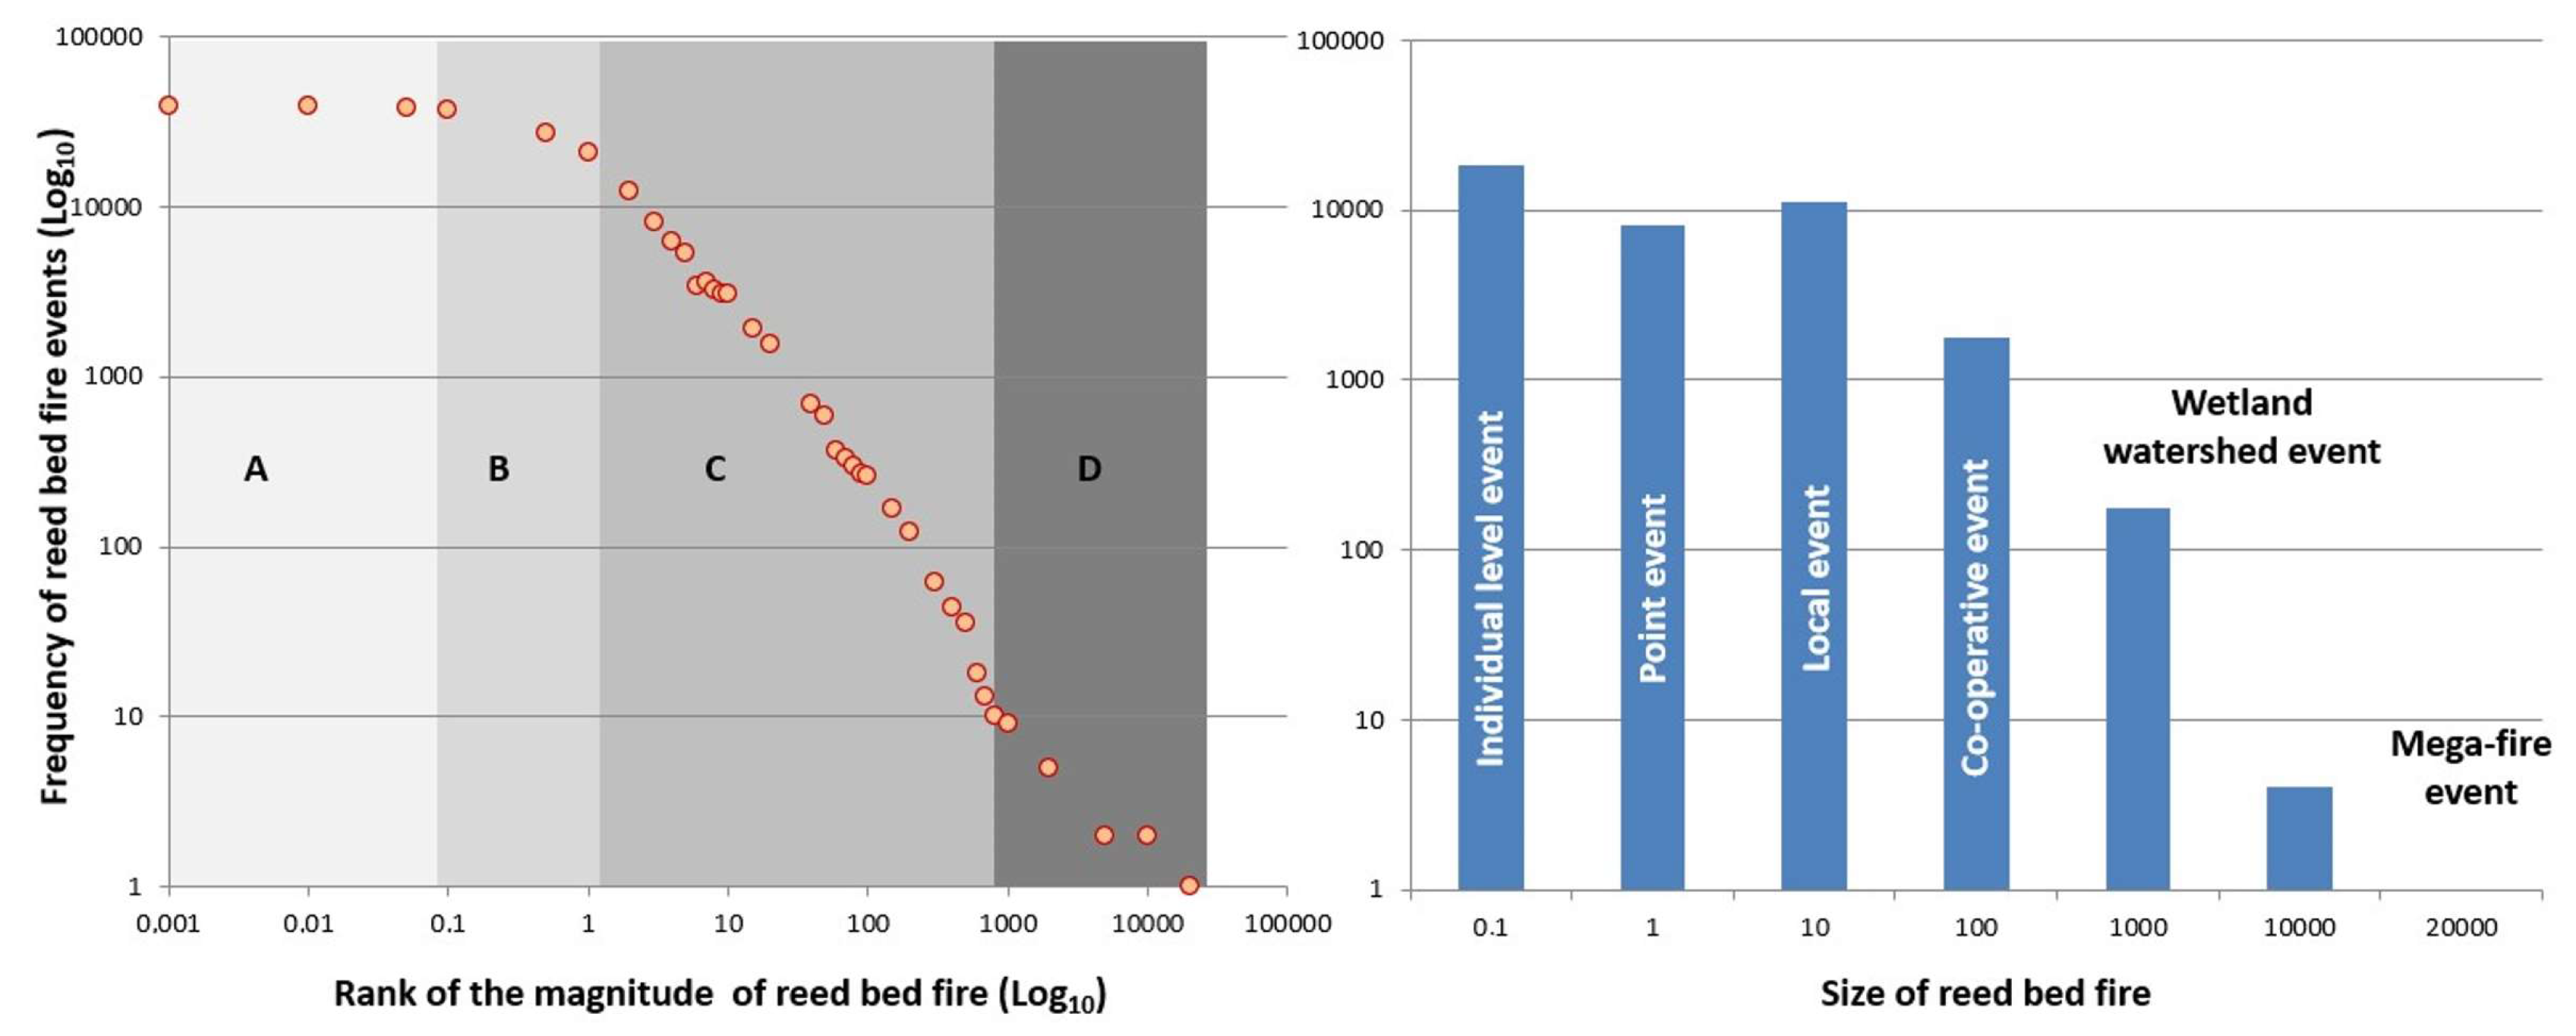
Figure 3.
Spider chart comparing the frequencies, total area burned, and SI of reed bed burning in Greece (2000–2022). Data refer exclusively to land uses comprising existing or converted wetlands, primarily variations of agricultural land setups, but also infrastructure (airports), tourism activities (beaches, dunes, sands), and industrial activities (salines and salt marshes). Blue line: frequency; red line: total area burned; purple line: SI. Axes are log-transformed.
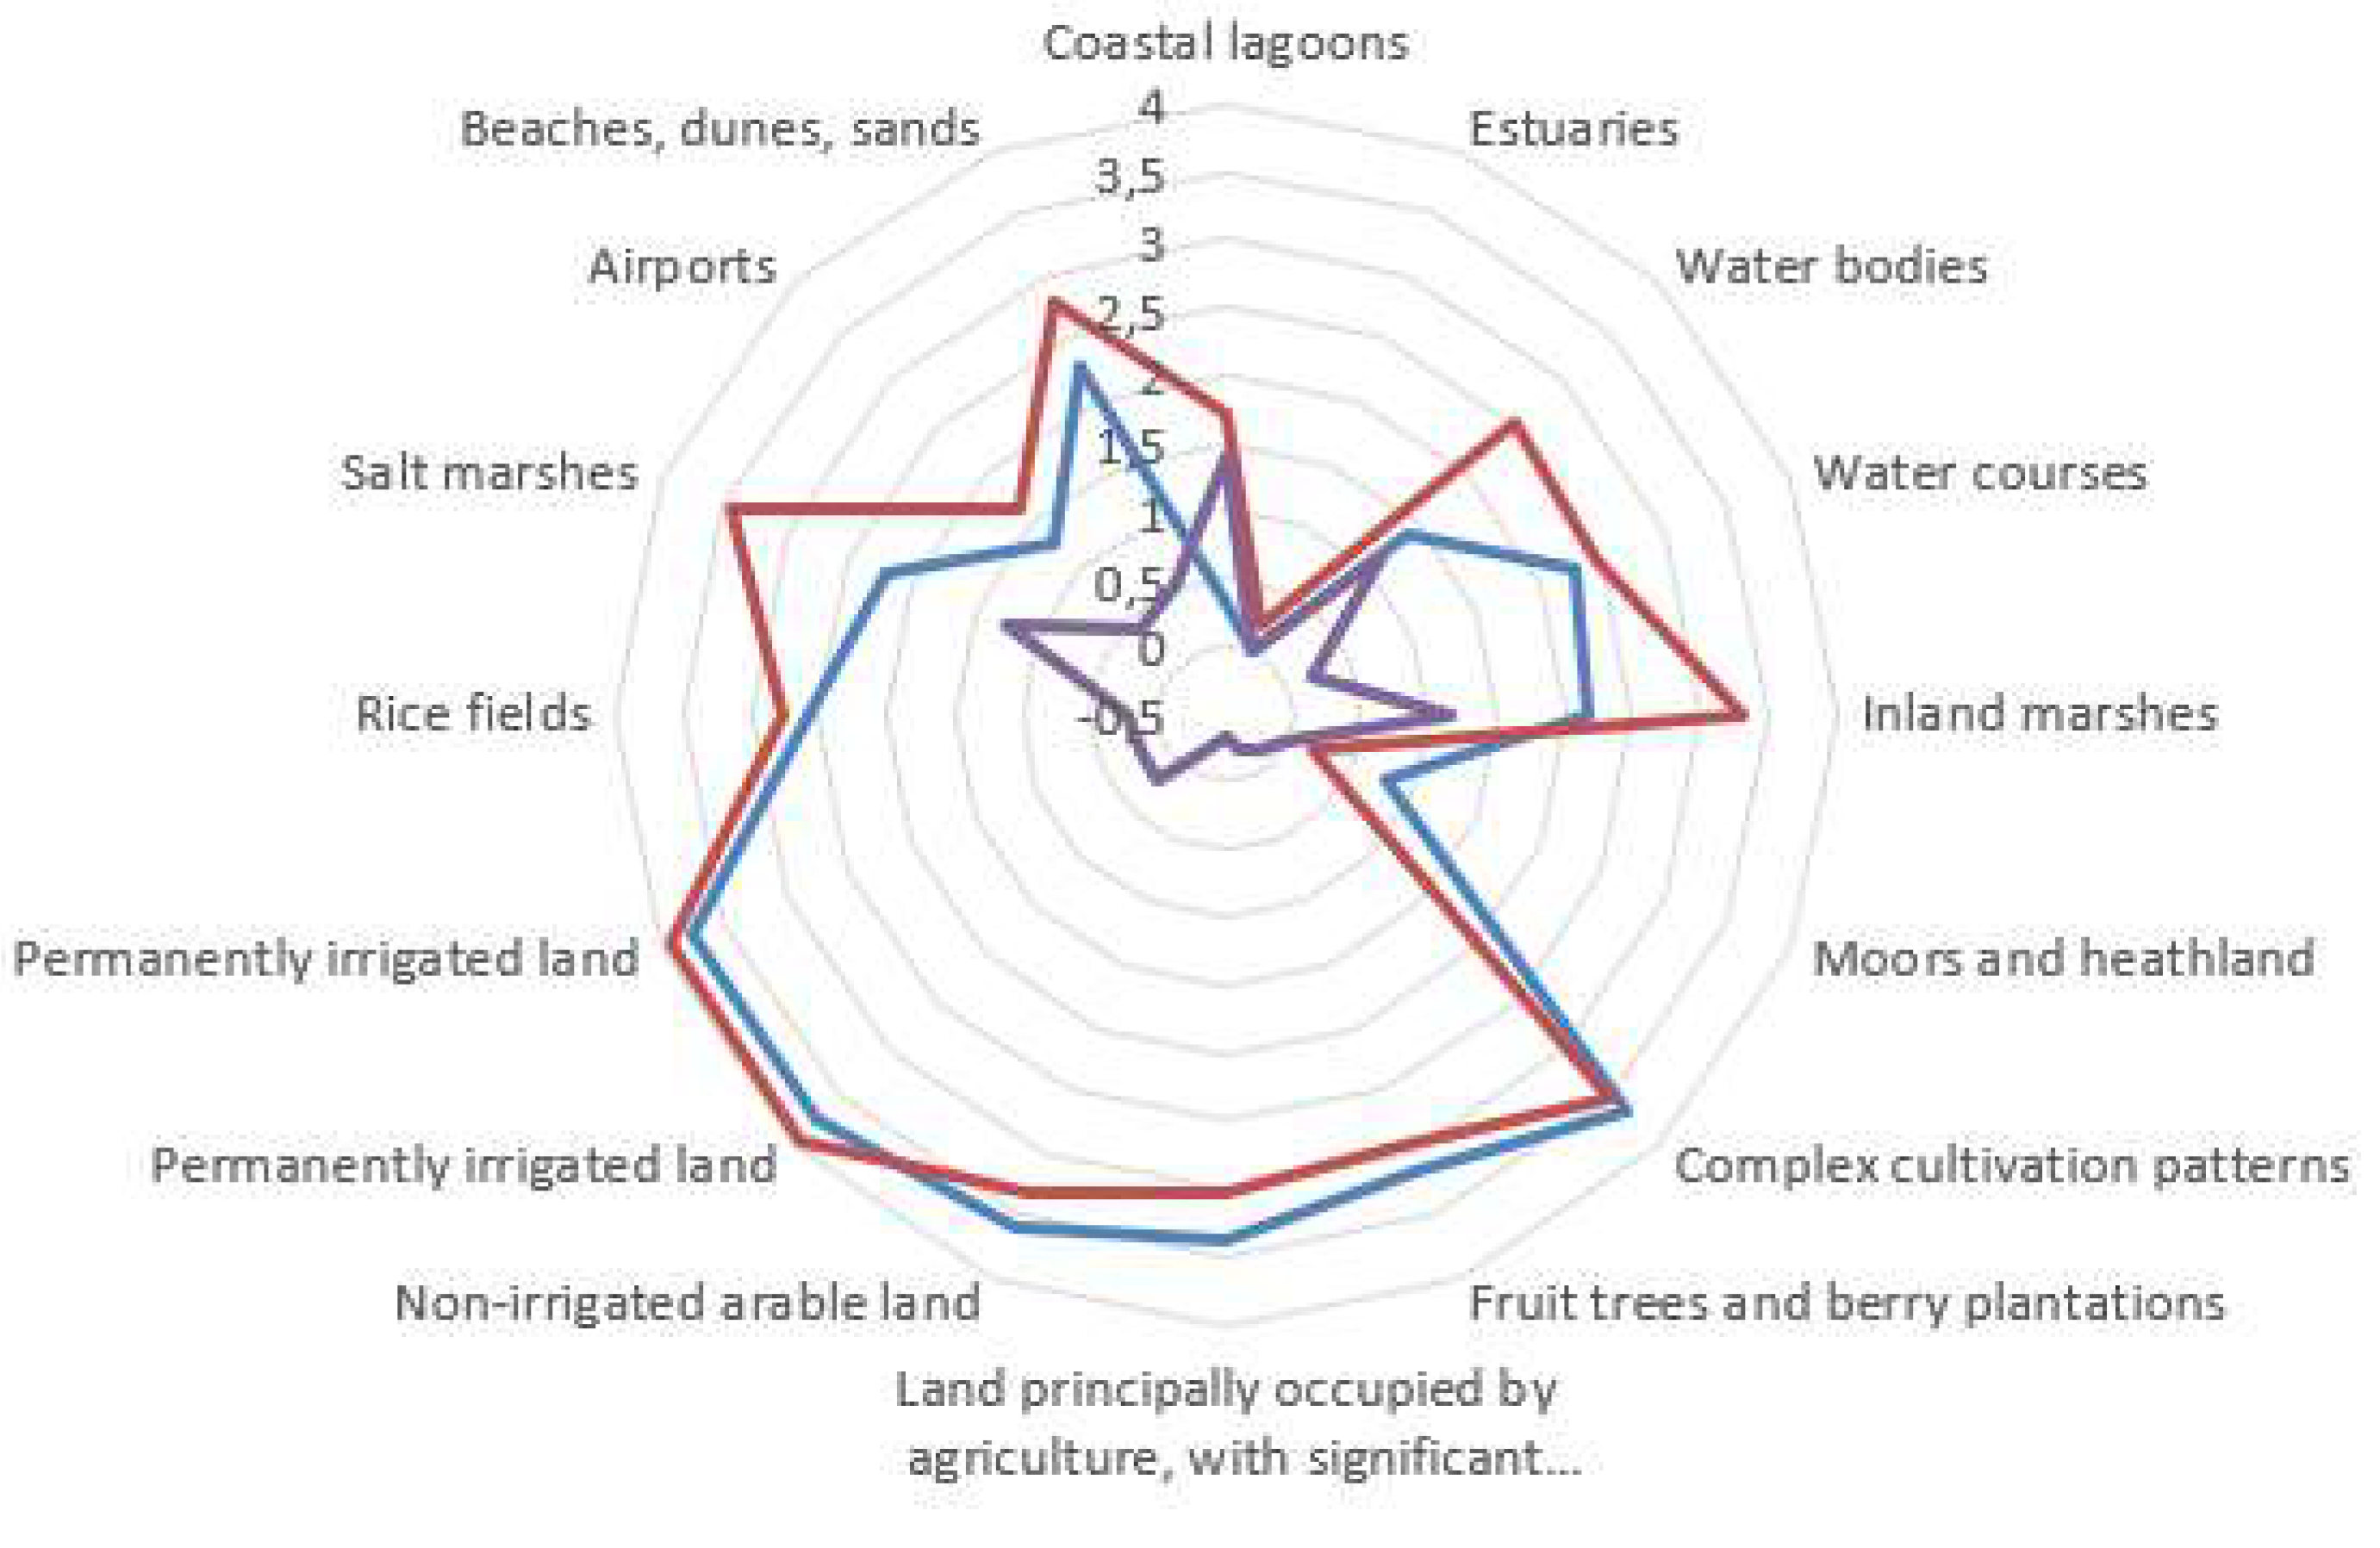
Figure 4.
Summary descriptives of the severity index of wildfires per vegetation type in Greece, from 2000–2022. Boxplots represent the median (horizontal thick line), the first and third quartiles (box), and the 1.5 interquartile range (whiskers). Black dots are outliers. 1: Crop residue; 2: agricultural land; 3: forest; 4: forested area; 5: shrubland/grassland; 6: reed bed burning.

Figure 5.
Pairwise comparison of severity indexes per vegetation type after Kruskal–Wallis independent sample test. Significance values have been adjusted after Bonferroni correction for multiple tests. Nodes show the average rank of SI per vegetation type. Code: 1: reed-bed-burning SI; 2. Crop residue burnings SI; 3. Agriculture land wildfire SI; 4. Forest wildfire SI; 5. Forested areas SI; 6. Shrubland/grassland wildfire SI. Each SI series consists of 276 monthly recordings, 2000–2022. Extract from the dashboard of IBM SPSS v. 28.

Figure 6.
Sequence plot of the reed bed burnings/month time series at NUTS 0, i.e., Creece’s level. Data are natural-logarithm-transformed, and first-degree differencing is applied. The blue line represents the area/month series, the green line the frequency/month series, and the red line the SI/month series. Two hundred seventy-six records (months) are reported (1/2000-12/2022). Extract from the dashboard of IBM SPSS v. 28.
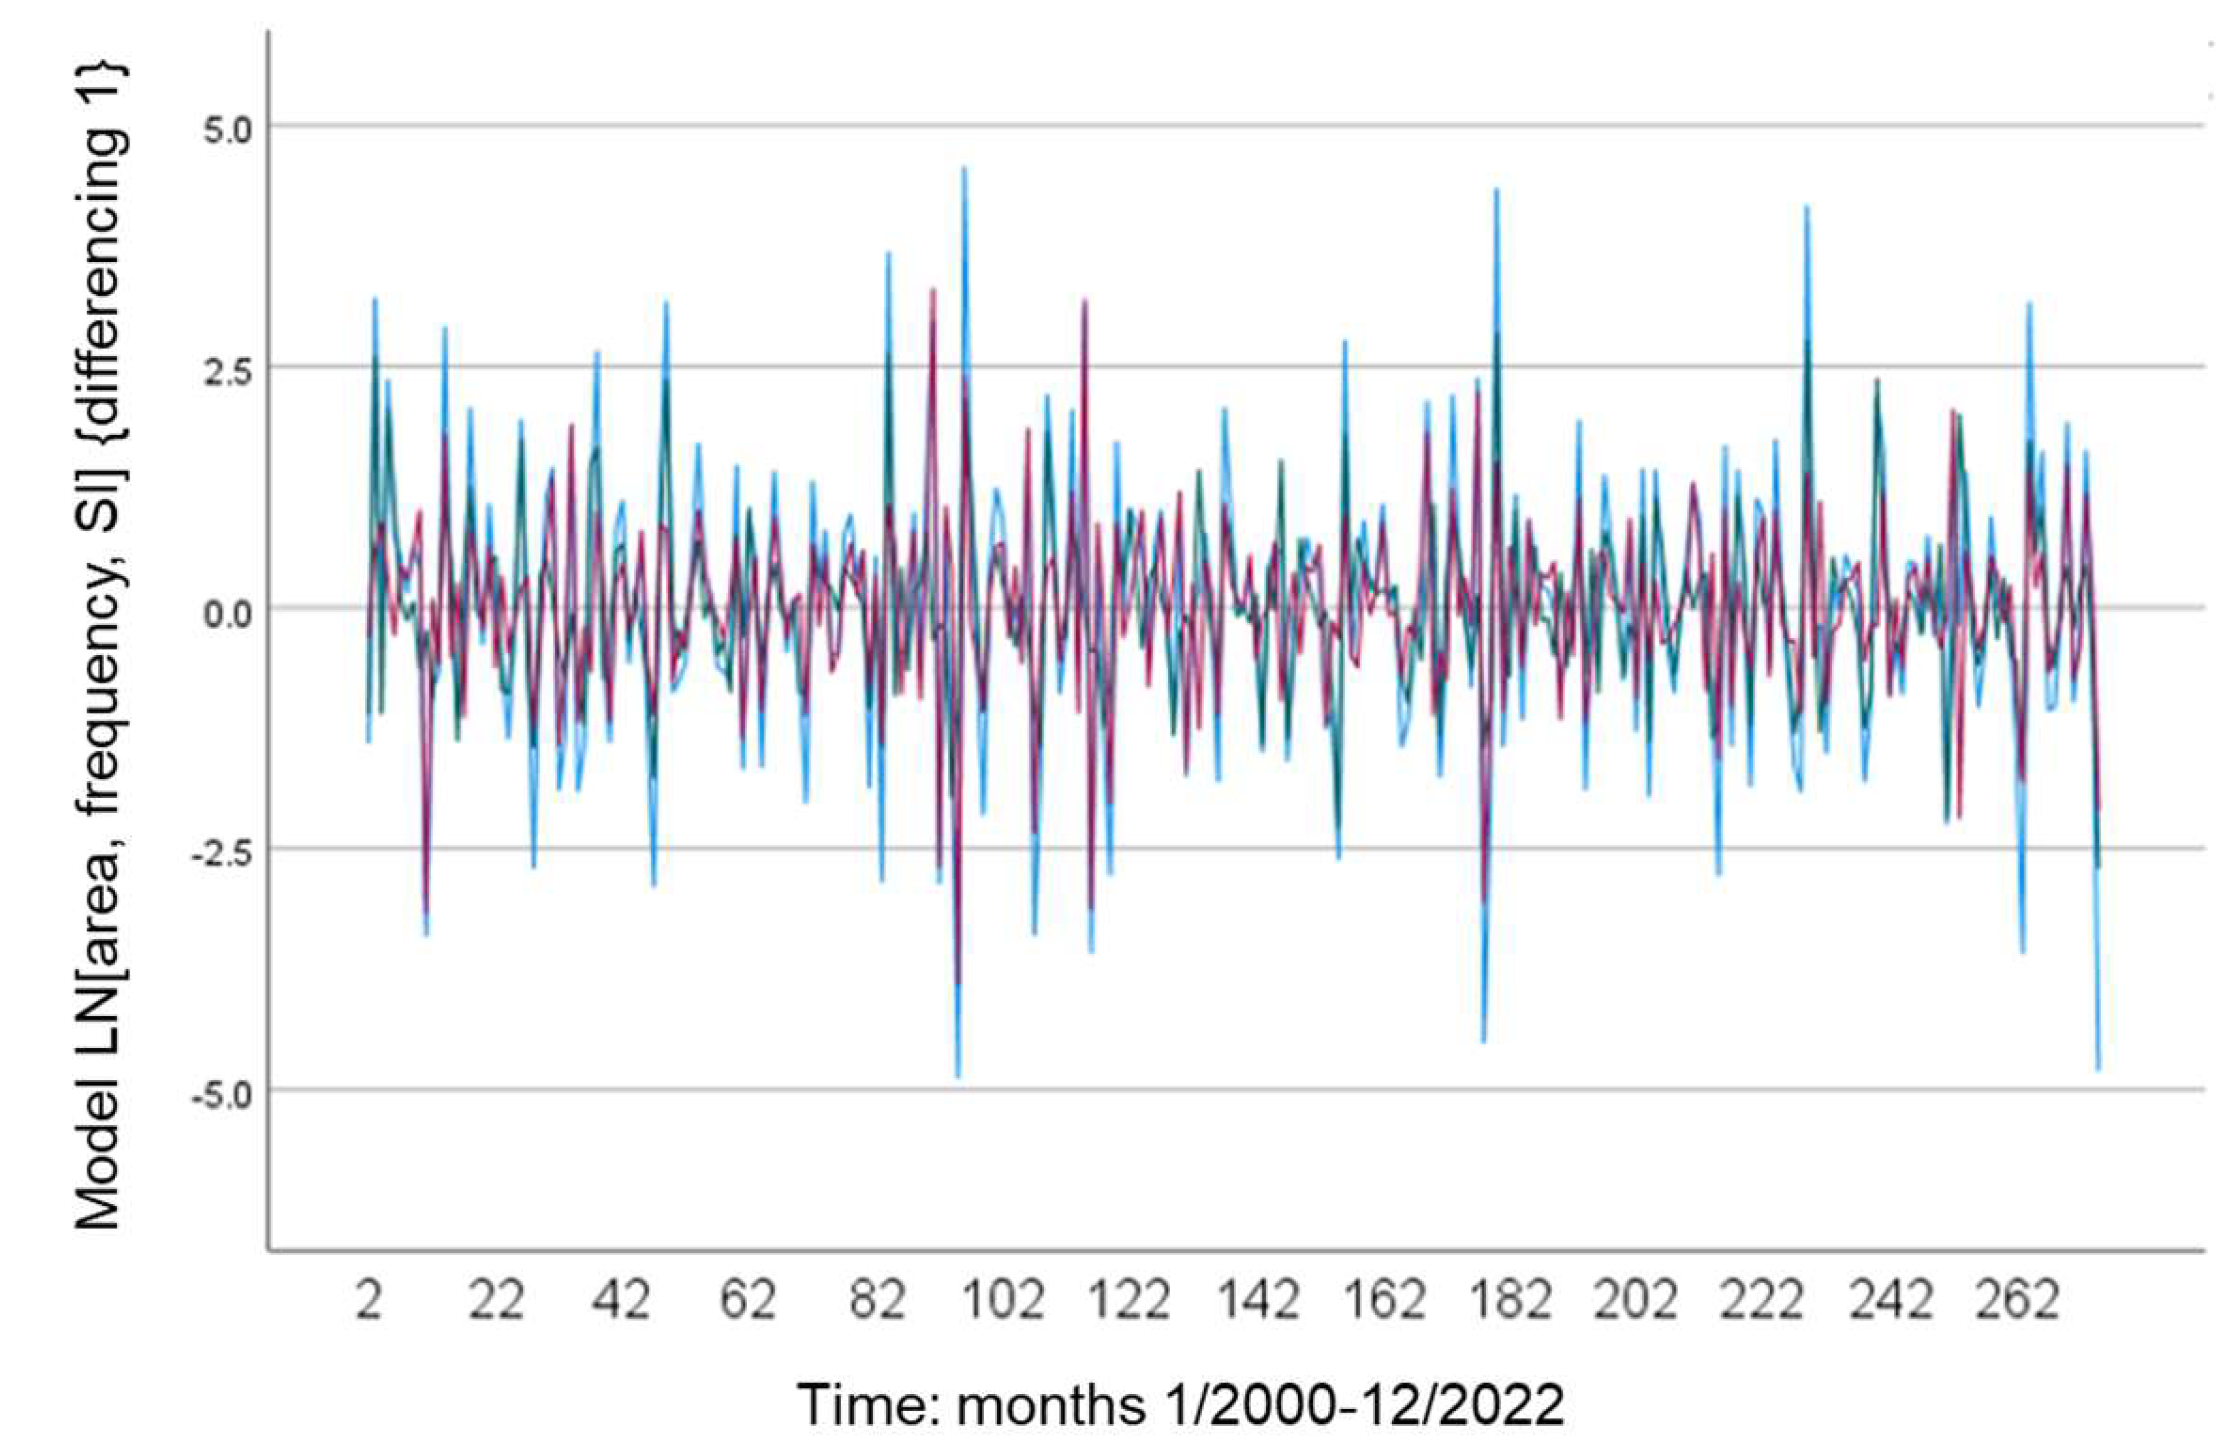
Figure 7.
Indicative examples of ARIMA (1,1,1) models of time series analysis of severity indexes of reed bed burnings in two-time scales, yearly vs. monthly, (a) vs. (b). Red lines present the observed values, blue lines are the fit lines, and dots are the upper and lower confidence limits. Extracts from the dashboard of IBM SPSS v. 8. (c,d) present the Fast Fourier Transform smoothing of the SI series distribution models at a scale of 10 years (or 120 months)—extracts from the dashboard of the XLSTAT package. RMSE* represents the normalized value calculated as RMSE/(max–min values).
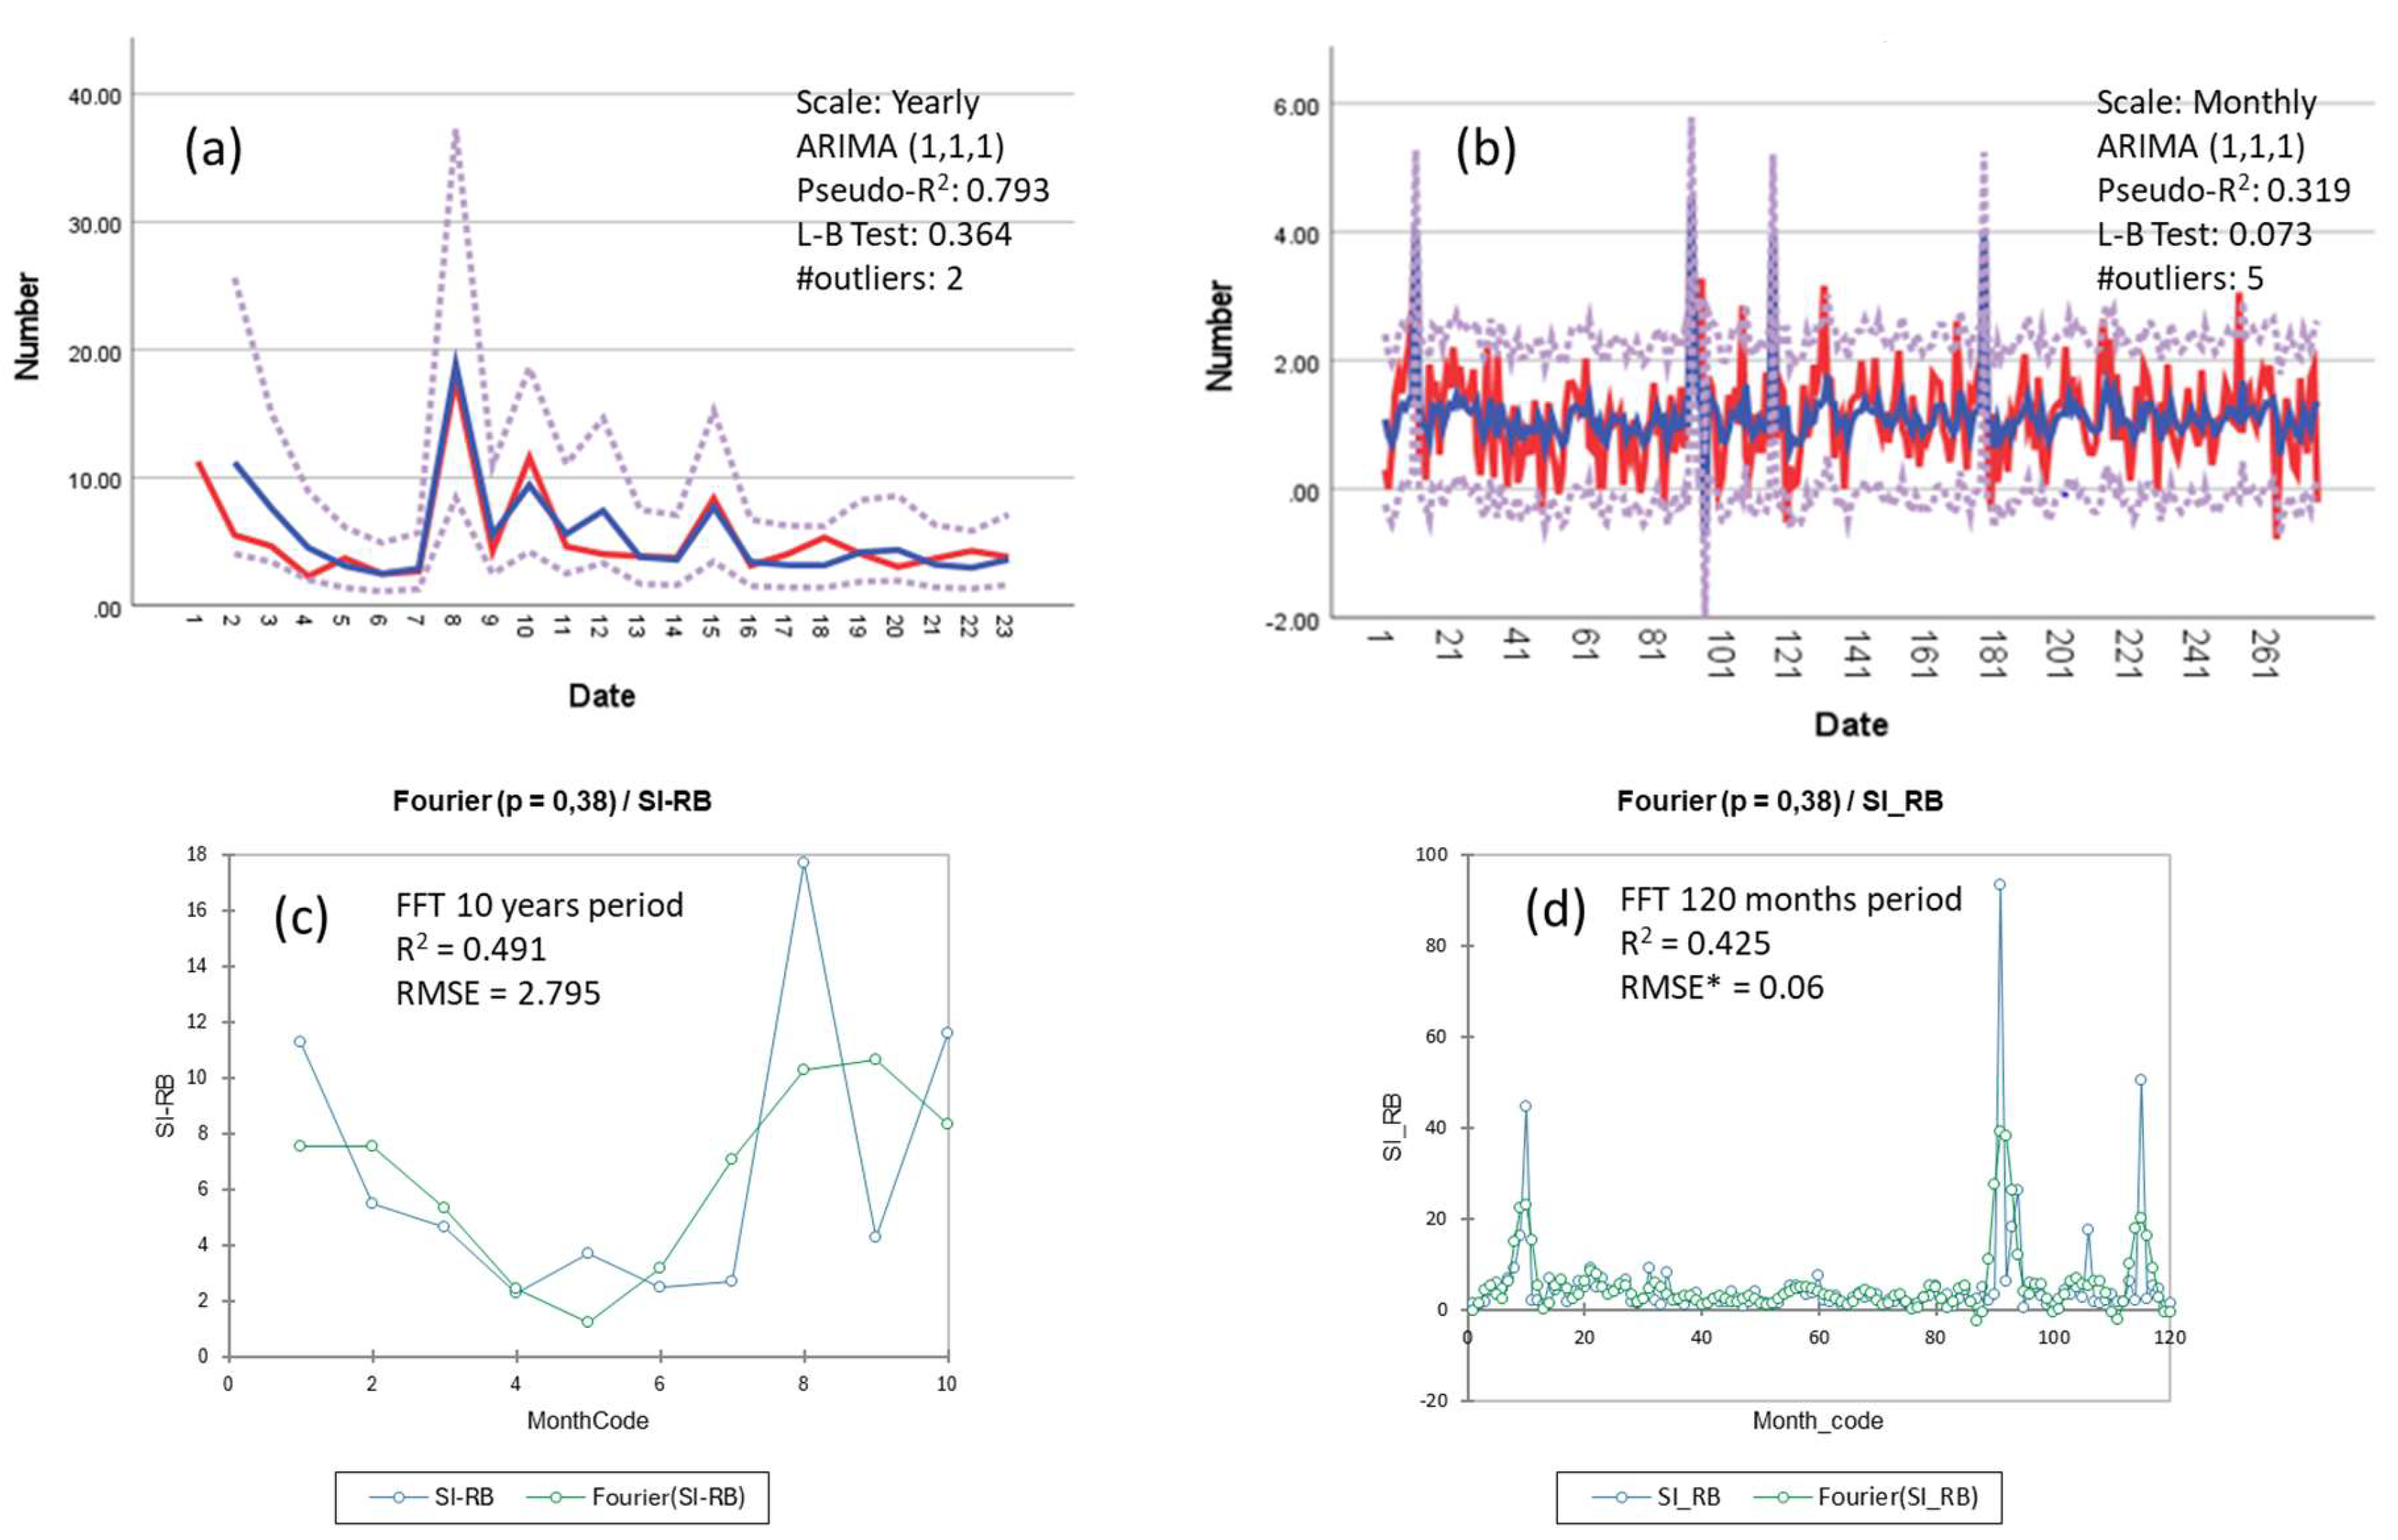
Figure 8.
(Map 1) Pyrogeographic map of reed bed burning during 2020–2022. The size of the dots indicates the magnitude of burning events in the corresponding locations. Clusters of events suggest the reed-bed-burning hotspots in Greece (NUTS 0) and, indirectly, the presence of existing and converted wetlands where abiotic conditions, especially wetland-related hydric soil conditions, allow for the presence and post-burning recovery of P. australis beds. Light-black polygons are the boundaries of NUTS 1 (prefectures); light-grey lines are the hydrographic network of Greece.

Figure 9.
(Map 2) Indicative examples of reed-bed-burning distribution in two converted wetlands (Yiannitsa and Kopaida) and two existing Ramsar wetlands of international importance (Thrace: Lake Ismarida, Porto, and lagoons; and Ileia: Cothychi).
Figure 9.
(Map 2) Indicative examples of reed-bed-burning distribution in two converted wetlands (Yiannitsa and Kopaida) and two existing Ramsar wetlands of international importance (Thrace: Lake Ismarida, Porto, and lagoons; and Ileia: Cothychi).

Figure 10.
(Map 3) Blocks of adjacent grid cells present positive values of the score function. This applies to both converted and existing wetlands in Greece. Red arrows indicate the locations of the extensive land reclamation works in Greece for more than a century to develop agricultural land and secure food sufficiency for the growing population.
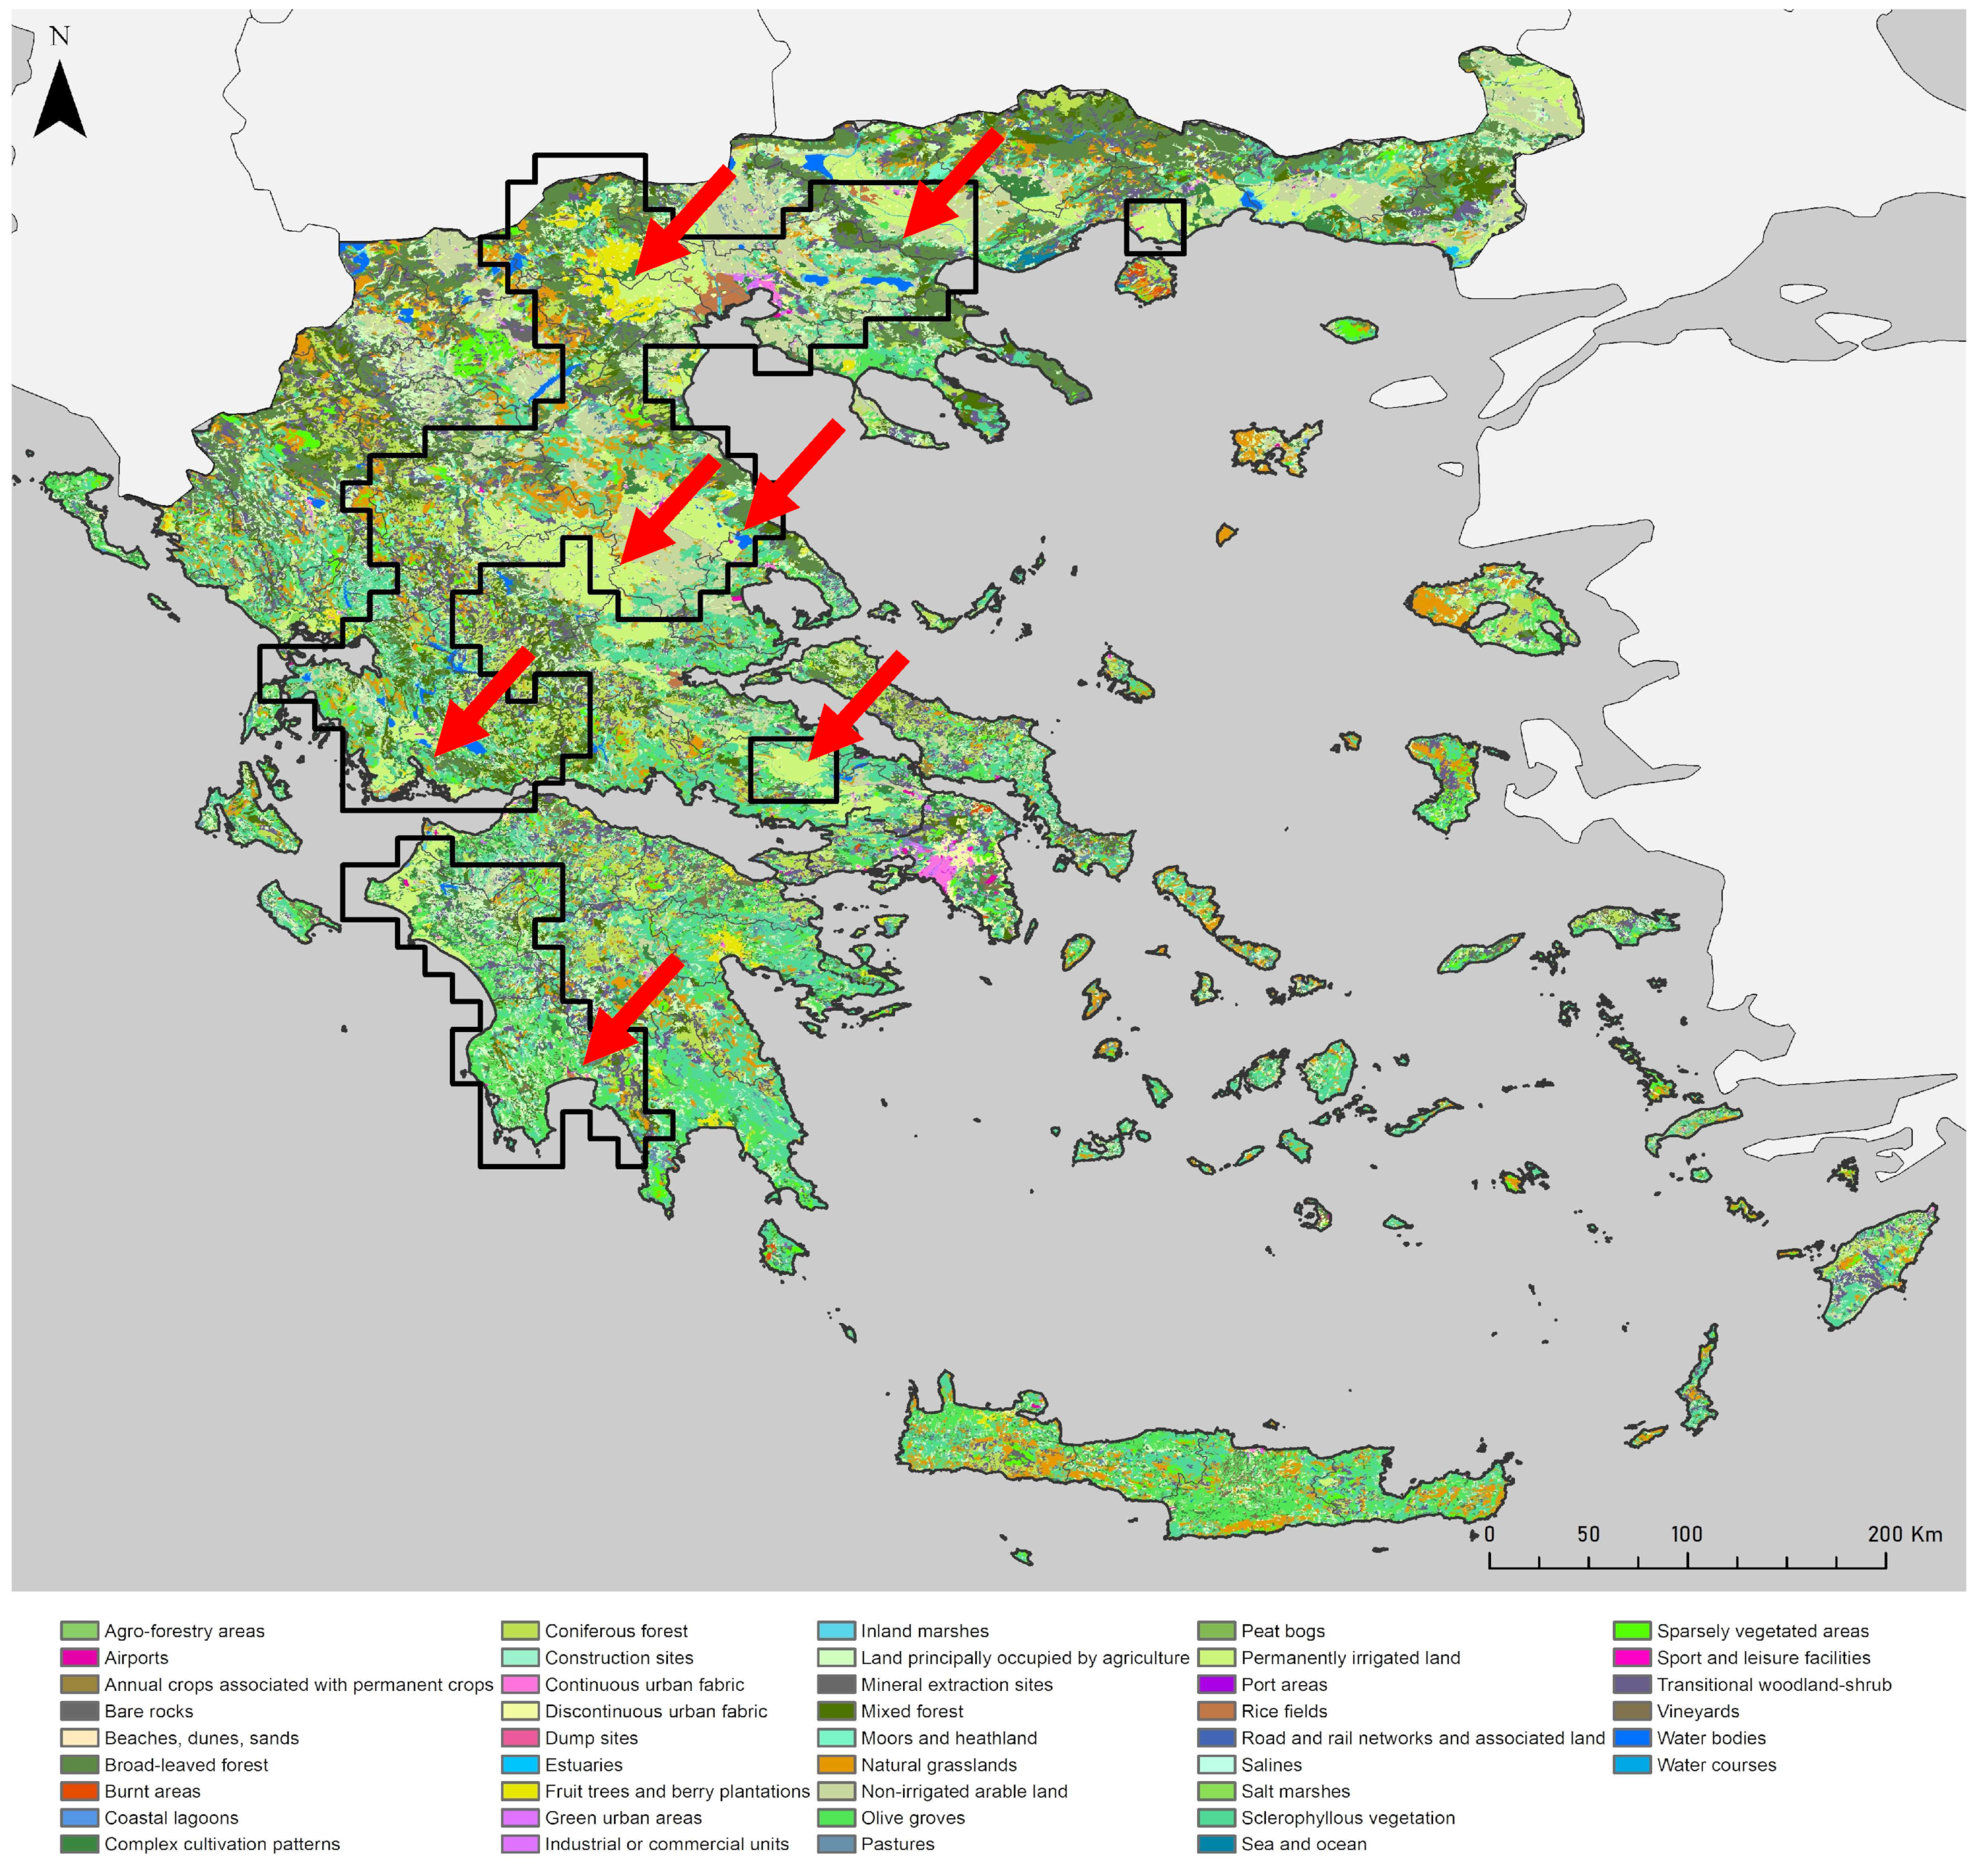
Table 1.
Template of individual fire event recordings (spreadsheet, .xls, .xlsx) since 2000. Data accessible in the Hellenic Firefighting Corp database (in Greek): https://www.fireservice.gr/el_GR/stoicheia-symbanton, accessed on 4 January 2024.
Table 1.
Template of individual fire event recordings (spreadsheet, .xls, .xlsx) since 2000. Data accessible in the Hellenic Firefighting Corp database (in Greek): https://www.fireservice.gr/el_GR/stoicheia-symbanton, accessed on 4 January 2024.
| Category of Information | Class | Unit |
|---|---|---|
| Time | Year | 20XX |
| Date, time of fire ignition | dd/mm, xx:xx | |
| Date, time of fire suppression | dd/mm, xx:xx | |
| Location | Prefecture (NUTS 3) | Name |
| Community | Name | |
| Specific location name | Name | |
| Geographical coordinates | (from 2020 to) | |
| Vegetation Type | Forest | Burned area in stremmas (1 stremma = 0.1 ha) |
| Forested areas | ||
| Shrubland–grassland | ||
| Urban–periurban groves | ||
| Agricultural burnings | ||
| Reed bed burnings | ||
| Uncontrolled dumpsites | ||
| General/Miscellaneous Information | Code number of the fire event | X |
| Means and personnel engaged | # airborne/terrestrial means, # personnel (firefighters, volunteers, military) |
#: Number of.
Table 2.
The list, chronology, area, and wetland ecosystem type of significant land reclamation and drainage works in modern Greece (1830—to today). Notice that area is expressed in stremma units, each equal to 0.1 hectares.
Table 2.
The list, chronology, area, and wetland ecosystem type of significant land reclamation and drainage works in modern Greece (1830—to today). Notice that area is expressed in stremma units, each equal to 0.1 hectares.
| Major Land Reclamation—Wetland Drainage Works in Greece | |||||
|---|---|---|---|---|---|
| Drainage Work | Code | Period | Area (Stremma) | Prefecture or Region | Ecosystem Type |
| Kopaida | 1 | 1880–1886 | 250,000 | Viotia, Central Greece | Lake |
| Pamisos | 2 | 1888–1970 | 15,000 | Messynia, Peloponese | River |
| Karditsa | 3 | 1931–1959 | 1,090,000 | Thessalia | Marshes |
| Larisa (Karla) | 4 | 1931–1960 | 660,000 | Thessalia | Lake |
| Yiannitsa | 5 | 1928–1932 | 1,054,000 | Macedonia | Lake–marshes |
| Ahinos | 6 | 1930–1933 | 100,000 | Serres | Lake |
| Messologi | 7 | 1959–1969 | 105,000 | Aetolia-Acarnania | Lagoon |
Table 3.
Summary of statistics for time series and white noise analyses of correlations between data samples of SI reed bed burnings at two time scales, i.e., monthly and yearly. The results presented are the best fitting versions to a series of models, ARIMA (seasonal and non-seasonal periodicity), and white noise after various smoothing techniques (e.g., exponential, Fourier, Holt–Winters, and moving average). FFT RMSE* refers to the normalized RMSE, i.e., RMSE/(max–min) values.
| Time Scale/Data Series | Sample Size/Spatial Scale | ARIMA Model | White Noise | ||||||
|---|---|---|---|---|---|---|---|---|---|
| Non-Seasonal (p,1,q) | Seasonal (P,1, Q) | Fisher’s K | FFT RMSE* | ||||||
| Pseudo-R2 | RMSE | L-B Test | Pseudo-R2 | RMSE | L-B Test | ||||
| Monthly/SI reed bed burnings | 276/NUTS 3 | (1,1,1) 0.319 | (1,1,1) 0.635 | (1,1,1) 0.073 | (1,1,1)(1,1,2) 0.192 | (1,1,1) (1,1,2) 8.6 | (1,1,1) (1,1,2) 0.705 | p = 0.036 | p = 0.102 |
| Yearly/SI reed bed burnings | 2/NUTS 0 | (1,1,1) 0.793 | (1,1,1) 2.12 | (1,1,1) 0.364 | - | p = 0.403 | p = 0.052 | ||
| (3,1,3) 0.731 | (3,1,3) 2.64 | (3,1,3) 0.465 | |||||||
Disclaimer/Publisher’s Note: The statements, opinions and data contained in all publications are solely those of the individual author(s) and contributor(s) and not of MDPI and/or the editor(s). MDPI and/or the editor(s) disclaim responsibility for any injury to people or property resulting from any ideas, methods, instructions or products referred to in the content. |
© 2024 by the authors. Licensee MDPI, Basel, Switzerland. This article is an open access article distributed under the terms and conditions of the Creative Commons Attribution (CC BY) license (https://creativecommons.org/licenses/by/4.0/).
Share and Cite
MDPI and ACS Style
Gaganis, C.M.; Troumbis, A.Y.; Kontos, T. Leveraging Reed Bed Burnings as Indicators of Wetland Conversion in Modern Greece. Land 2024, 13, 538. https://doi.org/10.3390/land13040538
AMA Style
Gaganis CM, Troumbis AY, Kontos T. Leveraging Reed Bed Burnings as Indicators of Wetland Conversion in Modern Greece. Land. 2024; 13(4):538. https://doi.org/10.3390/land13040538
Chicago/Turabian StyleGaganis, Cleo Maria, Andreas Y. Troumbis, and Themistoklis Kontos. 2024. "Leveraging Reed Bed Burnings as Indicators of Wetland Conversion in Modern Greece" Land 13, no. 4: 538. https://doi.org/10.3390/land13040538
Note that from the first issue of 2016, this journal uses article numbers instead of page numbers. See further details here.