Article

Insights from 30 Years of Land Use/Land Cover Transitions in Jakarta, Indonesia, via Intensity Analysis

1
Coastal and Ocean Management Institute (COMI), College of the Environment and Ecology, Xiamen University, Xiamen 261102, China
2
Department of Fisheries, Faculty of Agriculture, Universitas Gadjah Mada, Yogyakarta 55281, Indonesia
3
Fujian Institute for Sustainable Oceans (FISO), Xiamen University, Xiamen 361102, China
4
Indonesian Geospatial Information Agency, Cibinong, Bogor 16912, Indonesia
*
Authors to whom correspondence should be addressed.
Land 2024, 13(4), 545; https://doi.org/10.3390/land13040545
Submission received: 13 March 2024 / Revised: 17 April 2024 / Accepted: 17 April 2024 / Published: 19 April 2024

Abstract

:
Here, we assess land use/land cover (LULC) transitions over the last 30 years in Jakarta, Indonesia. Land cover maps were prepared for 1990, 1995, 2000, 2005, 2010, 2015, and 2020 using seven categories of Landsat satellite image: bare land, built-up, cropland, green area, mangrove, water body, and pond. LULC changes were assessed through intensity analyses at the interval and transition levels. LULC changes were initially rapid (1990–1995) and then more gradual (1995–2000, 2000–2005, and 2005–2010). Unlike in previous intervals, annual changes were uniformly distributed over time in 2010–2015 and 2015–2020. Driven by high population and economic growth, built-up land was identified as an active gainer in all intervals except 2010–2015. Alongside built-up areas, cropland was the main supplier of other categories, including bare land, pond, built-up, and green areas. The largest transition area occurred in pond and green areas during 2005–2010 and in built-up land during 2015–2020. High demand for built-up land was observed in land changes driven by high population growth triggered by economic necessity. Economic and population growth exhibited a positive correlation (R2 = 0.78, t = 9.996). This study elucidates spatiotemporal LULC transition patterns over 30 years in a rapidly growing city.

1. Introduction

Changes in land use and land cover (LULC) have significant effects on the biophysical, ecological, political, and social spheres [1,2]. Moreover, interactions between economic, population, and environmental elements accelerate LULC processes on the local to global scale. In recent years, population and economic growth has prompted remarkable urban development and the growth of metropolitan cities worldwide [3,4]. The consequences of this development include reduced ecosystem support, increased flood frequency, a decline in biodiversity, the deterioration of water quality, and the disappearance of suburban farmlands and green spaces in metropolitan cities [5,6]. Hence, urban growth is widely acknowledged as a significant catalyst for environmental and ecological transformation within terrestrial ecosystems [7]. Therefore, it is important to find solutions to these problems within the constraints of urban environments, which are characterized by limited land and high population density. Understanding the temporal and spatial characteristics of LULC transitions is a crucial first step.
Analyzing the spatial distribution of LULC often entails defining the processes of change, quantifying the pattern of change, and disclosing land transitions [1,8]. Previous research has typically combined quantitative and qualitative data to explain the changes in terms of explanatory factors, such as proximity to public services, thereby linking the detected patterns with their causes [9,10,11,12]. Moreover, in-depth analyses of urbanization processes can elucidate LULC changes and improve LULC monitoring [13,14]. Assessments of LULC changes aim to reveal the magnitude, trajectory, causative factors, and consequences of such changes, spanning local to global scales, and provide valuable data for land use management and the sustainable development of metropolitan areas [15,16]. To understand the dynamics of LULC changes in metropolitan areas, specific methods are required, such as geographic information systems (GISs) and remote sensing, which can effectively and accurately illustrate LULC changes and therefore help governments manage and anticipate the effects of certain policies. Thus, GISs and remote sensing are widely implemented economical tools for monitoring the spatial and temporal dynamics of LULC changes on a global scale [17,18,19].
Intensity analysis is commonly used to elucidate LULC change processes, as matrix change tables alone are inadequate for a thorough understanding [20]. Intensity analysis quantifies the distribution of land use categories across specific time intervals using a transition matrix [1,21,22], which provides the major factors and causes of LULC changes [23]. This method, created by Clark University, analyzes changes in land use according to different categories, at interval, category, and transition levels, and determines the intensity of LULC changes in relation to uniform intensity values [21]. To date, intensity analysis has been used to investigate the specific dominant change in LULC from 1986 to 2022 around a moist semideciduous forest in Ghana [24], the significance of transitions among major LULC classes from 2002 to 2022 in Bosomtwe District, Ashanti Region, Ghana [25], and LULC in the coastal zone of Benin, West Africa, to improve management following ecosystem loss and fragmentation from 1991 to 2021 [26]. Moreover, Huang et al. compared the performances of intensity analysis and a land use dynamic degree model in evaluating land use changes in the coastal zone of Longhai, Southeast China [27]. They found that intensity analysis helps to elucidate the transition patterns and magnitude of changes within each land use category.
Research into the factors responsible for LULC changes often focuses on the correlation between population growth, economic growth, and land usage, highlighting their strong interactions and substantial consequences [28]. Statistical correlation analysis can provide an overview of the relationship between two variables. For example, Zhang et al. investigated the spatial heterogeneity of factors influencing built-up land development intensity in China from 2006 to 2016 through statistical correlation analysis [29]. Azhdari et al. investigated the relationship between socioeconomic segregation and the spatial driving forces of expansion using statistical regression in Shiraz, Iran [30]. Furthermore, Su et al. used statistical correlations to quantify changes in agricultural landscape patterns in response to urbanization and population growth in the Qiantang River watershed, China [31].
As the capital city of Indonesia, Jakarta has experienced significant population and economic growth, resulting in a substantial expansion of urban areas and corresponding land use changes in recent decades [32,33,34]. Between 1972 and 2023, the urban area of Jakarta grew by a factor of more than 200, and the city’s population exhibited an average annual growth rate of 2.21%, increasing from 2.7 million in 1960 to 10.5 million in 2022 [35]. The escalating population density, coupled with urbanization pressure and a significant economic value attributed to urbanized land, exerts continuous pressure on LULC. Thus, LULC identification and assessment are particularly significant for revealing the patterns of LULC changes in Jakarta and can provide novel perspectives on the transitional elements that characterize land use change in metropolitan cities.
Several studies have examined the roots and impacts of LULC. However, one aspect that remains unexplored is elucidating transition patterns and the extent of change, particularly in urban areas experiencing population growth due to economic expansion.
In this study, we used intensity analysis to quantify LULC changes over a 30-year period of significantly increased growth (1990–2020) in Jakarta, Indonesia. The quantitative framework of intensity analysis indicates changes at three different levels of detail: interval, category, and transition levels [1,36,37]. However, in this research, we focused on only two parts of the intensity analysis: (1) interval levels to identify the annual changes in LULC and (2) the transition patterns of LULC changes to identify the magnitude of changes and the LULC categories that were targeted and avoided. Specifically, we aimed to (1) identify the LULC change interval in Jakarta during 1990–2020, (2) assess LULC transition patterns in Jakarta during the same period, and (3) identify the driving forces of recent LULC changes in Jakarta.

2. Materials and Methods
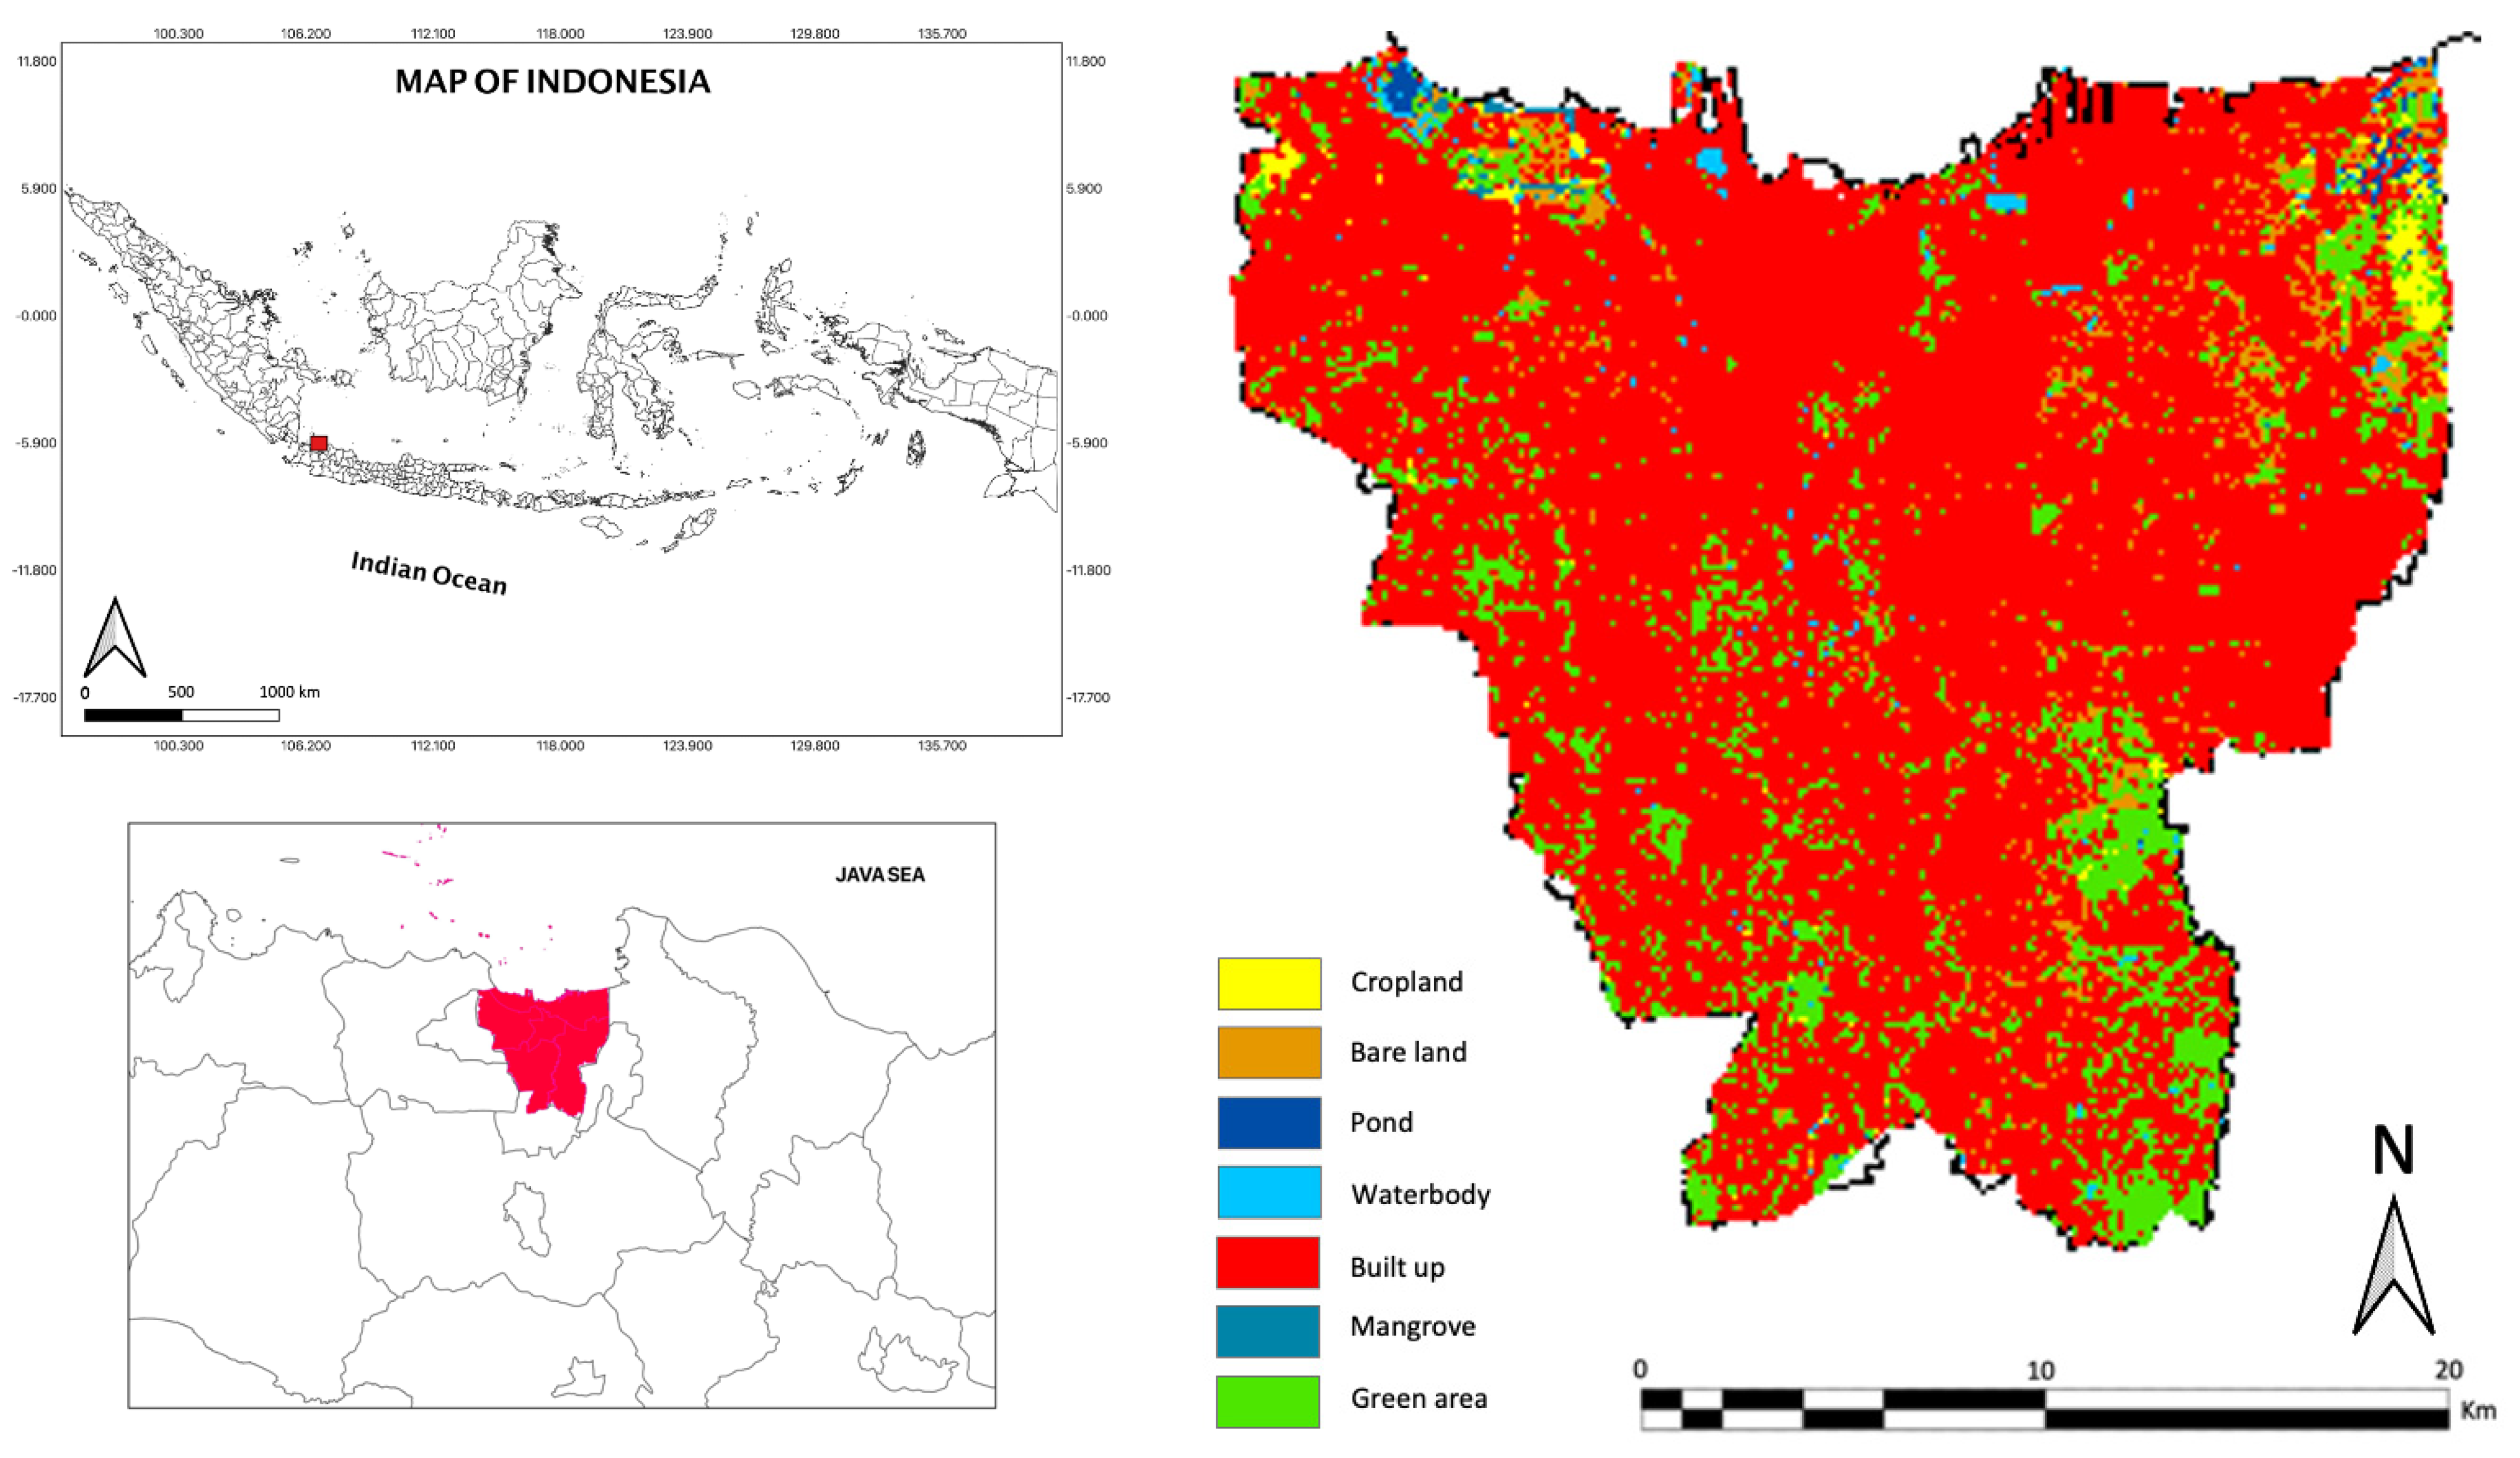
2.1. Study Area

Jakarta Special Province is situated within Java Island, between the West Java Province and Banten Province, spanning from 106.059′00″ E to 107.009′00″ E in longitude and 5.009′26″ S to 6.038′03″ S in latitude. The land area is approximately 664.01 km2, and the population is more than 10.5 million. Geographically, the entire Jakarta region is situated between 8 m and 91 m above sea level, with an average air temperature of 25–38 °C [35]. Jakarta Special Province comprises six cities and regencies: East Jakarta, North Jakarta, West Jakarta, South Jakarta, Central Jakarta, and Kepulauan Seribu (Figure 1).

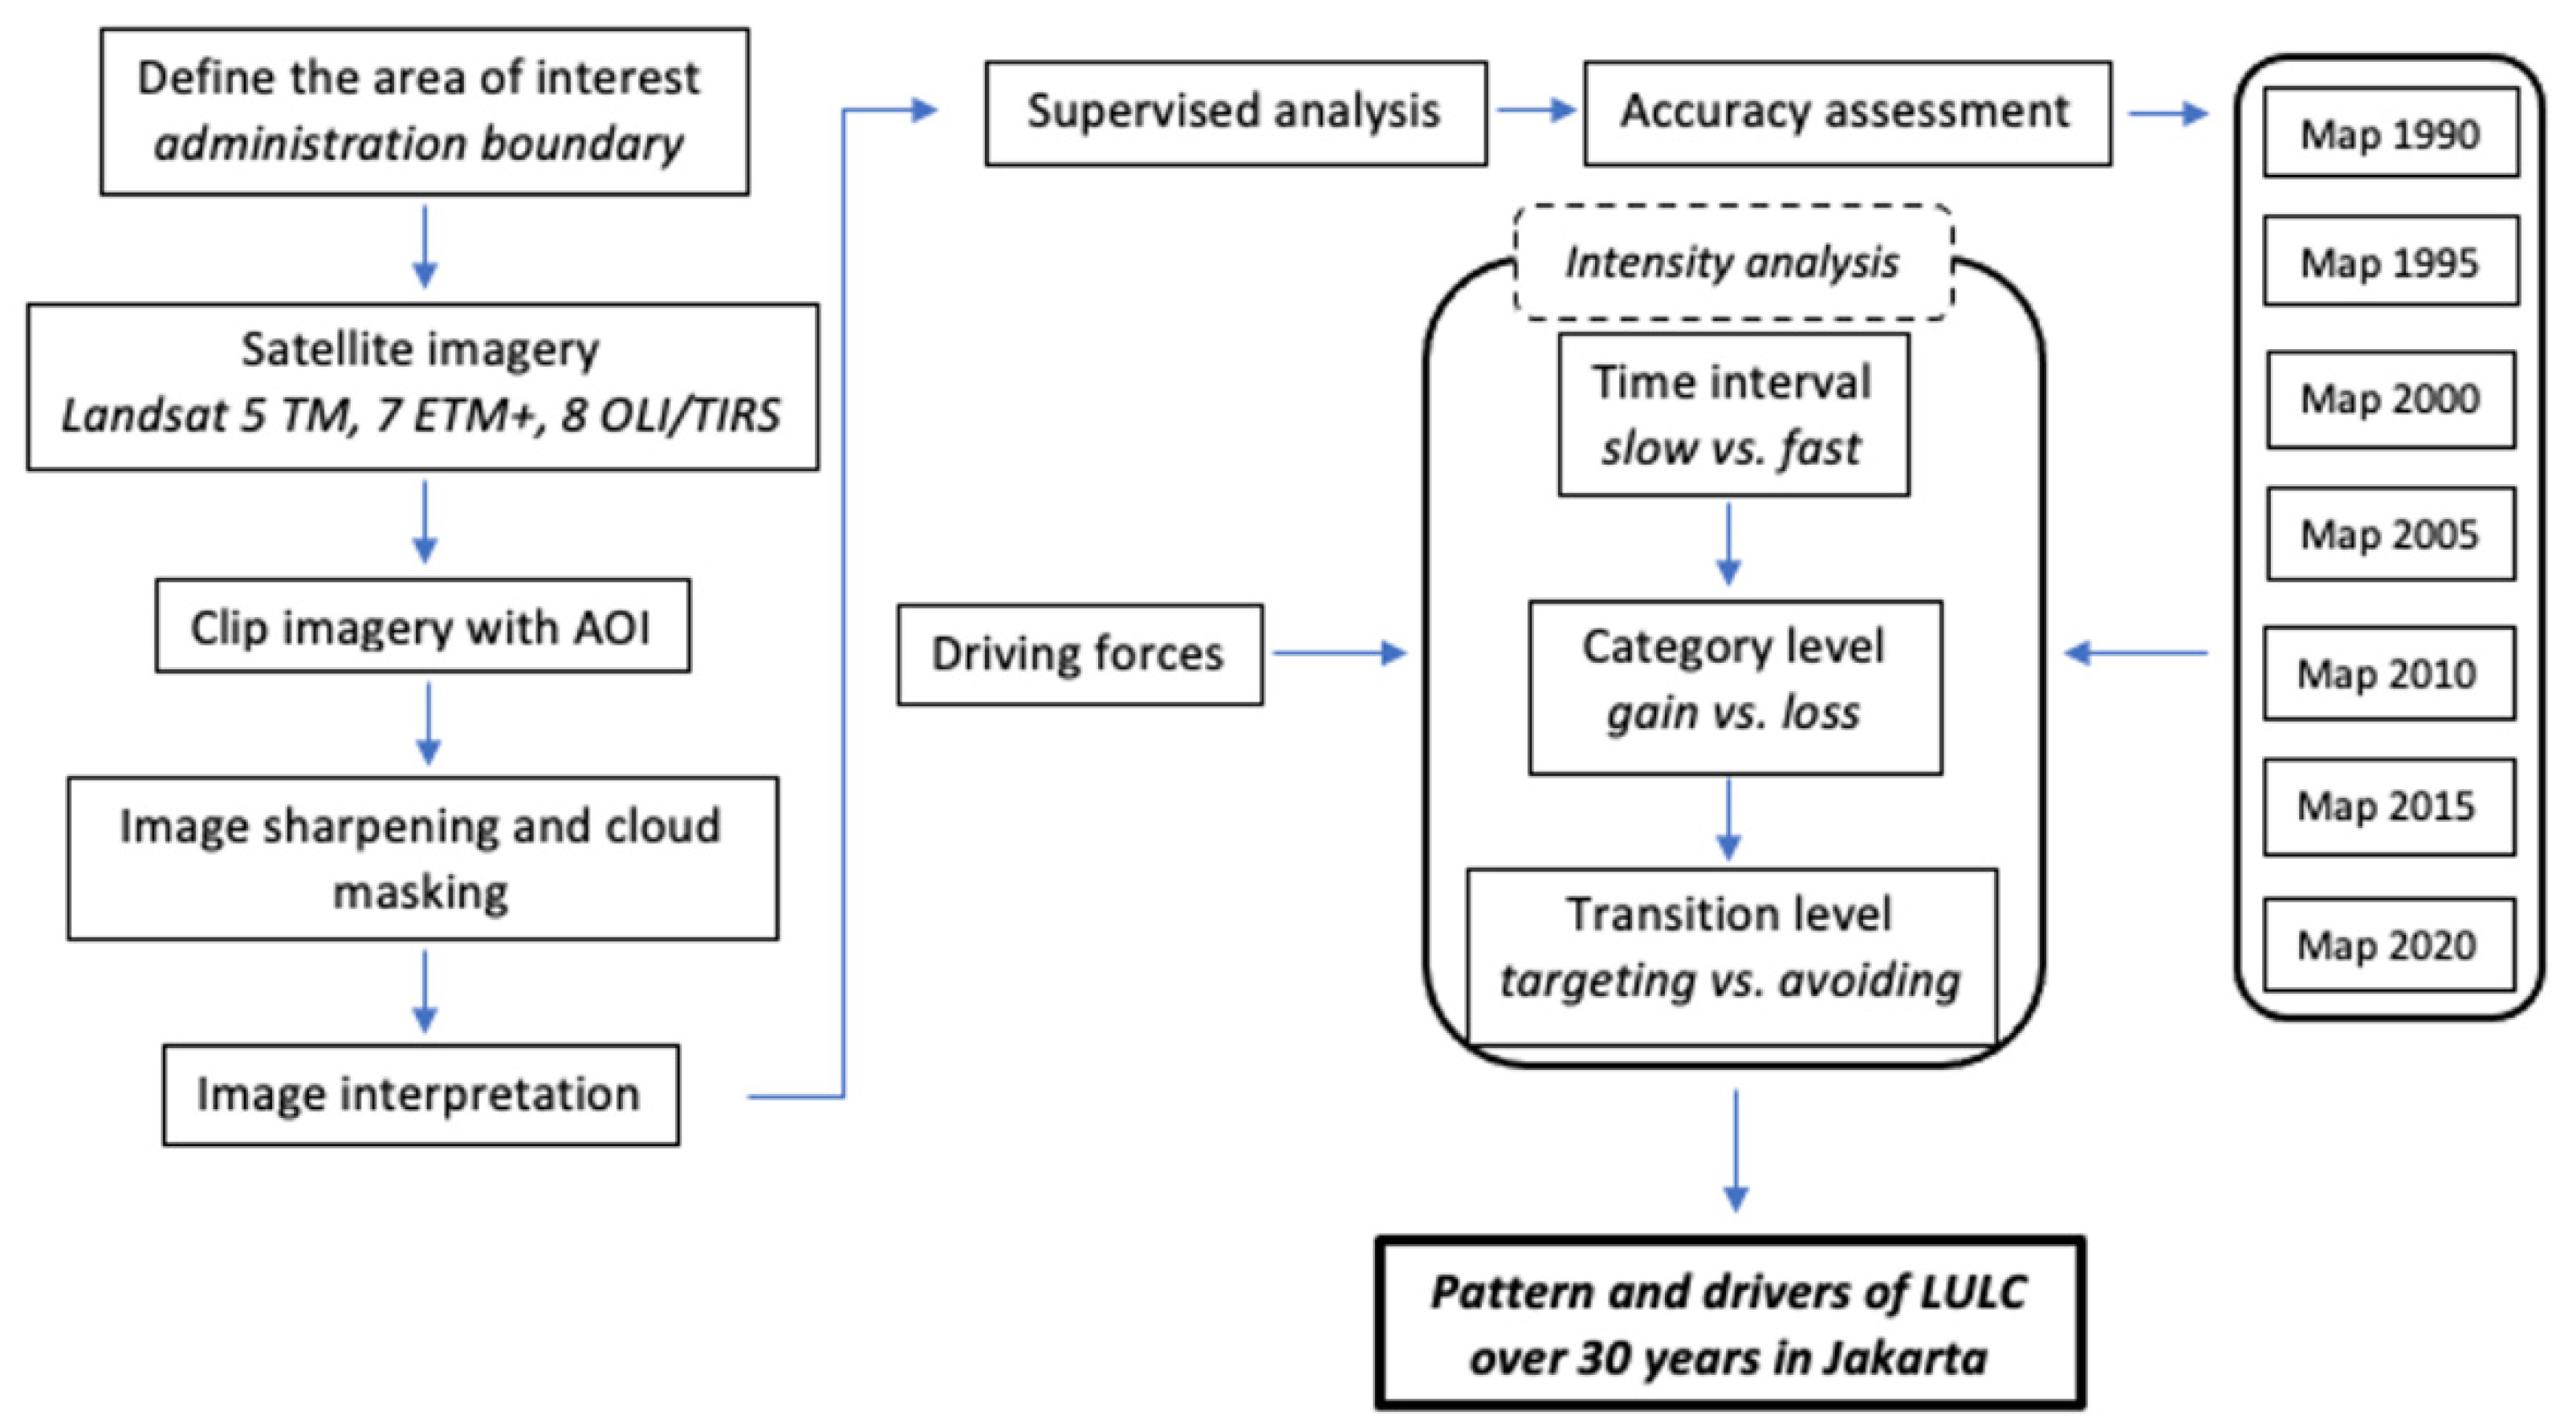
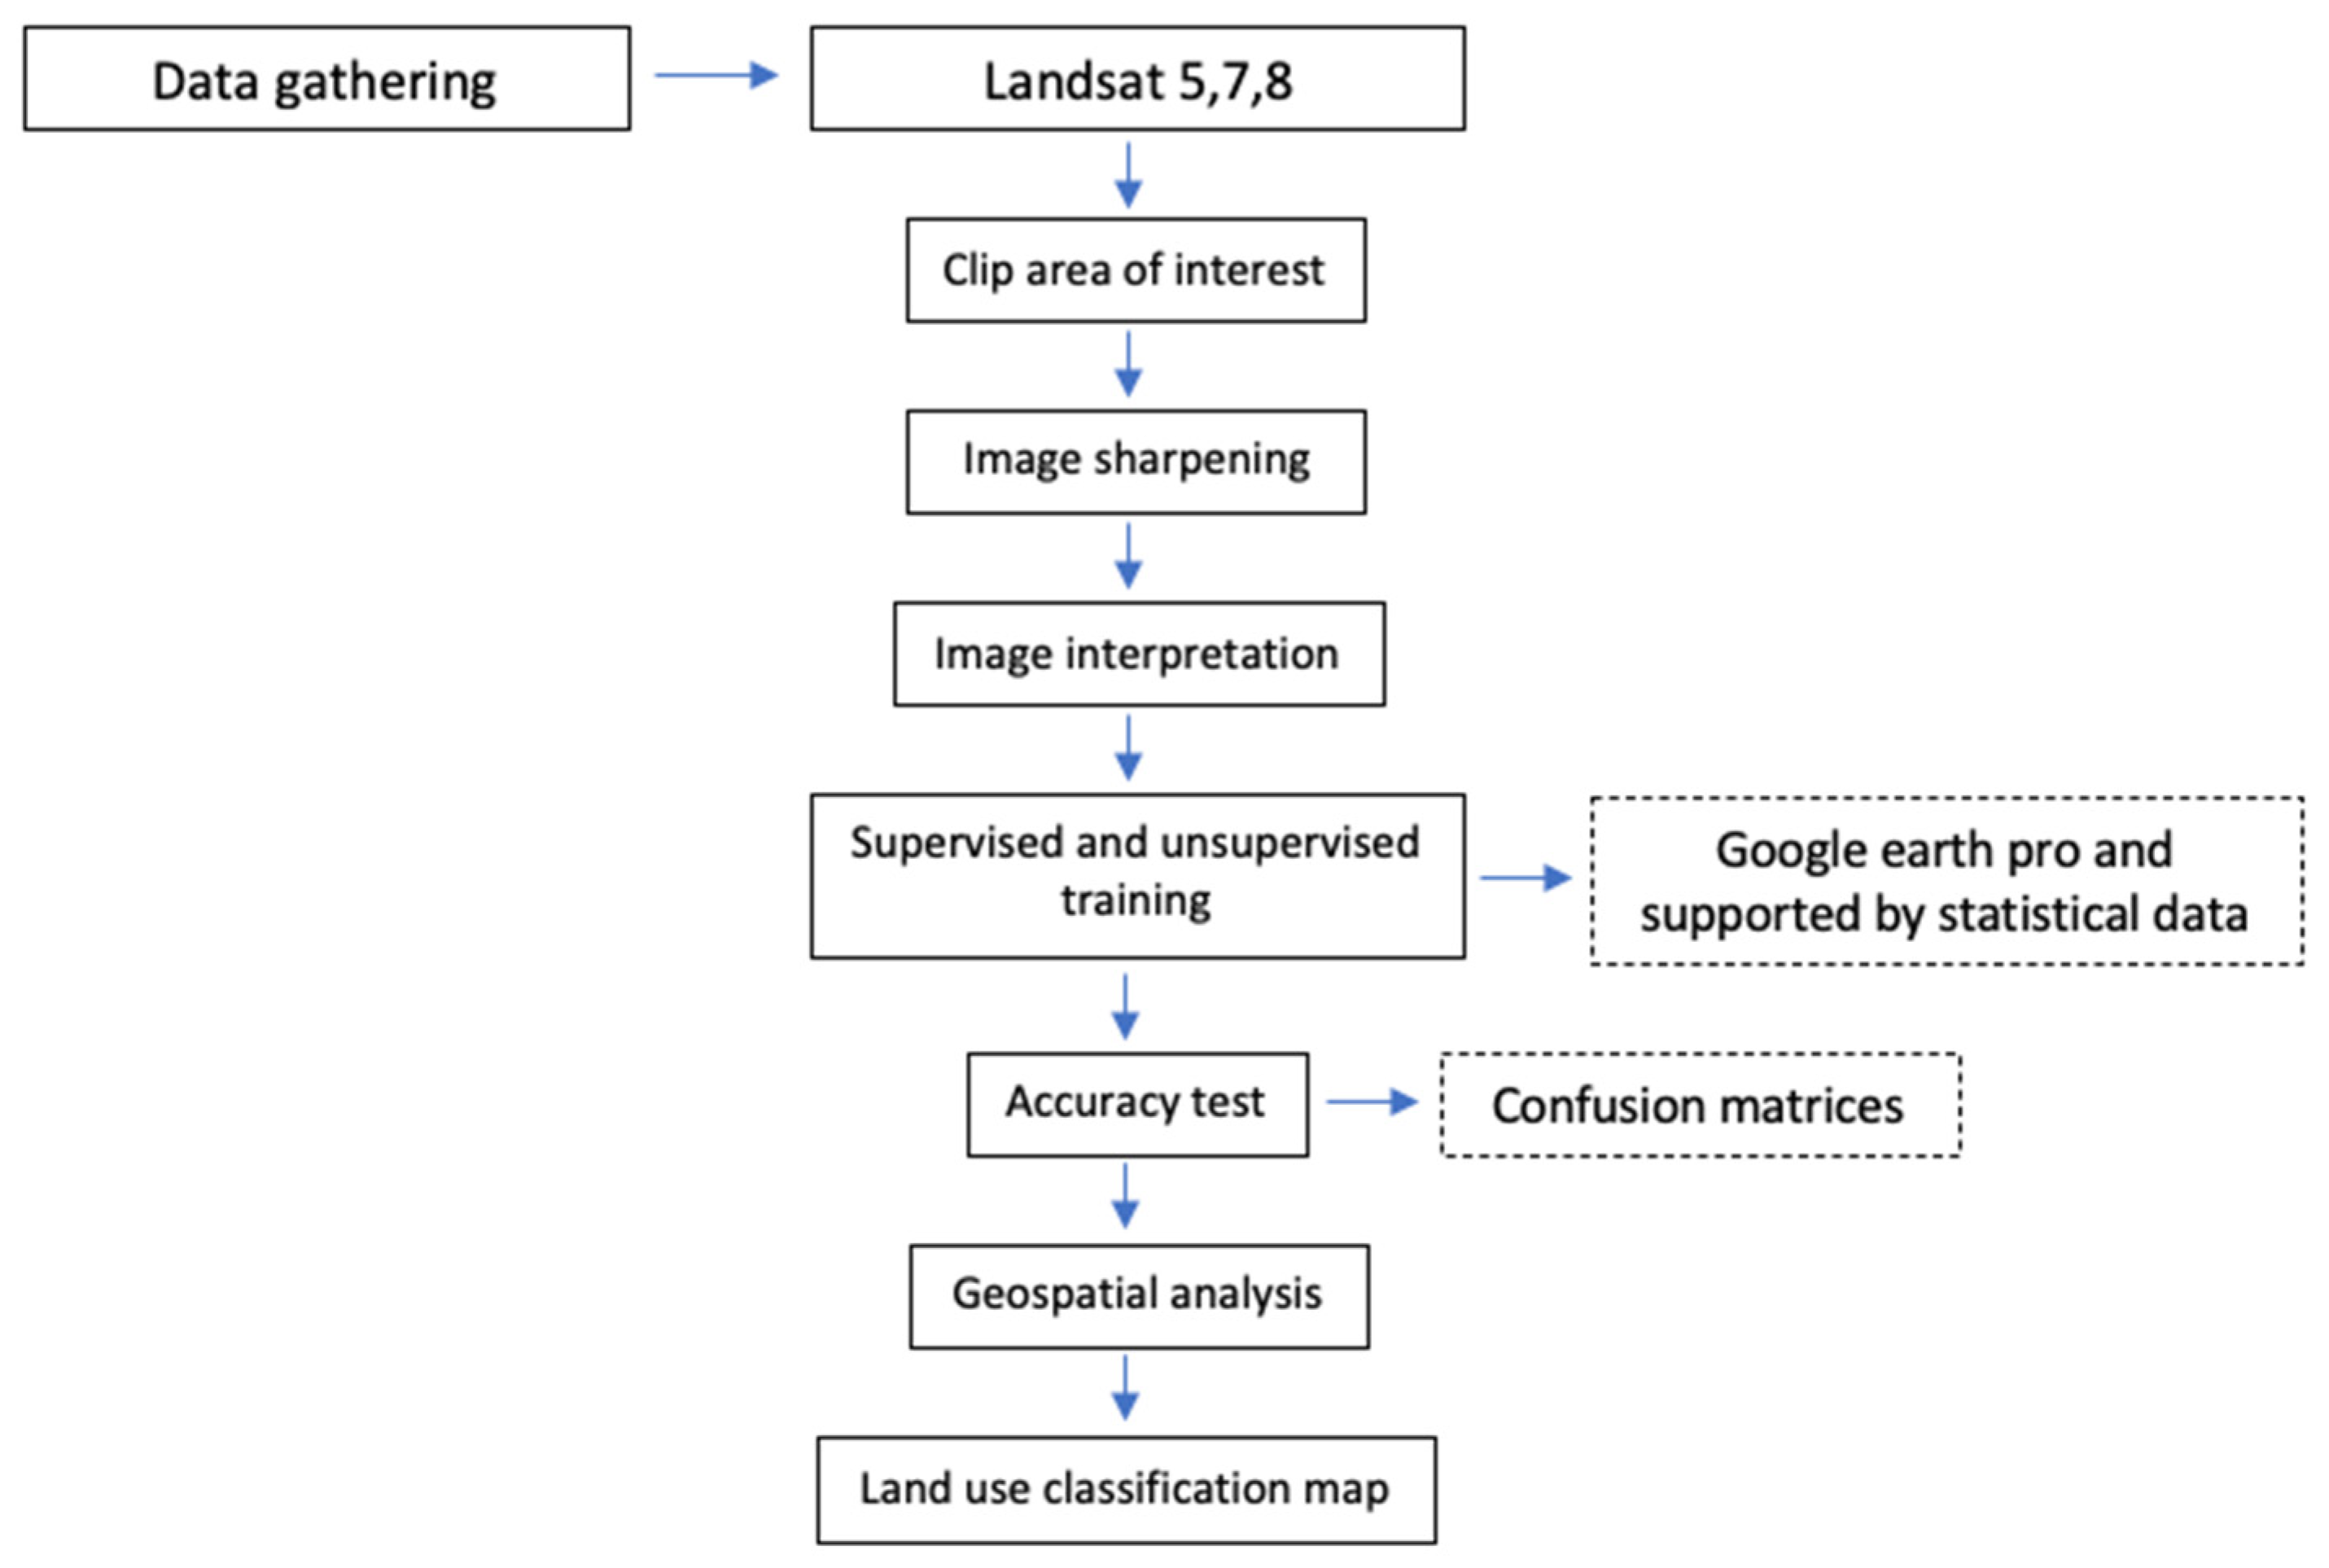
2.2. Data Collection and Processing

Data collection was performed using Landsat imagery at a resolution of 30 m × 30 m. For the data gathering phase, we selected and acquired Landsat images from the United States Geological Survey archive and generated them using the Google Earth Engine (GEE), a widely utilized cloud computing platform that encompasses an extensive collection of satellite imagery and geospatial datasets amounting to many petabytes [38]. Internet access to the archived Landsat data is facilitated by the GEE platform, where it is available as a collection maintained by the United States Geological Survey [39]. The JavaScript API of the GEE was used at all stages of pre-classification, classification, and post-classification. We uploaded the Jakarta Administration Shapefile to the assets in the GEE to specify the area of interest. Upon importing the area of interest, we applied the shapefile to the GEE window to clip Jakarta’s administrative area. We then selected Landsat 5 Thematic Mapper (TM) imagery for 1990, 1995, and 2000. Landsat 7 Enhanced TM Plus was used to collect data for 2005 and 2010, while Landsat 8 Operational Land Imager (OLI) and Thermal Infrared Sensor (TIRS) data were used for 2015 and 2020 (Table 1).
Image filtering was conducted in the GEE to eliminate images with excessive cloud cover and shadows [40]. The filtering area was categorized into segments using the multiresolution segmentation method, which employs the normalized difference vegetation index and normalized difference built-up index [41]; the former was used to quantify vegetation density and is valuable for identifying bare land, cropland, green, mangrove, waterbody, and pond areas, and the latter was employed to ascertain the extent of urbanization and built-up areas. In the GEE software, image interpretation is achieved through supervised classification techniques. Initially, the sampling area is established using the object appearance in the image before the interpretation procedure is executed. In this study, we initially identified seven LULC categories: bare land, built-up, cropland, green area, mangrove, pond, and waterbody categories (Table 2). To quantify the data accuracy, we established a confusion matrix in the GEE [42]. Then, after gathering the data for LULC in the GEE, we downloaded the data to Google Drive to execute the visualization process and produce the map of LULC with QGIS open source mapping software (version 3.28). The complete process of this study is shown in Figure 2.

2.3. Land Use Classification

The research area is deficient in historical data related to built-up construction, environmental records, and commercial records, which otherwise could have been used to quantify LULC changes over the past several decades. Therefore, we employed Landsat data with multiple time points and varying resolutions. For satellite image classification, we used a hybrid classification strategy that combines supervised and unsupervised classification methods. Before the hybrid classification procedure, a conscious decision was made to exclude the integration of radiometric augmentation with the images to avoid any possible interference with spectral information, similar to previous studies [43,44,45,46,47,48,49].
Land use within the study area was categorized into seven classifications (Table 2): (1) bare land; (2) built-up; (3) cropland; (4) green area; (5) mangrove; (6) water bodies; and (7) pond. The categorization of non-river inland water bodies as aquaculture was accomplished using the spectral signature of saline water. It is important to acknowledge that all photographs used in this study were obtained during the dry season, a period typically characterized by the use of lowlands for paddy agriculture. Essentially, a Landsat image does not show ponds or waterbodies differences. Nevertheless, in order to distinguish between pond areas and waterbodies, we employed a supervised method that relies on data from statistical agencies to furnish details regarding the position and structure of land cover. Ponds exhibit a more uniform pattern in comparison to waterbodies, such as lakes or reservoirs. Aquaculture is observed exclusively in regions characterized by the presence of saline water, and are predominantly used for shrimp farming and not for paddy agriculture during the dry season.
Consequently, the distinction between mangroves and green areas was determined using a supervised approach, with the assistance of Google Earth. In addition, mangrove formations are found in coastal regions, whereas green areas are predominantly concentrated on the mainland. In addition, the literature research has also focused on ascertaining the geographical distribution of mangrove regions in Jakarta, utilizing sources such as data from the Jakarta Environmental Agency. The thorough procedure of land use classification is shown in Figure 3.

2.4. LULC Identification

The maps were compared individually for each time interval: 1990–1995, 1995–2000, 2000–2005, 2005–2010, 2010–2015, and 2015–2020. Identification focused on determining a post-classification approach. Cross tabulation was performed for each map pair. Aldwaik and Pontius utilized intensity analysis at three levels (time interval, category, and transition) to conduct a precise analysis of LULC changes [1]; however, we focused instead on the interval and transition levels to reveal the sizes and patterns of LULC transitions in Jakarta from 1990 to 2020. The method for illustrating the transition pattern was adopted from the study by Xie et al. [37].
First, the total changes in each time interval were analyzed by determining the size and rate of change over time. The intensity of annual changes in each time interval was calculated, and the observed values were compared with a uniform intensity that would exist if annual changes were uniformly distributed throughout time. Second, we analyzed the transition level to verify the size and intensity of the transition between categories. Because cells are gained or lost in each category, the transition level can specify which other categories are targeted or avoided for transition by comparing the observed intensity of each transition with a uniform intensity that would exist if the transitions were distributed uniformly between categories [1]. To investigate the driving forces of LULC, we verified the results using annual reports from the local government and statistical agency of DKI Jakarta, including annual environmental reports.

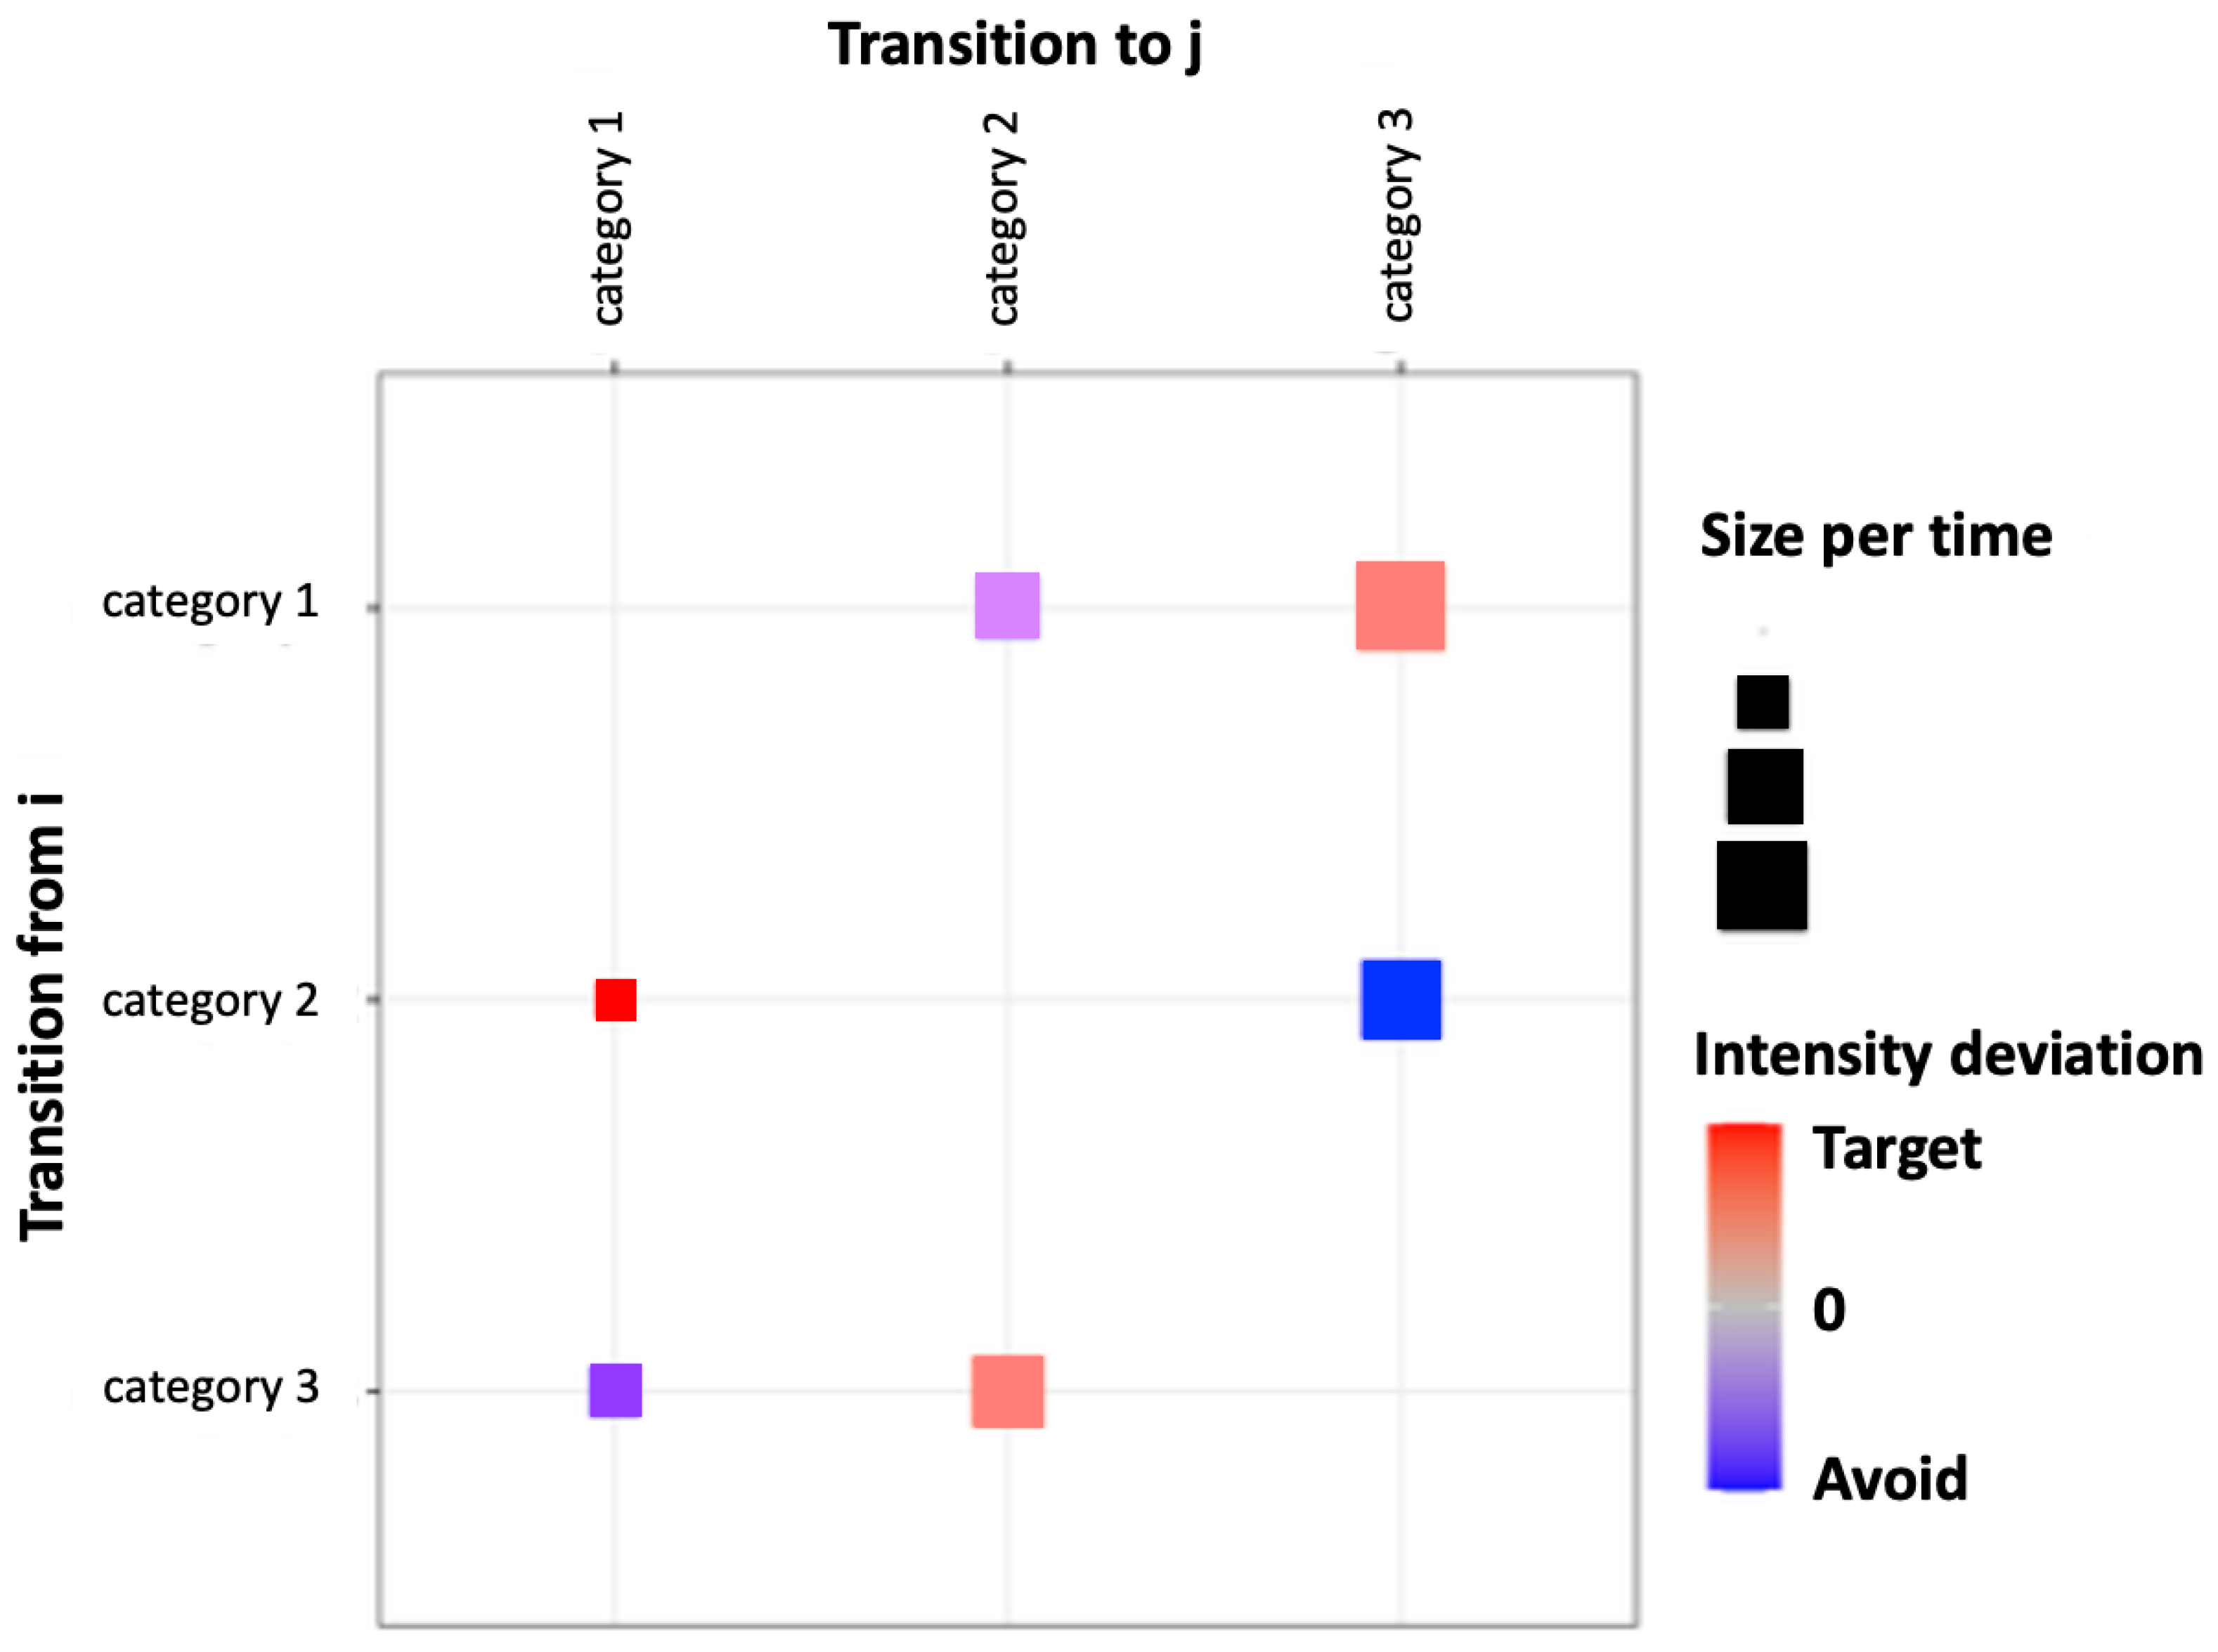
2.5. Intensity Analysis and Transition Pattern

Intensity analysis is an elaborate computational method enabling the in-depth analysis of the interactions between categories over time. It also quantifies the degree and intensity of non-uniform changes at various levels of detail [1,50,51]. Thus, intensity analysis can reveal periodic or constant LULC changes over time. The framework for identifying transition patterns, which was introduced by Xie et al. and applied to Nanchang, China [37], can visualize both the size and intensity of the transition. The rows and columns of the matrix explain losses and gains, respectively. Diagonal entries were omitted in this study because they represent persistence rather than change. The square dimensions are directly proportional to the annual area of transition and the color of the square indicates the degree of transition intensity by which the column category exceeds the row category. If the intensity of a specific transition exceeds the uniform transition intensity of the column, the square is shaded red, and we infer that the gaining category relies on (targets) the row category. If the intensity of a specific transition is lower than the uniform transition intensity of the column, the square is shaded blue, and we identify it as a gaining category that avoids the row category. The intensity deviation is the difference between the transition intensity (Rtij) of a specific off-diagonal entry and the uniform transition intensity (Wtj) of the column (Supplementary Materials). The colors in each column reveal how each column’s gaining category aligns with or deviates from each row’s losing category. The transition pattern is illustrated in Figure 4.

2.6. Identification of Driving Forces

Urban development in metropolitan areas is the result of rural to urban population migration and its consequences. Economic factors are one reason why people move from rural to urban areas [52], with the economic development of metropolitan areas leading to an increase in population and increased demand for housing, offices, and reserve necessities. In this study, we assessed the most populated city in Indonesia, which revealed two main factors. Hence, we employed linear regression as a technique for measuring the correlation between the two driving factors, namely, GDP and population growth. The linear regression has been empirically validated for assessing the correlation between two variables. Zhang investigated the impact of population growth and economic growth on a city’s physical development [53]. According to Li et al., economic development results in a need for public spaces, housing, and warehouses to support the business sector [54]. In this study, population growth trend identification was applied to identify the driving forces of LULC changes. Data were collected from the Jakarta Central Statistics Agency. The obtained data were certified secondary data published by the authorized institution. The collected data included population and gross domestic product data. These data were used based on the correlation between population growth and economic growth, which indicates the expansion of urban regions and its impact on urban land use patterns. Specifically, we examined the correlation between economic growth and population expansion as the driving forces of LULC changes in Jakarta via regression analysis. The existing literature related to population growth and gross domestic product (GDP) for Jakarta from 1990 to 2020 was used in this study. The linear regression analysis is described as follows:
y = a + b x
where y is the dependent variable, a is a constant, b is the determination coefficient, and x is the independent variable.

3. Research Results

3.1. LULC Classification and Accuracy

Figure 5 presents a map of LULC changes in Jakarta. The map shows seven land categories at seven different time points. All maps on the left show LULC changes from 1990 to 2020, divided into time intervals of five years. In this step, the loss and gain maps reveal the transitions. We used both the total accuracy and standard kappa to assess the classification accuracy. The map accuracy was assessed through a comparison with 70 control sites in the study area using Google Earth and pan-sharpened satellite images for each year. The points were examined on the created maps to determine the overall accuracy and kappa coefficient for the produced maps. The maps showed an overall accuracy of at least 84.29% and a maximum accuracy of 98.57%. The kappa coefficient in the final set of maps ranged from 81.67 to 98.33 (Table 3).

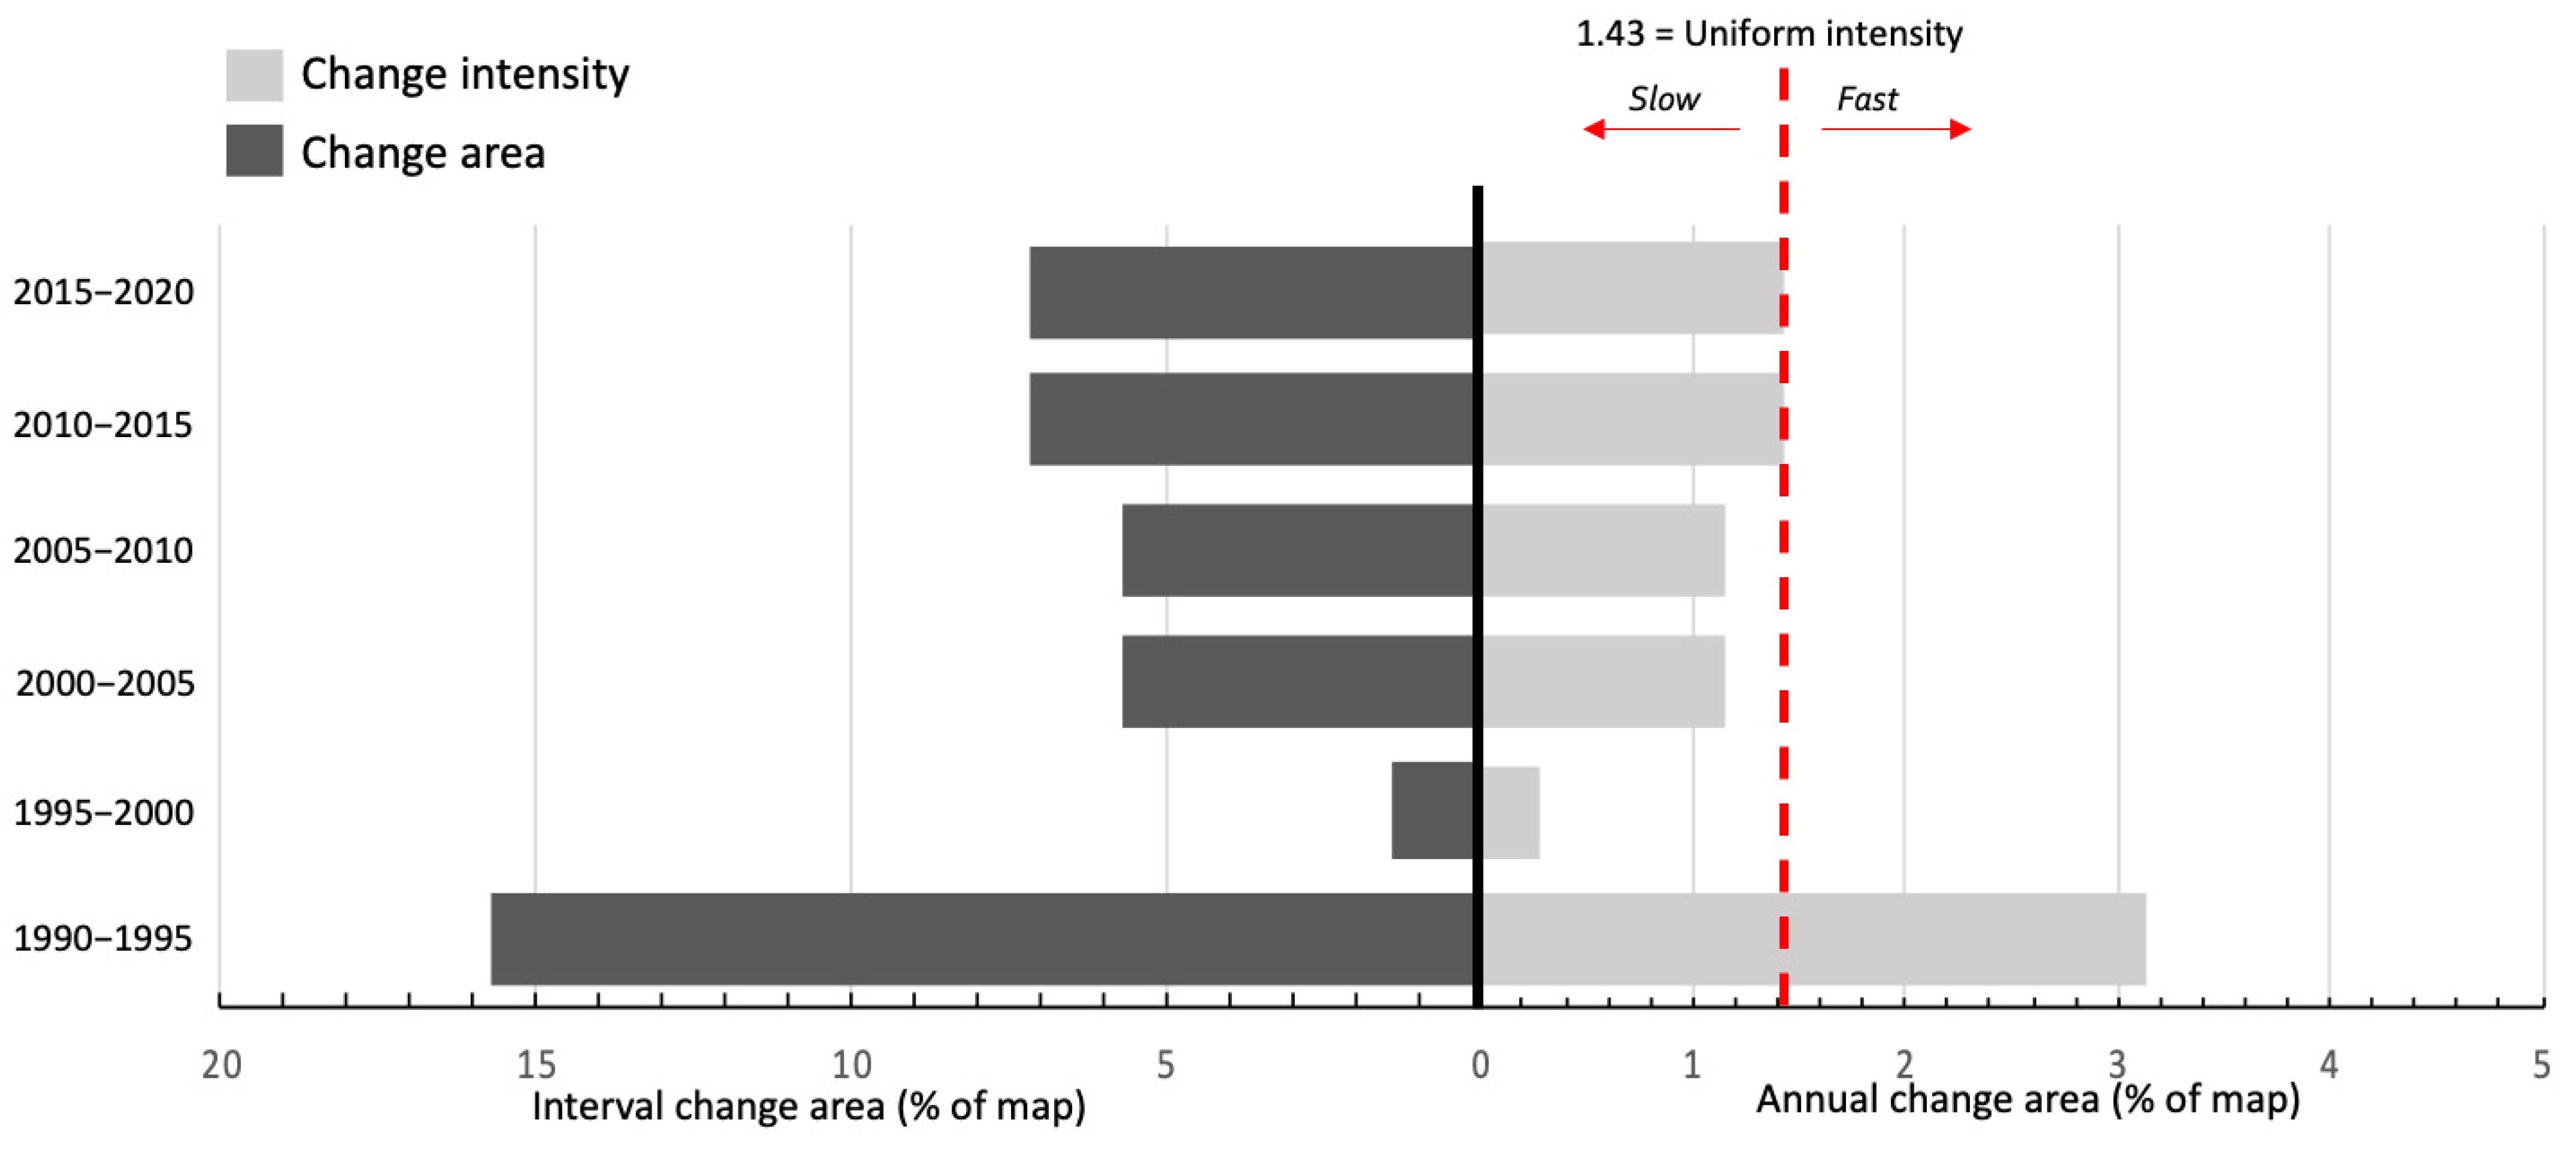
3.2. Interval Change

Based on the transition matrix of LULC changes over six time intervals, the rate of alteration per interval, annual change extent, and change magnitude from 1990 to 2020 are presented in Figure 6. Each bar extending from the central axis to the left represents the percentage change during the different time intervals. The bars extending from the central axis toward the right indicate the magnitude of the fluctuations observed during the study period. During 1990–1995, croplands transitioned to mangroves and small areas changed to water bodies. During 1995–2000, the land cover was almost constant, except for small areas of transition from ponds to water bodies in the northwest. During 2000–2005, we observed a transition from bare land to built-up land, with small areas transitioning from croplands and ponds to bare land. Between 2005 and 2010, we observed a transition from croplands and bare land to built-up and green areas in the northeast. Between 2010 and 2015, we identified a specific transition from ponds to built-up areas in the northwest, with some areas transitioning from bare land to built-up areas.
Finally, during 2015–2020, croplands, bare land, and green areas transitioned to built-up areas. During all periods except 1995–2000, the built-up area consistently increased.
Rapid LULC changes occurred from 1990 to 1995, which can be directly linked to the rapid development of built-up land (housing and offices) in Jakarta [55]. Moreover, 1990–1995 was the period of implementation of the PELITA 5 policy, which was established by the second president of Indonesia as a five-year development plan. The first PELITA was established in 1969 aiming to increase economic development in Indonesia. LULC changes in the second, third, and fourth intervals (1995–2000, 2000–2005, and 2005–2010, respectively) were slower than the uniform rate of change. However, the intensity of annual LULC changes in the fifth and sixth intervals (2010–2015 and 2015–2020) was precisely the same as the uniform intensity.

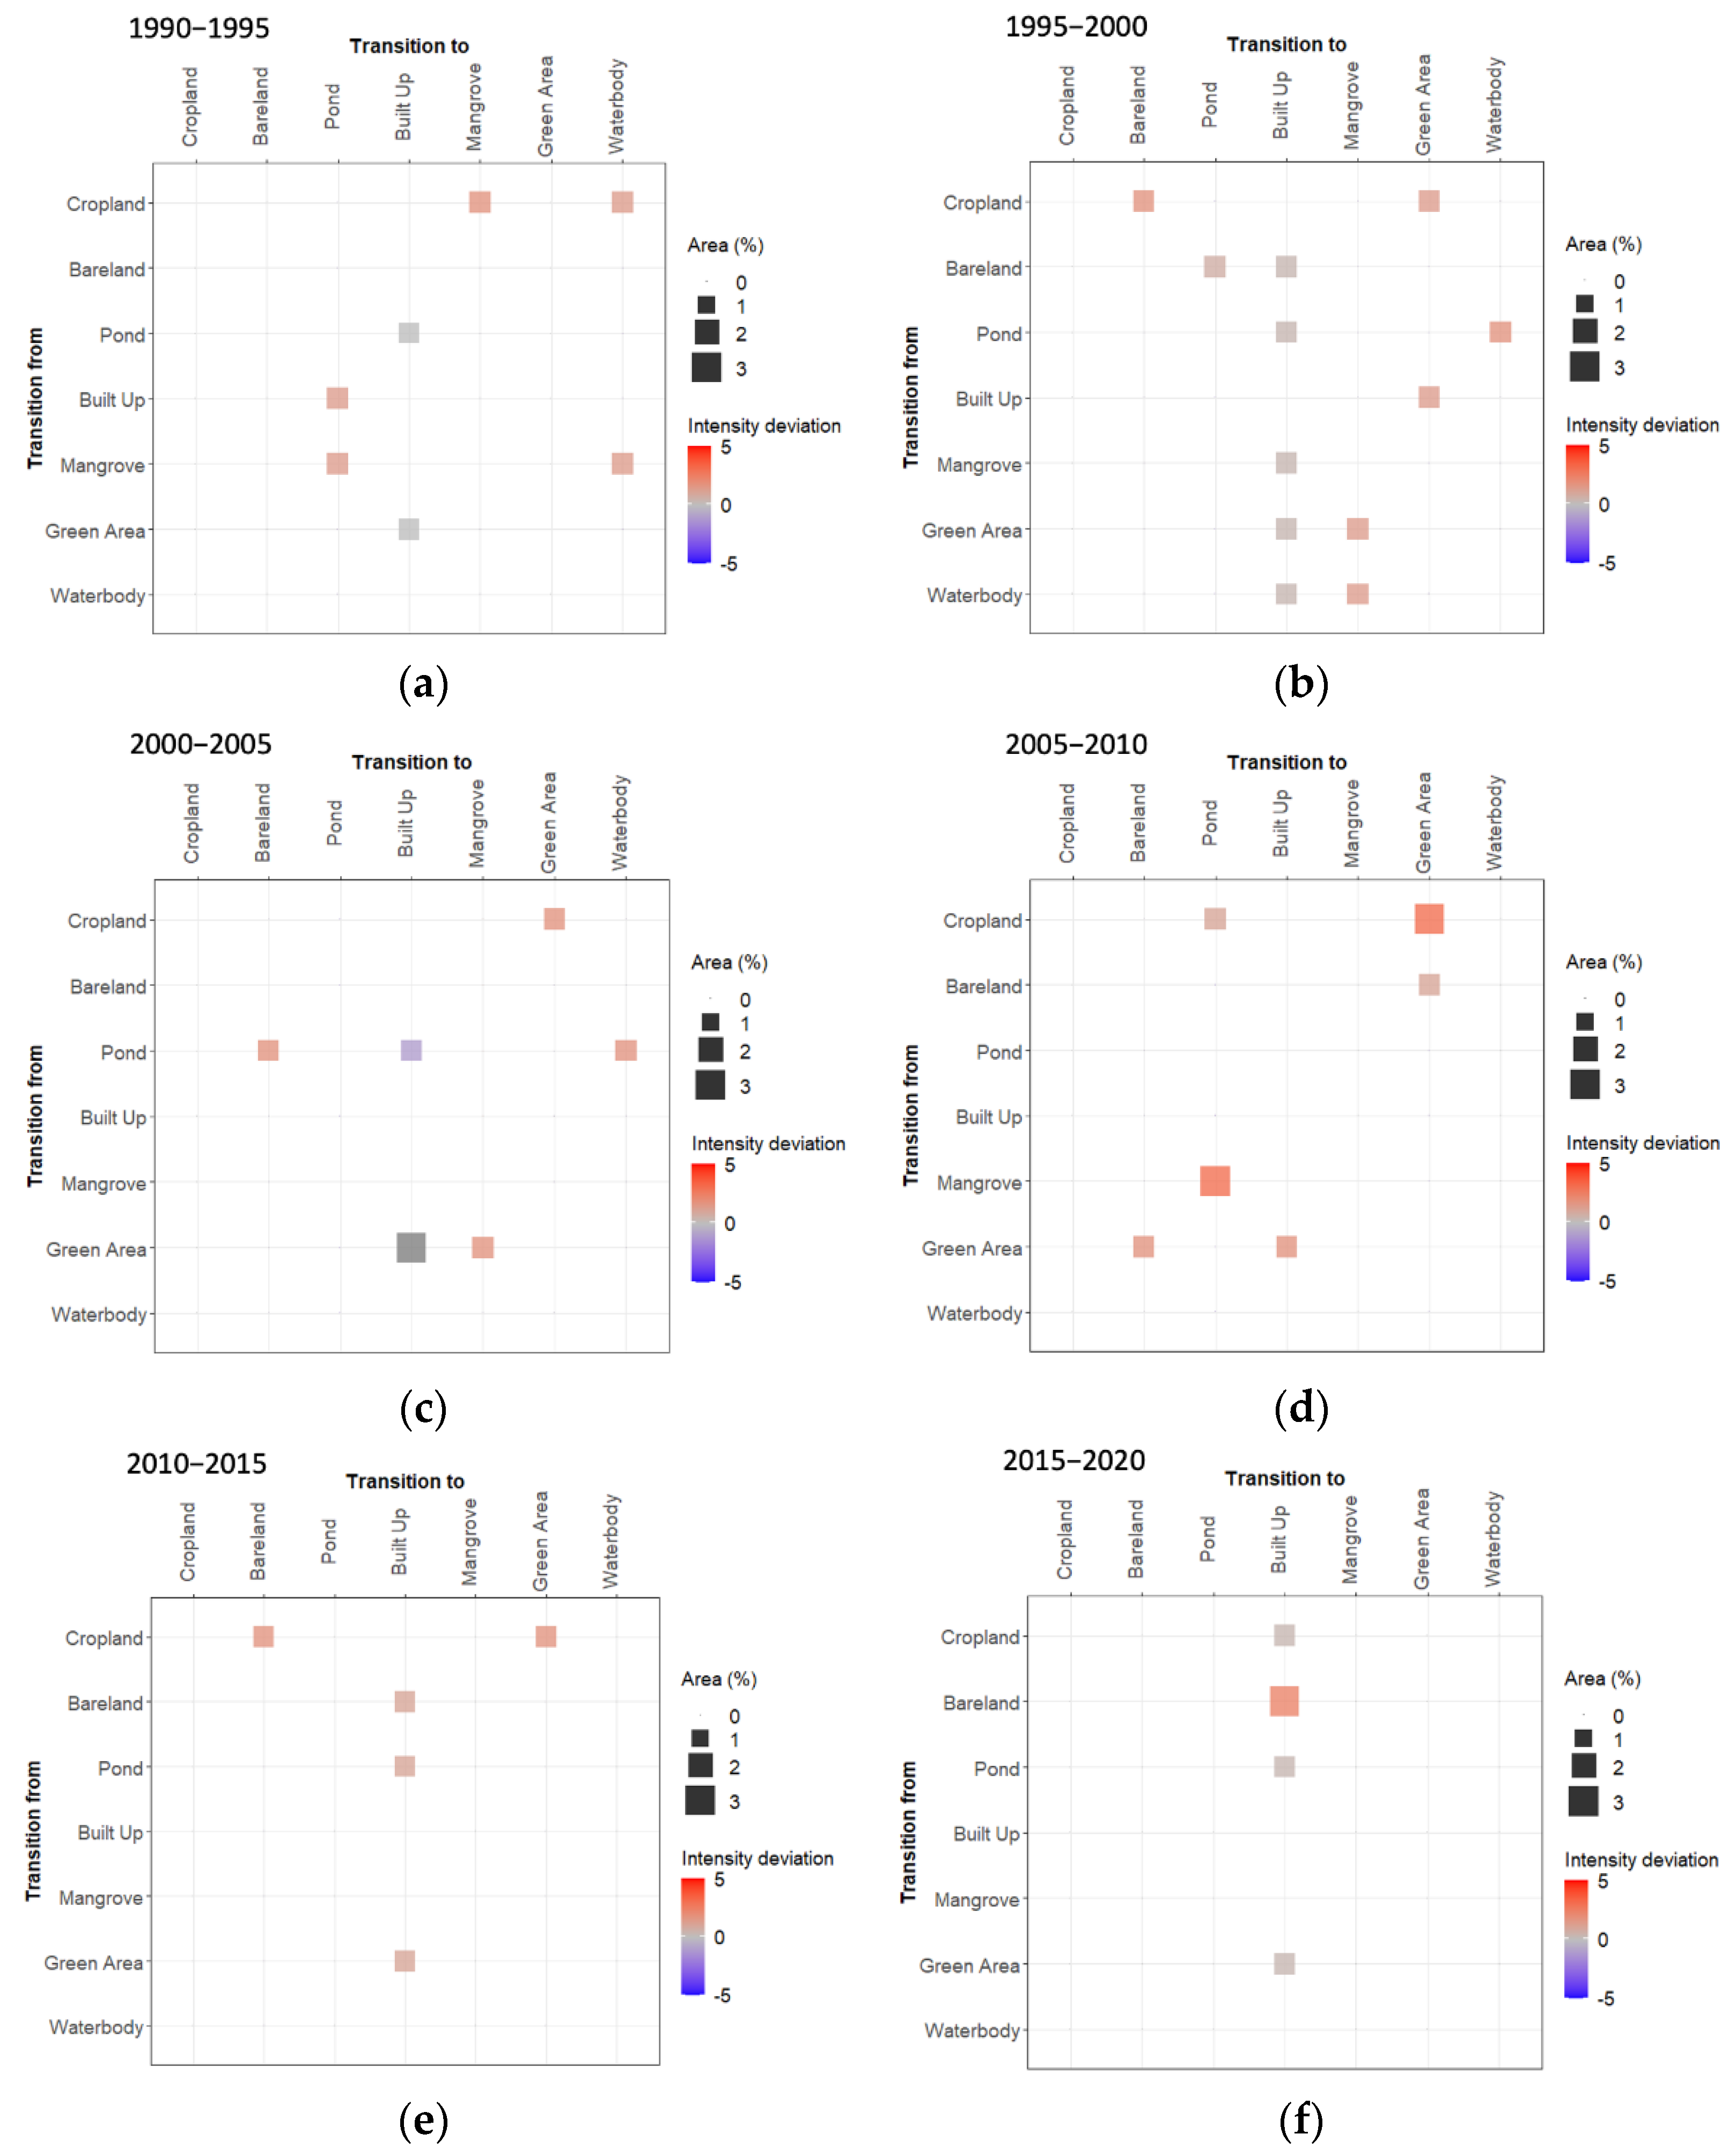
3.3. LULC Transition Pattern

Figure 7 shows the LULC transition pattern in Jakarta for the six time intervals, which reveal the size and intensity of transitions from 1990 to 2020. The largest transitions were from mangroves to ponds and from croplands to green areas during 2005–2010 (Figure 7d), and from bare land to built-up areas during 2015–2020 (Figure 7f). The figure also explains the transition among categories that were targeted or avoided based on the color of the square box plot at the beginning of each time interval. A substantial gain in built-up areas derived from green areas occurred during 1990–1995, 2005–2010, 2010–2015 (Figure 7a,d,e), and 2015–2020 (Figure 7f). Built-up land targeted green areas during 2005–2010 (Figure 7d) and 2010–2015 (Figure 7e).
The pond area gain was derived from built-up and mangrove areas during 1990–1995 (Figure 7a), and the pond areas targeted built-up and mangrove areas. Again, during 2005–2010 (Figure 7d), the pond area gain was derived from croplands and mangroves, as the pond gain targeted both categories, with mangroves accounting for a larger transition than croplands. During 1995–2000 (Figure 7b) and 2000–2005 (Figure 7c), water bodies gained from ponds, as the water body gain targeted ponds. In the coastal area of Jakarta, the transition from ponds to water bodies was caused by decreasing pond production, and fish farmers did not maintain the ponds, causing the pond structure to be destroyed and seawater to sink into the ponds.
The transition to green areas was derived from croplands during 2005–2010 (Figure 7d) and 2010–2015 (Figure 7e). The transition to green areas from mangroves was larger in the 2005–2010 (Figure 7d) interval than in the 2010–2015 (Figure 7e) interval, as the green areas targeted mangroves. During the transition period of built-up areas, which encompassed almost the entire study period, the size of the transition was consistent; a large transition was identified during 2005–2010 (Figure 7d), from mangrove to pond areas and cropland to green areas, and during 2015–2020 (Figure 7f), as built-up targeted bare land.

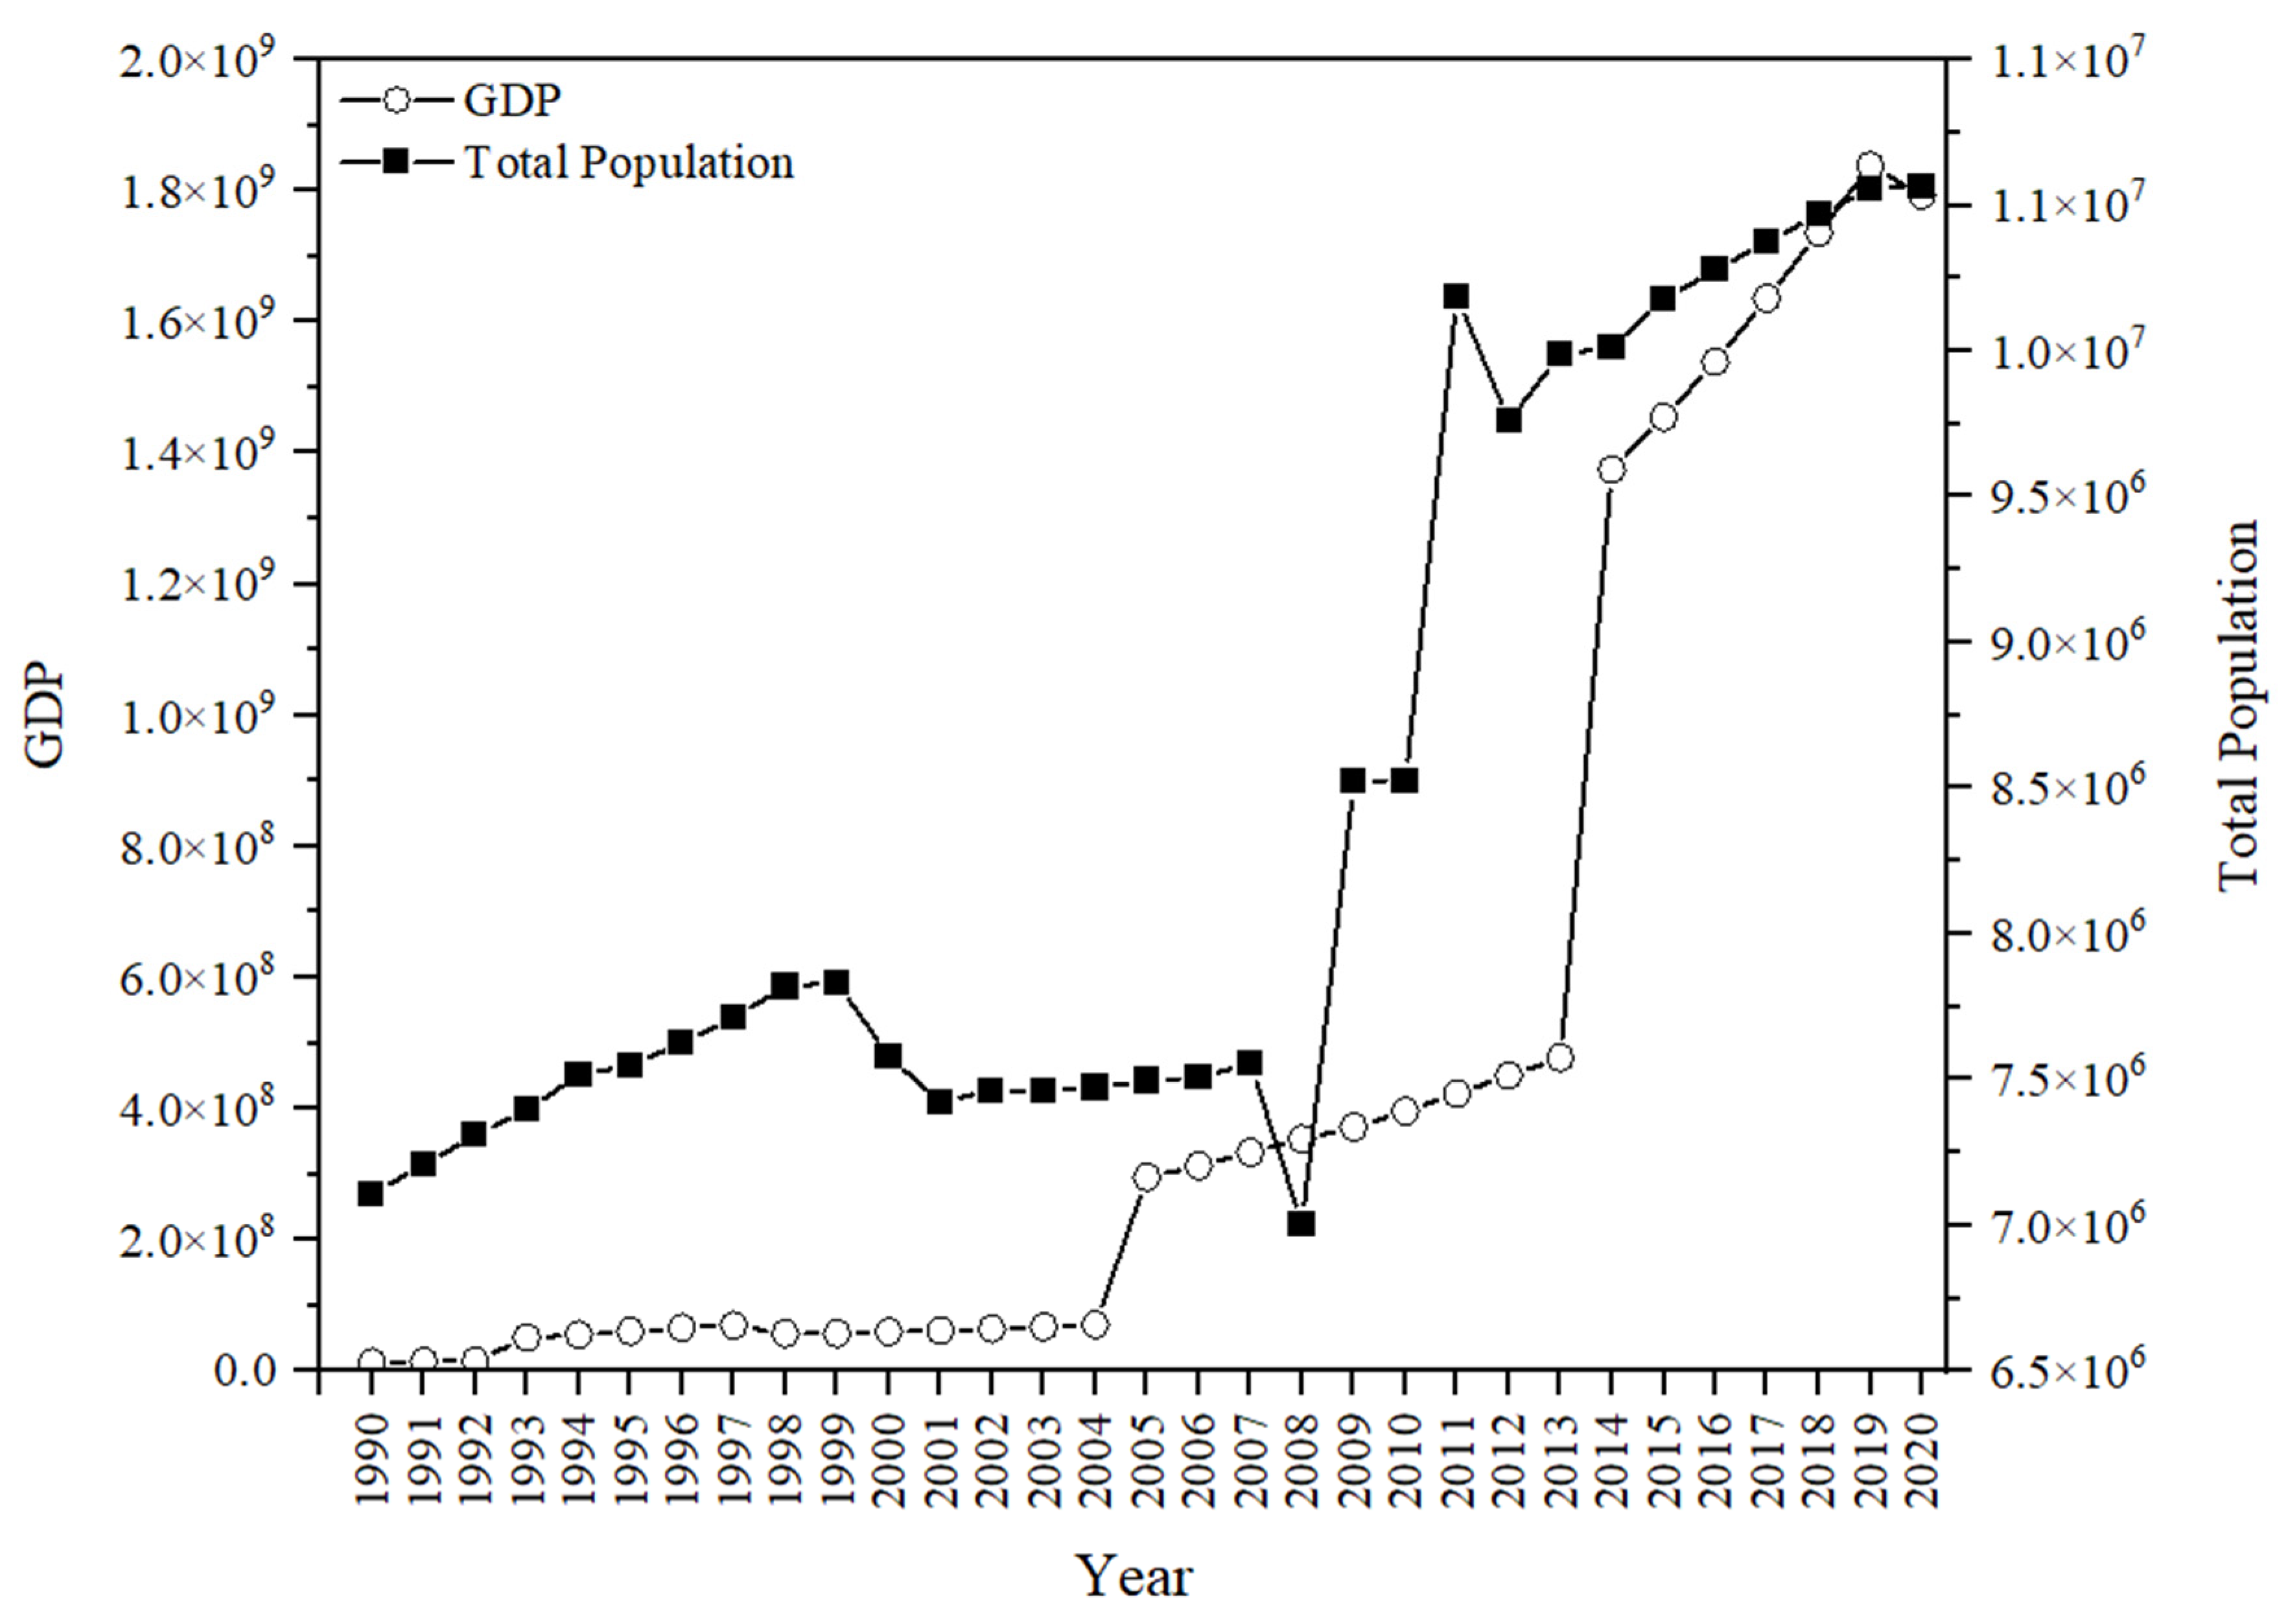
3.4. LULC Driving Forces

Jakarta experienced significant growth from 1990 to 2020 through the expansion of urban areas. The effect of urban expansion is the emergence of various built-up in Jakarta. The Indonesian Statistical Agency categorizes built-up land into roads, houses, offices, warehouses, and other roofed buildings [56]. The consequences of urban expansion in Jakarta were reductions in the amount of agricultural land, and other land use categories experienced fluctuations in land area development, which results in LULC changes. To disclose this enigmatic event, we assessed the LULC changes in Jakarta based on two driving forces; they are economic growth and rapid population expansion. The population of Jakarta in 1990 was 7,108,359 [57], which increased to 10,562,088 in 2020 [58]. Economic development in Jakarta additionally drives population growth. The GDP in 1990 was 13,664,719 × 106 [57], which increased to 1,792,794,590 × 106 in 2020 [58]. The regression test resulted in a t-value of 9.996 and an R2 value of 0.78. The correlation between GDP and population growth is as follows:
GDP = −3.103 × 10⁹ + 428.94 × total population
Regression calculations indicated a significant correlation between GDP and population. The R2 value indicates that this variable may account for 77% of the variation in the other variables. The results also indicate that an increase in GDP positively impacts population growth in Jakarta, and that LULC changes in Jakarta are driven by population growth in correlation with the economic sector, which is a significant factor. This finding aligns with that of Kuddus et al., who found that population growth leads to land use changes at a regional and global level, thereby posing a threat to the ecosystem balance, including access to clean water and food, and contributing to global warming [59]. Furthermore, Thacker et al. partly attributed the high rate of infrastructure and development investment, which exceeds USD 2 trillion annually, to the size of the population [60]. In this context, LULC in Jakarta has a strong connection with population growth, which is triggered by economic conditions.

4. Discussion

4.1. Transition of LULC Changes

Jakarta, the capital city of Indonesia, has experienced rapid LULC changes over the past three decades, along with various challenges related to rapid urbanization, large-scale infrastructure development, congestion, flooding, and socioeconomic issues. Rushayati et al. reported that approximately 49.7% of green open spaces in Jakarta were converted into other types of land use, particularly built-up land, in the 12 years from 2000 to 2012, resulting in increased surface temperature in almost all parts of the study area [61]. Zain conducted a spatial analysis of LULC changes in Jakarta [62] and showed that housing development was prevalent, particularly during the prosperous period of the property sector in the early 1990s. Moreover, Winarso indicated a 10% rise in land use for residential purposes in Jabodetabek between 1992 and 2001 [55]. However, many previous studies have not revealed the acceleration of LULC changes or measured the transition pattern and size of these changes. In this study, we applied intensity analysis to assess both the interval and transition changes related to LULC changes in Jakarta.
The results of the time interval analysis show that, from 1990 to 1995, overall LULC changes were faster than the uniform intensity. These changes were accelerated by the PELITA 5 policy in Indonesia, particularly in Jakarta. According to Winarso, the development of housing and offices rapidly increased during this period [55]. During 1995–2010, the annual changes were slower than the uniform intensity. This condition was attributed to two factors. The first is the economic crisis in Indonesia from 1997 to 1998, which significantly impacted Jakarta. Second, because of political conditions, the second president of Indonesia resigned. Aligned with the political situation, the five-year development plan was stopped. Significant development in Jakarta, especially the increase in built-up areas, was accelerated by economic and population growth during the study period. Since the early 1990s, the policy of development in the era of the second president of Indonesia has resulted in the centralized development of Java, especially in Jakarta. Several studies have yielded similar time interval results to those of our study. For example, Niya et al. found that land use change in Qeshm Island was accelerated by the economic and strategic poles of the region [20]. Huang et al. measured the severity of land use changes at three specific time intervals (1986–1996, 1996–2002, and 2002–2007) in the coastal watershed of southeast China [23] and found a clear relationship between the extent of land use alteration and the amount of development in the research region.
The intensity analysis at the transition level showed that the built-up category was an active gainer for all intervals except 1995–2000. This result is attributed to the expanding need for development and the influence of other land use categories. The built-up gain based on the transition pattern targeted bare land in the third, fifth, and sixth intervals. In the last time interval, the extent of the transition from bare land to built-up land was larger than that of the three other categories. These findings align with those of several other studies indicating that high demand in one category affects the reduction in other categories. For example, Niya et al. and Yang et al. identified that land use change resulted from a significant need for the development and conversion of land into built-up areas and concluded that the most prevalent changes in built-up land were predominantly attributed to economic and political reasons [20,63]. Huang et al. assessed changes in land use within coastal regions around urban districts that have undergone rapid expansion in China [27] and reported that increasing urbanization, built-up gains, and losses of other classes are interrelated.
The next major transition observed in this study involved the pond category, which expanded during 1990–1995 and 2005–2010. In the first interval, pond land was obtained from built-up areas and mangroves and targeted both classes. From 2005 to 2010, pond land was derived from croplands and mangroves and targeted both classes. Moreover, the size of the transition from mangroves to ponds was larger than that from croplands to ponds. Evidence of increasing pond land in coastal areas was also reported in the statistical annual report of Jakarta [64], which also indicated no growth in pond land along the coast of Jakarta from 2000 to 2005 [65]. However, land conversion into ponds, especially in coastal areas, has negative impacts on many aspects, such as ecosystem services and substrate availability, which are important for terrestrial ecosystems. Studies on land use transitions to ponds have been conducted in several regions. For example, Akber et al. assessed the development of ponds for shrimp farming in southwestern Bangladesh [66] and reported that pond land for shrimp farming occupied cropland areas in the 1980s, and the resulting decrease in cropland reduced the total value of ecosystem services. Moreover, Dong et al. reported that the conversion of natural coastal salt marshes to mariculture ponds in the Yellow Sea in Jiangsu Province, China, reduced substrate availability in the study area [67].
Transitions to bare land occurred in the third, fourth, and fifth intervals. The gain in bare land was derived from croplands and ponds in the third interval. In the fourth interval, bare land was derived from green areas. In the fifth interval, bare land was obtained from cropland. The increase in bare land mostly occurred in the coastal areas of Jakarta. Since 2005, the coastal area of Jakarta has been slated for reclamation area development, which has generated open land in preparation for the reclamation. The regulation of reclamation was mandated in presidential decree number 52 in 1995 by the second president of Indonesia. The government of the DKI Jakarta province also generated a local decree of reclamation number 8 in 1995. These reclamation processes that underwent conflicts of interest among stakeholders were executed from 2008 to 2015, when the reclamation was not finished.
Green area transitions were observed in the fourth and fifth intervals. In the fourth interval, green areas were obtained from cropland and bare land, and green areas were targeted for both classes. In the fifth interval, green area was derived only from croplands. The size of the transition from cropland to green areas was larger than that from bare land to green areas in both intervals. The policy of DKI Jakarta province to manage open spaces (including parks, gardens, and public spaces) was mandated by regulation number 26 in 2007, which regulates spatial planning in Indonesia. Green areas have a specific function in reducing the temperatures of urban heat islands and providing oxygen in populated areas. Several studies have been conducted on green area availability in urban areas with rapid population growth and construction. Najah et al. highlighted the importance of restoring the role of green urban islands in urban heat islands in Baghdad [68], because converting green spaces into buildings and streets has a negative effect on the microclimate of urban areas, the environment, urban engineering, and the city as a whole. Additionally, Namwinbown et al. assessed the pattern of green space and fragmentation in a rapidly expanding city of northern Ghana, West Africa [69] and concluded that local legislation must be enforced to encourage greenspace development and ensure the sustainability of urban ecosystems for the well-being of humans and the environment.
Croplands were the most frequently converted class. Croplands were converted into mangroves and water bodies during the first interval. Cropland was then converted to bare land, ponds and green areas, bare land and green areas, and built-up areas during the subsequent intervals, respectively. Furthermore, croplands were targeted in the first, third, fourth, and fifth intervals. As for waterbodies, this category gain was derived from croplands and mangroves in the first interval and pond land in the second and third intervals. Finally, mangroves were derived from croplands in the first interval.

4.2. Driving Forces of LULC

Jakarta, also known as Sunda Kelapa, served as the port and commercial hub of the Pajajaran Kingdom in the fifth century [35]. A trading hub for European countries engaged in the Asian spice trade was subsequently established. In Sunda Kelapa, the Dutch Trading Company for Asia and India opened a trading office that renamed the region Batavia [70]. Over the past three decades, Jakarta experienced significant changes in both land use and environmental circumstances. Jakarta’s infrastructure and residential districts experienced tremendous expansion as a result of rapid economic and population growth [55]. Population growth and economic expansion have since become issues, particularly as green spaces are disappearing through construction project has less attention to consider the surrounding areas.
The population of Jakarta has consistently increased over the last 30 years in response to economic issues. The total population increased from 7.1 million in 1990 [57] to 10.5 million in 2020 [58] and is predicted to increase by a further 3.4 million in 30 years (Figure 8). The total area of Jakarta is 651.4 km2, excluding the Kepulauan Seribu Regency.
The expansion of an area is typically correlated with development. The process of developing and expanding regions involves converting land to provide the infrastructure and facilities required by the community to support life [71]. Development affects the quality of the environment; thus, both the positive and negative effects should be controlled. Deterioration in the quality of urban environments is associated with various environmental issues. To establish a positive and sustainable environment, governments should oversee advances in the development process, together with communities with direct stakes in the process that act as targets or objectives.
The low-lying location of Jakarta at the confluence of multiple rivers, including the Ciliwung, Cisadane, and Pesanggrahan rivers, along with flat terrain and poor natural drainage, has historically rendered the city vulnerable to flooding, particularly during periods of high tide and precipitation. Furthermore, the area’s natural ability to absorb and manage excess water has diminished owing to the increase in impermeable surfaces following rapid urbanization and the development of built-up areas [72]. Records of floods in Jakarta date back hundreds of years, to the time when the city was still known as Batavia during the colonial era. Despite the installation of several canals and drainage systems by the Dutch colonial authorities to control water flow, the city frequently floods, especially during the rainy season. This predicament continued throughout the post-independence period as the city’s population expansion made it more difficult to manage floods.
However, Jakarta’s economic expansion has drawn individuals to the city to find work. The establishment of numerous retail establishments, office buildings, and industrial zones illustrates the city’s economic expansion and attracts many foreign workers from outside Jakarta [52]. Tourists visiting Jakarta often experience poor traffic conditions. With a congestion level of 61%, Jakarta was ranked as the fourth most congested city in the world in 2017 according to the TomTom traffic index rating. The vast number of people moving to Jakarta has led to a strong demand for housing in conjunction with economic expansion. Thus, land use functions have changed as a result of rapid growth, particularly the conversion of open spaces into built-up land.
Based on the annual statistical report of Jakarta, the total GDP has increased gradually in the last 30 years (Figure 8). From 1990 to 2004, the GDP increased smoothly and then more rapidly during 2004–2005 and 2013–2014. This increasing trend was caused by investment in almost all sectors (logistics communication, construction, trading, and service), except for mining and oil [73].
In this study, population and GDP growth were statistically tested using linear regression analysis. The calculation results show that population growth and GDP growth had a positive correlation, with an R2 value of 0.7751, a t-value of 8.938, and 28 degrees of freedom. Thus, the economic sector contributes significantly to Jakarta’s increasing population, which agrees with the results of many other studies in large cities worldwide. The rapid growth of cities is triggered by economic conditions and has greatly accelerated the transformation of land use patterns on a worldwide scale, leading to significant impacts on the natural environment and the sustainable development of land use systems in different regions [74,75,76,77,78]. Chen et al. emphasized that urban areas have experienced a two-fold increase in both quantity and size, surpassing the rate of population growth over a span of three decades [79]. Moreover, growth has led to substantial changes in land use patterns and placed tremendous strain on diminishing natural resources [80,81].
Mandatory government regulations (Number 23, 1986) mandate the construction of industrial sectors in the coastal areas of Jakarta [82]. According to this legislation, PT Bonded warehouses in Indonesia and PT. Sasana Bhanda, two State-Owned Enterprises (BUMN), will unite with Persero to form a new firm. Land conversion has occurred since 1990 because of government laws pertaining to industrial regions along the coast of Jakarta, with the construction of several offices, warehouses, and other industry-related support buildings. The function of coastal areas has been altered by this situation, mostly in coastal villages home to farmers and fishermen. Generally, the functions of coastal areas change when open land is transformed into built-up land.
Finally, it should be noted that Jakarta’s rapid population and economic growth have caused a variety of impacts, including flooding, congestion, and changes in land use around the city, particularly along its coast. Similarly, Maheng found that urbanization is changing landscape patterns and triggering environmental degradation in Jakarta [83]. Therefore, future urban development models must consider comprehensive and sustainable spatial management, both in Jakarta and other large cities worldwide.

4.3. Limitations of the Study and Future Insights

The study utilized Landsat 5, 7, and 8 images with a 30 × 30 m resolution to identify trends in land use change in Jakarta. Land changes were detected based on seven categories: agricultural, bare land, pond, built-up, mangrove, green space, and waterbody. The research selected Landsat imagery as the data source due to its cost-free availability and capability to identify recurring land alterations. Identifying land change events on the earth’s surface may yield nonspecific findings, such as identifying green areas, mangroves, water bodies, and ponds. This study’s results should be further validated due to the limitations of the methodologies employed. This research may not accurately reflect the factual land changes observed in the field due to discrepancies in scale, interpretation, and quality of the Landsat pictures used.
For future research, it is advised to utilize higher-resolution satellite imagery for identifying recurring patterns of land use change. Increasing the image resolution allows for an improved identification of green areas, mangroves, bare land, ponds, and water bodies in Jakarta. Further research variables can be introduced in Jakarta to detect alterations in urban land use, such as the identification of built-up (houses, offices, and warehouses), public spaces, protected spaces (park, city forest), and other public locations that signify shifts in city land use in Jakarta. To confirm the findings of additional studies, statistical data from the statistical agency of Jakarta can be used to conduct field validations (each category) and compare the results with the results of each land use category to ensure that the research findings may serve as a blueprint for sustainable urban area in Jakarta.

5. Conclusions

GISs, remote sensing, and intensity analysis were coupled in this study to examine changes in land use and land cover in the capital city of Jakarta, the most populated province in Indonesia. This study demonstrates that the intensity analysis method can effectively convey significant information regarding LULC changes, as observed in the most densely inhabited province in Indonesia.
This study reveals that total LULC change accelerated from 1990–1995 and then increased at a slower rate from 1995 to 2010. Annual changes were uniformly distributed between 2010–2015 and 2015–2020. Population and economic growth were the main drivers of LULC change, primarily due to the demand for built-up land.
Our study introduces a new method for assessing land use changes, highlighting the need for sustainable urban planning strategies in densely populated areas. Economic development has led to population growth, necessitating new land uses like housing, offices, and warehousing. This has altered land use purposes, including crops, green spaces, and undeveloped land. Moreover, this research investigates land use changes in densely populated urban areas, focusing on the pace of change and transition changes in each category. This is crucial for spatial and regional planning in these areas. This study is among the leading ones in identifying these rates due to economic and population expansion. The authors suggest enhancing research methodologies with high-resolution satellite imagery and verified field data for improved accuracy. For future studies, it is important to utilize higher-resolution satellite imagery combined with data field, legalized by stakeholders, to assess the land use–land cover change phenomenon to prepare scenarios for sustainable urban planning.

Supplementary Materials

The following supporting information can be downloaded at https://www.mdpi.com/article/10.3390/land13040545/s1: Table S1: Mathematical notation; Text S1: Equations for linear regression analysis; Text S2: Calculation methods for transition pattern analysis.

Author Contributions

Conceived and designed the project, F.R. and J.H.; wrote the original draft and executed analyses, F.R. and J.H.; wrote the paper and provided guidance during the writing of the manuscript, X.X. and M.A.M. All authors have read and agreed to the published version of the manuscript.

Funding

This research was supported by the Sustainable Coastal Development (SCD) Scholarship and Fujian Institute for Sustainable Ocean (FISO).

Data Availability Statement

The original contributions presented in the study are included in the article/Supplementary Material, further inquiries can be directed to the corresponding authors.

Acknowledgments

This research work is an output of a doctoral study undertaken at the College of the Environment and Ecology, Xiamen University. The first author thanks the Coastal and Ocean Management Institute (COMI) for providing the opportunity to study their Ph.D. with the Sustainable Coastal Development Scholarship. The authors would like to thank the Fujian Institute for Sustainable Ocean (FISO) for the publication funding. Also, the authors would like to thank the US Geological Survey (USGS) for providing time series Landsat images for use in this research. Finally, the authors are very thankful to OM ADELLA, especially Difarina Indra, for their support during authors writing the manuscript.

Conflicts of Interest

The authors declare no conflicts of interest. The funding sponsors had no role in the design of the study; in the collection, analyses, or interpretation of data; in the writing of the manuscript; or in the decision to publish the results.

References

  1. Aldwaik, S.Z.; Pontius, R.G., Jr. Intensity analysis to unify measurements of size and stationarity of land changes by interval, category, and transition. Landsc. Urban.Plan. 2012, 106, 103–114. [Google Scholar] [CrossRef]
  2. Turner, B.L., II; Meyer, W.B. Changes in land use and land cover: A global perspective. In Global Land-Use and Land-Cover Change: An Overview; Turner, B.L., Meyer, W.B., Eds.; Cambridge University Press: Cambridge, UK, 1994; pp. 3–12. [Google Scholar]
  3. Devkota, P.; Dhakal, S.; Shrestha, S.; Shrestha, U.B. Land use land cover changes in the major cities of Nepal from 1990 to 2020. Environmental and Sustainability Indicators. Environ. Sustain. Indic. 2023, 17, 100227. [Google Scholar]
  4. Sun, L.; Chen, J.; Li, Q.; Huang, D. Dramatic uneven urbanization of large cities throughout the world in recent decades. Nat. Commun. 2020, 11, 5366. [Google Scholar] [CrossRef] [PubMed]
  5. Clerici, N.; Cote-Navarro, F.; Escobedo, F.J.; Rubiano, K.; Villegas, J.C. Spatio-temporal and cumulative effects of land use-land cover and climate change on two ecosystem services in the Colombian Andes. Sci. Total Environ. 2019, 685, 1181–1192. [Google Scholar] [CrossRef] [PubMed]
  6. Dupras, J.; Marull, J.; Parcerisas, L.; Coll, F.; Gonzalez, A.; Girard, M.; Tello, E. The impacts of urban sprawl on ecological connectivity in the Montreal Metropolitan Region. Environ. Sci. Policy 2016, 58, 61–73. [Google Scholar] [CrossRef]
  7. Zhang, Y.; Liu, Y.; Zhang, Y.; Liu, Y.; Zhang, G.; Chen, Y. On the spatial relationship between ecosystem services and urbanization: A case study in Wuhan, China. Sci. Total Environ. 2018, 637–638, 780–790. [Google Scholar] [CrossRef] [PubMed]
  8. Macleod, R.D.; Congalton, R.G. A quantitative comparison of change—Detection algorithms for monitoring eelgrass from remotely sensed data. Photogramm. Eng. Remote Sens. 1998, 64, 207–216. [Google Scholar]
  9. Nagendra, H.; Munroe, D.K.; Southworth, J. From pattern to process: Land—Scape fragmentation and the analysis of land use/land cover change. Agric. Ecosyst. Environ. Plan. 2004, 101, 111–115. [Google Scholar] [CrossRef]
  10. Pontius, R.G., Jr.; Shusas, E.; McEachern, M. Detecting important categorical land changes while accounting for persistence. Agric. Ecosyst. Environ. 2004, 101, 251–268. [Google Scholar] [CrossRef]
  11. Serneels, S.; Lambin, E.F. Proximate causes of land-use change in Narok District, Kenya: A spatial statistical model. Agric. Ecosyst. Environ. 2001, 85, 65–81. [Google Scholar] [CrossRef]
  12. Shoyama, K.; Braimoh, A.K. Analyzing about sixty years of land-cover change and associated landscape fragmentation in Shiretoko Peninsula, Northern Japan. Landsc. Urban Plan. 2011, 101, 22–29. [Google Scholar] [CrossRef]
  13. Xu, Q.; Dong, Y.-X.; Yang, R. Influence of land urbanization on carbon sequestration of urban vegetation: A temporal cooperativity analysis in Guangzhou as an example. Sci. Total Environ. 2018, 635, 26–34. [Google Scholar] [CrossRef] [PubMed]
  14. Ye, Y.; Bryan, B.A.; Zhang, J.; Connor, J.D.; Chen, L.; Qin, Z.; He, M. Changes in land-use and ecosystem services in the Guangzhou-Foshan Metropolitan Area, China from 1990 to 2010: Implications for sustainability under rapid urbanization. Ecol. Indic. 2018, 93, 930–941. [Google Scholar] [CrossRef]
  15. Kontgis, C.; Schneider, A.; Fox, J.; Saksena, S.; Spencer, J.H.; Castrence, M. Monitoring peri-urbanization in the greater Ho Chi Minh City metropolitan area. Appl. Geogr. 2014, 53, 377–388. [Google Scholar] [CrossRef]
  16. Xu, G.; Jiao, L.; Liu, J.; Shi, Z.; Zeng, C.; Liu, Y. Understanding urban expansion combining macro patterns and micro dynamics in three Southeast Asian megacities. Sci. Total Environ. 2019, 660, 375–383. [Google Scholar] [CrossRef] [PubMed]
  17. Huang, S.; Tang, L.; Hupy, J.P.; Wang, Y.; Shao, G. A commentary review on the use of normalized difference vegetation index (NDVI) in the era of popular remote sensing. J. For. Res. 2021, 32, 2719. [Google Scholar] [CrossRef]
  18. Lambin, E.F.; Geist, H.J.; Lepers, E. Dynamics of land-use and land-cover change in tropical regions. Annu. Rev. Environ. Resour. 2003, 28, 205–241. [Google Scholar] [CrossRef]
  19. Liping, C.; Yujun, S.; Saeed, S. Monitoring and predicting land use and land cover changes using remote sensing and GIS techniques—A case study of a hilly area, Jiangle, China. PLoS ONE 2018, 13, e0200493. [Google Scholar] [CrossRef]
  20. Niya, A.K.; Huang, J.; Karimi, H.; Keshtkar, H.; Naimi, B. Use of Intensity Analysis to Characterize Land Use/Cover Change in the Biggest Island of Persian Gulf, Qeshm Island, Iran. Sustainability 2019, 11, 4396. [Google Scholar] [CrossRef]
  21. Mwangi, H.M.; Lariu, P.; Julich, S.; Patil, S.D.; McDonald, M.A.; Feger, K.-H. Characterizing the Intensity and Dynamics of Land-Use Change in the Mara River Basin, East Africa. Forests 2018, 9, 8. [Google Scholar] [CrossRef]
  22. Quan, B.; Ren, H.; Pontius, R.G., Jr.; Liu, P. Quantifying spatiotemporal patterns concerning land change in Changsha, China. Landsc. Ecol. Eng. 2018, 14, 257–267. [Google Scholar] [CrossRef]
  23. Huang, J.; Pontius, R.G., Jr.; Li, Q.; Zhang, Y. Use of intensity analysis to link patterns with processes of land change from 1986 to 2007 in a coastal watershed of southeast China. Appl. Geogr. 2012, 34, 371–384. [Google Scholar] [CrossRef]
  24. Dembélé, F.; Guuroh, R.T.; Ansah, P.B.; Asare, D.-C.B.M.; Da, S.S.; Aryee, J.N.; Adu-Bredu, S. Land use land cover change and intensity analysis of land transformation in and around a moist semi-deciduous forest in Ghana. Trees For. People 2024, 15, 100507. [Google Scholar] [CrossRef]
  25. Adjei, V.; Antwi, M. Land use change detection using the intensity analysis at the Bosomtwe District, Ashanti Region, Ghana. Smart Agric. Technol. 2023, 5, 100290. [Google Scholar] [CrossRef]
  26. Deguenon, S.D.D.M.; Baguere, O.F.; Teka, O.; Aheto, D.W.; Sinsin, B. Using of intensity analysis approach in Benin coastal zone (West Africa) to assess land use/land cover change for further decision making. Heliyon 2022, 8, e12384. [Google Scholar] [CrossRef] [PubMed]
  27. Huang, B.; Huang, J.; Pontius, R.G., Jr.; Tu, Z. Comparison of Intensity Analysis and the land-use dynamicdegrees to measure land changes outside versus inside the coastal zone of Longhai, China. Ecol. Indic. 2018, 89, 336–347. [Google Scholar] [CrossRef]
  28. Wang, J.; Zhou, W.; Pickett, S.T.; Yu, W.; Li, W. A multiscale analysis of urbanization effects on ecosystem services supply in an urban megaregion. Sci. Total Environ. 2019, 662, 824–833. [Google Scholar] [CrossRef] [PubMed]
  29. Zhang, P.; Yang, D.; Qin, M.; Jing, W. Spatial heterogeneity analysis and driving forces exploring of built-up land development intensity in Chinese prefecture-level cities and implications for future Urban Land intensive use. Land Use Policy 2020, 99, 104958. [Google Scholar] [CrossRef]
  30. Azhdari, A.; Sasani, M.A.; Soltani, A. Exploring the relationship between spatial driving forces of urban expansion and socioeconomic segregation: The case of Shiraz. Habitat. Int. 2018, 81, 33–34. [Google Scholar] [CrossRef]
  31. Su, S.; Ma, X.; Xiao, R. Agricultural landscape pattern changes in response to urbanization at ecoregional scale. Ecol. Indic. 2014, 40, 10–18. [Google Scholar] [CrossRef]
  32. Remondi, F.; Burlando, P.; Vollmer, D. Exploring the hydrological impact of increasing urbanisation on a tropical river catchment of the metropolitan Jakarta, Indonesia. Sustain. Cities Soc. 2016, 20, 210–221. [Google Scholar] [CrossRef]
  33. Poerbandono, J.M.; Ward, P. Assessment of the effects of climate and land cover changes on river discharge and sediment yield, and an adaptive spatial planning in the Jakarta region. Nat. Hazards 2014, 73, 507–530. [Google Scholar] [CrossRef]
  34. Ward, P.; Pauw, W.; Van Buuren, M.; Marfai, M. Governance of flood risk management in a time of climate change: The cases of Jakarta and Rotterdam. Environ. Politics 2013, 22, 518–536. [Google Scholar] [CrossRef]
  35. Central Statistical Agency of Jakarta (BPS Jakarta 2023). 2023. Available online: https://jakarta.bps.go.id/publication/2023/02/28/fd35fcb5d10a1e03f0d71348/provinsi-dki-jakarta-dalam-angka-2023.html (accessed on 24 February 2024).
  36. Varga, O.G.; Pontius, R.G., Jr.; Singh, S.K.; Szabó, S. Intensity Analysis and the Figure of Merit’s components for assessment of a Cellular Automata—Markov simulation model. Ecol. Indic. 2019, 101, 933–942. [Google Scholar] [CrossRef]
  37. Xie, Z.; Pontius, R.G., Jr.; Huang, J.; Nitivattananon, V. Enhanced Intensity Analysis to Quantify Categorical Change and to Identify Suspicious Land Transitions: A Case Study of Nanchang, China. Remote Sens. 2020, 12, 3323. [Google Scholar] [CrossRef]
  38. Waleed, M.; Sajjad, M. On the emergence of geospatial cloud-based platforms for disaster risk management: A global scientometric review of google earth engine applications. Int. J. Disaster Risk Reduct. 2023, 97, 104056. [Google Scholar] [CrossRef]
  39. Zaki, A.; Buchori, I.; Pangi, P.; Sejati, A.W.; Liu, Y. Google Earth Engine for improved spatial planning in agricultural and forested lands: A method for projecting future ecological quality. Remote Sens. Appl. Soc. Environ. 2023, 32, 101078. [Google Scholar] [CrossRef]
  40. Aji, M.A.P.; Kamal, M.; Farda, N.M. Mangrove species mapping through phenological analysis using random forest algorithm on Google Earth Engine. Remote Sens. Appl. Soc. Environ. 2023, 30, 100978. [Google Scholar] [CrossRef]
  41. Pratama, M.R.; Riana, D. Land Cover Classification Using Google Earth Engine with Supervised Classification Method in Penajam Paser Utara Area. J. Jupit. 2022, 1, 637–650. [Google Scholar]
  42. Abdu, H.A. Classification accuracy and trend assessments of land cover- land use changes from principal components of land satellite images. Int. J. Remote Sens. 2019, 40, 1275–1300. [Google Scholar] [CrossRef]
  43. Chuai, X.; Huang, X.; Wu, C.; Li, J.; Lu, Q.; Qi, X.; Zhang, M.; Zuo, T.; Lu, J. Land Use and Ecosystems Services Value Changes and Ecological Land Management in Coastal Jiangsu, China. Habitat. Int. 2016, 57, 164–174. [Google Scholar] [CrossRef]
  44. Gashaw, T.; Tulu, T.; Argaw, M.; Worqlul, A.W.; Tolessa, T.; Kindu, M. Estimating the impacts of land use/land cover changes on Ecosystem Service Values: The case of the Andassa watershed in the Upper Blue Nile basin of Ethiopia. Ecosyst. Serv. 2018, 31 Pt A, 219–228. [Google Scholar] [CrossRef]
  45. Li, R.-Q.; Dong, M.; Cui, J.-Y.; Zhang, L.-L.; Cui, Q.-G.; He, W.-M. Quantification of the Impact of Land-Use Changes on Ecosystem Services: A Case Study in Pingbian County, China. Env. Monit. Assess. 2007, 128, 503–510. [Google Scholar] [CrossRef] [PubMed]
  46. Mamat, A.; Halik, Ü.; Rouzi, A. Variations of Ecosystem Service Value in Response to Land-Use Change in the Kashgar Region, Northwest China. Sustainability 2018, 10, 200. [Google Scholar] [CrossRef]
  47. Temesgen, H.; Wei, W.; Legesse, A.; Yirsaw, E.; Bekele, B. Landscape based upstream-downstream prevalence of land use/cover change drivers in southeastern rift escarpment of Ethiopia. Environ. Monit. Assess. 2018, 190, 166. [Google Scholar] [CrossRef] [PubMed]
  48. Tolessa, T.; Senbeta, F.; Kidane, M. The impact of land use/land cover change on ecosystem services in the central highlands of Ethiopia. Ecosyst. Serv. 2017, 23, 47–54. [Google Scholar] [CrossRef]
  49. Tømmervik, H.; Høgda, K.A.; Solheim, I. Monitoring vegetation changes in Pasvik (Norway) and Pechenga in Kola Peninsula (Russia) using multitemporal Landsat MSS/TM data. Remote Sens. Environ. 2003, 85, 370–388. [Google Scholar] [CrossRef]
  50. Aldwaik, S.Z.; Pontius, R.G., Jr. Map errors that could account for deviations from a uniform intensity of land change. Int. J. Geogr. Inf. Sci. 2013, 27, 1717–1739. [Google Scholar] [CrossRef]
  51. Enaruvbe, G.O.; Pontius, R.G., Jr. Influence of classification errors on Intensity Analysis of land changes in southern Nigeria. Int. J. Remote Sens. 2015, 36, 244–261. [Google Scholar] [CrossRef]
  52. Liu, Y.; Yang, M.; Cui, J. Urbanization, economic agglomeration and economic growth. Heliyon 2024, 10, e23772. [Google Scholar] [CrossRef]
  53. Zhang, X.Q. The trends, promises and challenges of urbanisation in the world. Habitat. Int. 2016, 54, 241–252. [Google Scholar] [CrossRef]
  54. Li, T.; Wu, X.; He, Y.; Peng, X.; Yang, J.; Ding, R.; He, C. Small samples noise prediction of train electric traction system fan based on a multiple regression-fuzzy neural network. Eng. Appl. Artif. Intell. 2023, 126, 106781. [Google Scholar] [CrossRef]
  55. Winarso, H.; Firman, T. Residential Land Development in Jabodetabek, Indonesia: Trigeriing Economic Crisis? Habitat Int. 2002, 26, 487–506. [Google Scholar] [CrossRef]
  56. Central Statistical Agency of Jakarta (BPS Jakarta 2000). 2000. Available online: https://jakarta.bps.go.id/publication/2015/04/10/a7408e7e536279dd08a8dc11/jakarta-dalam-angka-2000.html (accessed on 12 January 2022).
  57. Central Statistical Agency of Jakarta (BPS Jakarta 1991). 1991. Available online: https://jakarta.bps.go.id/publication/1991/12/02/bf7f8e9d26123fa1bfe2a054/jakarta-dalam-angka-tahun-1991.html (accessed on 12 January 2022).
  58. Central Statistical Agency of Jakarta (BPS Jakarta 2021). 2021. Available online: https://jakarta.bps.go.id/publication/2021/02/26/bb7fa6dd5e90b534e3fa6984/provinsi-dki-jakarta-dalam-angka-2021.html (accessed on 13 January 2022).
  59. Kuddus, M.A.; Tynan, E.; McBryde, E. Urbanization: A problem for the rich and the poor? Public Health Rev. 2020, 41, 1. [Google Scholar] [CrossRef] [PubMed]
  60. Thacker, S.; Adshead, D.; Fay, M.; Hallegatte, S.; Harvey, M.; Meller, H.; O’Regan, N.; Rozenberg, J.; Watkins, G.; Hall, J.W. Infrastructure for sustainable development. Nat. Sustain. 2019, 2, 324–331. [Google Scholar] [CrossRef]
  61. Rushayati, S.B.; Prasetyo, L.B.; Puspaningsih, N.; Rachmawati, E. Adaptation strategy toward urban heat island at tropical urban area. Procedia Environ. Sci. 2016, 33, 221–229. [Google Scholar] [CrossRef]
  62. Zain, A.M. Distribution, Structure and Function of Urban Green Space in Southeast Asian Mega-Cities with Special Reference to Jakarta Metropolitan Region (Jabotabek). Ph.D. Thesis, Department of Agricultural and Environmental Biology, Graduate School of Agricultural and Life Sciences, The University of Tokyo, Tokyo, Japan, 2002. [Google Scholar]
  63. Yang, Y.; Liu, Y.; Xu, D. Use of intensity analysis to measure land use changes from 1932 to 2005 in Zhenlai County, Northeast China. Chin. Geogr. Sci. 2017, 27, 441–455. [Google Scholar] [CrossRef]
  64. Central Statistical Agency of Jakarta (BPS Jakarta 2011). 2011. Available online: https://jakarta.bps.go.id/publication/2012/01/25/2bc157eb132ba603e8fb36ed/jakarta-dalam-angka-2011.html (accessed on 12 January 2022).
  65. Central Statistical Agency of Jakarta (BPS Jakarta 2006). 2006. Available online: https://jakarta.bps.go.id/publication/2009/01/01/786d3ba6b8fda9e83af2f4af/jakarta-dalam-angka-2006.html (accessed on 12 January 2022).
  66. Akber, M.A.; Khan, M.W.R.; Islam, M.A.; Rahman, M.M.; Rahman, M.R. Impact of Land Use Change on Ecosystem Services of Southwest Coastal Bangladesh. J. Land Use Sci. 2018, 13, 238–250. [Google Scholar] [CrossRef]
  67. Dong, Y.; Yuan, J.; Li, J.; Liu, D.; Qiu, Y.; Zhang, X.; Xiang, J.; Ding, W. Conversion of natural coastal wetlands to mariculture ponds dramatically decreased methane production by reducing substrate availability. Agric. Ecosyst. Environ. 2023, 356, 108646. [Google Scholar] [CrossRef]
  68. Najah, F.T.; Abdullah, S.F.K.; Abdulkareem, T.A. Urban Land Use Changes: Effect of Green Urban Spaces Transformation on Urban Heat Islands in Baghdad. Alex. Eng. J. 2022, 66, 555–571. [Google Scholar] [CrossRef]
  69. Namwinbown, T.; Imoro, Z.A.; Weobong, C.A.-A.; Tom-Dery, D.; Baatuuwie, B.N.; Aikins, T.K.; Poreku, G.; Lawer, E.A. Patterns of green space change and fragmentation in a rapidly expanding city of northern Ghana, West Africa. City Environ. Interact. 2024, 21, 100136. [Google Scholar] [CrossRef]
  70. Rizal, A.; Haykal, F. Land use changes analysis in Jakarta Bay coastal area between 1998, 2008 and 2018. J. Segara 2021, 17, 135–144. [Google Scholar] [CrossRef]
  71. Munsi, M.; Malaviya, S.; Oinam, G.; Joshi, P.K. A landscape approach for quantifying land-use and land-cover change (1976–2006) in middle Himalaya. Reg. Environ. Chang. 2009, 10, 145–155. [Google Scholar] [CrossRef]
  72. Patra, S.; Sahoo, S.; Mishra, P.; Mahapatra, S.C. Impacts of urbanization on land use/cover changes and its probable implications on local climate and groundwater level. J. Urban Manag. 2018, 7, 70–84. [Google Scholar] [CrossRef]
  73. Central Statistical Agency of Jakarta (BPS Jakarta 2014). 2014. Available online: https://jakarta.bps.go.id/publication/2014/10/21/bb081af3fabf3f5432c74056/jakarta-dalam-angka-2014.html (accessed on 14 January 2022).
  74. Fu, Y.; Zhou, T.; Yao, Y.; Qiu, A.; Wei, F.; Liu, J.; Liu, T. Evaluating efficiency and order of urban land use structure: An empirical study of cities in Jiangsu, China. J. Clean. Prod. 2021, 283, 124638. [Google Scholar] [CrossRef]
  75. Foley, J.A.; DeFries, R.; Asner, G.P.; Barford, C.; Bonan, G.; Carpenter, S.R.; Chapin, F.S.; Coe, M.T.; Daily, G.C.; Gibbs, H.K.; et al. Global consequences of land use. Science 2005, 309, 570–574. [Google Scholar] [CrossRef]
  76. Liu, X.P.; Huang, Y.H.; Xu, X.C.; Li, X.C.; Li, X.; Ciasi, P.; Gong, K.; Ziegler, A.D.; Chen, A.P.; Gong, P.; et al. High-spatiotemporal-resolution mapping of global urban change from 1985 to 2015. Nat. Sustain. 2020, 3, 564–570. [Google Scholar] [CrossRef]
  77. Malek, Ž.; Verburg, P.H. Mapping global patterns of land use decision-making. Glob. Environ. Chang. 2020, 65, 102170. [Google Scholar] [CrossRef]
  78. Chen, Z.; Zhou, Y.; Haynes, K.E. Change in Land Use Structure in Urban China: Does the Development of High-Speed Rail Make a Difference. Land Use Policy 2020, 111, 104962. [Google Scholar] [CrossRef]
  79. Chen, Z.; Zhou, Y.; Haynes, K.E. Change in land-use structure due to urbanisation in China. J. Clean. Prod. 2021, 321, 128986. [Google Scholar] [CrossRef]
  80. Seto, K.C.; Parnell, S.; Elmqvist, T. A global outlook on urbanization. In Urbanization, Biodiversity and Ecosystem Services: Challenges and Opportunities; Springer: Berlin/Heidelberg, Germany, 2013; pp. 1–12. [Google Scholar] [CrossRef]
  81. Yu, J.; Li, X.; Guan, X.; Shen, H. A remote sensing assessment index for urban ecological livability and its application. Geo-Spat. Inf. Sci. 2024, 27, 289–310. [Google Scholar] [CrossRef]
  82. Government Regulation Number 23, 1986 (PP 23 1986). Available online: https://peraturan.bpk.go.id/Details/71108/pp-no-23-tahun-1986 (accessed on 14 January 2022).
  83. Maheng, D.; Pathirana, A.; Zevenbergen, C. A Preliminary Study on the Impact of Landscape Pattern Changes Due to Urbanization: Case Study of Jakarta, Indonesia. Land 2021, 10, 218. [Google Scholar] [CrossRef]
Figure 1. Maps showing the study area of Jakarta Special Province, Indonesia.
Land 13 00545 g001
Figure 2. Overall process of the study.
Land 13 00545 g002
Figure 3. Thorough procedure of land use classification in this study.
Land 13 00545 g003
Figure 4. Structure of the transition pattern used in this study [30].
Land 13 00545 g004
Figure 5. Maps of (a) LULC categories, (b) losses, and (c) gains in Jakarta over different time intervals.
Land 13 00545 g005
Figure 6. Rates of LULC changes in different interval levels and annual changes in the study area.
Land 13 00545 g006
Figure 7. (a). Transition pattern of year 1990–1995; (b). Transition pattern of year 1995–2000; (c). Transition pattern of year 2000–2005; (d). Transition pattern of year 2005–2010; (e). Transition pattern of year 2010–2015; (f). Transition pattern of year 2015–2020. Transition pattern for six time interval of LULC changes in Jakarta from 1990 to 2020. Readers should look at the gradient color to have an understanding of the deviation between transition intensity with the transition intensity uniform column, where the red is targeting, and blue is avoiding.
Land 13 00545 g007
Figure 8. Gross domestic product and population growth of Jakarta during 1990–2020 [58].
Land 13 00545 g008
Table 1. List of Landsat imagery used in this study.
NoSatelliteSensorsPath/RowDate
1Landsat 5Thematic Mapper (TM)122/06411 September 1990
2Landsat 5Thematic Mapper (TM)122/06424 August 1995
3Landsat 5Thematic Mapper (TM)122/0648 October 2000
4Landsat 7Enhanced Thematic Mapper Plus (ETM+)122/06410 July 2005
5Landsat 7Enhanced Thematic Mapper Plus (ETM+)122/06422 June 2010
6Landsat 8Operational Land Imager (OLI)122/06431 August 2015
7Landsat 8Operational Land Imager (OLI)122/06415 October 2020
Table 2. List of LULC categories and descriptions.
NoCategoryDescription
1Bare landUnutilized land, such as desolate areas, uncultivated grasslands, marshes, sandy terrain, and unproductive land.
2Built-upResidential area, involving urban and rural areas, industry, all types of roads, airports, surrounding enterprise areas, and typically artificial environments.
3CroplandLand for agriculture gardens and arable land for cultivating various agricultural crops.
4Green areaGreen spaces or other open spaces on the island not used as agriculture areas.
5MangroveMangroves, both natural and artificial.
6WaterbodyRiver, lakes, and inland lakes and rivers.
7PondAreas for fish/shrimp farming, located in coastal areas.
Table 3. Overall accuracy and kappa coefficient of the classification results.
NoYearError CountSample CountOverall AccuracyK-Standard
11990117084.2981.67
2199517098.5798.33
3200037095.7294.72
4200547094.2993.33
5201057092.8591.67
6201557092.8591.67
7202097087.1485.00
Disclaimer/Publisher’s Note: The statements, opinions and data contained in all publications are solely those of the individual author(s) and contributor(s) and not of MDPI and/or the editor(s). MDPI and/or the editor(s) disclaim responsibility for any injury to people or property resulting from any ideas, methods, instructions or products referred to in the content.

