

Spatiotemporal Analysis of Soil Quality Degradation and Emissions in the State of Iowa (USA)

 ,
,  , , , and
Abstract
:1. Introduction
- -
- Physical: bulk density; soil texture and structure; aggregate stability; porosity; plant available water; hydraulic conductivity and infiltration;
- -
- Chemical: organic and total carbon (C); organic and total nitrogen (N); available nutrients (phosphorous, P; potassium, K); soil reaction (pH); electrical conductivity; cation exchange capacity (CEC); carbonates;
- -
- Biological: microbial biomass; microbial respiration; microbial community composition; enzymatic activity; earthworms; nematodes.


| Ecoregion | Soil Order | Potential Natural Vegetation | Land Use/Land Cover |
|---|---|---|---|
| Loess Flats and Till Plains (40a) | Mollisols | Oak-hickory forest, mosaic of bluestem prairie | Cropland, pasture, deciduous forest |
| Loess Prairies (47a) | Mollisols | Bluestem prairie | Cropland |
| Des Moines Lobe (47b) | Mollisols | Bluestem prairie | Cropland |
| Eastern Iowa and Minnesota Drift Plains (47c) | Mollisols | Bluestem prairie, oak-hickory forest | Cropland |
| Missouri Alluvial Plain (47d) | Mollisols | Oak-hickory forest, northern floodplain forest | Cropland |
| Steeply Rolling Loess Prairies (47e) | Mollisols | Bluestem prairie, oak-hickory forest | Cropland |
| Rolling Loess Prairies (47f) | Mollisols, Alfisols | Oak-hickory forest, mosaic of bluestem prairie | Cropland, small areas of deciduous forest |
| Western Loess Hills (47m) | Mollisols | Oak-hickory forest, bluestem prairie | Cropland |
| Blufflands and Coules (52b) | Alfisols | Maple-basswood forest | Cropland, pasture, deciduous forest |
| Rochester/Paleozoic Plateau Upland (52c) | Alfisols | Maple-basswood forest | Cropland, pasture, deciduous forest |
| Upper Mississippi Alluvial Plain (72d) | Alfisols, Mollisols | Oak-hickory forest | Cropland, deciduous forest, forested wetlands |
2. Materials and Methods
3. Results
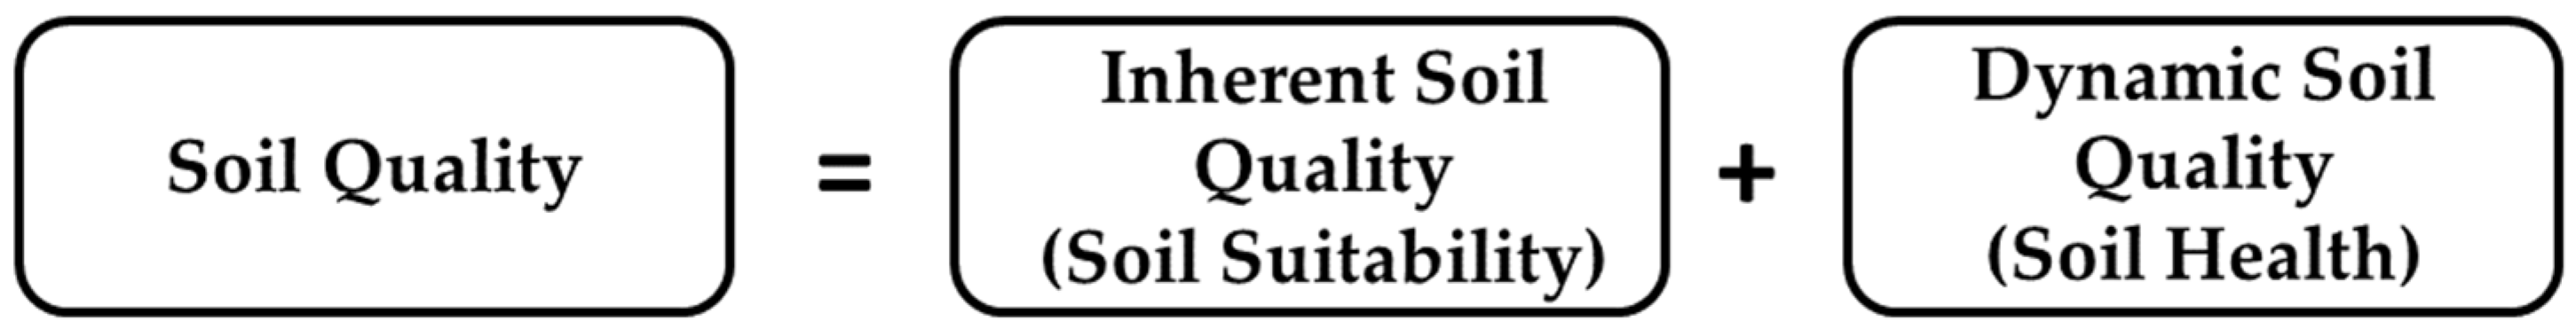
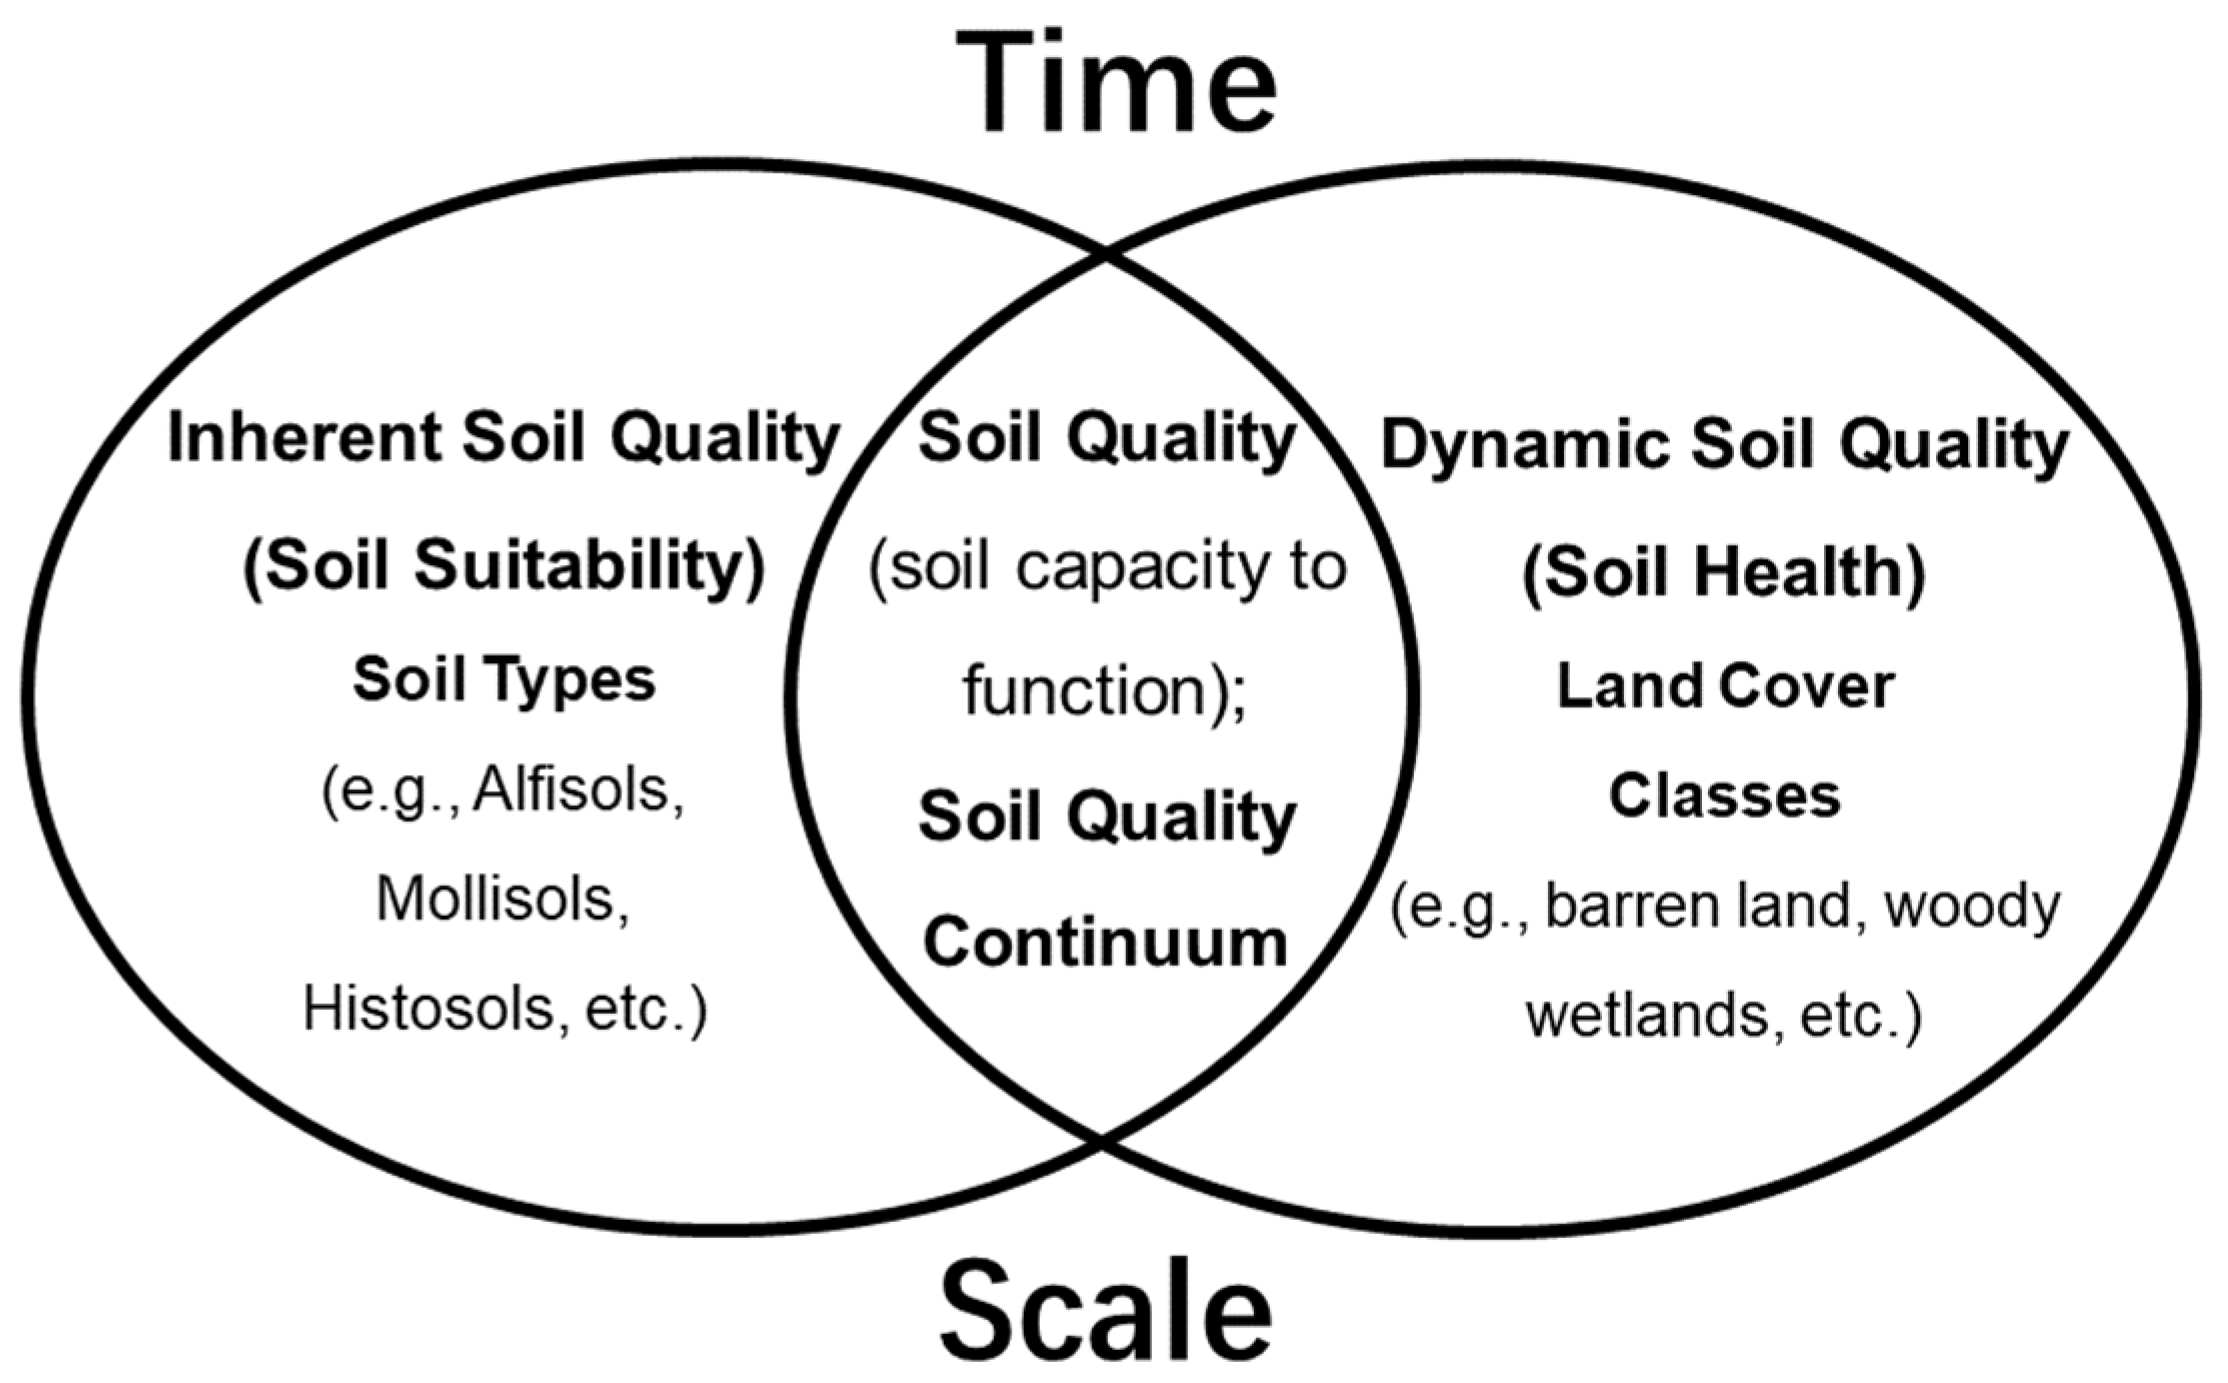
3.1. Inherent Soil Quality (Soil Suitability) and Soil Carbon Storage in Iowa
3.2. Dynamic Soil Quality (Soil Health) and Soil Quality Continuum in Iowa

| Soil Quality Continuum | ||||||||
|---|---|---|---|---|---|---|---|---|
| NLCD Land Cover Classes (LULC), Dynamic Soil Quality (Soil Health Continuum) | 2016 Total Area by LULC (km2, %) | Inherent Soil Quality (Soil Suitability) | ||||||
| Lower |  | Higher | ||||||
| Degree of Weathering and Soil Development | ||||||||
| Slight | Moderate | |||||||
| Entisols | Inceptisols | Histosols | Alfisols | Mollisols | Vertisols | |||
| 2016 Area by Soil Order (km2) | ||||||||
| Woody wetlands | Higher | 1737.9 (1.2) | 574.1 | 12.0 | 4.9 | 50.0 | 1096.6 | 0.3 |
| Shrub/Scrub |  | 71.3 (0.05) | 6.8 | 3.9 | 0.0 | 40.9 | 19.8 | 0.0 |
| Mixed forest | 1577.4 (1.1) | 171.8 | 96.2 | 0.3 | 884.5 | 424.6 | 0.0 | |
| Deciduous forest | 8967.9 (6.3) | 895.6 | 343.7 | 0.9 | 5220.1 | 2507.5 | 0.0 | |
| Herbaceous | 2670.8 (1.9) | 394.1 | 286.6 | 3.6 | 704.0 | 1278.6 | 3.8 | |
| Evergreen forest | 145.9 (0.1) | 19.8 | 16.3 | 0.0 | 71.1 | 38.7 | 0.0 | |
| Emergent herbaceous wetlands | 1057.0 (0.7) | 219.3 | 5.5 | 50.7 | 24.8 | 754.6 | 2.1 | |
| Hay/Pasture | 17,371.4 (12.2) | 972.1 | 985.9 | 10.5 | 8838.6 | 6561.8 | 2.6 | |
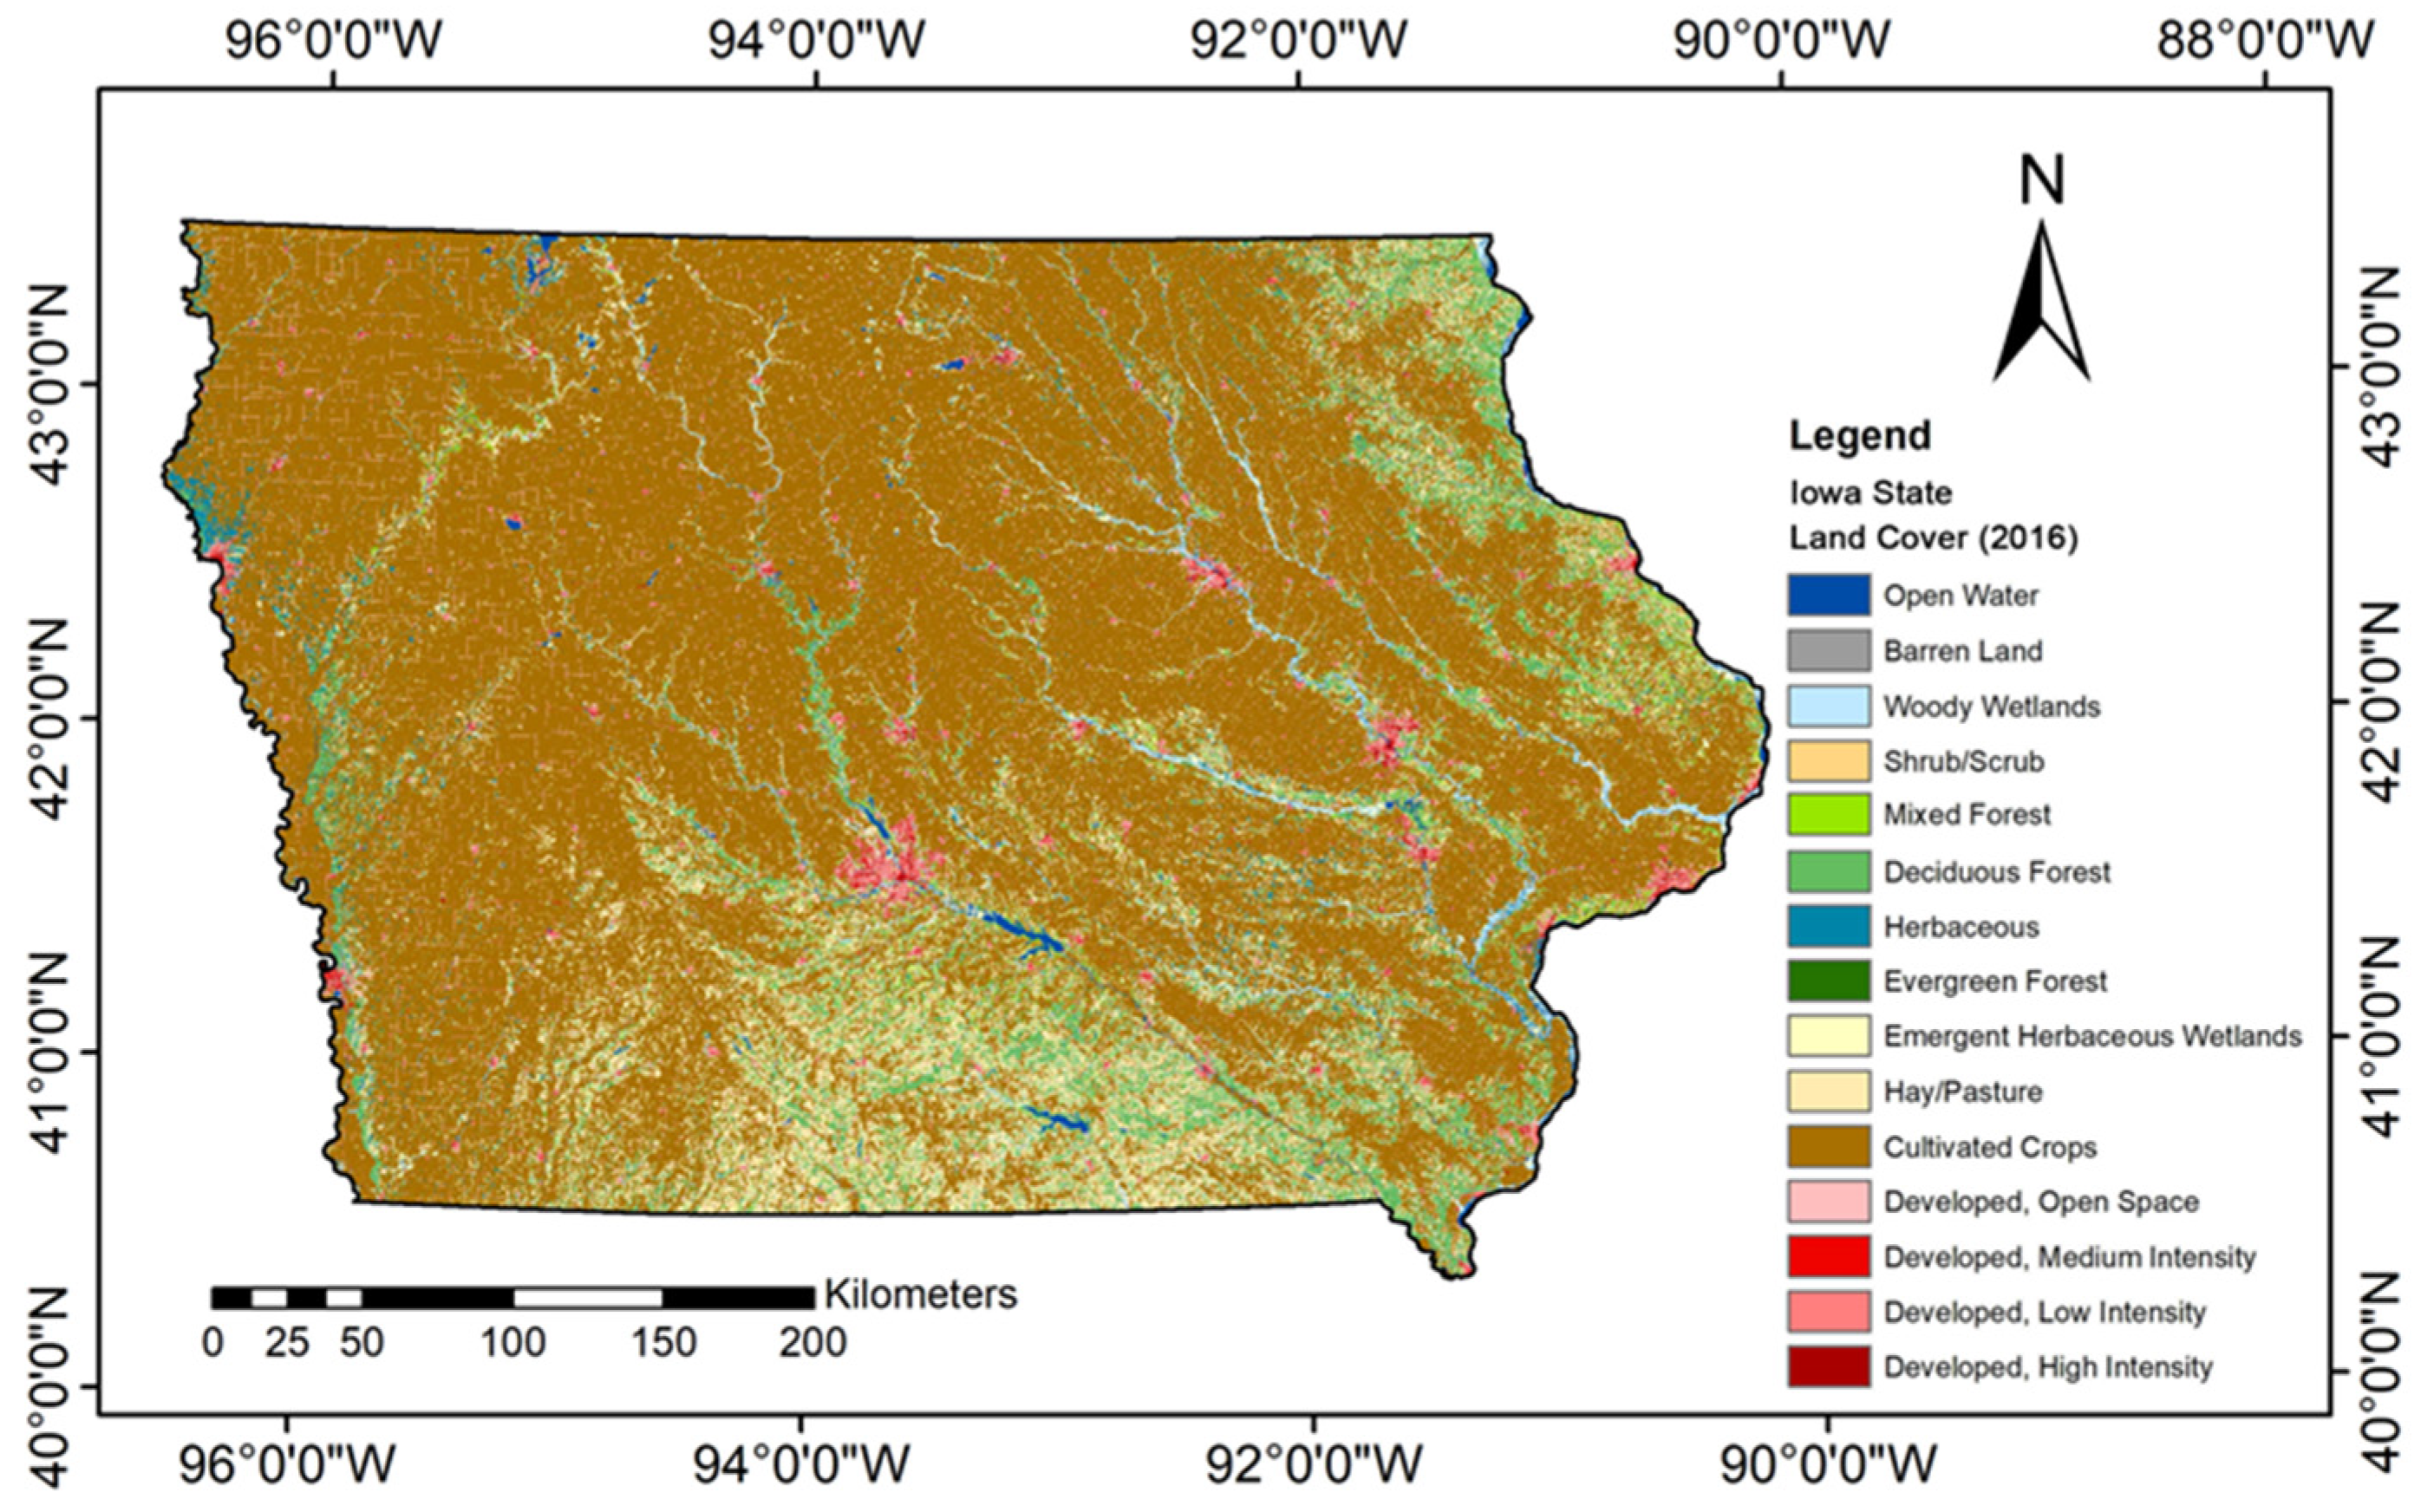
| Cultivated crops | 100,720.4 (70.5) | 5250.6 | 9690.6 | 73.8 | 16,414.9 | 69,016.4 | 274.1 | |
| Developed, open space | 5038.9 (3.5) | 350.7 | 408.5 | 2.3 | 1082.3 | 3185.3 | 9.9 | |
| Developed, medium intensity | 686.4 (0.5) | 85.7 | 51.2 | 0.2 | 110.6 | 438.4 | 0.3 | |
| Developed, low intensity | 2475.9 (1.7) | 187.9 | 165.8 | 1.0 | 614.9 | 1504.9 | 1.4 | |
| Developed, high intensity | 184.8 (0.1) | 34.3 | 9.7 | 0.0 | 22.5 | 118.2 | 0.0 | |
| Barren land | Lower | 95.1 (0.1) | 33.2 | 4.9 | 0.1 | 11.0 | 45.9 | 0.0 |
| Totals | 142,801.0 (100%) | 9195.7 | 12,080.7 | 148.4 | 34,090.3 | 86,991.2 | 294.7 | |
3.3. Soil Quality Degradation and Potential Land for Nature-Based Solutions in Iowa
| Soil Order | Total Area | Anthropogenically Degraded Land | Types of Anthropogenic Degradation | Potential Land for Nature-Based Solutions | |||
|---|---|---|---|---|---|---|---|
| Barren | Developed | Agriculture | |||||
| (km2) | (%) | (km2) | (km2) | (km2) | (km2) | (km2) | |
| Slightly Weathered Soils | |||||||
| 21,425 | 15.0 | 18,319 (+0.5) | 38 (+105.4) | 1297 (+7.5) | 16,984 (−0.1) | 733 (−9.3) | |
| Entisols | 9196 | 6.4 | 6914 (+0.4) | 33 (+148.1) | 659 (+6.0) | 6223 (−0.4) | 434 (−2.0) |
| Inceptisols | 12,081 | 8.5 | 11,317 (+0.6) | 5 (−4.6) | 635 (+9.2) | 10,676 (+0.1) | 295 (−18.2) |
| Histosols | 148 | 0.1 | 88 (−0.4) | 0 (0) | 3 (+2.6) | 84 (−0.6) | 4 (−0.8) |
| Moderately Weathered Soils | |||||||
| 121,376 | 85.0 | 108,254 (0) | 57 (+18.8) | 7089 (+4.5) | 101,108 (−0.1) | 2104 (−8.8) | |
| Alfisols | 34,090 | 23.9 | 27,095 (+0.3) | 11 (+5.5) | 1830 (+4.1) | 25,254 (0.0) | 756 (−9.5) |
| Mollisols | 86,991 | 60.9 | 80,871 (+0.1) | 46 (+21.9) | 5247 (+4.6) | 75,578 (−0.2) | 1344 (−8.4) |
| Vertisols | 295 | 0.2 | 288 (0) | 0 (0) | 12 (+0.3) | 277 (0) | 4 (+1.6) |
| All Soils | |||||||
| Totals | 142,801 | 100.0 | 126,573 (+0.2) | 95 (+42.8) | 8386 (+4.9) | 118,092 (−0.1) | 2837 (−8.9) |
3.4. Soil Quality Damages and Emissions from Iowa Land Development
3.5. Soil Quality Damages and Scale Considerations

| Soil Quality Continuum | ||||||||
|---|---|---|---|---|---|---|---|---|
| NLCD Land Cover Classes (LULC), Dynamic Soil Quality (Soil Health Continuum) | Change in Area, 2001–2016 (%) | Inherent Soil Quality (Soil Suitability) | ||||||
| Lower |  | Higher | ||||||
| Degree of Weathering and Soil Development | ||||||||
| Slight | Moderate | |||||||
| Entisols | Inceptisols | Histosols | Alfisols | Mollisols | Vertisols | |||
| Change in Area, 2001–2016 (%) | ||||||||
| Woody wetlands | Higher | −1.8 | 0.0 | −2.0 | 0.0 | −3.4 | −1.8 | 0.0 |
| Shrub/Scrub |  | 183.7 | 0.0 | 4.5 | 0.0 | 255.0 | 325.0 | 0.0 |
| Mixed forest | 0.7 | 0.0 | −0.1 | 0.0 | 1.4 | 0.4 | 0.0 | |
| Deciduous forest | −1.2 | −3.7 | −0.8 | 0.0 | −1.0 | −1.9 | 0.0 | |
| Herbaceous | 0.2 | −11.6 | −4.4 | 0.0 | −3.1 | 5.2 | 0.0 | |
| Evergreen forest | 8.2 | 0.0 | 2.7 | 0.0 | 7.4 | 14.3 | 0.0 | |
| Emergent herbaceous wetlands | −4.4 | 0.0 | 0.0 | 0.0 | 8.3 | −4.4 | 0.0 | |
| Hay/Pasture | −15.9 | −25.6 | −20.9 | 0.0 | −9.9 | −17.0 | 0.0 | |
| Cultivated crops | −0.4 | 2.1 | −0.6 | 0.0 | 6.4 | −0.8 | 0.0 | |
| Developed, open space | 11.7 | 1.0 | 14.8 | 0.0 | 10.5 | 10.3 | 0.0 | |
| Developed, medium intensity | 132.6 | 25.8 | 171.8 | 0.0 | 178.3 | 116.3 | 0.0 | |
| Developed, low intensity | 33.6 | 8.3 | 48.5 | 0.0 | 24.3 | 28.1 | 0.0 | |
| Developed, high intensity | 174.7 | 55.8 | 160.1 | 0.0 | 1252.0 | 165.2 | 0.0 | |
| Barren land | Lower | −1.3 | −10.0 | −22.6 | 0.0 | −10.7 | 6.4 | 0.0 |
4. Discussion
4.1. Redefining Soil Quality at the Landscape Level: The Soil Quality Continuum
4.2. Study Implications in a Broader Context
4.2.1. Significance of the Results for Iowa’s Pending Soil Health Legislation
4.2.2. Significance of the Results for Iowa’s Climate Change
4.2.3. Significance of Iowa’s Results for the United Nations (UN) Sustainable Development Goals (SDGs) and Other UN Initiatives
- For the state of IA, there was a reduction in the amount of land under the hay/pasture land cover between 2001 and 2016 across all soil orders (Table 3). Given this loss of agriculturally relevant land uses, there was less capacity for production in these areas (which addresses UN SDG 2: Zero Hunger);
- Newly developed land in IA took place in areas with each of the six soil orders, including soils that are considered the most agriculturally vital (e.g., Mollisols, Alfisols) and also with Histosol soils with high levels of C (Table 3, addressing UN SDG 12: Responsible Consumption and Production);
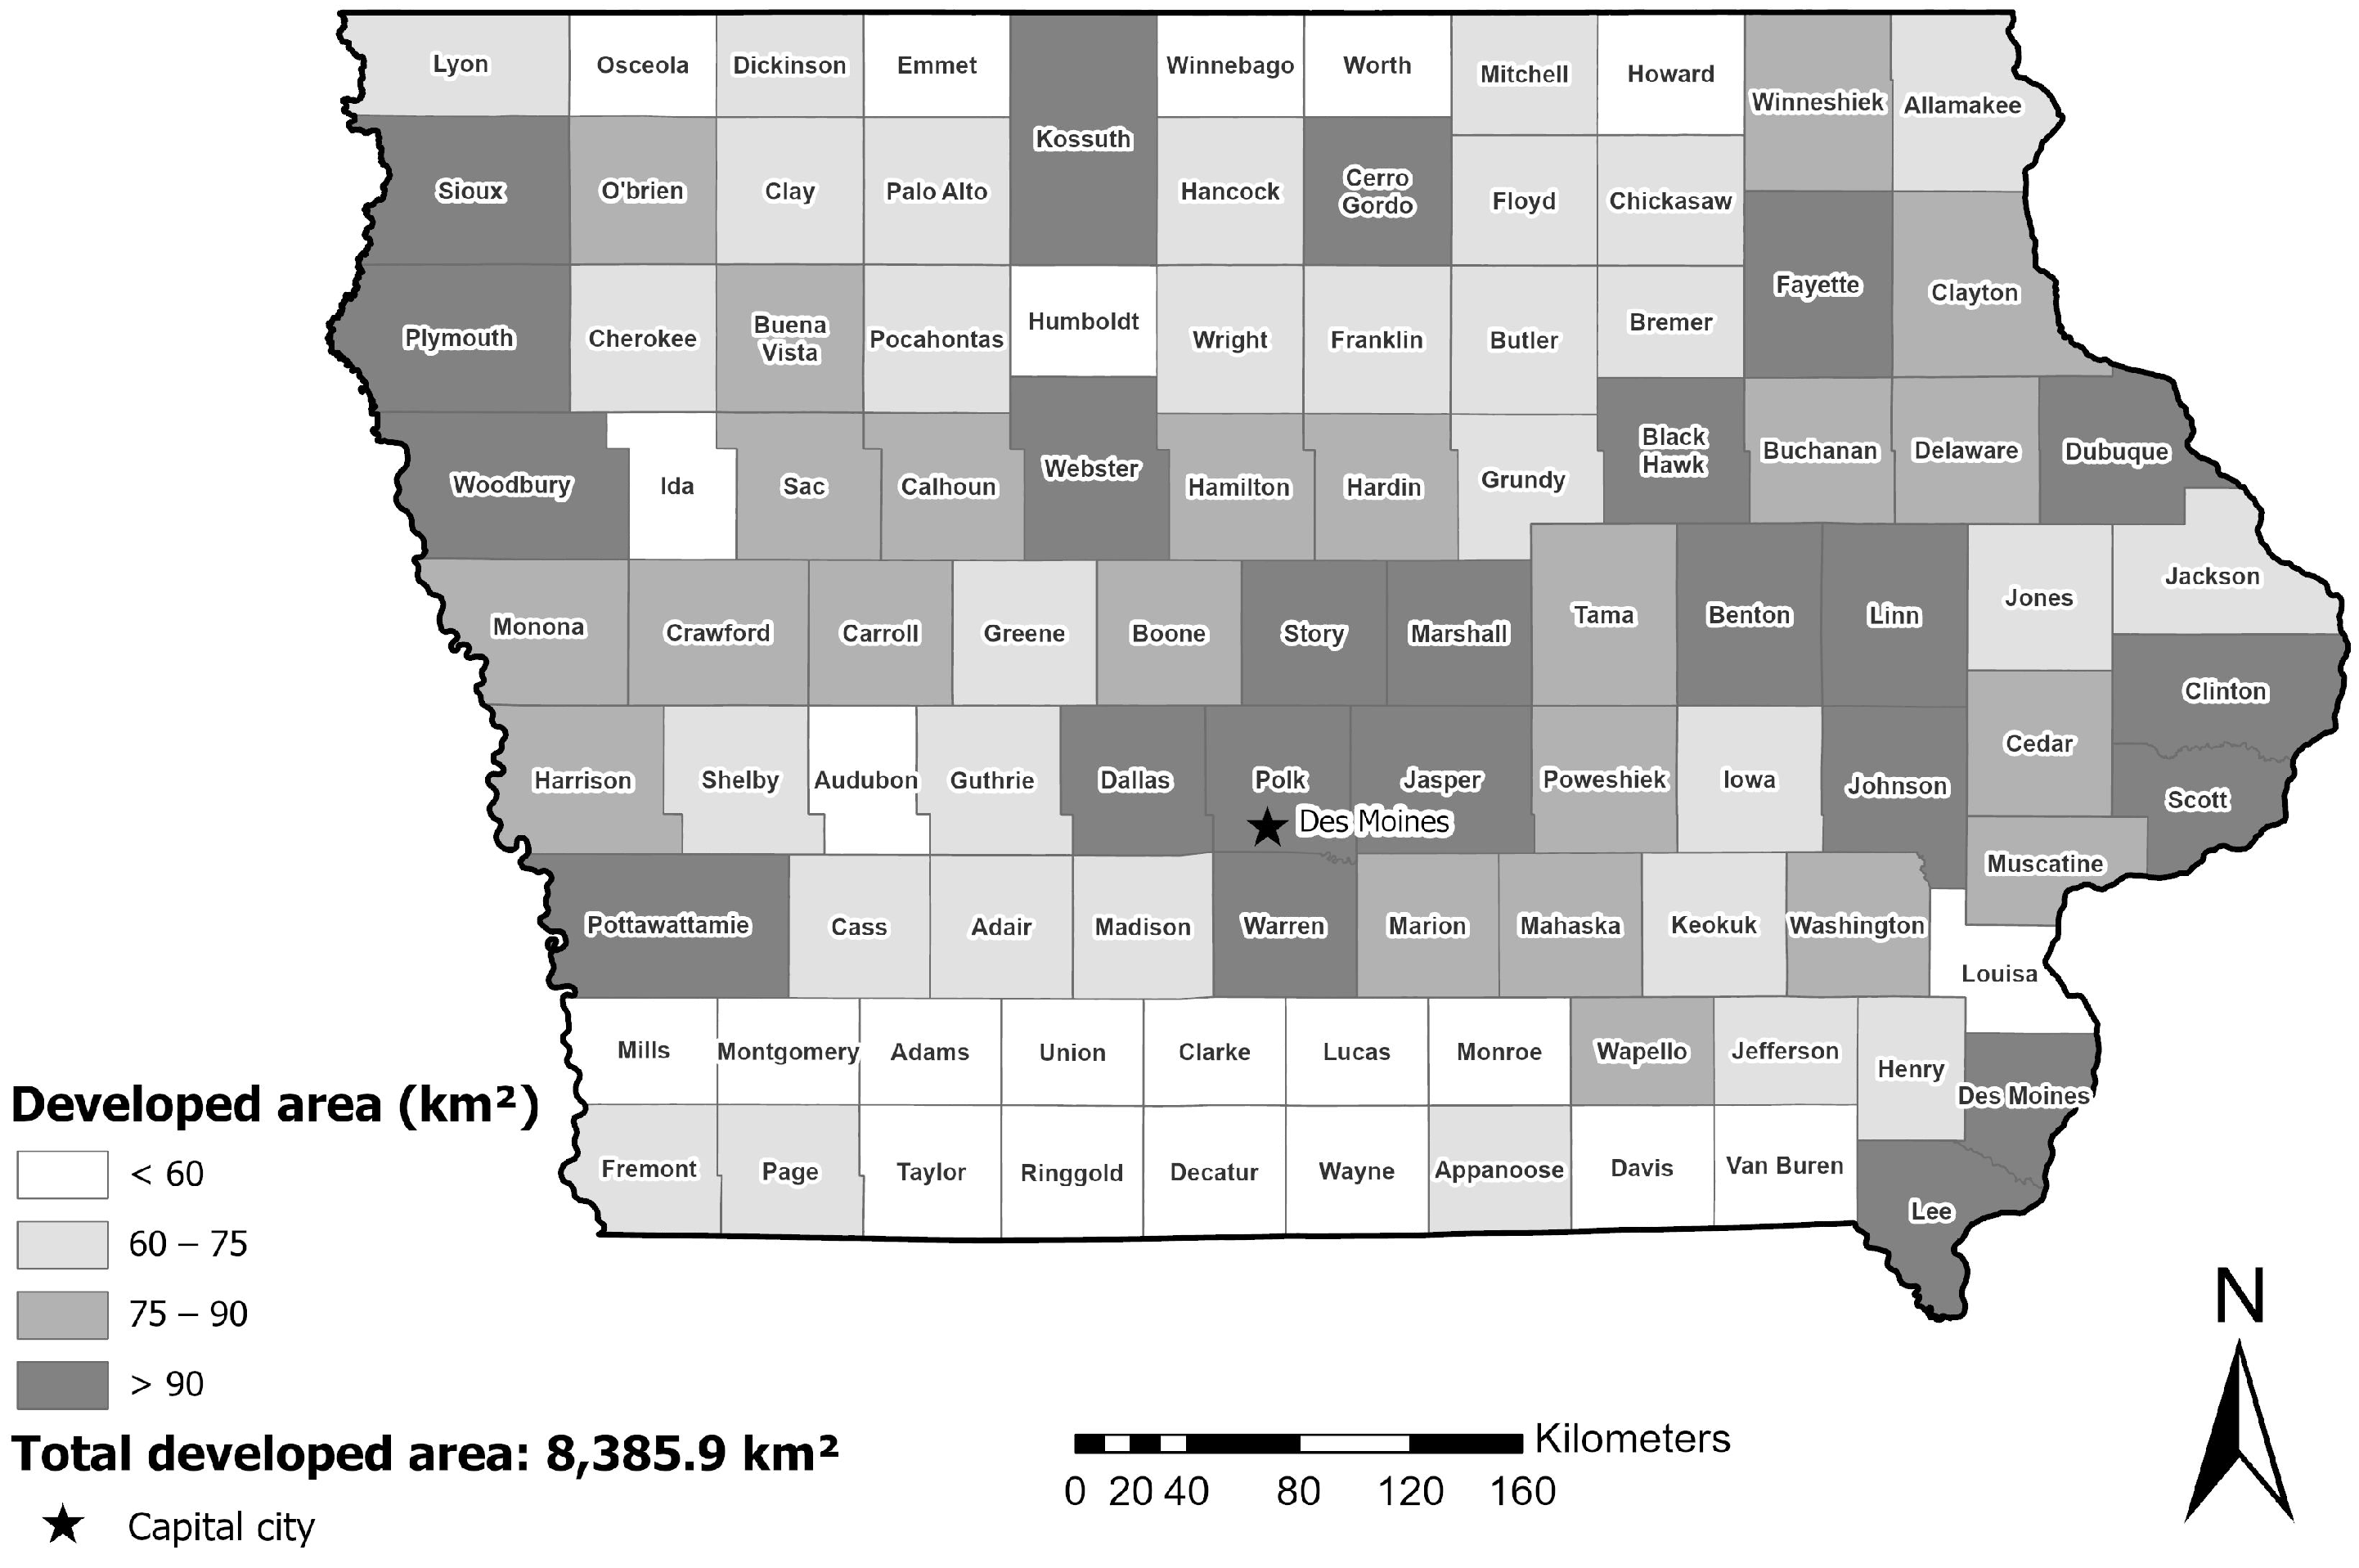
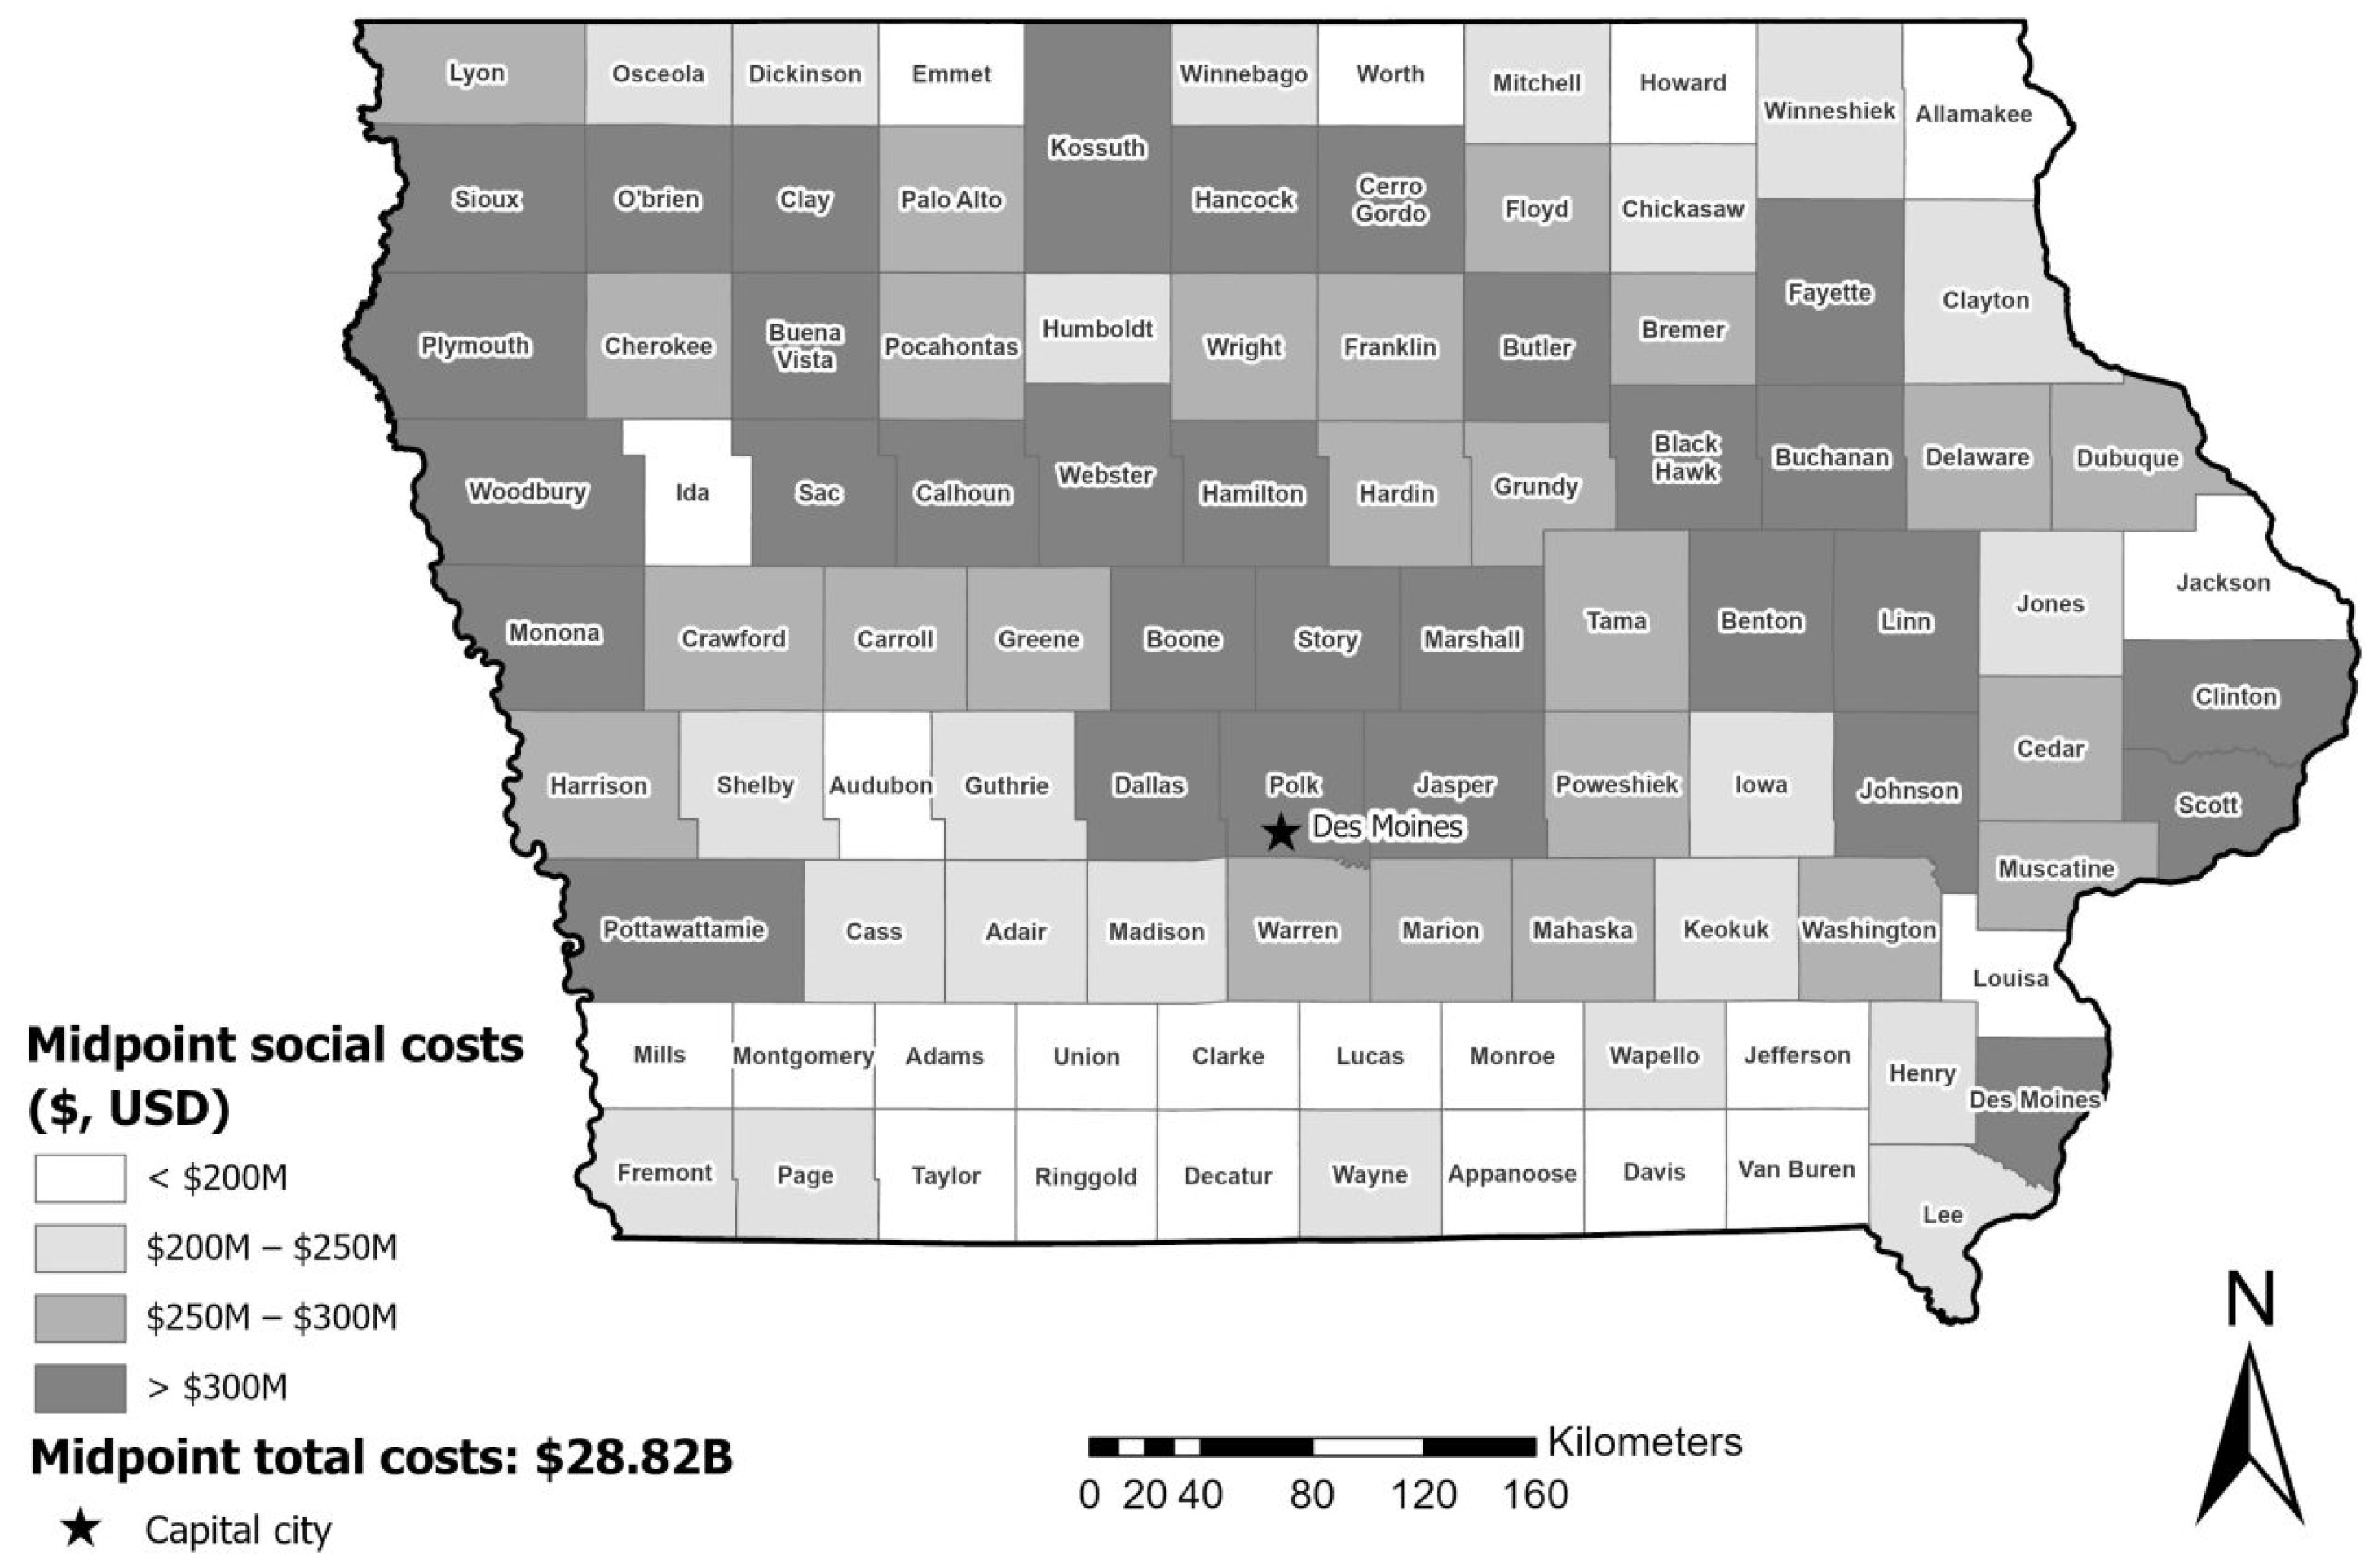
- The state of IA has not finalized state-led climate change preparation and adaptation plans (https://www.georgetownclimate.org/adaptation/plans.html (accessed on 9 March 2024) [40]. Agriculture and land development in IA has caused damage to dynamic SQ (soil health) from the loss of soil C and the subsequent emission of carbon dioxide (CO2). All land developments in IA can be linked to damages to SQ, with 8,385.9 km2 developed, resulting in midpoint losses of 1.7 × 10¹¹ kg of total soil carbon (TSC) and a midpoint social cost of carbon dioxide emissions (SC-CO2) of $28.8B (where B = billion = 109, USD). More recently developed land area (398.5 km2) between 2001 and 2016 likely caused the midpoint loss of 8.0 × 10⁹ kg of TSC and a corresponding midpoint of $1.3B in SC-CO2. Data on variability associated with these estimates are presented in the Supplemental Materials of this article. There is only a small amount of potential land (2.0% of the total land area) that can be used for nature-based solutions to SQ degradation and C sequestration (addressing UN SDG 13: Climate Action);
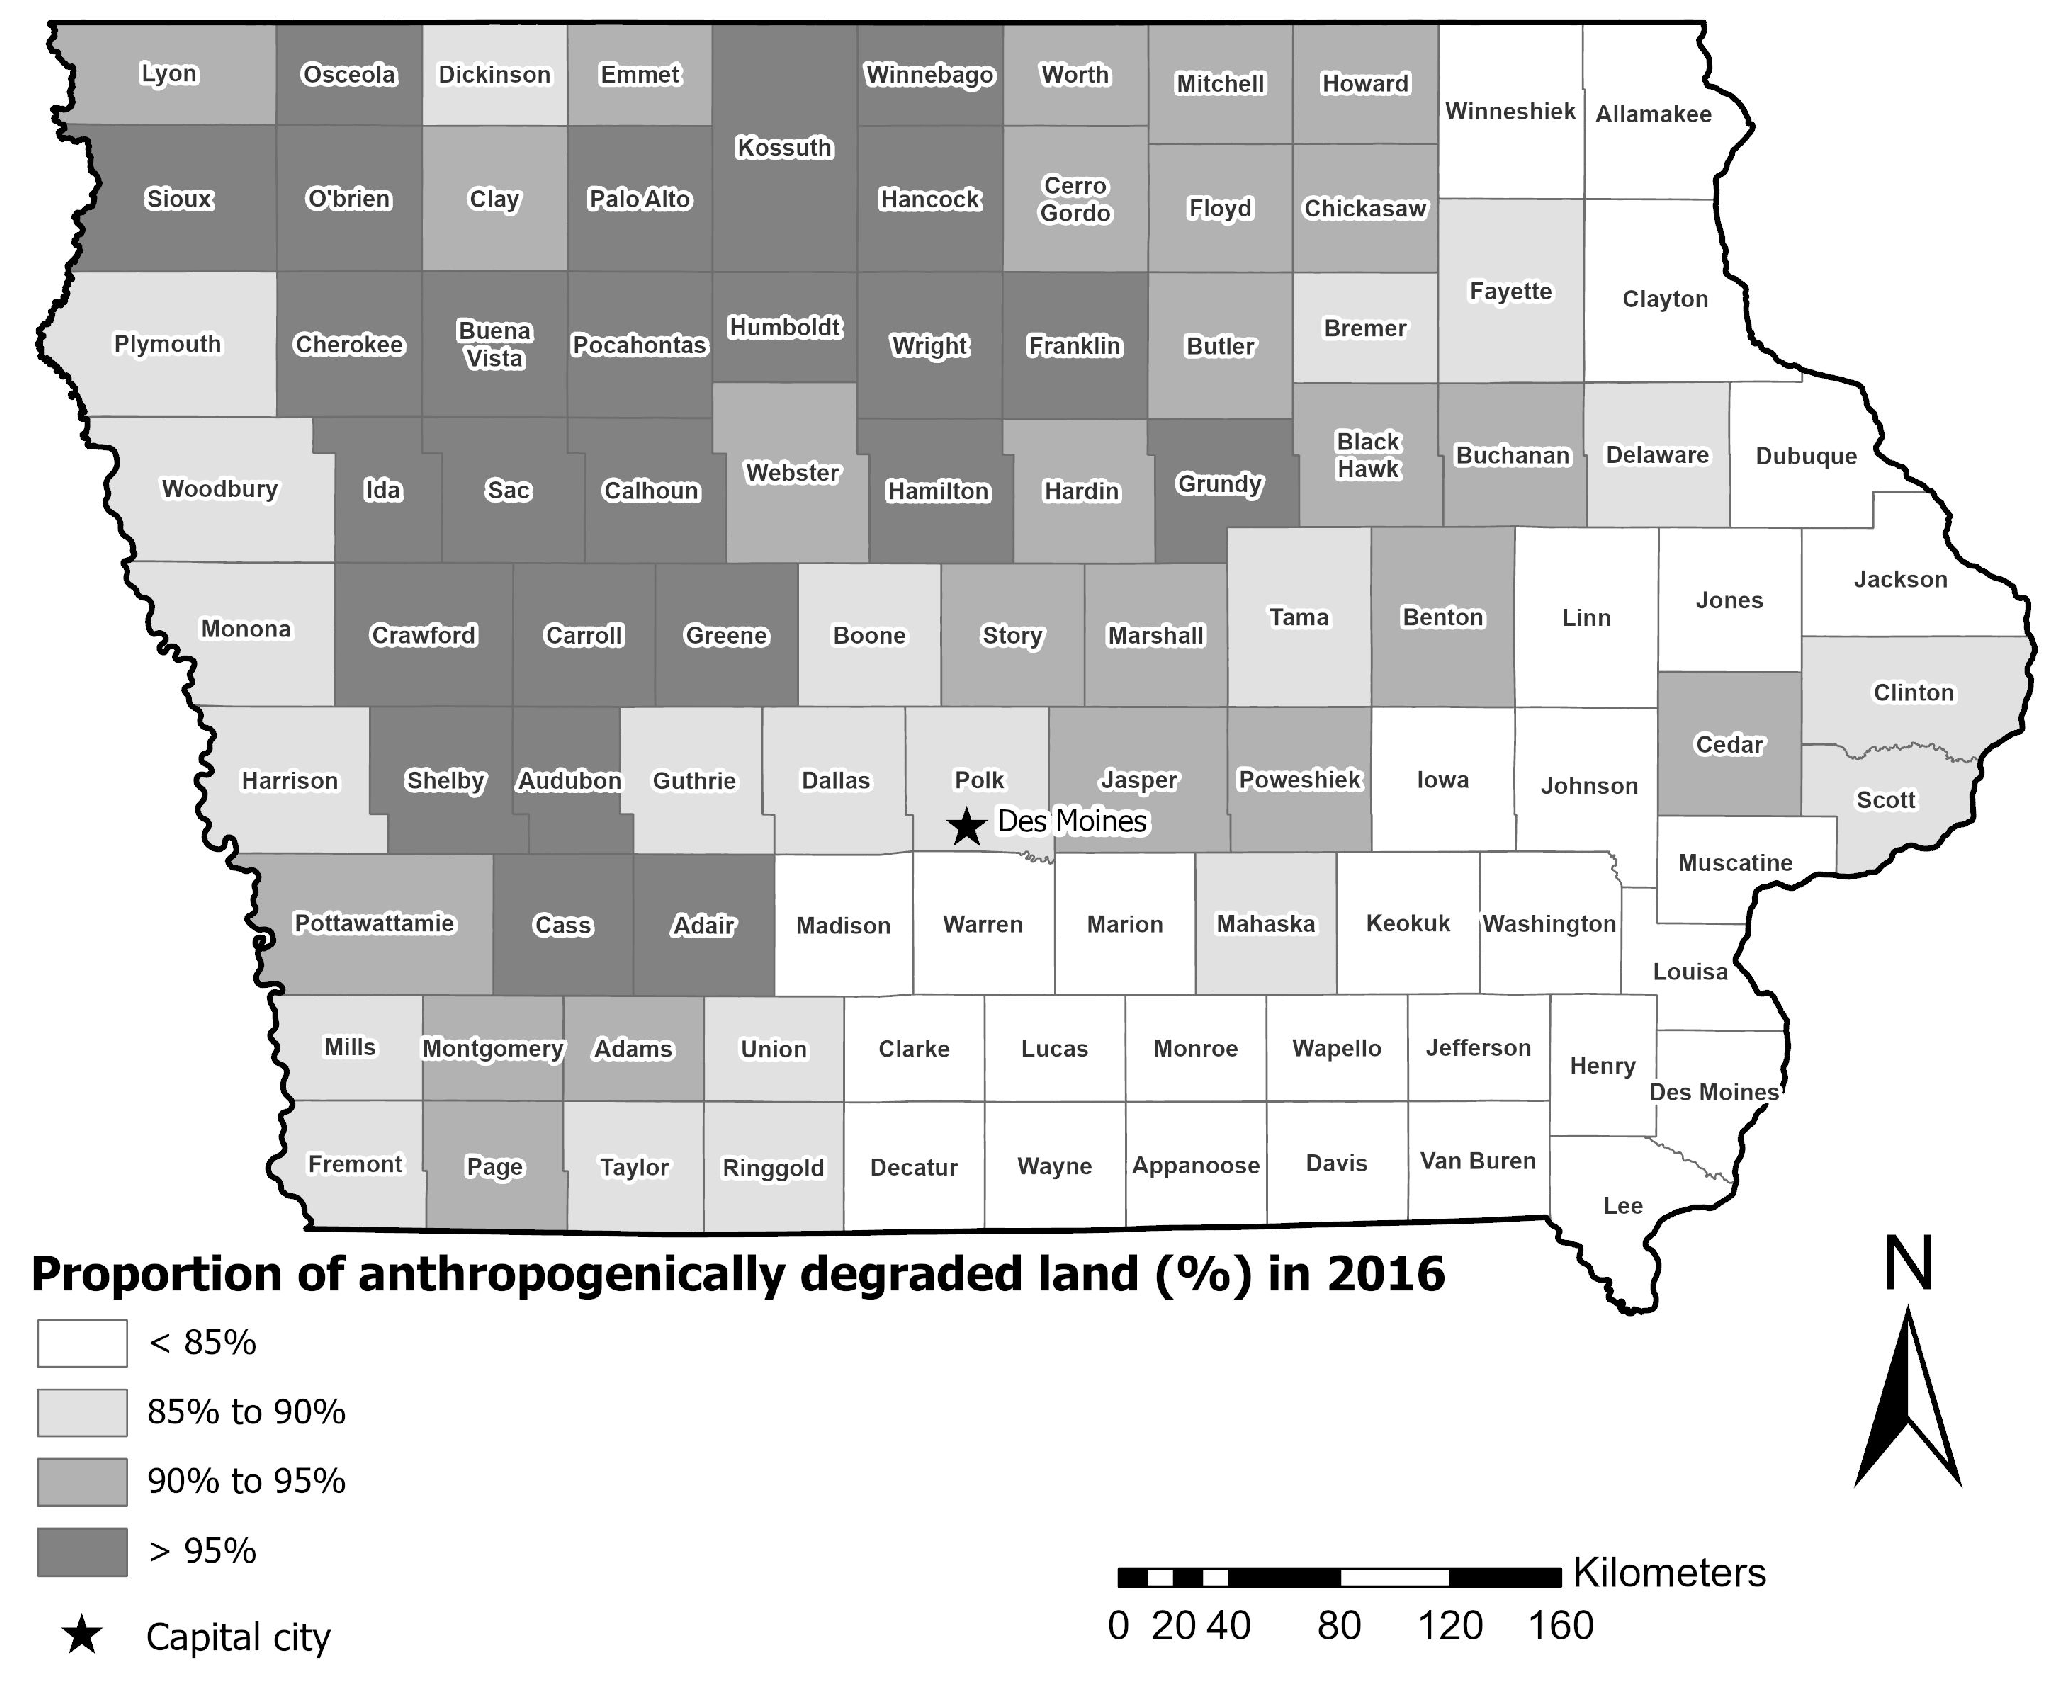
- The state of IA was not land degradation neutral (LDN), with more than 88% of land in IA experiencing anthropogenic LD primarily due to agriculture (93%). All six soil orders were subject to various degrees of anthropogenic LD: Entisols (75%), Inceptisols (94%), Histosols (59%), Alfisols (79%), Mollisols (93%), and Vertisols (98%). Soil and LD have primarily increased between 2001 and 2016, especially in the developed LD type. Development has reduced overall soil resources from land cover change between 2001 and 2016 for all 99 counties in IA (Table 3, Table S5). There were cutbacks in the total areas of woody wetlands, deciduous forests, and herbaceous land covers, which reduced C sinks, therefore increasing GHG emissions and other pollutants to the atmosphere (Table 3) (addressing UN SDG 15: Life on Land; UN Convention to Combat Desertification; UN Convention on Biological Diversity; UN Kunming-Montreal Global Biodiversity Framework);
- Goals of the recent UN Kunming-Montreal Global Biodiversity Framework [49] include a focus on the resilience and integrity of all ecosystems (Goal A: “The integrity, connectivity and resilience of all ecosystems are maintained, enhanced, or restored, substantially increasing the area of natural ecosystems by 2050”), with a target to preserve and enhance ecosystem functions and services, including soil health-related contributions (Target 11: “Restore, maintain and enhance nature’s contributions to people, including ecosystem functions and services, such as regulation of air, water, and climate, soil health…” This study found a loss of soil diversity (pedodiversity) from land developments, which reduced the available soil resources and associated biodiversity. Furthermore, our study supports Target 21, which discusses using the best data to guide decision-making (Target 21: “Ensure that the best available data, information and knowledge, are accessible to decision makers, practitioners and the public to guide effective and equitable governance…”) given our analysis is based on publicly available soil data and satellite-derived land cover information analyzed in a spatial context to more readily support analysis and policy-making to reach the biodiversity goals.
5. Conclusions
Supplementary Materials
Author Contributions
Funding
Data Availability Statement
Acknowledgments
Conflicts of Interest
Glossary
| B | Billion |
| BS | Base saturation |
| CF | Carbon footprint |
| CCA | Climate Change Adaptation |
| CO2 | Carbon dioxide |
| EPA | Environmental Protection Agency |
| GHG | Greenhouse Gases |
| IA | Iowa |
| LD | Land degradation |
| LDN | Land degradation neutrality |
| L&D | Loss and damage |
| LULC | Land use/land cover |
| LULCC | Land use/land cover change |
| M | Million |
| MRLC | Multi-Resolution Land Characteristics Consortium |
| N | North |
| NBS | Nature-based solutions |
| NLCD | National Land Cover Database |
| NOAA | National Oceanic and Atmospheric Administration |
| NRCS | Natural Resources Conservation Service |
| SC-CO2 | Social cost of carbon emissions |
| SD | Soil degradation |
| SDGs | Sustainable Development Goals |
| SH | Soil health |
| SIC | Soil inorganic carbon |
| SOC | Soil organic carbon |
| SOM | Soil organic matter |
| SQ | Soil quality |
| SQC | Soil quality continuum |
| SQI | Soil quality indicator |
| SSURGO | Soil Survey Geographic Database |
| STATSGO | State Soil Geographic Database |
| TSC | Total soil carbon |
| UN | United Nations |
| UNCCD | United Nations Convention to Combat Desertification |
| USDA | United States Department of Agriculture |
| W | West |
References
- Bünemann, E.K.; Bongiorno, G.; Bai, Z.; Creamer, R.E.; De Deyn, G.; De Goede, R.; Fleskens, L.; Geissen, V.; Kuyper, T.W.; Mäder, P.; et al. Soil quality—A critical review. Soil Biol. Biochem. 2018, 120, 105–125. [Google Scholar] [CrossRef]
- Carter, M.R.; Gregorich, E.G.; Anderson, D.W.; Doran, J.W.; Janzen, H.H.; Pierce, F.J. Concepts of soil quality and their significance. In Developments in Soil Science; Gregorich, E.G., Carter, M.R., Eds.; Elsevier: Amsterdam, The Netherlands, 1997; Volume 25, pp. 1–19. ISBN 978-0-444-81661-0. [Google Scholar] [CrossRef]
- Doran, J.W.; Parkin, T.B. Defining and assessing soil quality. In Defining Soil Quality for a Sustainable Environment; Doran, J.W., Coleman, D.C., Bezdicek, D.F., Stewart, B.A., Eds.; Soil Science Society of America (SSSA): Madison, WI, USA, 1994; pp. 3–21. [Google Scholar] [CrossRef]
- Doran, J.W.; Parkin, T.B. Quantitative indicators of soil quality: A minimum data set. In Methods for Assessing Soil Quality; Doran, J.W., Jones, A.J., Eds.; Soil Science Society of America (SSSA): Madison, WI, USA, 1996; pp. 25–37. [Google Scholar]
- De la Rosa, D.; Sobral, R. Soil quality and methods for its assessment. In Land Use Soil Resources; Springer: Berlin/Heidelberg, Germany, 2008; pp. 167–200. [Google Scholar]
- Soil Survey Staff. Keys to Soil Taxonomy, 13th ed.; USDA Natural Resources Conservation Service: Washington, DC, USA, 2022. Available online: https://www.nrcs.usda.gov/sites/default/files/2022-09/Keys-to-Soil-Taxonomy.pdf (accessed on 3 March 2024).
- United States Department of Agriculture (USDA). Natural Resources Conservation Service (NRCS). Soil Health. Available online: https://www.nrcs.usda.gov/conservation-basics/natural-resource-concerns/soils/soil-health (accessed on 3 April 2024).
- Muñoz-Rojas, M. Soil quality indicators: Critical tools in ecosystem restoration. Curr. Opin. Environ. Sci. Health 2018, 5, 47–52. [Google Scholar] [CrossRef]
- Soil Science Society of America. n.d. USDA. Tama—Iowa State Soil. Available online: https://www.soils4teachers.org/files/s4t/k12outreach/ia-state-soil-booklet.pdf (accessed on 1 September 2023).
- Karlen, D.L.; Tomer, M.D.; Neppel, J.; Cambardella, C.A. A preliminary watershed scale soil quality assessment in north central Iowa, USA. Soil Tillage Res. 2008, 99, 291–299. [Google Scholar] [CrossRef]
- Cambardella, C.A.; Moorman, T.B.; Andrews, S.S.; Karlen, D.L. Watershed-scale assessment of soil quality in the loess hills of southwest Iowa. Soil Tillage Res. 2004, 78, 237–247. [Google Scholar] [CrossRef]
- Stott, D.E.; Cambardella, C.A.; Tomer, M.D.; Karlen, D.L.; Wolf, R. A soil quality assessment within the Iowa River South Fork watershed. Soil Sci. Soc. Am. J. 2011, 75, 2271–2282. [Google Scholar] [CrossRef]
- Papanicolaou, A.T.; Wilson, C.G.; Abaci, O.Z.A.N.; Elhakeem, M.; Skopec, M. SOM loss and soil quality in the Clear Creek, IA. J. Iowa Acad. Sci. 2009, 116, 14–26. [Google Scholar]
- Soil Survey Staff, Natural Resources Conservation Service, United States Department of Agriculture. n.d.a. Soil Survey Geographic (SSURGO) Database. Available online: https://nrcs.app.box.com/v/soils (accessed on 10 September 2023).
- United States Environmental Protection Agency (EPA). Ecoregion Download Files by State—Region 7. Iowa. Available online: https://www.epa.gov/eco-research/ecoregion-download-files-state-region-7 (accessed on 10 September 2023).
- Karlen, D.L.; Hurley, E.G.; Andrews, S.S.; Cambardella, C.A.; Meek, D.W.; Duffy, M.D.; Mallarino, A.P. Crop rotation effects on soil quality at three northern corn/soybean belt locations. Agron. J. 2006, 98, 484–495. [Google Scholar] [CrossRef]
- Karlen, D.L.; Wollenhaupt, N.C.; Erbach, D.C.; Berry, E.C.; Swan, J.B.; Eash, N.S.; Jordahl, J.L. Long-term tillage effects on soil quality. Soil Tillage Res. 1994, 32, 313–327. [Google Scholar] [CrossRef]
- Karlen, D.L.; Cambardella, C.A.; Kovar, J.L.; Colvin, T.S. Soil quality response to long-term tillage and crop rotation practices. Soil Tillage Res. 2013, 133, 54–64. [Google Scholar] [CrossRef]
- Jordahl, J.; McDaniel, M.; Miller, B.A.; Thompson, M.; Villarino, S.; Schulte, L.A. Carbon storage in cropland soils: Insights from Iowa, United States. Land 2023, 12, 1630. [Google Scholar] [CrossRef]
- Al-Kaisi, M.M.; Yin, X.; Licht, M.A. Soil carbon and nitrogen changes as influenced by tillage and cropping systems in some Iowa soils. Agric. Ecosyst. Environ. 2005, 105, 635–647. [Google Scholar] [CrossRef]
- Whittaker, W.E. An Analysis of historic-era Indian locations in Iowa. Midcont. J. Archaeol. 2016, 41, 159–185. [Google Scholar] [CrossRef]
- Gallant, A.L.; Sadinski, W.; Roth, M.F.; Rewa, C.A. Changes in historical Iowa land cover as context for assessing the environmental benefits of current and future conservation efforts on agricultural lands. J. Soil Water Conserv. 2011, 66, 67A–77A. [Google Scholar] [CrossRef]
- Streeter, M.T.; Schilling, K.E.; Demanett, Z. Soil health variations across an agricultural–urban gradient, Iowa, USA. Environ. Earth Sci. 2019, 78, 691. [Google Scholar] [CrossRef]
- Griffith, G.E.; Omernik, J.M.; Wilton, T.F.; Pierson, S.M. Ecoregions and subregions of Iowa: A framework for water quality assessment and management. J. Iowa Acad. Sci. 1994, 101, 5–13. Available online: https://scholarworks.uni.edu/jias/vol101/iss1/4 (accessed on 20 September 2023).
- Karlen, D.L.; Veum, K.S.; Sudduth, K.A.; Obrycki, J.F.; Nunes, M.R. Soil health assessment: Past accomplishments, current activities, and future opportunities. Soil Tillage Res. 2019, 195, 104365. [Google Scholar] [CrossRef]
- Seybold, C.A.; Mausbach, M.J.; Karlen, D.L.; Rogers, H.H. Quantification of soil quality. In Soil Processes and the Carbon Cycle; Lal, R., Kimble, J.M., Follett, R.F., Stewart, B.A., Eds.; CRC Press: Boca Raton, FL, USA, 1998; pp. 387–404. ISBN 9780849374418. [Google Scholar]
- Groshans, G.R.; Mikhailova, E.A.; Post, C.J.; Schlautman, M.A.; Zhang, L. Determining the value of soil inorganic carbon stocks in the contiguous United States based on the avoided social cost of carbon emissions. Resources 2019, 8, 119. [Google Scholar] [CrossRef]
- EPA—United States Environmental Protection Agency. The Social Cost of Carbon. EPA Fact Sheet. 2016. Available online: https://19january2017snapshot.epa.gov/climatechange/social-cost-carbon_.html (accessed on 15 September 2023).
- Soil Survey Staff, Natural Resources Conservation Service, United States Department of Agriculture. U.S. General Soil Map (STATSGO2). Available online: https://sdmdataaccess.sc.egov.usda.gov (accessed on 23 June 2023).
- Guo, Y.; Amundson, R.; Gong, P.; Yu, Q. Quantity and spatial variability of soil carbon in the conterminous United States. Soil Sci. Soc. Am. J. 2006, 70, 590–600. [Google Scholar] [CrossRef]
- Multi-Resolution Land Characteristics Consortium—MRLC. Available online: https://www.mrlc.gov/ (accessed on 1 September 2023).
- ESRI (Environmental Systems Research Institute). ArcGIS Pro 2.6. Available online: https://pro.arcgis.com/en/pro-app/2.6/get-started/whats-new-in-arcgis-pro.htm (accessed on 1 March 2023).
- Mikhailova, E.A.; Groshans, G.R.; Post, C.J.; Schlautman, M.A.; Post, G.C. Valuation of soil organic carbon stocks in the contiguous United States based on the avoided social cost of carbon emissions. Resources 2019, 8, 153. [Google Scholar] [CrossRef]
- Mikhailova, E.A.; Groshans, G.R.; Post, C.J.; Schlautman, M.A.; Post, C.J. Valuation of total soil carbon stocks in the contiguous United States based on the avoided social cost of carbon emissions. Resources 2019, 8, 157. [Google Scholar] [CrossRef]
- Soil Survey Staff, Natural Resources Conservation Service, United States Department of Agriculture. Photos of Soil Orders. Available online: https://www.nrcs.usda.gov/wps/portal/nrcs/detail/soils/edu/?cid=nrcs142p2_053588 (accessed on 20 September 2023).
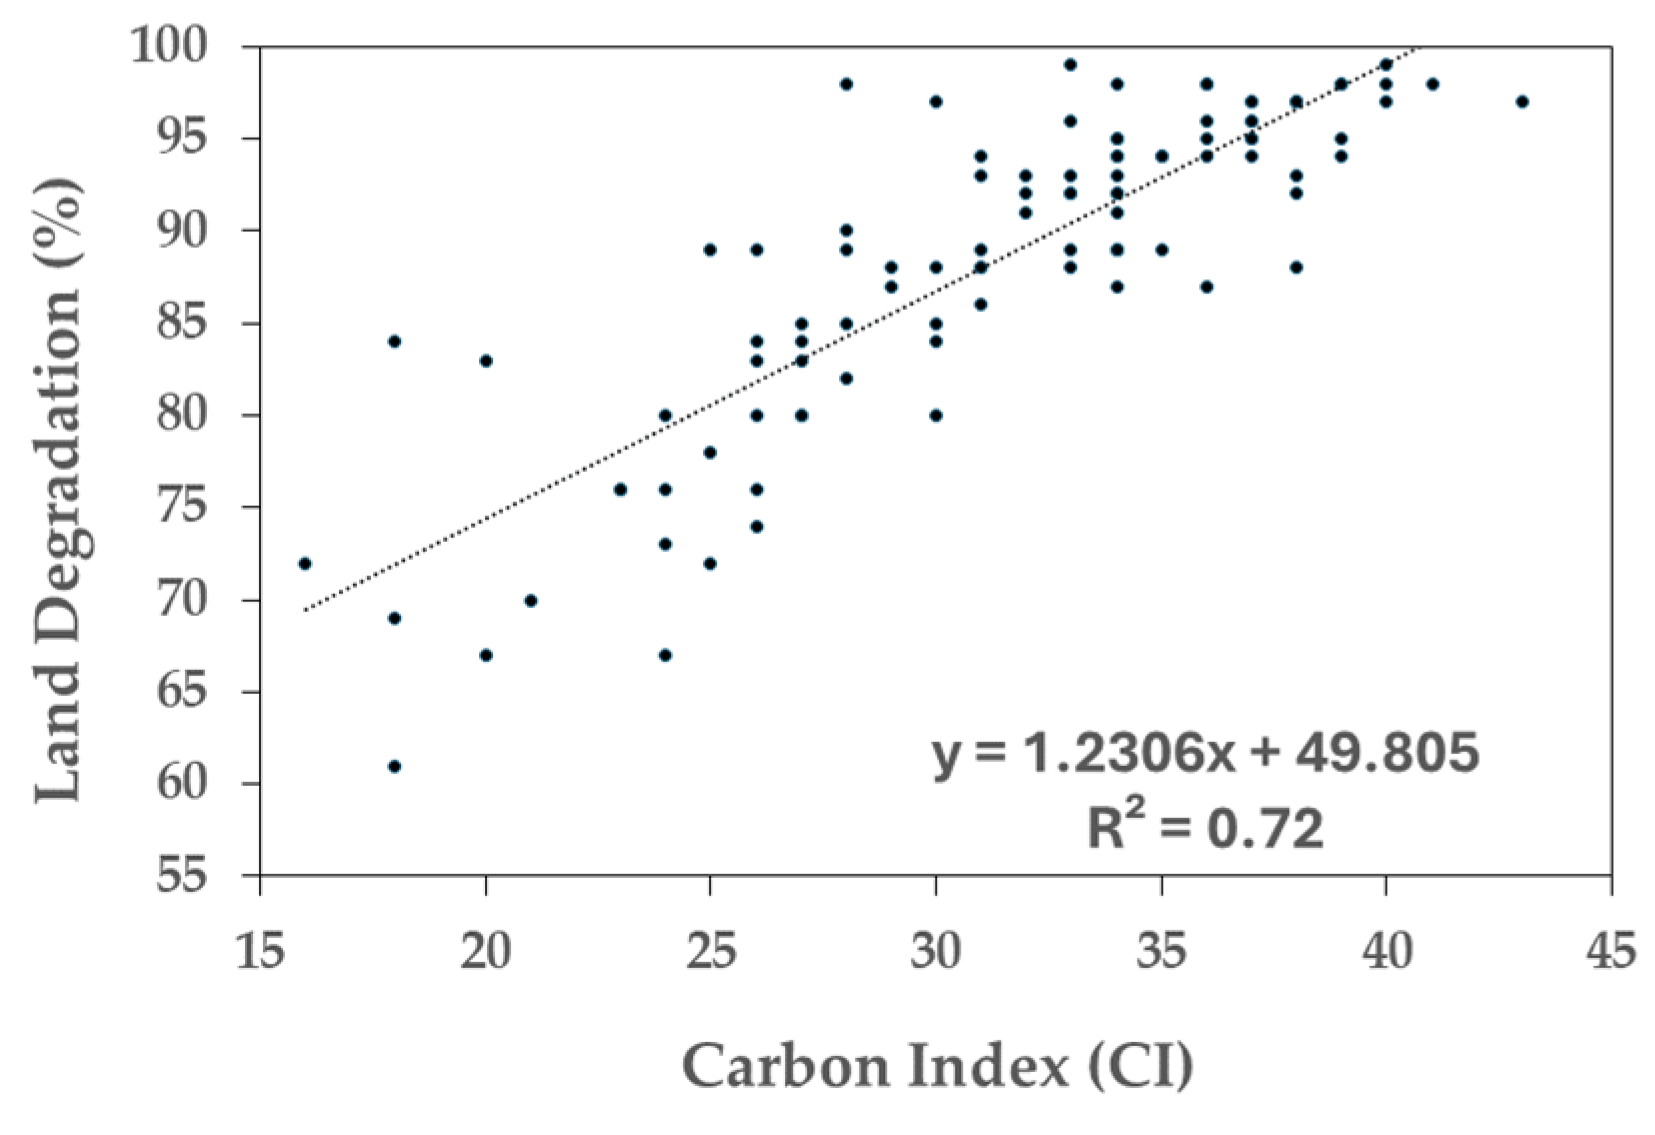
- Al-Kaisi, M.M.; Fenton, T.E.; Guzman, J.G.; O’Neal, B.R. Development of a soil carbon index for Iowa mineral soils. J. Iowa Acad. Sci. 2012, 119, 1–7. Available online: https://scholarworks.uni.edu/jias/vol119/iss1/3 (accessed on 20 September 2023).
- U.S. Bureau of the Census. Statistical Abstract of the United States: 1991; U.S. Bureau of the Census: Washington, DC, USA, 1991; p. 201. Available online: https://www.census.gov/library/publications/1991/compendia/statab/111ed.html (accessed on 10 June 2023).
- Santelmann, M.V.; White, D.; Freemark, K.; Nassauer, J.I.; Eilers, J.M.; Vache, K.B.; Danielson, B.J.; Corry, R.C.; Clark, M.E.; Polasky, S.; et al. Assessing alternative futures for agriculture in Iowa, USA. Landsc. Ecol. 2004, 19, 357–374. [Google Scholar] [CrossRef]
- Iowa Legislature. House File 282—Introduced. A Bill for an Act Relating to the Management of Soil and Water Resources, by Providing for Certain Practices and Projects, including Projects Described in the Iowa Nutrient Reduction Strategy. Available online: https://www.legis.iowa.gov/legislation/BillBook?ga=90&ba=HF282 (accessed on 9 March 2024).
- Georgetown Law. Georgetown Climate Center. State Adaptation Progress Tracker. Available online: https://www.georgetownclimate.org/adaptation/plans.html (accessed on 9 March 2024).
- EPA—United States Environmental Protection Agency. What Climate Change Means for Iowa. EPA 430-F-16-017. August 2016. Available online: https://19january2017snapshot.epa.gov/sites/production/files/2016-09/documents/climate-change-ia.pdf (accessed on 9 March 2024).
- Vahedifard, F.; Goodman, C.C.; Paul, V.; AghaKouchak, A. Amplifying feedback loop between drought, soil desiccation cracking, and greenhouse gas emissions. Environ. Res. Lett. 2024, 19, 031005. [Google Scholar] [CrossRef]
- Arbuckle, J.G.; Morton, L.W.; Hobbs, J. Farmer beliefs and concerns about climate change and attitudes toward adaptation and mitigation: Evidence from Iowa. Clim. Chang. 2013, 118, 551–563. [Google Scholar] [CrossRef]
- United States Department of Agriculture National Agricultural Statistics Service (NASS). Crop Production 2010: Summary. United States Department of Agriculture, Washington. Released 12 August 2010, by the National Agricultural Statistics Service (NASS), Agricultural Statistics Board, United States Department of Agriculture (USDA). ISSN: 1936-3737. Available online: https://www.nass.usda.gov/Publications/Todays_Reports/reports/crop0810.pdf (accessed on 11 March 2024).
- Khan, M.R. Polluter-pays-principle: The cardinal instrument for addressing climate change. Laws 2015, 4, 638–653. [Google Scholar] [CrossRef]
- UN. Transforming Our World: The 2030 Agenda for Sustainable Development; United Nations: New York, NY, USA, 2015. [Google Scholar]
- UN. Convention to Combat Desertification (UNCCD). Available online: https://www.unccd.int/ (accessed on 11 March 2024).
- UN. Convention on Biological Diversity. 1992. Treaty Collection. Available online: https://www.cbd.int/doc/legal/cbd-en.pdf (accessed on 11 March 2024).
- UN. Convention on Biological Diversity. Kunming-Montreal Global Biodiversity Framework. 2022. Available online: https://www.cbd.int/article/cop15-final-text-kunming-montreal-gbf-221222 (accessed on 11 March 2024).
- Mikhailova, E.A.; Zurqani, H.A.; Lin, L.; Hao, Z.; Post, C.J.; Schlautman, M.A.; Shepherd, G.B. Opportunities for monitoring soil and land development to support United Nations (UN) Sustainable Development Goals (SDGs): A Case study of the United States of America (USA). Land 2023, 12, 1853. [Google Scholar] [CrossRef]
- Mikhailova, E.A.; Zurqani, H.A.; Lin, L.; Hao, Z.; Post, C.J.; Schlautman, M.A.; Shepherd, G.B. Possible integration of soil information into land degradation analysis for the United Nations (UN) Land Degradation Neutrality (LDN) Concept: A case study of the contiguous United States of America (USA). Soil Syst. 2024, 8, 27. [Google Scholar] [CrossRef]


| Inherent Soil Quality (Soil Suitability) and Soil Regulating Ecosystem Services in the State of Iowa (USA) | |||||
|---|---|---|---|---|---|
| Lower |  | Higher | |||
| Soil Regulating Ecosystem Services in Iowa | |||||
| Degree of Weathering and Soil Development | |||||
| Slight (15.0%) | Moderate (85.0%) | ||||
| Entisols | Inceptisols | Histosols | Alfisols | Mollisols | Vertisols |
| 6.4% | 8.5% | 0.1% | 23.9% | 60.9% | 0.2% |
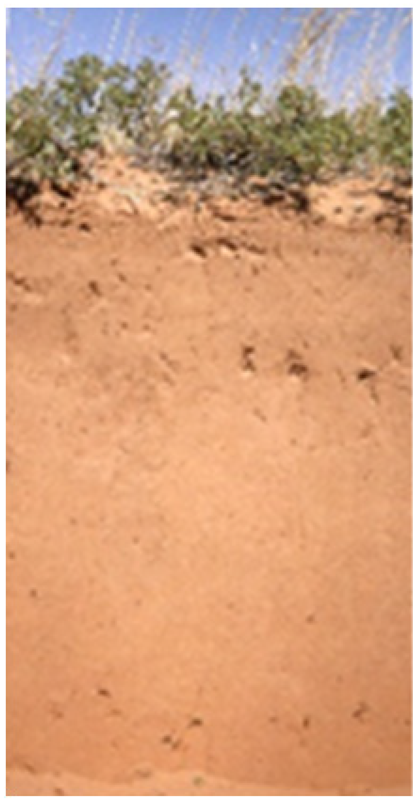 | 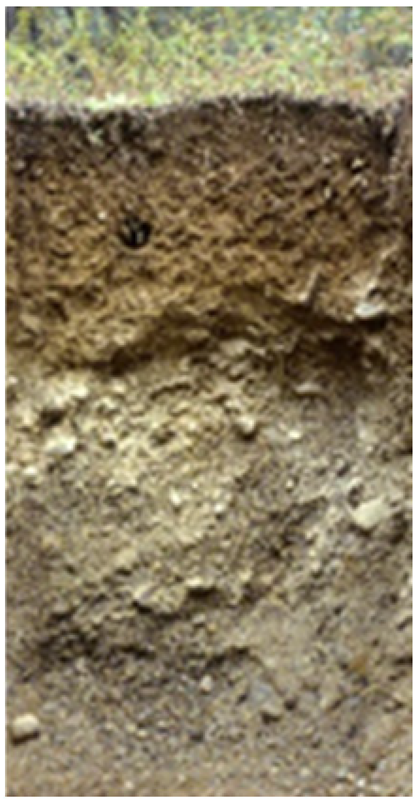 |  |  | 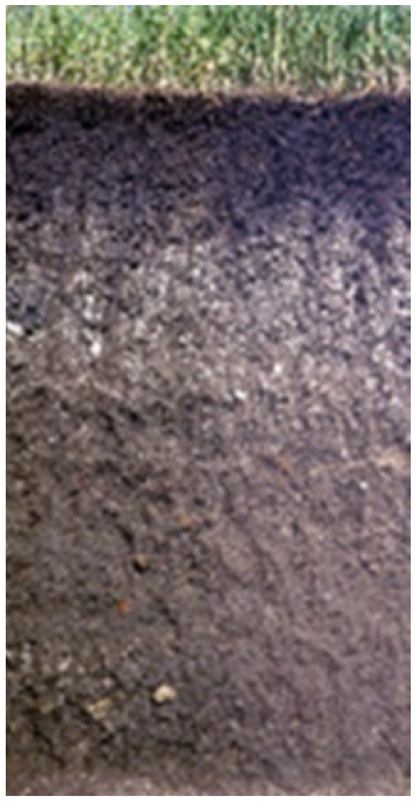 | 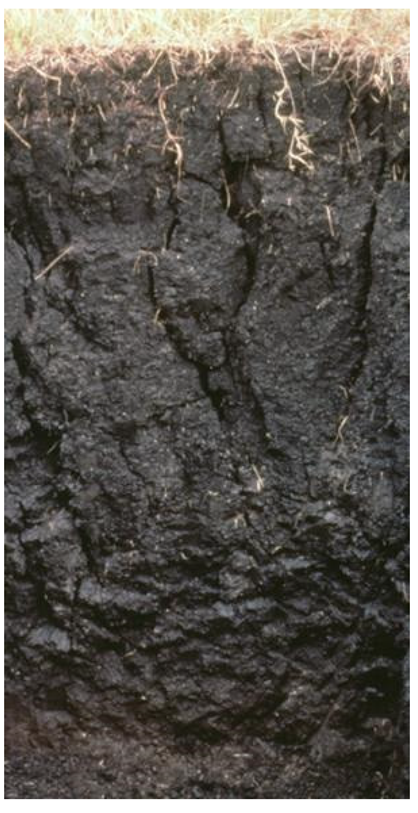 |
| Midpoint storage and social cost of soil organic carbon (SOC): 1.6× 10¹² kg C, $276.4B | |||||
| 7.4 × 10¹⁰ kg | 1.1 × 10¹¹ kg | 2.1 × 10¹⁰ kg | 2.6 × 10¹¹ kg | 1.2 × 10¹² kg | 4.3 × 10⁹ kg |
| $12.4B | $18.1B | $3.5B | $43.3B | $198.3B | $730.8M |
| 4.5% | 6.6% | 1.3% | 15.7% | 71.8% | 0.3% |
| Midpoint storage and social cost of soil inorganic carbon (SIC): 4.7× 10¹¹ kg C, $211.6B | |||||
| 4.4 × 10¹⁰ kg | 4.7 × 10¹⁰ kg | 2.2 × 10¹⁰ kg | 4.0 × 10¹⁰ kg | 1.1 × 10¹¹ kg | 2.1 × 10¹¹ kg |
| $7.5B | $10.4B | $60.8M | $24.5B | $167.9B | $1.2B |
| 3.6% | 4.9% | 0.0% | 11.6% | 79.4% | 0.5% |
| Midpoint storage and social cost of total soil carbon (TSC): 2.1× 10¹² kg C, $488.0B | |||||
| 1.2 × 10¹¹ kg | 1.7 × 10¹¹ kg | 2.1 × 10¹⁰ kg | 4.0 × 10¹¹ kg | 2.2 × 10¹² kg | 1.1 × 10¹⁰ kg |
| $19.9B | $28.5B | $3.6B | $67.8B | $366.2B | $1.9B |
| 4.1% | 5.8% | 0.7% | 13.9% | 75.0% | 0.4% |
| Sensitivity to climate change | |||||
| Low | Low | High | High | High | High |
| SOC and SIC sequestration (recarbonization) potential | |||||
| Low | Low | Low | Low | Low | Low |
| Soil Quality Continuum | ||||||||
|---|---|---|---|---|---|---|---|---|
| NLCD Land Cover Classes (LULC), Dynamic Soil Quality (Soil Health Continuum) | Change in Area, 2001–2016 (%) | Inherent Soil Quality (Soil Suitability) | ||||||
| Lower |  | Higher | ||||||
| Degree of Weathering and Soil Development | ||||||||
| Slight | Moderate | |||||||
| Entisols | Inceptisols | Histosols | Alfisols | Mollisols | Vertisols | |||
| Change in Area, 2001–2016 (%) | ||||||||
| Woody wetlands | Higher | −0.6 | −0.5 | −0.9 | −3.7 | −0.7 | −0.7 | −12.6 |
| Shrub/Scrub |  | 133.7 | 403.8 | 223.5 | 40.0 | 106.3 | 142.7 | 0.0 |
| Mixed forest | 1.2 | 0.5 | 0.9 | 3.2 | 1.6 | 0.8 | 0.0 | |
| Deciduous forest | −0.6 | −1.0 | −1.2 | −4.0 | −0.5 | −0.7 | −10.9 | |
| Herbaceous | −11.5 | −8.0 | −19.3 | −2.7 | −12.5 | −10.1 | 0.9 | |
| Evergreen forest | 1.1 | −0.5 | 0.3 | 0.0 | 2.0 | 0.6 | 0.0 | |
| Emergent herbaceous wetlands | 0.0 | −3.4 | −1.2 | 3.9 | 1.8 | 0.7 | −6.7 | |
| Hay/Pasture | −16.6 | −12.0 | −14.5 | −9.7 | −17.1 | −16.9 | −8.6 | |
| Cultivated crops | 3.4 | 2.1 | 1.9 | 0.9 | 12.6 | 1.8 | 0.1 | |
| Developed, open space | 1.7 | 1.5 | 3.5 | 0.7 | 2.0 | 1.5 | −0.1 | |
| Developed, medium intensity | 28.8 | 24.1 | 58.4 | 13.7 | 25.3 | 27.9 | 9.5 | |
| Developed, low intensity | 4.4 | 3.8 | 11.1 | 3.3 | 3.7 | 4.1 | 0.4 | |
| Developed, high intensity | 39.4 | 33.3 | 84.2 | 100.0 | 40.0 | 38.3 | 12.2 | |
| Barren land | Lower | 42.8 | 148.1 | −4.6 | 118.5 | 5.5 | 21.9 | 127.3 |
| Soil Quality Continuum | ||||||||
|---|---|---|---|---|---|---|---|---|
| NLCD Land Cover Classes (LULC), Dynamic Soil Quality (Soil Health Continuum) | Inherent Soil Quality (Soil Suitability) | |||||||
| Lower |  | Higher | ||||||
| Degree of Weathering and Soil Development | ||||||||
| Slight | Moderate | |||||||
| Entisols | Inceptisols | Histosols | Alfisols | Mollisols | Vertisols | |||
| Woody wetlands | Higher | Higher | Higher | Higher | Higher | Higher | Higher | |
| Shrub/Scrub |  |  |  |  |  |  |  | |
| Mixed forest | ||||||||
| Deciduous forest | ||||||||
| Herbaceous | ||||||||
| Evergreen forest | ||||||||
| Emergent herbaceous wetlands | ||||||||
| Hay/Pasture | ||||||||
| Cultivated crops | ||||||||
| Developed, open space | ||||||||
| Developed, medium intensity | ||||||||
| Developed, low intensity | ||||||||
| Developed, high intensity | ||||||||
| Barren land | Lower | Lower | Lower | Lower | Lower | Lower | Lower | |
Disclaimer/Publisher’s Note: The statements, opinions and data contained in all publications are solely those of the individual author(s) and contributor(s) and not of MDPI and/or the editor(s). MDPI and/or the editor(s) disclaim responsibility for any injury to people or property resulting from any ideas, methods, instructions or products referred to in the content. |
© 2024 by the authors. Licensee MDPI, Basel, Switzerland. This article is an open access article distributed under the terms and conditions of the Creative Commons Attribution (CC BY) license (https://creativecommons.org/licenses/by/4.0/).
Share and Cite
Mikhailova, E.A.; Zurqani, H.A.; Lin, L.; Hao, Z.; Post, C.J.; Schlautman, M.A.; Post, G.C. Spatiotemporal Analysis of Soil Quality Degradation and Emissions in the State of Iowa (USA). Land 2024, 13, 547. https://doi.org/10.3390/land13040547
Mikhailova EA, Zurqani HA, Lin L, Hao Z, Post CJ, Schlautman MA, Post GC. Spatiotemporal Analysis of Soil Quality Degradation and Emissions in the State of Iowa (USA). Land. 2024; 13(4):547. https://doi.org/10.3390/land13040547
Chicago/Turabian StyleMikhailova, Elena A., Hamdi A. Zurqani, Lili Lin, Zhenbang Hao, Christopher J. Post, Mark A. Schlautman, and Gregory C. Post. 2024. "Spatiotemporal Analysis of Soil Quality Degradation and Emissions in the State of Iowa (USA)" Land 13, no. 4: 547. https://doi.org/10.3390/land13040547