Article

Assessing the Sustainability of Different Small-Scale Livestock Production Systems in the Afar Region, Ethiopia

1
Institute of Agricultural Economics and Social Sciences, Faculty of Agriculture, Chiang Mai University, 239 Huay Kaew Road, Muang District, Chiang Mai 50200, Thailand
2
Institute of Plant Production and Agroecology in the Tropic and Subtropics, University of Hohenheim, Garbenstr. 13, D-70599 Stuttgart, Germany
3
Institute of Agricultural Economics and Social Sciences, Chair of Social and Institutional Change in Agricultural Development, University of Hohenheim, Wollgrasweg 43, D-70599 Stuttgart, Germany
*
Author to whom correspondence should be addressed.
Land 2013, 2(4), 726-755; https://doi.org/10.3390/land2040726
Submission received: 18 September 2013 / Revised: 28 October 2013 / Accepted: 7 November 2013 / Published: 2 December 2013

Abstract

:
Livestock production is a key income source in eastern Africa, and 80% of the total agricultural land is used for livestock herding. Hence, ecological and socio-economically sustainable rangeland management is crucial. Our study aimed at selecting operational economic, environmental and social sustainability indicators for three main pastoral (P), agro-pastoral (AP), and landless intensive (LI) small scale livestock production systems for use in sustainability assessment in Ethiopia. Quantitative and qualitative data were collected through grey literature and semi-structured interviews, assessing livestock and feed resources, production technology, land tenure, financial and gender issues. Our results suggested that feed shortages (FS) are directly related to grazing pressure (G) and inversely related to grass recovery rates (R). According to our indicators, AP was the most sustainable while P and LI were only conditionally sustainable production systems. 93% of 82 interviewees claimed that private land ownership was the best land tenure incentive for efficient rangeland management. Farmers perceived Prosopis juliflora expansion, sporadic rainfall, and disease infestation as the most significant causes for decreasing livestock productivity. Landless intensive farmers had the highest equality in income distribution (Gini Index: GI = 0.4), followed by P and AP (each with a GI = 0.5). Neither educational background nor income seemed to determine grazing species conservation efforts. We claimed that sustainability indicators are valuable tools to highlight shortcomings and strengths of the three main livestock production systems and help with future livestock management in Ethiopia. Selecting suitable indicators, however, is crucial as data requirements and availability can vary across livestock systems.

1. Introduction

The importance of livestock for the subsistence and economic development of Sub-Saharan countries has long been recognized [1]. Ethiopia has the largest livestock population in Africa [2] and the 10th largest worldwide [3]. Ethiopia’s crop-livestock farming systems account for 75%–80% of cattle and 30% of goats in Ethiopia [4]. However, livestock performance has been poor, as no appropriate support and interventions have been delivered that address the expansion of opportunities for rural households [5,6,7]. Further, the growing population in developing countries, coupled with tenure insecurity or the absence of clear property rights, has increased the demand for land and its resources [8,9]. By 2050 the world’s population will reach 9.1 billion, 34% higher than today and nearly all of this population increase will occur in developing countries where urbanization will continue at an accelerated pace, and about 70% of the world’s population will be urban (compared to 49% today); income levels will be many multiples of what they are now. In order to feed this larger, more urban and richer population (excluding food used for bio-fuels), production must increase by 70% [10], particularly in the livestock sector. Such developments and increase in food production must not occur at the expense of future generations own capacity to feed themselves [11]. Therefore, a scientific assessment of the sustainability of the different livestock production systems is vital towards understanding the strengths and weaknesses associated with resource use for livestock production within these systems in an effort to increase food production in a sustainable way.

1.1. Livestock Production Systems

Livestock production systems are generally classified into grassland based systems where 90% of feed resources are from open grassland and 10% comes from crops, i.e., grazing ruminants are the dominant form of land use typical of pastoralist and agro-pastoralist in sub Saharan Africa, mixed rain fed systems characterized by annual irrigation and crop cultivation typical of North Africa and finally the landless systems which are intensive in developed countries like North America, Germany and extensive in North Africa [12]. Classification criteria for these systems include agro-ecological zone, integration with crop production, animal-land relationships and intensity of production [12].
Pastoralism (P) dominates arid and semi-arid areas [12] and is characterized by mobility, often using communal grazing land under common property tenure (nomadism or transhumance; [13]).
The agro-pastoral system (AP) represents a more sedentary form of pastoralism, in which herders practice crop cultivation in areas close to open water to diversify their means of production [6]. Agro-pastoral systems have successfully connected sedentary and mobile communities because of the ethno linguistic similarity with pastoralist as they often act as brokers in establishing cattle-tracks, negotiating the camping of herds on farms, exchanges of crop residues for valuable manure, and arranging for animal use in crop production like plowing [14,15], highlighting the importance of this system.
The landless intensive (LI) system is common and has become increasingly important among younger generations who have not yet purchased or been allocated land by their parents and among people living in urban and peri-urban areas [16]. Most of the farmers in this system live in urban centers have only a few animals grazing freely and often fed by tethering in communal areas like under trees in home compounds and road sides with a few feeding on private land [17,18]. Feed is supplied from outside the farm, thus separating decisions concerning feed use from decisions of feed production, and from decisions of manure utilization on fields to produce feed and/or cash crops, which results in open nutrient flows [19].
Since all three systems (P, AP, and LI) differ in their forage resources and land use, their economic and ecological sustainability might also vary strongly, an aspect that needs to be taken into account when addressing the future potential of livestock production in Ethiopia, a region of scarce natural resources.

1.2. Sustainability

Sustainable development requires appropriate management, technological and institutional changes and the conservation of basic natural resources [20]. The concept of sustainable development combines environmental goals, especially ensuring resource availability, avoiding negative environmental impacts, and maintaining biodiversity with economic goals, especially economic viability, and social goals, especially social justice [21,22], which have to be pursued simultaneously [23,24]. Although sustainability cannot be measured directly, assessments of sustainability can be made with regard to the performance and direction of the processes that control the functions of a given system at a specific location [21].
Sustainability indicators provide direct or indirect information about the future viability of a system with regard to specified levels of material welfare, environmental quality, and natural amenity [25,26,27] across biophysical, economic and social dimensions [28]. For agricultural land use systems, [29] proposed as environmental indicators the use of fertilizers and pesticides, water use efficiency, the use of external inputs, ground water quality, soil erosion, per capita losses due to disasters and a multi-cropping index; economic indicators comprised the total agricultural production, per capita food production and net farm income; social indicators included per capita food supply, land tax and participation in decision making. Most of these indicators were also proposed by [30]. Such indicators vary across studies depending on the main objectives of the research and the characteristics of the farming systems under consideration and their environment. Moreover, agricultural sustainability is not precisely measurable, primarily because externalities are inherent in any agricultural system [31]. The major challenge to implementing the above framework is the lack of comprehensive data sets to analyze the sustainability of key production systems and to identifying the time at which trends can be visible and estimated [32]. A precise measurement of sustainability is also impossible because it is site-specific and a dynamic concept [33] and depends on the perspectives of the analysts [34]. However, using sustainability indicators can help identify trends in agriculture [31] and point out shortcomings in knowledge and data collection. The most useful indicators are those that display high sensitivity to a particular and perhaps subtle stress, thereby serving as an early indicator of reduced system integrity; other indicators may respond to major changes in the system. With such sensitive indicators, up and down trends are more easily captured, which makes it possible to propose remedy actions early [35].
The lack of a standardized set of operational indicators for determining the sustainability of livestock farming systems [36] prompted us to select a cluster of indicators that are suitable to assess the sustainability of the three livestock production systems. We selected indicators within the environmental, economic and social dimensions that were operational and measurable, sensitive to a wide range of conditions, changing over time and easy to understand [24]; the selected indicators have been shown to be relevant to the functioning of different livestock farming systems and directly responsible for their stability with respect to productivity, reliability, gender equality, resilience and autonomy [37,38,39]. While the indicators could not completely cover farm system externalities [31], meaning they were only partial, they were however deemed to be useful in highlighting areas of most desired interventions for future sustainable livestock production trends.
These indicators were then used to assess the sustainability of the respective livestock farming systems. Additionally, we also investigated
(i)
the relationship between rainfall and the growth of livestock numbers
(ii)
land tenure and grazing field management
in a supplementary effort to explain how some of these indicators are related to farm system processes. We expected agro-pastoralists to enjoy the highest levels of social and economic welfare as their various crop and livestock resources can withstand adverse environmental, economic and social conditions. However, this land use system was also expected to engage in pesticide use, thereby affecting environmental stability. Our study was conducted in north-eastern Ethiopia, where all three livestock production systems were present.

2. Materials and Methods

2.1. Study Site

Amibara district is located in the Afar region, northeastern Ethiopia comprising about 2,000 km2 of land at an average altitude of 740 m asl as shown in Figure 1 below. The population density is 32 inhabitants∙km−2 [40]. Average annual rainfall from 2007 to 2011 was 563 mm [41] and average yearly temperatures are 25 °C [42]. The spatial heterogeneity is composed of Acacia woodland, grassland, open bush and shrub land, desert grass, riparian vegetation, wetland, rock desert, seasonal marsh and bare land [43] within an averagely lowland area. In this semi-arid region, rangelands were principally rain fed and we, thus, regressed livestock numbers from 2007 to 2011 against rainfall. We further conducted formal and informal surveys with participatory rural appraisal to collect primary and secondary data. Our surveys lasted 3.5 months through November 2011 to February 2012, followed by data analysis, which lasted for the next 8 months followed by a 30 min defense at the conference room of the Institute of Agriculture in the Tropics and Subtropics of the University of Hohenheim. Further analysis lasted 15 months before the publishing of our results. Of the 13,729 households listed in the Amibara district, 44% were urban dwellers [40], most of which were not keeping livestock. From the remaining 66% we randomly selected 82 respondents that could be categorized into the three livestock production systems classified by [44]; hence, we randomly selected thirty, thirty-one and twenty-one households out of the agro-pastoral (AP), pastoral (P) and landless intensive (LI) systems, respectively, that covered most of the characteristics of small scale farmers according to [44]. Selection was done at the level of “Kebales” (lowest administrative unit in Ethiopia); of which some were purely pastoral, others agro-pastoral and the Melka-Werer and Awash Arba peri-urban areas provided the sample of landless intensive livestock farmers. Pastoralists constituted livestock herders who had permanent settlements within the district, with their livelihoods fully dependent on livestock herding although some acted as middle men in livestock trade. Members of pure pastoral households were also engaged in other income sources for their livelihood security like trade, security services and wage labor [45,46,47] with livestock farming central to their lifestyles and survival. Agro-pastoralists were basically those Ps who had adopted a sedentary form of life and now diversified their reliance on livestock to crop and fruit trees cultivation while the LIs comprised peri-urban dwellers who had no land and relied mainly on civil service, wage labor or other form of employment while tethering a few animals in communal land. Further, one key informant was selected per farming system by elderly and experienced community leaders, who together assisted in the systematic selection of small scale farmers and in assembling them for group interviews. One group discussions per farming system was conducted, with each bringing together a minimum of 15 farmers and experts without overlaps (such as successful and relatively educated farmers recognized by the community) who operated small scale livestock farming units. We further conducted observations and discussions with extension officials and local researchers. Secondary data were obtained from NGOs, government agencies (CSA), community cooperative records and the Ethiopian Agricultural and Research Organization (EARO) in Melka-Were, Ethiopia.
Following the approach developed by [48], indicators and their thresholds or reference values were discussed in group interviews with farmers to agree on a representative sustainable situation [49]. Both studies adopted the system used by [50], which aimed at assessing environmental, economic and social aspects [51]. The sustainability indicator analysis approach [49] used in this study to assess farm system sustainability is considered a less formal approach with more flexible tools when applied to any country with given specific, environmental, social and economic conditions as opposed to other approaches commonly used by researchers such as the environmental or extended cost benefit analysis (ECBA), multi-criteria decision mechanisms (MCDM) [52]. We selected our indicators such that they proved sensitive to a wide range of conditions and changes over time and readily measurable, reliable and easy to understand ([24,37,38,39]; Table 1). These indicators were checked to meet the characteristics above based on the duration of the study, an understanding of their changing trends, our ability to collect data on them, socio-cultural willingness to provide such data and their direct effects on farm system processes. Still, these indicators remain overtly simplistic and partial because a wide range of interdisciplinary studies will be needed to address and fully quantify all factors affecting farm system sustainability.
Figure 1. Map of Ethiopia, Afar Region and Amibara district. Source: Melka-Werer Livestock Research Center (2011 Archives).
Land 02 00726 g001
Table 1. The different dimensions of sustainability, corresponding indicators, measurement units and the scoring system of the analysis guided by land user’s and local researcher’s experiences.
DimensionIndicator typeUnit of MeasurementScoring System
EnvironmentalWater availabilityRainfall (mm∙yr−1)0%–30% = non-sustainable; 30%–60% = conditionally sustainable, 60%–90%+ = sustainable.
Forage shortageForage available—forage consumed (kg∙household−1)
Biodiversity conservation# grazing plant species present in 1986 and in 2011
Health impactPesticides used (l household−1∙yr−1)
EconomicGross farm incomeincome (ETB household−1∙yr−1)0%–30% = non-sustainable; 30%–60% = conditionally sustainable, 60%–90%+ = sustainable.
Input self sufficiencyLocal versus imported input (ETB household−1∙yr−1)
Savings & investmentTotal income saved & invested (ETB household−1∙yr−1)
SocialGender equalityMale: female ratio in
labor force, agricultural extension programs, community farmer cooperatives, land and productive resource control
0%–30% = non-sustainable; 30%–60% = conditionally sustainable, 60%–90%+ = sustainable.
Income equalityCumulative % income versus cumulative % of households (ETB household−1∙yr−1; Gini Index )
Food distribution# of meals consumed∙day−1∙household−1
Type of land tenure% of land leased
% of land privately owned (titled and non-titled)
% of land communally owned

2.2. Sustainability Indicators

Our indicators were selected based on how operational and measurable they were within the scale and duration of our study. Not all indicator processes could be considered in the frame of this study, e.g., water availability was measured based only on rainfall as the major source of water while no pipe-borne or underground water was measured. Other indicators like those proposed by [29] above could not be used because they will require a highly interdisciplinary approach with specialist from different fields of study to obtain accurate measurements. However, changing farm trends were significantly captured in our selected indicators.

2.2.1. Environmental Indicators

We used water and forage availability, biodiversity conservation—related to overgrazing—with respect to grass species lost from the rangelands, and potential health impact from chemical pesticide use as environmental indicators.
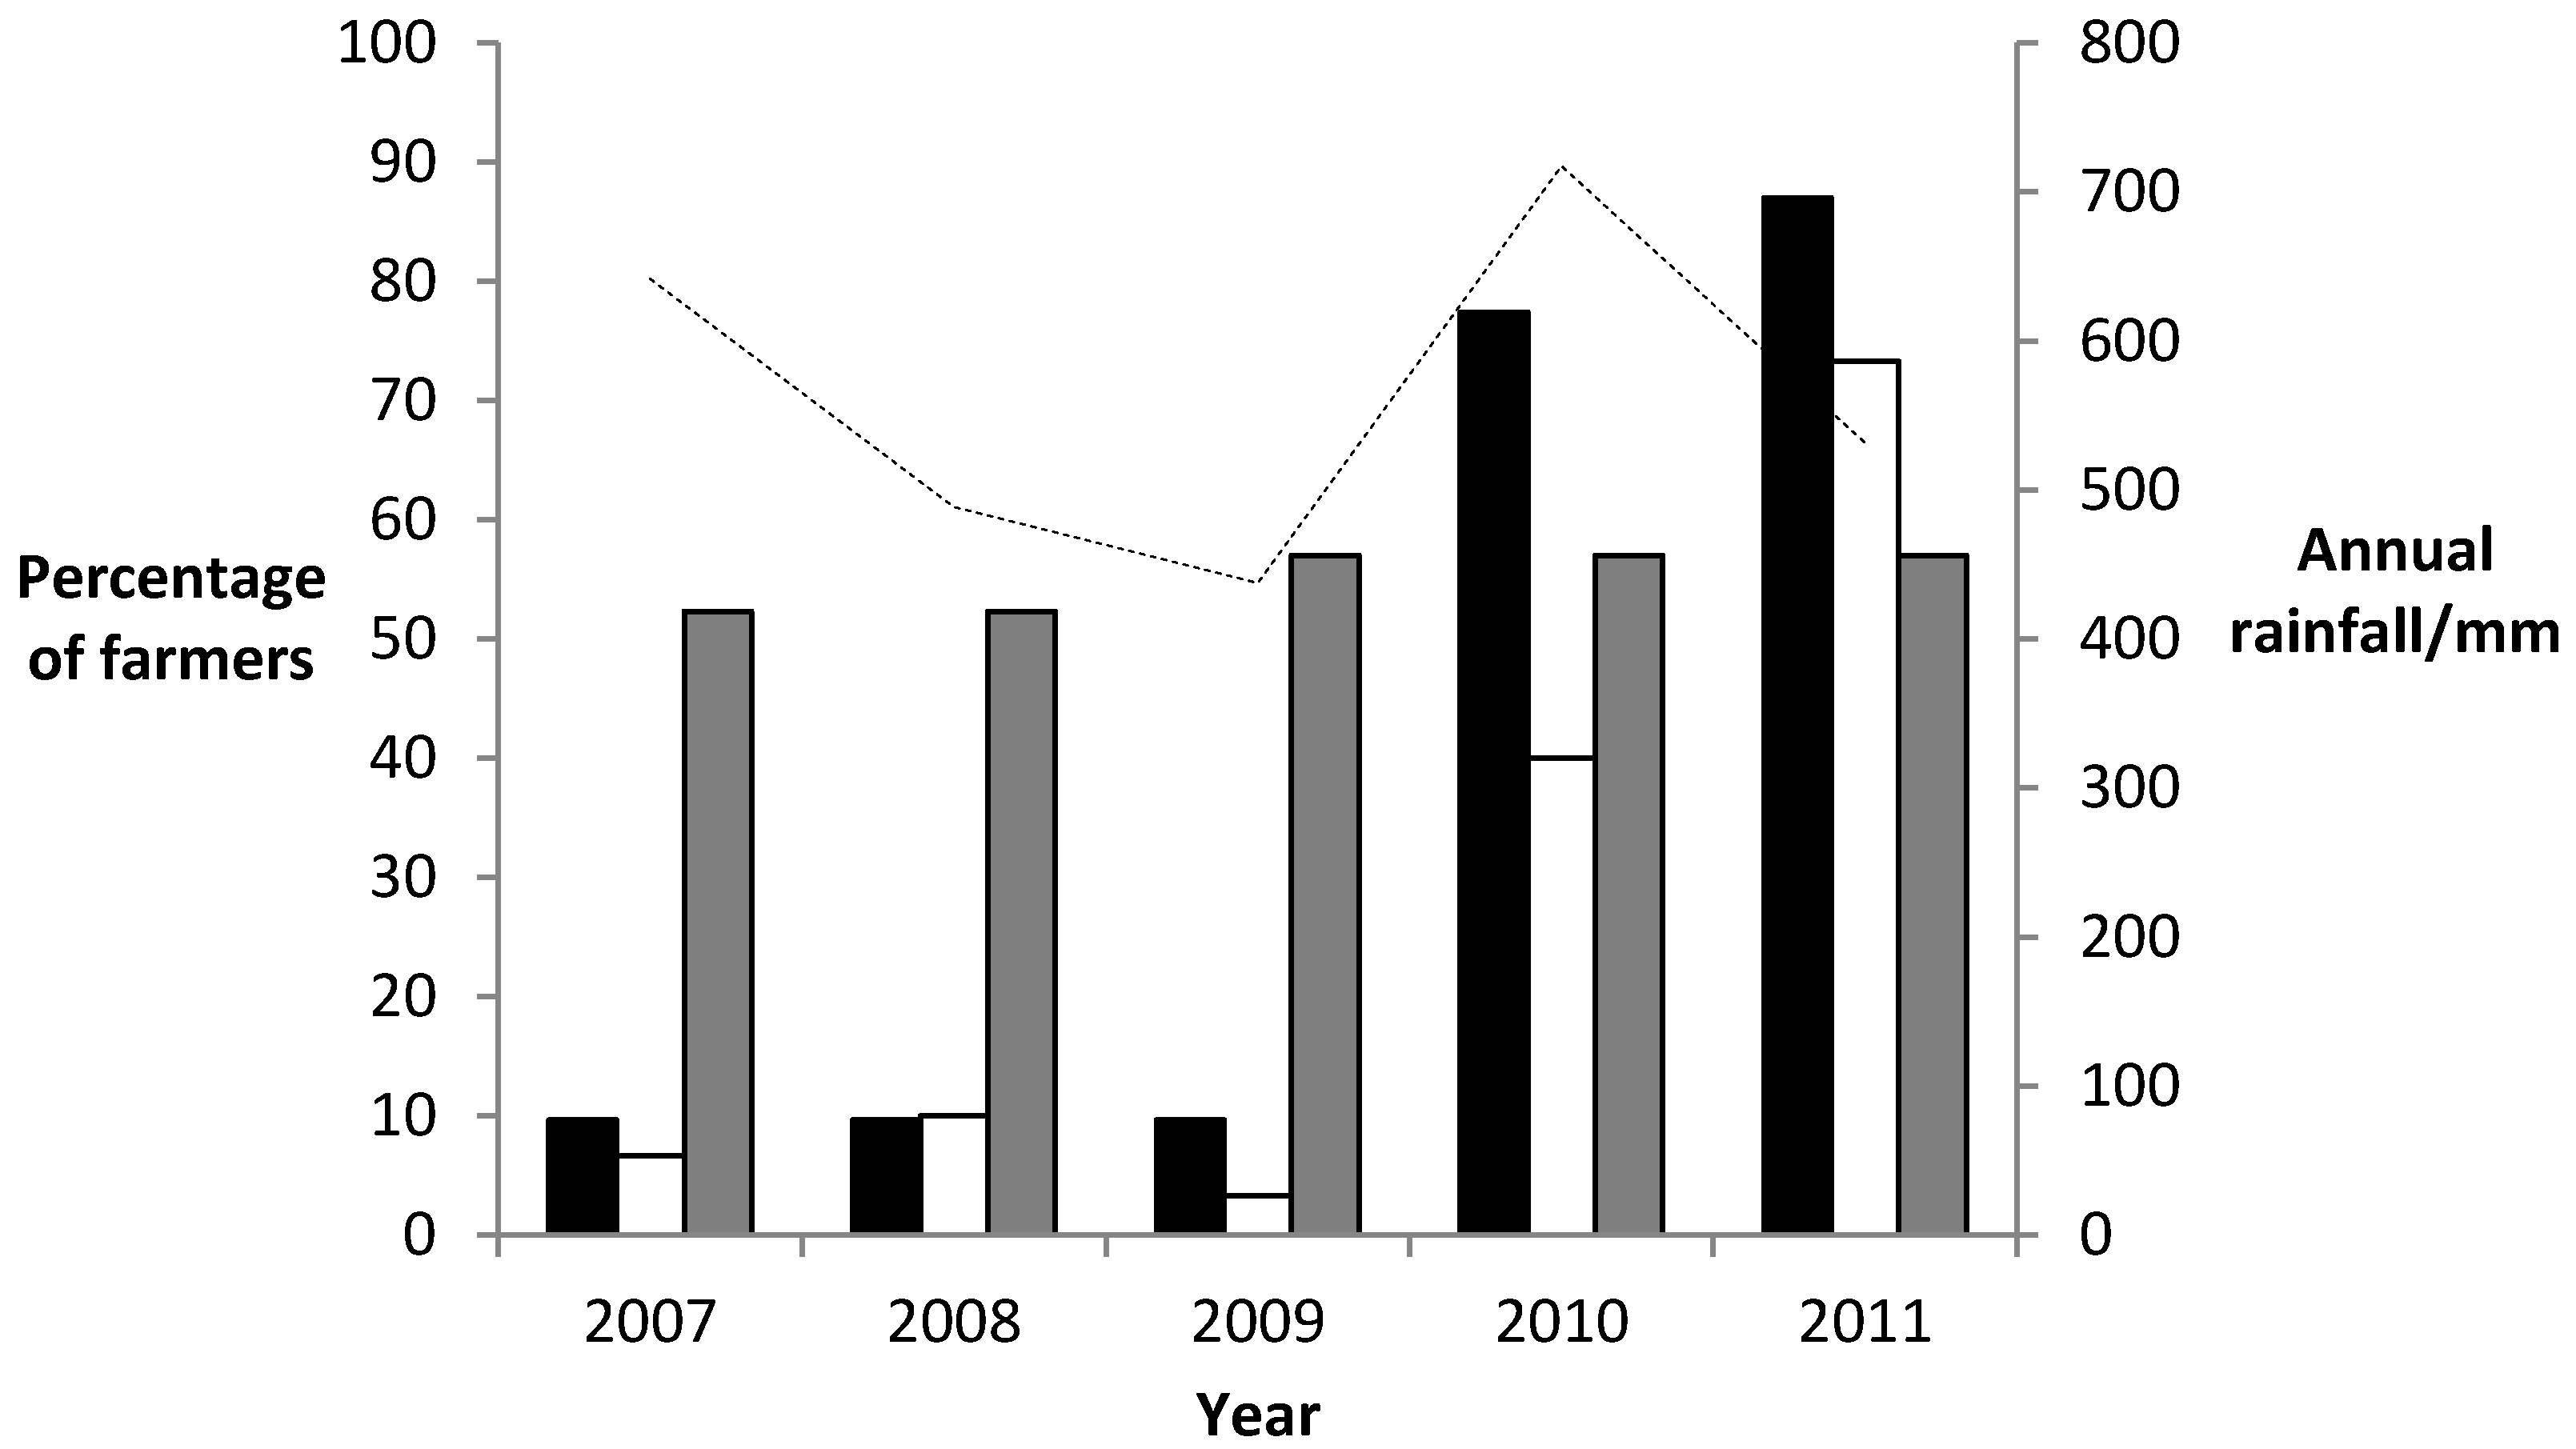
Water availability is crucial for the survival and continuance of any farming system and our assumption here was that all water supplies depended directly on rainfall since the three systems were principally rain fed. All draught effects/water shortages in Ethiopia have been directly related to rainfall deficiency [53]. This explains why we considered rainfall levels as direct measures of water availability although outside the sphere of the farmers influence. Other water sources like pipe borne water, underground water, irrigation canals and distribution patterns were spotted and could potentially undermine this method in cases where farmers could maximize these sources under depleting rainfall conditions. Was this the case in Amibara district and did farmers have those resources and technology if so? Average annual rainfall data over the past five years (2007–2011; [11]) served as direct measures of water availability. In group interviews, farmers indicated years of comprehensive sufficient water availability based on their memory; the average rainfall for these water sufficient years represented the highest sustainable water supply, i.e., received a sustainability score of 90% (Table 1). The assigned 90% threshold is justified through farmers reported experiences as they confirmed optimum water and forage supplies when rainfall is at these levels and further explained that forage shortages and livestock losing weight occurs as rainfall goes below these levels. Accordingly, 60% and 30% of this water availability threshold represented conditionally and non-sustainable water availability conditions, respectively. Rainfall levels as measures of water availability were further supported by local researchers with groups of farmer who acknowledged that any fluctuations in annual rainfall directly affects the level of water flow in the Awash river from which irrigation depends and as such the amount of water irrigated as well as underground water and pipe borne water thereby supporting our claim that rainfall patterns would clearly tell us if water is available or not as farmers have had a very limiting role in controlling water availability other than reliance on rainfall. For the systems to be sustainable water availability must be assessed even if it is beyond the control of the farmer, the issue is whether the water is available for its role or not? We suggest a separate study on how farmers in this region can work to minimize reliability on rainfall as a major water source in an effort to attain sustainable annual water supply in livestock production.
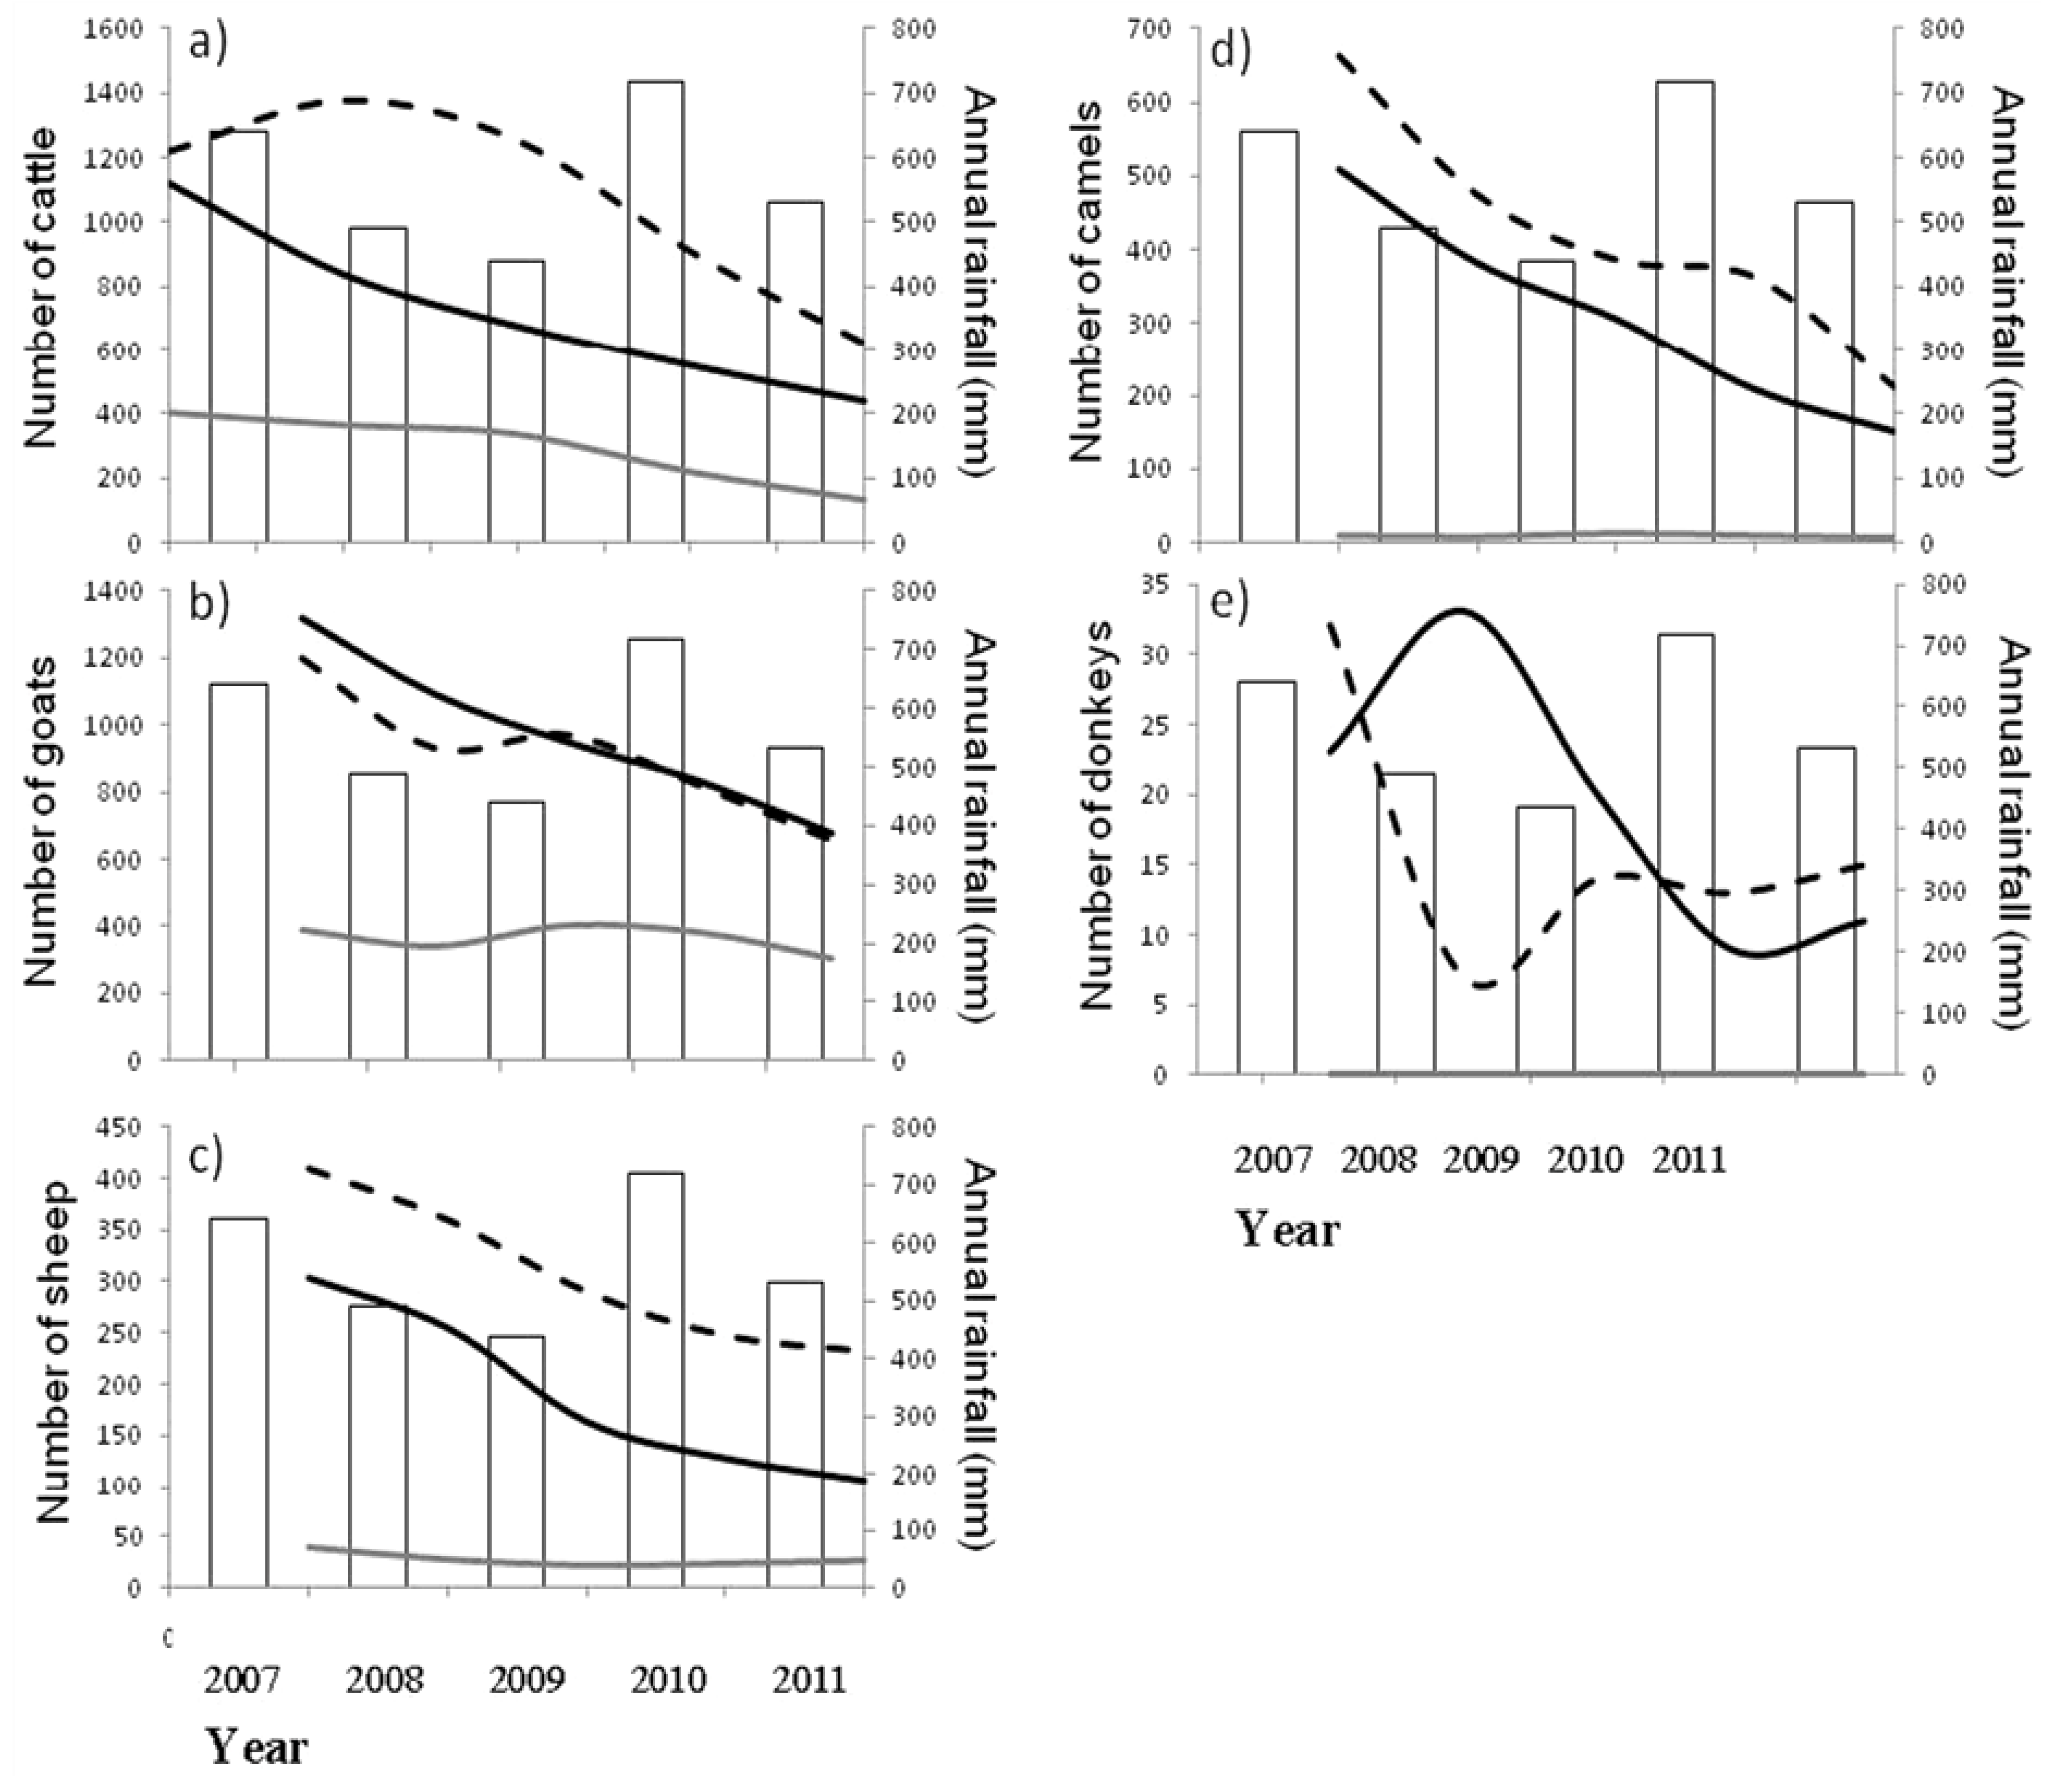
Forage availability for livestock in Ethiopia primarily depends on rangelands, which are strongly determined by rainfall variability across seasons. Forage availability is thus affected by seasonal and annual rainfall patterns as well as the grazing pressure and vegetation recovery rates [
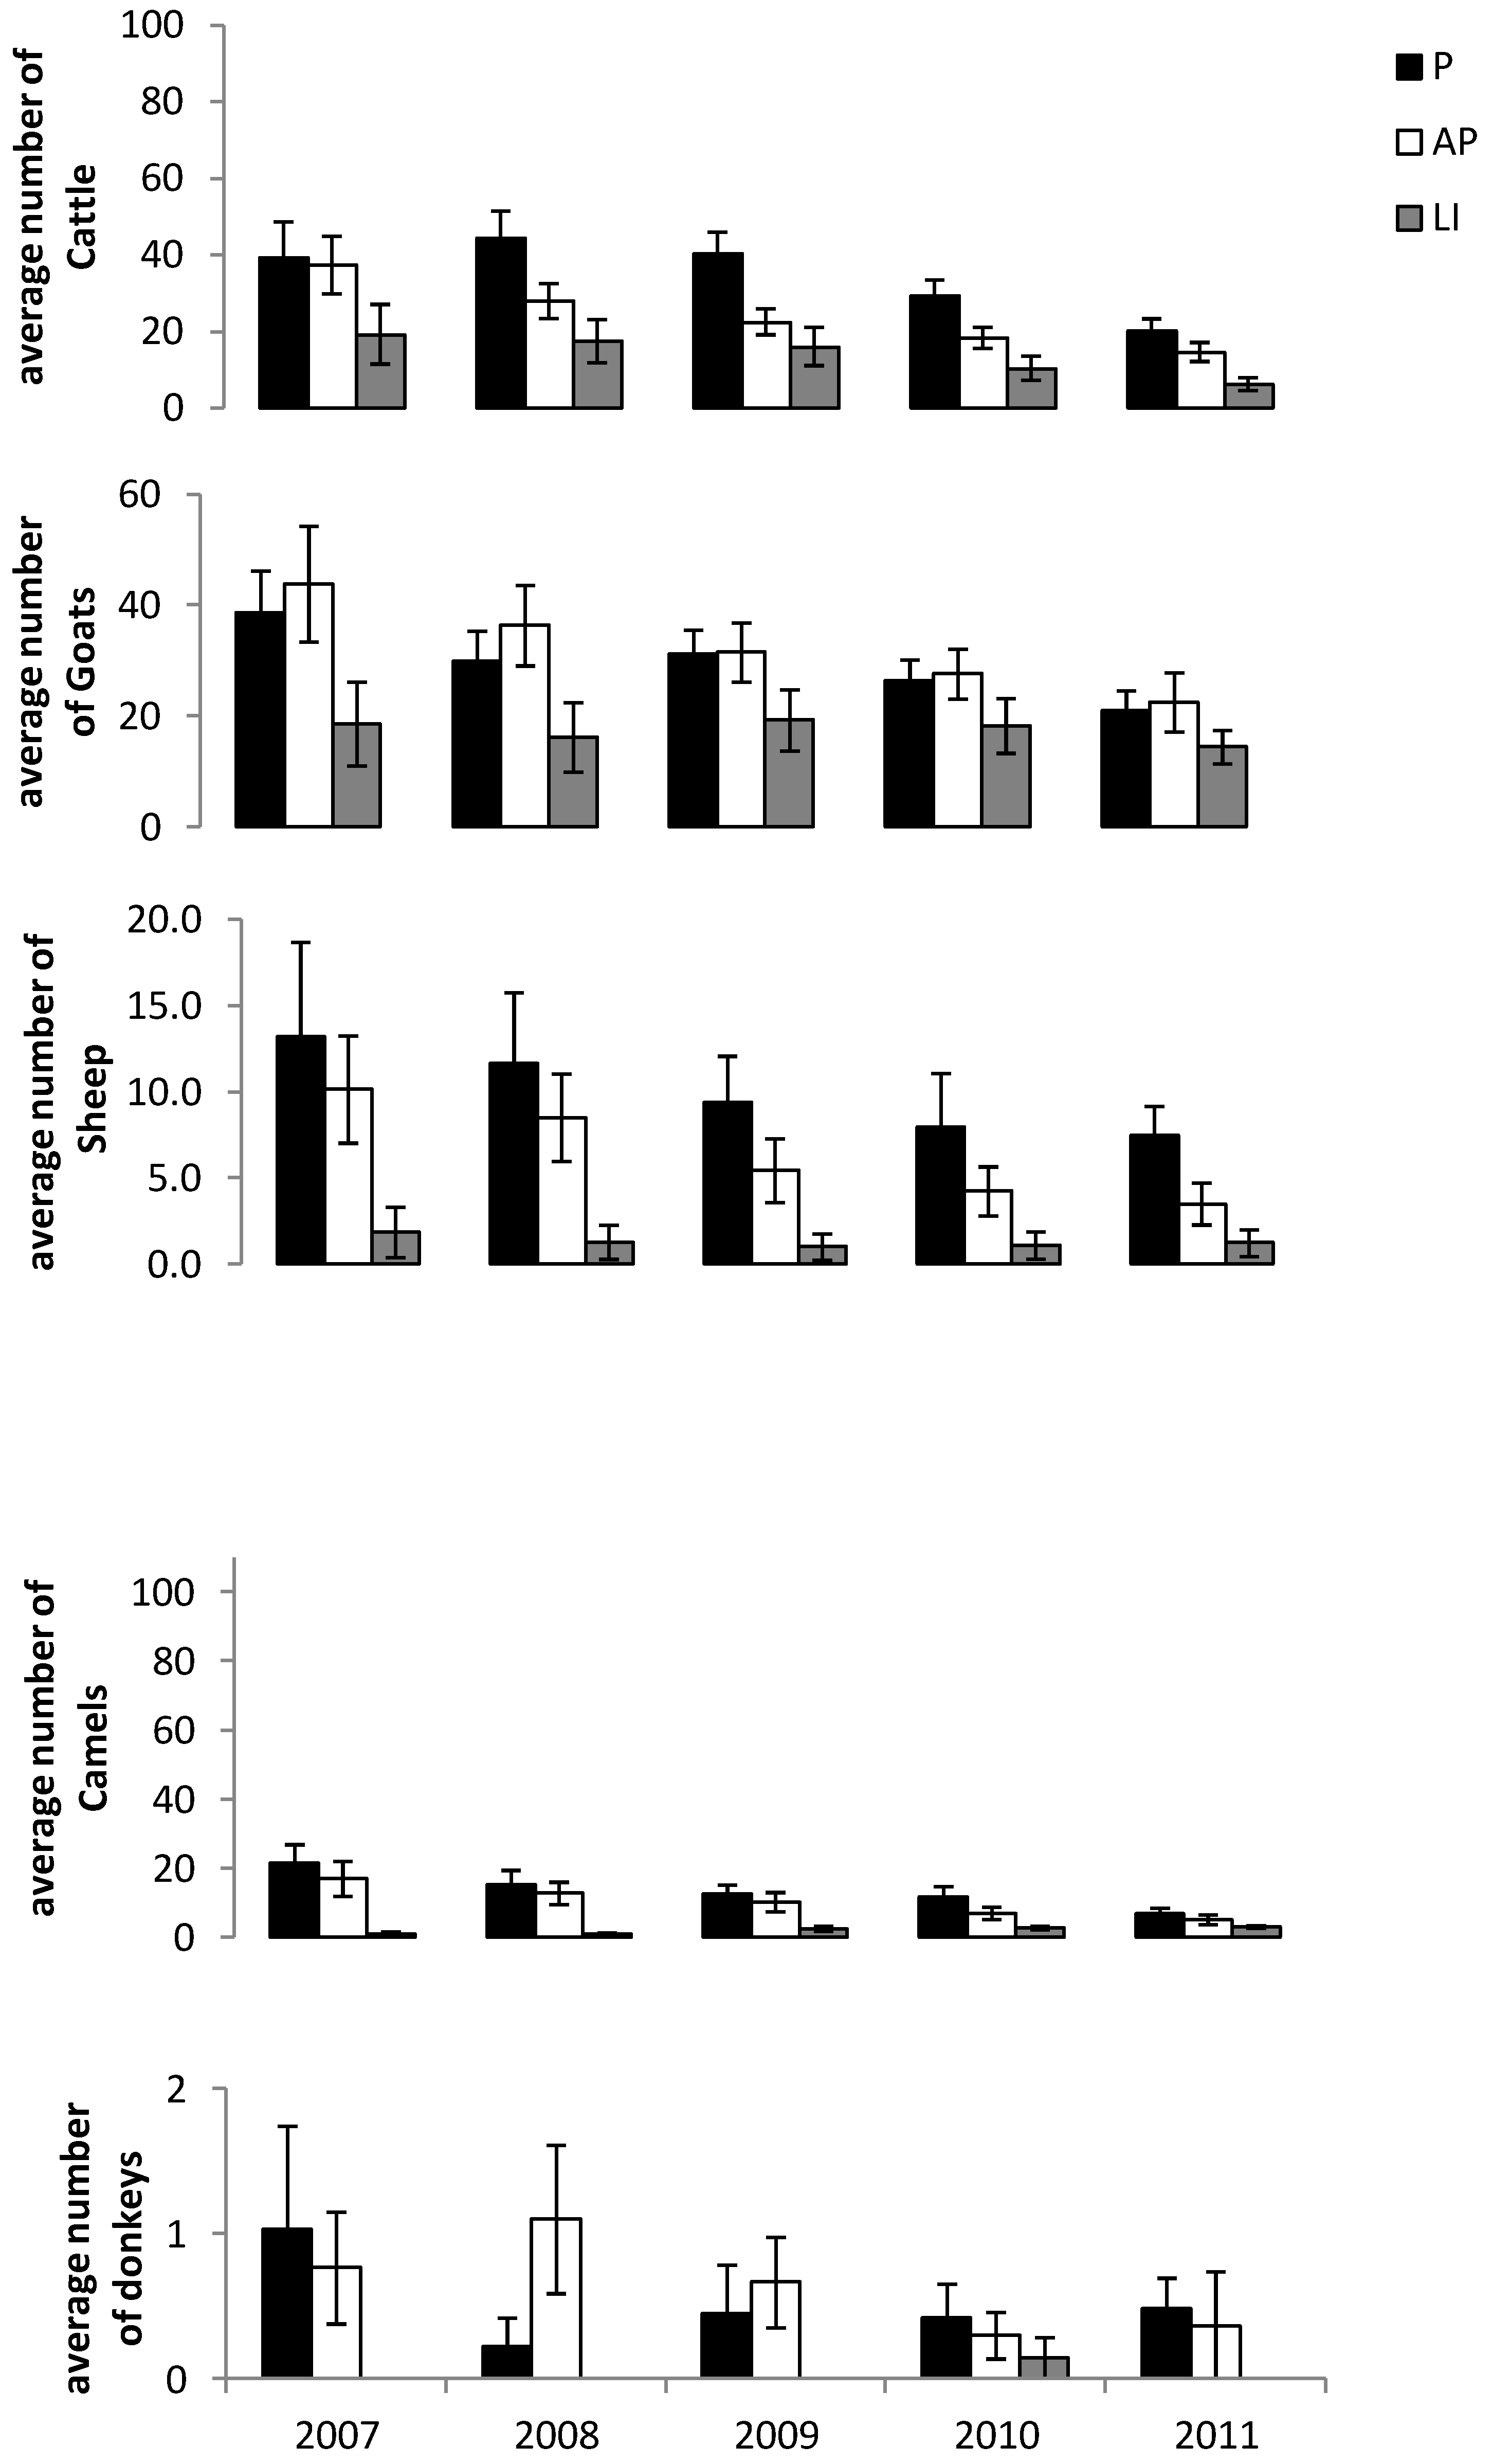
54] implying that forage availability indicators can differ from year to year. The number of livestock per household−1∙yr−1 from 2007 to 2011 was recorded to understand if livestock numbers were increasing or decreasing. Decreasing livestock numbers across households indicates that grazing pressure will not negatively affect forage availability. Drought periods were determined through group interviews where farmers were asked to inform us about the years from 1997 to 2011 during which rainfall was lower than the amount through which farming activities have stabilized over history. Our five year measurement period was small but we claim that this method can be extended back to many years as long as data can be provided. Additionally, establishing a rainfall range in mm to quantify draught was impossible because there is no comprehensive draught index as to whether it is based on precipitation, runoff, evapotranspiration, temperature, soil moisture or crop yield; besides draught conditions in one region may be considered normal in a more arid region or epoch [53]. Hence, average annual forage consumption∙animal−1 for the different livestock species in the dry and wet season were estimated during group discussions with experienced farmers guided by local experienced researchers (from the Melka-Were agricultural research center) who shared and agreed collectively on the estimated amounts in kgs and an average value considered and further used to estimate annual feed shortages. We also investigated if draughts were often limited to the district of our study or stretched to areas where farmers could possibly migrate to mitigate the effects and demonstrate a manifold of coping mechanisms in order to clarify if our forage shortages as estimated could be more credible. Breeding phases within the year were also noted. Each household in our sample provided data on the number of livestock of different species owned such that we could as such estimate her annual forage requirements and that of the farming system referencing from the amount agreed during group interviews to be consumed∙livestock−1∙specie∙day−1 at optimum availability conditions (wet season). Group interviews reported satisfactory forage availability and consumption during the wet season while shortages were explained to be possible only in the dry season or during draught. Our forage shortages were measured on annual basis for the total number of farmers in our sample per system beginning at the household level. We could not measure per farm because all livestock grazed principally on communal land with no farm enclosures and minimal private ownership of land. Thus for each household, our formula for estimated feed shortage (FS) in kg∙yr−1 was:
FS = ((FwFd) × Dd) × G/R
where Fw = estimated kg of forage consumed by livestock∙farmer−1∙day−1 in the wet season, Fd = estimated kg of forage consumed by livestock∙farmer−1∙day−1 in the dry season and Dd = Estimated number of dry days∙yr−1, G = Grazing pressure and R = Grass recovery
The model suggests that the higher the grazing pressure (stocking rates) G, relative to the grass recovery rate R (dependent on rainfall), the higher the feed shortages on rangelands. FS is directly related to G and inversely related to R.
We assumed G/R = 1; while recent studies suggest that most arid and semi-arid rangeland systems encompass elements of both equilibrium and non-equilibrium at different scales [55] in our study. This is because livestock farmers agreed and had practiced some form of rangeland management though weak and ungoverned in which they responded to drought by reducing grazing pressure (by migration to different areas, reliance on manufactured feed or cut and carry) so that the combined pressure of drought and grazing varies as little as possible, the balance of these combined pressures with the succession tendency is maintained, and the position of the vegetation on the condition scale is stabilized [54].
We asked farmers in group interviews to explain their forage availability satisfaction levels from which we were able to stage a reference value for an annual optimum forage consumption/availability (Fo) to represent the full sustainability (upper threshold with score S = 90%); a hypothetical situation from which we were able to calibrate levels of sustainability attained based on realistic conditions. The actual forage consumed∙yr−1 (Fa) was then referenced against Fo.
Biodiversity conservation was measured to reflect patterns of potential overgrazing, which occurs if the ratio of livestock forage demand: supply > 1 [56]. Group interviews including elderly pastoralist and agro pastoralist farmers with some over the ages of seventy who were born into livestock herding, living it as their way of life and key informants noted that many grazing plant species have disappeared on the rangelands between 1986 and 2011. Hence, in group interviews, the number of grazing plant species existing in 1986 was agreed to represent high biodiversity on rangelands (allocated a score of 90%) and this number was then compared to the species available in 2011 to reach current biodiversity sustainability values. Our data was not based on actual field observations but on group interviews guided by expert farmers and experienced native researchers from the Ethiopian Institute of Agricultural Research (Melka-Werer branch). This measurement was undermined by the fact that we were unable to measure the frequency of different grazing species across the years on rangelands as we did not do actual field studies but our results gave us an overview of the frequency of disappearance per species from the rangelands over a 25 year period (1986–2011) which we claim was meaningful. Our data was estimated from three group interviews of P, AP and LI and then aggregated such that the number of observations of each species for 2011 and 1986 ranged from 0 to 3 from which the mean (x), standard error and standard deviations (SD) of the species reported across systems was derived.
Health impact from pesticides. The amount of insecticides (pesticides) and other chemical components can severely impact ground water and, thus, lead to extensive environmental problems and health risks [57]. The term pesticide applies to both crops and livestock and here it refers to “any substance or mixture of substances intended for preventing, destroying or controlling any pest, including vectors of human or animal disease, unwanted species of plant or animals causing harm during or otherwise interfering with the production, processing, storage transport, or marketing of food, agricultural commodities, wood and wood products or animal foodstuffs, or which may be administered to animals for the control of insects, arachnids or other pests in or on their bodies” [58] The bearable threshold for an estimated maximum pesticide amount used (liters∙household−1∙yr−1) that poses insignificant or no side effects was determined through group interviews and key informant surveys engaging local experienced researchers and further allocated a score of 90%. This represented the agreed maximum quantity to be used to obtain sustainability. Livestock of P households were treated against external and internal parasites, with about 0.02 L pesticides∙animal−1 once every two months in the dry season and once every month in the rainy season when disease prevalence was high. A sustainable dry and rainy season usage of pesticides, according to P discussions, was 0.08 L∙animal−1∙yr−1, i.e., 0.16 L∙yr−1 (S = 90%). APs and LIs agreed during group interviews that the estimated recommended maximum average quantity of pesticides to be used was 10 L∙household−1∙yr−1 (S = 90%), which served as a rough threshold while noting that this indicator is obviously a simplified as one would need to consider types and amounts of pesticides used for each application further exposing areas of possible future research.

2.2.2. Economic Indicators

The economic indicators included a measure of farm productivity (net income earned), input self-sufficiency, savings and investments per household.
Gross farm income was calculated as income earned from all produce∙household−1∙yr−1 in Ethiopian Birr [59]. Group interviews estimated the recommended minimum income, which was needed (ETB∙household−1∙yr−1) in order to live a healthy life, which then represented a sustainability score of 90%. Recommended minimum net income as agreed during P group discussions was 36,000 ETB, 20,700 ETB for AP, and 25,000 ETB for LI systems, all representing the upper sustainability threshold (S = 90%).
Input self-sufficiency described the availability and affordability of basic inputs such as pesticides and fertilizers essential for the survival and continuance of all farming systems. “Self Sufficient Agriculture” and low external-input technology (LEIT) can improve farm productivity and innovation in small-scale agriculture through a better use of local resources [57]. Therefore, when local input use was higher than external input use, the system was defined as more sustainable and vice versa. Through group interviews, farmers agreed on the minimum percentage of farm inputs that must be local for sustainability to be guaranteed and a score of 90% was allocated to this minimum. For this indicator we assumed that internal inputs, such as organic manure, are used to an extent that prevents nutrient mining. Data was then collected based on the amount invested into local, imported and total inputs (in ETB); if the ratio local: total inputs ≥ 1, the input self-sufficiency was sustainable and vice versa. The value of local inputs was then expressed as a percentage of the total inputs to determine the sustainability score. For Ps APs and LIs, group discussions identified a high sustainability score (S = 90%) to be reached when a minimum of 95%, 80% and 90% of their inputs were local, respectively, agreeing with the value range also adopted by [50,57].
Savings and Investments, natural capital assets, labor and land combined with social capital has been proven useful for making investments and managing risks [60,61,62]. Group interviews agreed on the minimum savings and investment (ETB∙household−1∙yr−1) needed to sustain and improve production and we allocated a score of 90% to this amount. Pastoralist, AP and LI group discussions recommended a minimum investment value of 1,000 ETB, 15,000 ETB, and 20,000 ETB, respectively. While for savings, P, AP and LI recommended 0 ETB, 10,000 ETB, and 10,000 ETB, respectively. Farmer’s average savings were compared to the recommended amounts to determine the sustainability score per system.

2.2.3. Social Indicators

The social indicators included land tenure, gender equality and equality in income and food distribution.
Land tenure. Land tenure reflects trends in land reforms, which have often been the cause of social conflicts [63]. When ownership of land is largely communal, this implies fewer incentives for efficient land management [64] if institutions for sustainable use of communal resources are not well developed [65]. Often, institutional or government control can mitigate mismanagement of communal land [64]. We also investigated how strongly other land tenure systems such as leasing, registered and unregistered private ownership [66] could motivate famers across the P, AP and LI systems to manage their rangelands in a sustainable way [
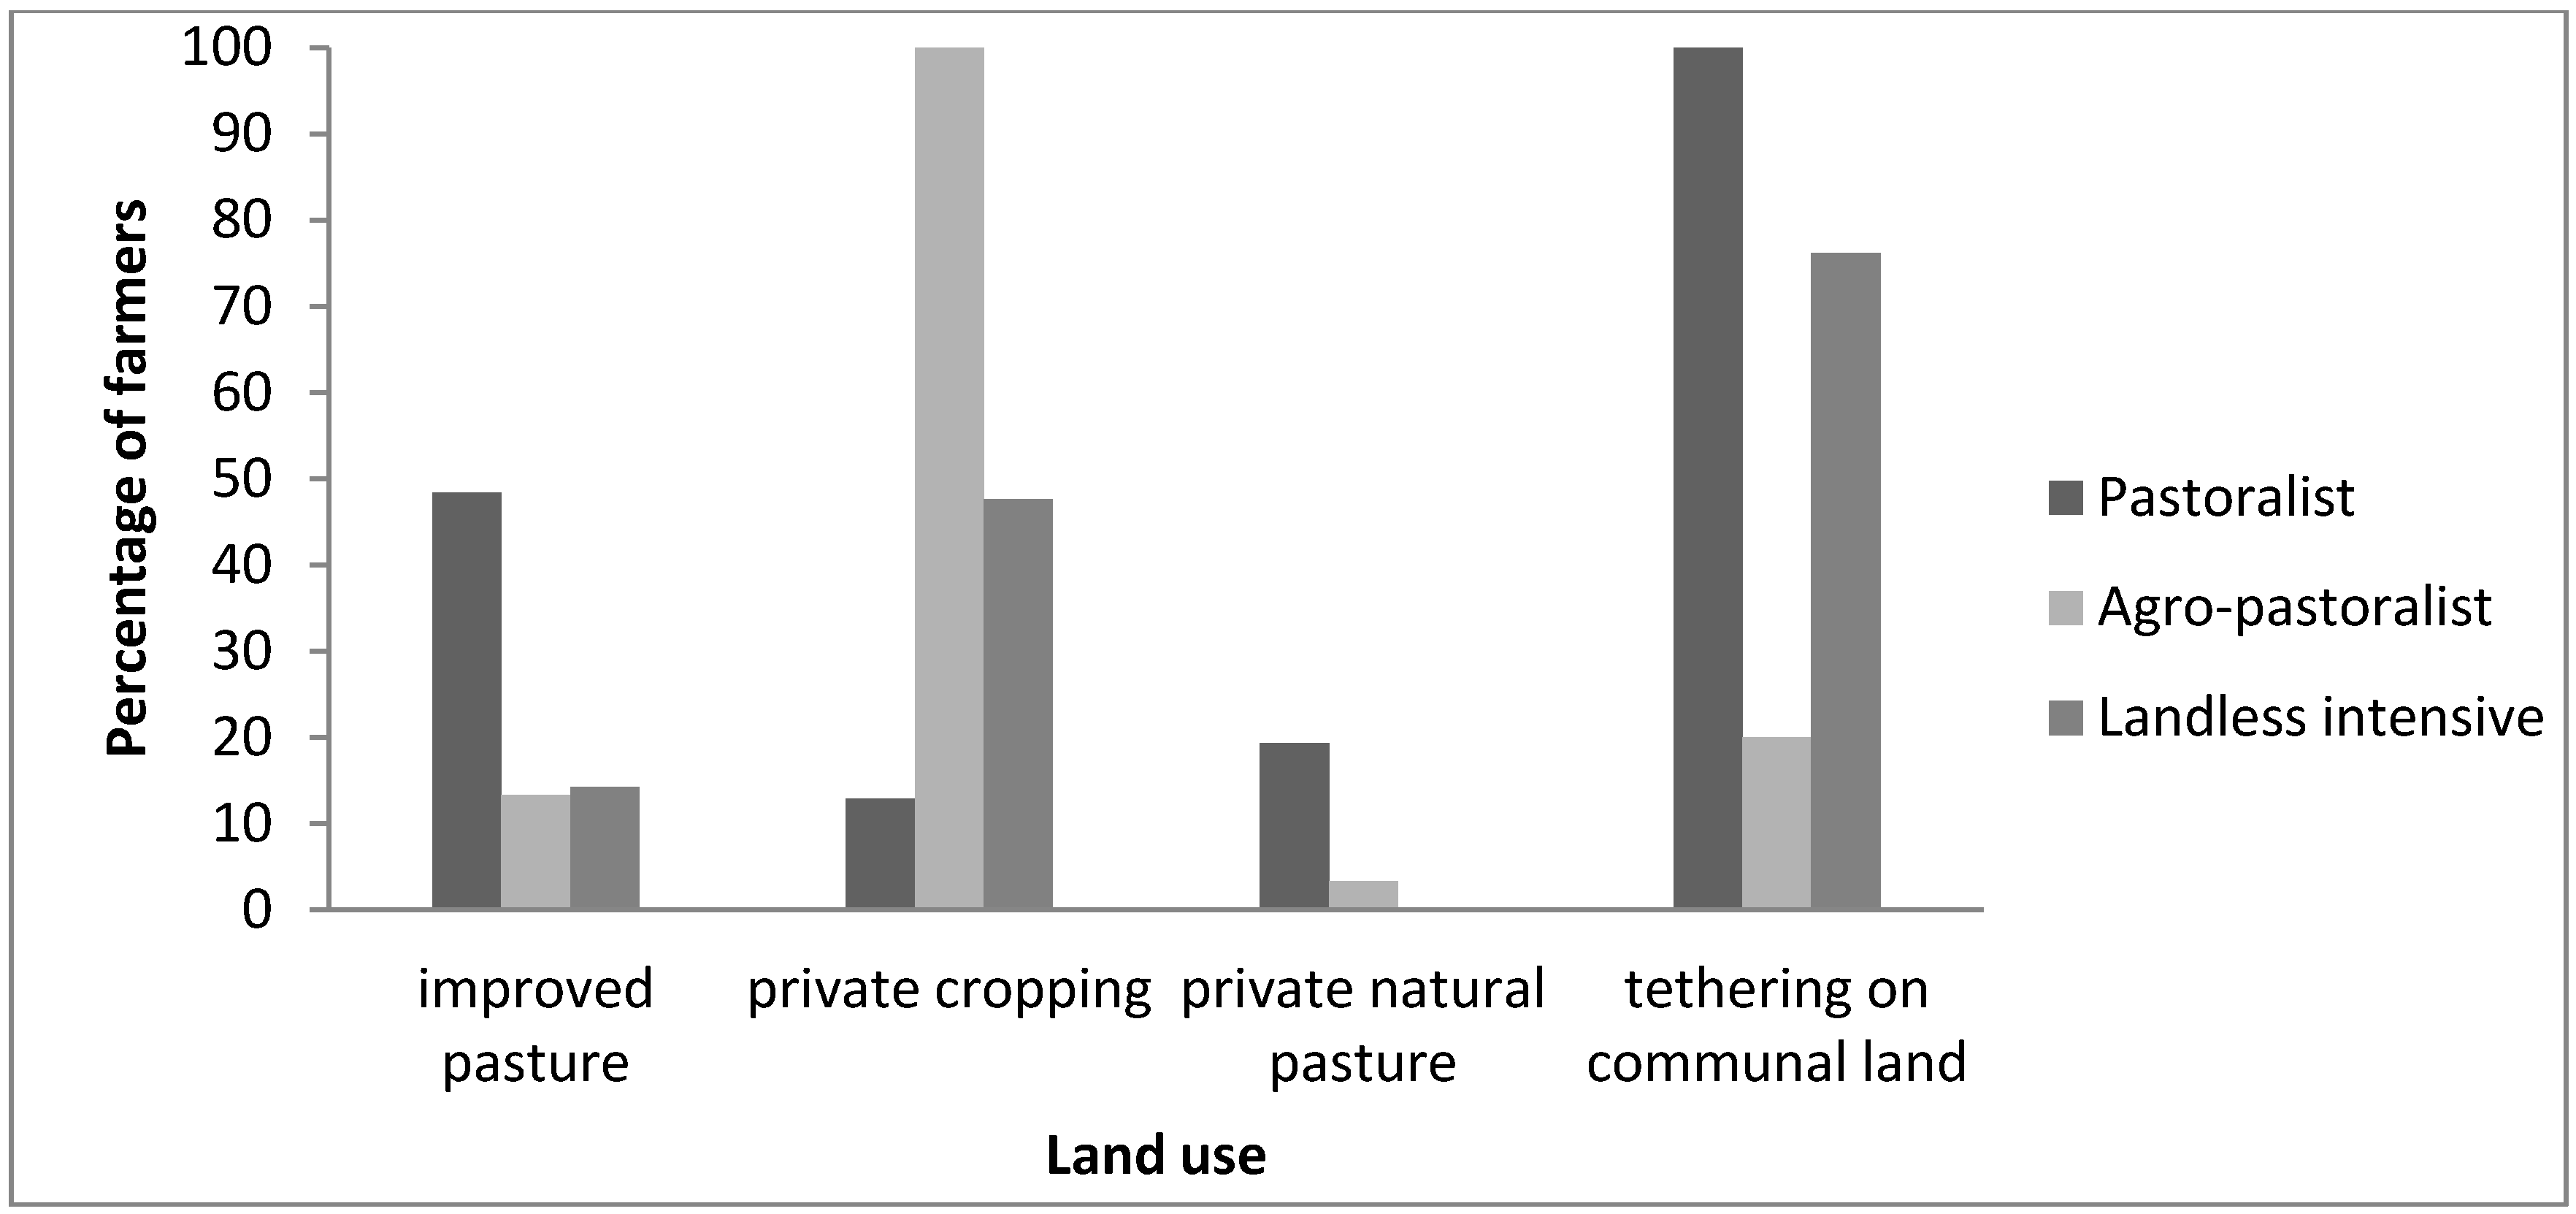
67], taking political, economic and social motivations into account. Group discussions in all three livestock systems constantly agreed that leasing land would moderately encourage proper management (C = 60% if 100% of the land would be leased), private registered/unregistered land would be most sustainable (S = 90%) and communal land provides least incentive to manage resources in a sustainable way (N = 30%). We also sought to understand if this agreement on incentives from land tenure across the three systems was uniform and the reasons behind this consensus. The average annual percentages of private unregistered, private registered, leased, and communal land under use by each household across all systems were noted through participatory interviews (by partnering with respondents and engaging them in creative responses that details their knowhow and experiences on land tenure issues). The percentages of land under the different tenure regimes was summed to obtain the overall sustainability score for land tenure.
Gender equality (GE) in decision making within the household is important for full exploitation of the potentials of men and women in small scale family production units [68]. Women are often alienated from the decision making process and resource control in the household [59]. Trends towards embracing this balance are a strong indicator of social sustainability regarding farm labor, resource control, education and training, and representation in community cooperative. A male: female ratio of 1, 1.1–2, and >2.1 earned a sustainability score of 90%, 60%, and 30%, respectively. Our assigned percentage scores to respective GE ratios above were based on the underlying argument that where men and women participate equally in control of farm land and all production resources the system becomes more productive and efficient as argued by 68 in which case the GE ratio will be 1 justifying our upper sustainability threshold of 90%. The higher this ratio, the lesser the GE involved and as such the lower the sustainability score. Women and male participants in group discussions and individual participatory interviews were noted in order to ascertain the GE polarity and biases that may arise in data collection
Equality in food distribution and consumption. Increasingly, it is recognized that a secure food supply must be accessible to all members of a society and women’s participation in food security is essential for a sustainable food production system [69]. Group discussions provided recommended three meals per day, which represented the highest sustainability score (90%).
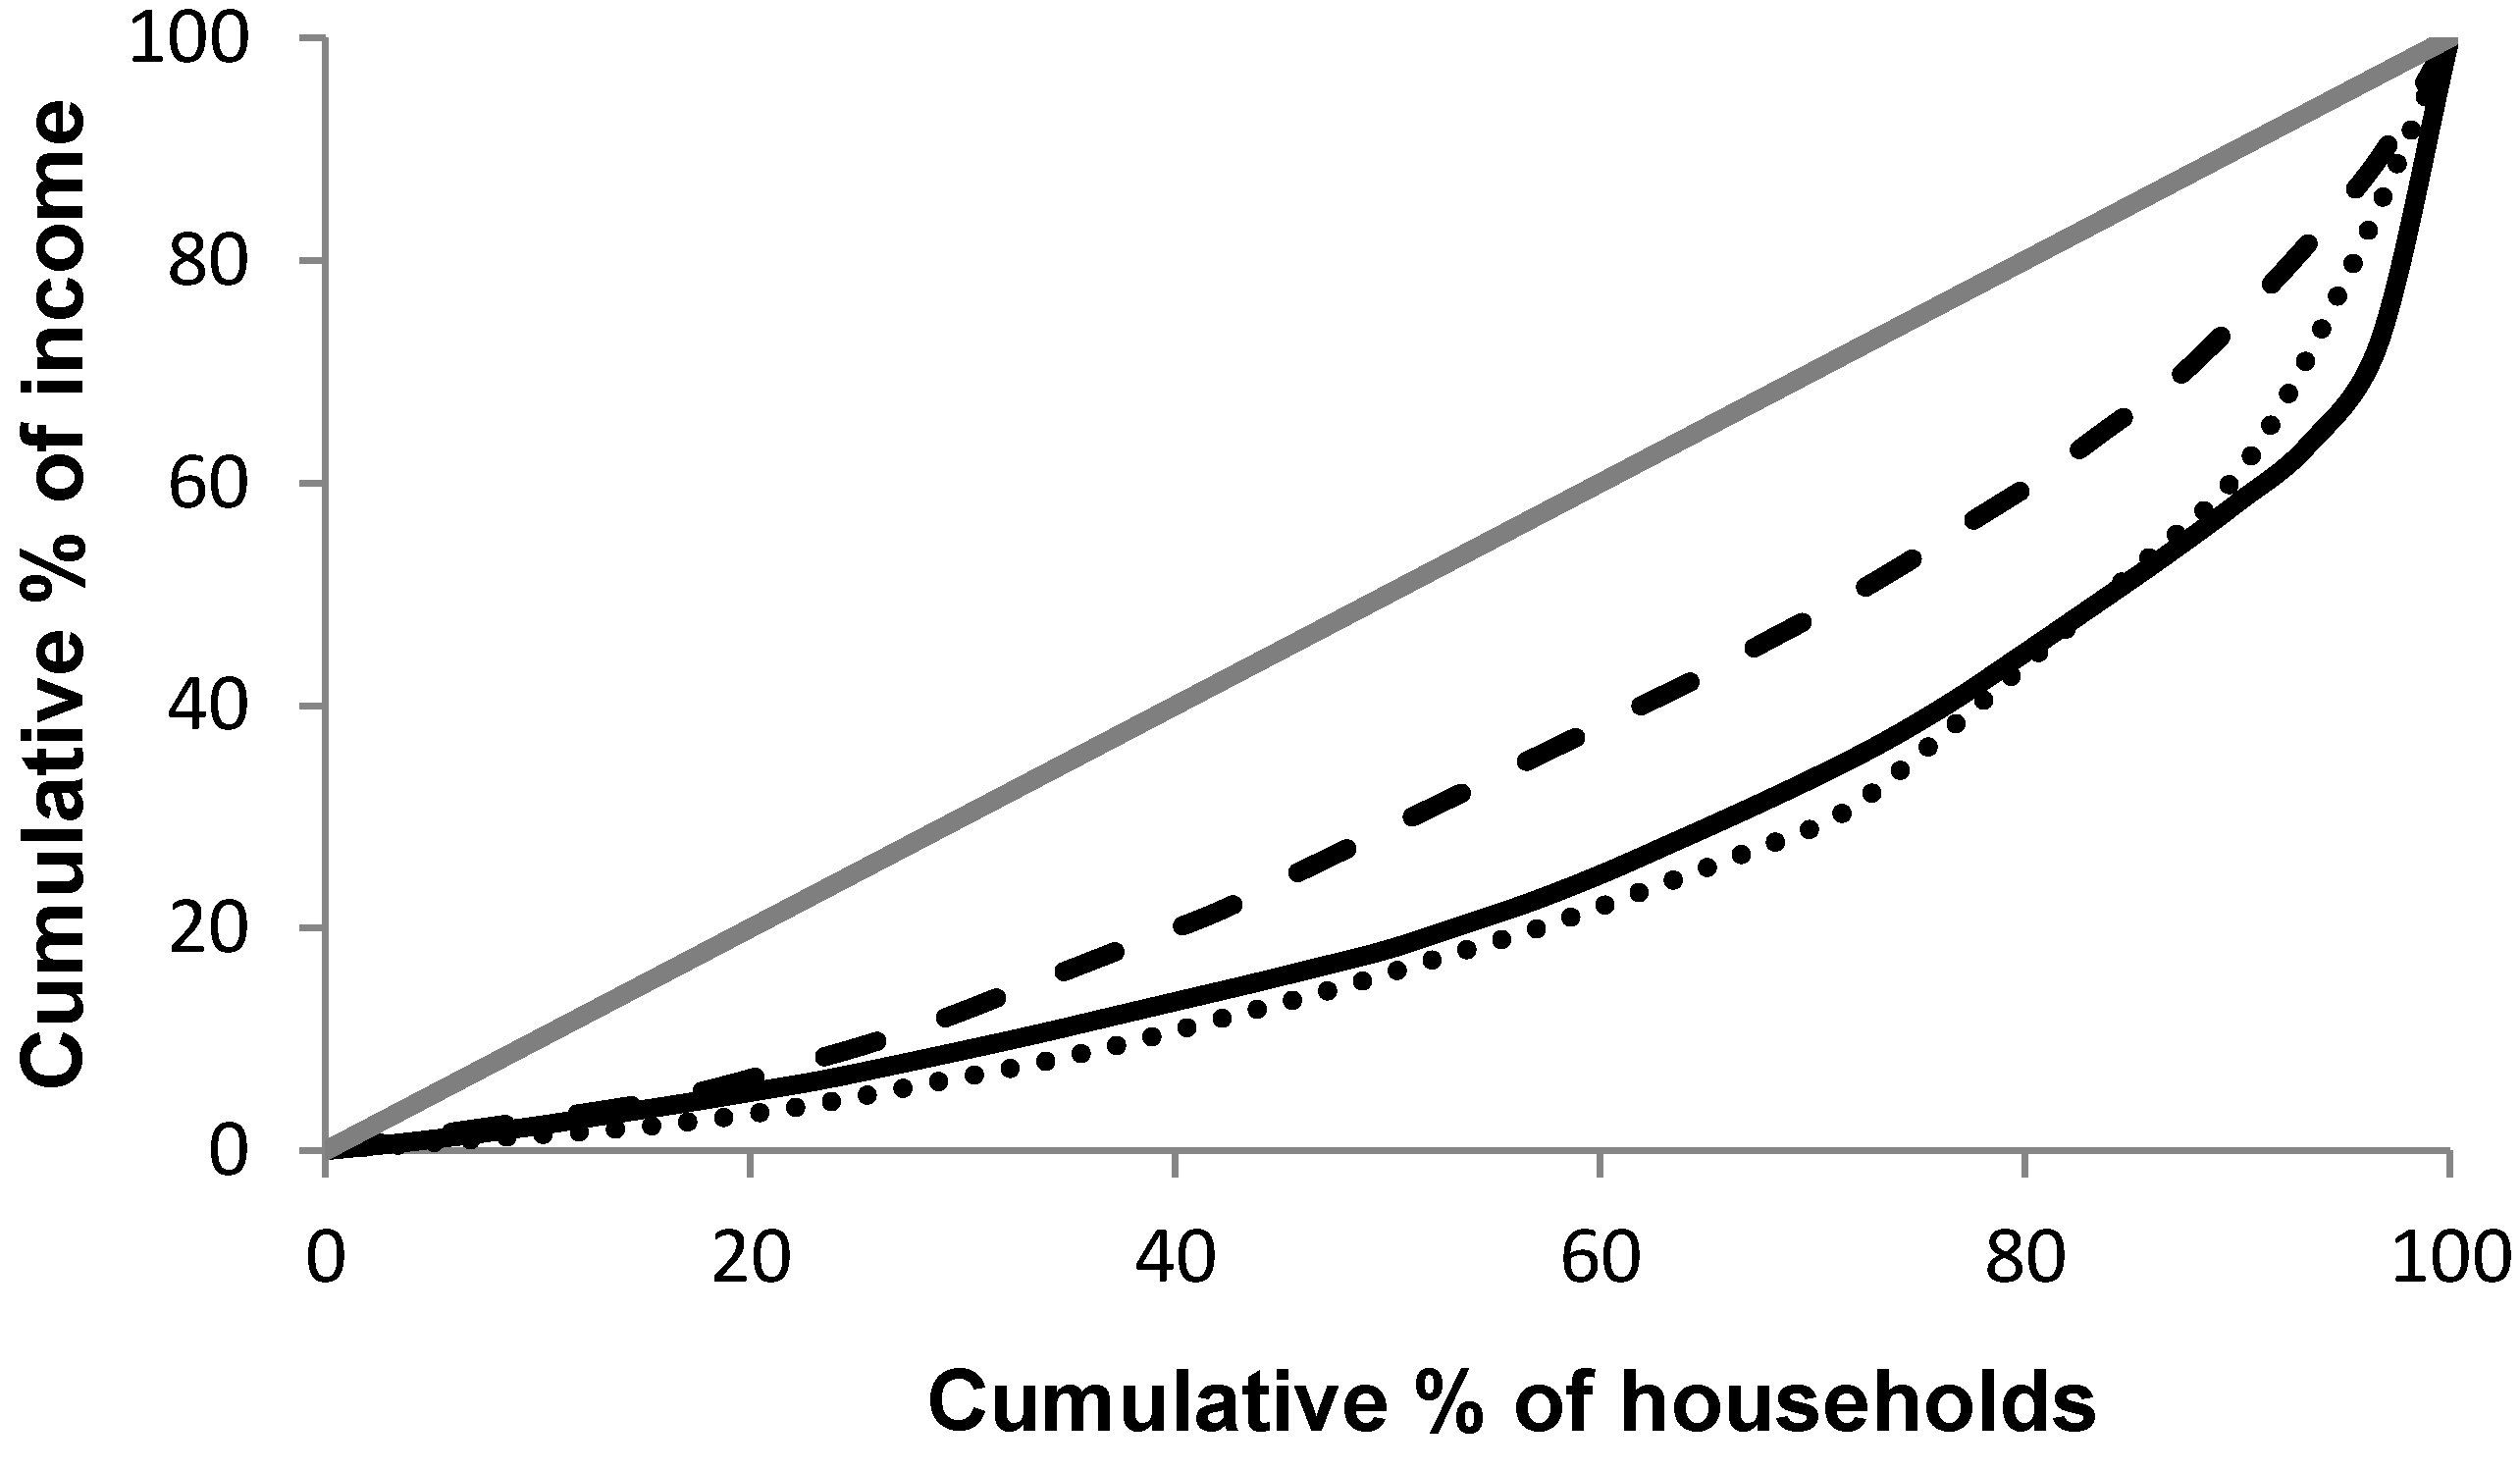
Equality in income distribution was measured as the percentage income earned per household, and this cumulative income percentage was plotted against the cumulative household percentage [70]. The Gini Index was then calculated to quantify the income distributions for P, AP and LI systems, according to [71]. Since a higher index shows higher inequality, a Gini Index of 0.6–1 scored 30%, 0.3–0.6 scored 60% and 0.0–0.3 scored 90%.
Several open-end questions were asked with respect to land ownership since land use was central to all livestock farming systems. We explored farmers’ experiences and perceptions on how different land tenure regimes influence their use of land. The following land tenure regimes versus incentive to land management were considered for farmers to choose; private certified land leads to efficient management, communal ownership leads to inefficient management, leased land leads to poor management and communal ownership leads to efficient management.
We also categorized farmers by their level of education (indigenous knowledge, primary, secondary and graduate) and financial background (rich, middle income, poor) in order to measure if educational and income levels would affect sustainability indicators. Income levels were categorized in a community based approach where the rich, middle income and poor were defined during group interviews using local criteria such as number of livestock owned especially camels, amount of private land owned and actual income earned from farm activity and other sources per year. Our goal here was to verify the relationship between potential education of farmers or supplementary income source (off-farm) can play and their perceptions and actions towards sustainable agriculture.

2.3. Data Analysis

We used the reference system approach for sustainable land management evaluation adopted from [72] to calculate our sustainability scores and further categorized them into three classes of non-sustainable (N ≤ 30%), conditionally sustainable (C = 30%–60%) and sustainable (S = 60%−90%) based on sustainability reference values [48]. A similar scoring approach was adopted by [73], known as the MESMIS framework (Framework for the Evaluation of Management Systems Incorporating a Sustainability Index) earlier proposed by [74]. In our study, each indicator was assumed to be equally important in contributing to agricultural sustainability [49] under each dimension. Data collected from different livestock farming households were compared with reference values agreed upon from group discussions to determine the sustainability scores [48] meaning scores were determined by land users agreed reference values. Scores were aggregated for all indicators and dimensions and averaged across all households per livestock production system. An average of the sustainability scores per dimension represented the sustainability score for that dimension; the average score for the three dimensions represented the net sustainability score for the different farming systems. We further used ANOVA tests to analyze the relationship between farmer’s level of education versus perceived requirements for farm system sustainability and farmer’s income levels versus rangeland conservation attitudes.

3. Results

3.1. Different Livestock Farming Systems

The livestock production systems differed in land use (Figure 2), feed resources, livestock products and farm technologies. In all livestock production systems, farmers tethered their animals on private land and practiced some private cropping (growing crops for individual household ownership on communal or private land mostly behind home compounds) as shown in Figure 2. Further, all livestock systems were dependent on open fields (open access to community rangeland by community members) for animal forage with relatively lower levels of private land ownership amongst pastoralist and higher levels of the use of manufactured feed (animal feed processed industrially and sold in kg or bags most commonly imported) amongst agro-pastoralist. The percentage of farmers who reported sufficient water supply from 2007 to 2009 was slightly constant despite falling annual rainfall values, while increasing significantly from 2009 to 2011 for all systems although annual rainfall also rose to the peak from 2009 to 2010, yet falling again into 2011 (Figure 3). All LIs leased land by offering gifts or labor or through some other forms of social capital like family ties. Livestock products were principally used for food and income generation.
Figure 2. Land use types for livestock production on principally communal land with insignificant degree of clan ownership for swaths of communal land and or private land for the Pastoral (black bars), Agro-pastoral (white bars) and Landless Intensive (gray bars) systems. Improved pasture (reserving specific pasture sites with specific species for growth), Private pasture (keeping livestock on natural pasture), Tethering animals are tethered on fixed spots in communal land.
Land 02 00726 g002
Figure 3. Percentage of farmers in the Pastoral (black bars), Agro-pastoral (white bars) and Landless Intensive (gray bars) livestock production systems claiming that water was sufficient across the years. The broken line represents annual rainfall/mm.
Land 02 00726 g003

3.2. Rainfall and Livestock Herd Size Trends (Stocking Rates)

We found that herd sizes generally decreased from 2007 to 2011 for all livestock species and all farming systems (Figure 4), implying a falling grazing pressure (G) and a rising grass replacement rate (R) within the same rainfall year at an average altitude of 750 m a.s.l. for the entire district.
Figure 4. (a) Cattle, (b) goat, (c) sheep, (d) camel and (e) donkey livestock number trends versus average annual rainfall from 2007 to 2011. White bars (annual rainfall in mm), dashed lines (pastoral system), black lines (agro-pastoral system) and grey line (landless intensive system). Rainfall data obtained from the Melka-Werer agricultural research meteorological station and livestock numbers from household interviews.
Land 02 00726 g004
Our rainfall measurements were not based on distribution but on mm∙yr−1 as recorded by the Melka-Werer Meteorological center. Group interviews and local native researchers explained that there has been an increasing trend of reliance on off farm activities for income by some household members like night security guards, trade in livestock as middle men and establishing small business for spouses and family member with income often raised from selling some livestock capital; a reason that may account for the decreasing herd sizes though unproven. Most of the shops and business along the street entrance to the Melka-Werer agricultural research center and at Awash Arba were owned by children, spouse or other family members of livestock farming households. Pastoralists had the highest number of cattle, sheep and camels while AP was dominated by goats and donkeys. Cattle numbers in P reached their highest level in 2008, followed by a steady decline, irrespective of rainfall amount (Figure 4). All livestock species showed the lowest herd size increments for LI compared to the other systems because LIs traditionally had fewer animals tethered or scavenging around.
The aim of this graph is to show how the total livestock per species per system owned by all households varied with rainfall over the years. The number of livestock of different species for all household in our sample per system (P, AP and LI) was counted and summed for each year from 2007 to 2011 and used to plot the black, dashed and grey lines respectively for livestock numbers per specie with corresponding rainfall bars all against the five year period (Figure 4). As such the number of observations for each rainfall year was a sum of the number of livestock per species for the various households n per system where n = 31, 30 and 21 for the AP, P and LI systems respectively.
The lowest mean livestock numbers per specie were for the camels and donkeys with the LI having the lowest mean for all species followed by AP while P dominated the mean numbers for almost all livestock species. The standard error also indicated big differences in household herd sizes across all systems and species (Figure 5).
Figure 5. The annual mean and standard error of the different livestock species for five years (2007–2011) for the pastoral (P), agro-pastoral (AP) and landless intensive (LI) households.
Land 02 00726 g005

3.3. Sustainability Indicators

The total average environmental, economic and social sustainability scores for P, AP and LI livestock production systems differed only slightly while differences were more strongly visible across and within dimensions (Table 2).
Table 2. Sustainability scores for the different dimensions and indicators for Agro pastoral (AP), Pastoral (P) and Landless Intensive (LI) systems. Sustainability scores are shown in % and category (S = sustainable, C = conditionally sustainable, N = non-sustainable).
Dimension PAPLI
EnvironmentalWater availability79 (S)77 (S)85 (S)
Forage availability65 (S)75 (S)61 (S)
Biodiversity conservation28 (N)32 (C)33 (C)
Chemical pesticide use 90 (S)60 (C)90 (S)
Average 65 (S)61 (C)67 (S)
EconomicFarm productivity 27 (N)90 (S)50 (C)
Input self sufficiency 90 (S)85 (S)77 (S)
Investments and savings 45 (C)67 (S)22 (N)
Average 54 (C)80 (S)50 (C)
SocialLand tenure30 (C)41 (C)31 (C)
Gender equality37 (C)37 (C)52 (C)
Equality in income distribution40 (C)42 (C)49 (C)
Equality in food consumption and distribution 90 (S)86 (S)90 (S)
Average 49 (C)51 (C)55(C)
Total 56 (C)64 (S)57 (C)

3.3.1. Environmental Sustainability

Water availability. The annual rainfall for the years that P, AP, and LI households claimed a sufficient water supply was 636 mm, 657 mm, and 592 mm, respectively (=upper sustainability threshold of S = 90%). The annual rainfall recorded in the Amibara district from 2007 to 2011 was 563 mm, i.e., sustainability scores for P, AP, and LI were S = 79%, 77%, and 85%, respectively, indicating that enough water was available to all systems (=S).
Forage availability. Pastoralists had the highest annual feed shortage of 20,675 t, while AP and LI had 7,687 t and 4,847 t, respectively, according to Equation (1). Pastoralists had the highest estimated annual forage requirements (Fo) with 57,409 t followed by AP with 45,400 t and LI with 15,174 t. Pastoralist annual livestock forage consumption (Fa) was estimated at 41,733 t followed by AP with 37,712 t and LI with 10,326 t. Based on these values the forage availability sustainability scores for P, AP and LI were 65%, 75% and 61%, respectively.
Biodiversity conservation. In 2011, around 60% of all grass species found in 1986 were reported to be missing at all livestock farming systems (Table 3). According to P households, 63% of the 16 grazing plant species that were listed during the group interviews had disappeared from the pastoral lands compared to 25 years ago (N = 90% − 63% = 27%). Grass species losses in AP amounted to 58% between 1986 and 2011 (C= 90% − 58% = 32%) whereas for the LI system, 57% of the 14 grazing plant species present in 1986 were absent in 2011 (C = 90% − 57% = 33%). The standard deviation for the number of grazing plant species present on rangelands as identified by the AP, P and LI farmers (per system) was 1.52 for 1986 and 0.57 for 2011 with respective means of 15.66 and 6.33 respectively.
Table 3. Forage species available in natural pastures in 1986 and in 2011 according to pastoralist (P), agro-pastoralists (P) and landless intensive (LI) farmers interviews. Local name in Afar language is given.
Scientific NameAPPLI
Local NameFamilyLife Form198620111986201119862011
Andropogon canaliculatusMelifPoaceaeGrassXXXXX
Aristida somalensisHamantoPoaceaeGrassXXX
Astralinum adoenseHarowayitoSolanaceaeHerbX
Blepharis edulisYemaruktaAcanthaceaeHerbXX
Cenchrus ciliarisSerdoyitaPoaceaeGrassXX
Chrysopogon plumulosusDurfuPoaceaeGrassXXXXX
Commelina AfricanaMutukiCommelinaceaeHerbXX
Commelina forskaoliiAsaraCommelinaceaeHerbX
Corchorus olitoriusSikboMalvaceaeHerbX
Cynodon dactylonRareitaPoaceaeGrassXX
Ipomoea sinensisHalalConvolvulaceaeGrassXXX
Leucas abyssinicaBunketLamiaceaeHerbX
Lintonia nutansAfaramolePoaceaeGrassXXX
Panicum coloratumDenektoPoaceaeGrassX
Paspalidium desertorumBohalePoaceaeGrassXX
Setaria verticillataDeleyitaPoaceaeGrassXXXX
Sporobolus iocladosDenektoPoaceaeGrassX
Tetrapogon tenellusAytadoytaPoaceaeGrassXXX
UnknownIsisoytaUnknownUnknownX
UnknownLegaimUnknownUnknownX
UnknownHurakortaUnknownUnknownX
UnknownGewitaUnknownUnknownXXX
UnknownIyayitoUnknownUnknownXX
UnknownGayiroUnknownUnknownX
UnknownSengahayuUnknownUnknownX
UnknownAsaisoUnknownUnknownX
UnknownIsisuUnknownUnknownXXX
UnknownIsokurfuUnknownUnknownXX
UnknownEroleUnknownUnknownXX
UnknownMoroieUnknownUnknownXX
UnknownFi’aaUnknownUnknownX
UnknownFeresgeraUnknownUnknownX
UnknownEribaUnknownUnknownX
UnknownHalimeroUnknownUnknownX
Health impact from pesticide use: A variety of insecticides (insecticides are one type of pesticides) were used both by Ps, APs and LIs households (Table 4). However there was no
Table 4. List of insecticides used, their active ingredients and the insects they are targeting for crop production in Amibara. Insecticides were both used by agro-pastoralists and landless intensive livestock owners [41]
Insecticide and Active Ingredient Targeted Insects Price
Ethiosulfan 35%ECBallworm species99 ETB/l
AmitrazRed spider mite, white fly120 ETB/l
Sevien 85%WPTermite306 ETB/kg
LamdacyhalothineShoot fly, ball worm291ETB/l
Marshal (Carbosulfan)200 ULVWhite fly, jassids, aphids103 ETB/l
ChlorpyrifoseTermite, sucking pest110 ETB/l
Scientific benchmark for their application beyond the experiences of farmers and local researchers. Pastoral households used an average of 0.02 L∙animal−1∙yr−1 which is less than the 0.16 L they recommended, thereby earning a sustainability score of S = 90%. Meanwhile the average quantity used by each AP household was 16 L, i.e., 60% more than the recommended value. Hence, the sustainability score for AP was N = 17%. The average quantity used by each LI household was 7 L, i.e., 30% less than the recommended quantity, leading to a sustainability score of S = 90%.

3.3.2. Economic Sustainability

Gross farm income. The sustainability scores for P, AP and LI as per farm income earned∙yr−1 against recommended income levels was 27%, 90% and 50% respectively (Table 5).
Table 5. Farm productivity sustainability scores derived from average net annual and recommended incomes in Ethiopian Birr (ETB) earned per Agro-pastoral, Pastoral and Landless Intensive households∙yr−1.
Livestock Farming System Average Net Income Earned∙yr−1Recommended Minimum Income∙yr−1Sustainability Score (%) and Category
Pastoralist10,76636,00027(N)
Agro-pastoralist52,13120,70090(S)
Landless intensive14,03325,00050(C)
Input self-sufficiency. The ratio of local: imported inputs for P were 25; hence, the system was highly sustainable (S = 90%) as with [51]. For AP, the local: imported input ratio was 3.2, thus the 76% local input earned a sustainability score of S = 85%. For LI, the local: imported ratio was 4, leading to an input self-sufficiency of S = 77%.
Investment and savings. The sustainability scores for investment and savings were calculated independently and the averages led to the following scores for investment and savings; 45% (C), 68% (S) and 22% (N) for P, AP and LI respectively (Table 6).
Table 6. Investment and savings in Ethiopian Birr (ETB) sustainability scores derived from average recommended minimum annual amounts of savings and investment per household.
Average Annual Household Investment in ETBAverage Recommended Annual Household Investment in ETBAverage Annual Household Savings in ETBAverage Recommended Annual Household Savings in ETBSustainability Score (%) and Category for Savings and Investment
Pastoralist010000045 (C)
Agro-pastoralist21,38315,00086610,00068 (S)
Landless intensive5,54220,000219010,00022 (N)
Economic values showed that there was high variation across systems in recommend amounts of savings and investments per household, while farm income also varied. Input self-sufficiency was highest amongst P, followed by AP then LI.

3.3.3. Social Sustainability

Land tenure. Livestock farmers widely acknowledged that the concept of private ownership leading to efficient land management could have been undermined by the institutional and socio-cultural setup for managing communal rangelands but unfortunately, rivalry over grazing of communal lands created that significant divergence between individual and collective rationality [75]. The various farmers associations and government control over use and management of rangelands were weak and theoretical with swaths of communal fields completely unmonitored and open for anyone to use as much as they can thus far and that precipitated rivalry in use. See Table 7a for the land tenure sustainability scores for the P, AP and LI systems.
Gender equality. In all three systems, females were underrepresented at all categories (2% or 6.67% of P and 1% or 3.2% of AP was female), except for farm labor, where ratios were close to unity (0.9–1.2; Table 7b). Particularly in education and training, only four women participated in all three systems (Table 7b). The best but still only conditionally sustainable score was reached in the LI systems where proportionally more (5% or 23%) women participated in resource control, community/cooperative representation, and educational training compared to the other systems. Participation was at the level of group and individual interviews.
Table 7. (a) Land tenure sustainability scores and (b) gender equality as measured by ratio of male to female participation in farm system processes for Pastoral (P), Agro-pastoral (AP) and Landless Intensive (LI) systems based on the perceived attractiveness by interviewed farmers.
(a) Land tenurePAPLI
Land Tenure Type% of LandSust. Score (%)% of LandSust. Score (%)% of LandSust. Score (%)
Leased101.614.63
Private unregistered1.31.1191700
Private registered000000
Communal982977239528
Sustainability Score (%) and Category30(C)41(C)31 (C)
(b) Gender equalityPAPLI
Farm labor0.91.11.2
Education and training3.791.5
Resource control2.32.82.1
Representation in community cooperative9.341.6
Sustainability Score (%) and Category37(C)37(C)52 (C)
Income equality. Income distributions for Ps, APs and LIs were conditionally sustainable as seen by the Lorenz Curve (Figure 6). The Gini Index provided sustainability indices for P, AP and LI were calculated as 40%, 42% and 49% (=C), respectively.
Food distribution and consumption. The average number of meals∙day−1 was 3, 2.9, and 3 respectively, leading to a sustainability score (S) of 90%, 86%, and 90% for P, AP, and LI, respectively.
Figure 6. TheLorenz curve of cumulative % income versus cumulative % of households shows the income equality as measured using the Gini Index. Dotted line (landless intensive), black line (agro-pastoralist), dashed line (pastoralist) livestock production system and grey line (equality line).
Land 02 00726 g006

3.4. Farmers’ Perceptions on Land Tenure versus Land Use Management

See Table 8 for land tenure perceptions.
Table 8. Perception of P, AP and LI farmers (in %) claiming that certain tenure management would lead to efficient/inefficient management of natural resources.
Land Tenure Perceptions% of Farmers
PAPLI
Private certified land leads to efficient management676676
Communal ownership leads to inefficient management232314
Leased land leads to poor management635
Communal ownership leads to efficient management375
Further, 77%, 83%, and 66% of the livestock farmers interviewed in P, AP and LI systems, respectively, experienced a decreasing herd size from 2007 to 2011 while 23%, 17%, and 33%, respectively, reported an increasing livestock trend. Farmers´ experiences as to why livestock herd sizes were increasing or falling were classified into the environmental, economic and social reasons. Farmer’s experiences as to why livestock number trends were rising or falling were classified into the environmental, economic and social reasons:

3.4.1. Environmental Reasons

For all systems, the highest proportion of farmers (71%) claimed that the expansion of Prosopis juliflora due to overgrazing was the major cause for declining grazing plant species and, thus, livestock productivity (Figure 7a). Sporadic rainfall and recurrent draughts were other major reasons for declining livestock productivity while attack by wild animals was a minor cause. Disease infestation, drought and feed shortages were also claimed to be major causes of decreasing productivity (Figure 7a).

3.4.2. Economic Reasons

Livestock farmers in all three systems regarded the lack of investment capital as a major cause for decreasing herd sizes (Figure 7b). Twenty seven percent (27%) of AP farmers who did most of the selling of farm products compared to the other two systems perceived exploitation by middle men as a major reason while 25% of APs thought that the lack of available land and infrastructure accounted for declining livestock productivity. About 25% of Ps reported a lack of market demand while this did not seem as important to AP (15%) and LI (3%; Figure 7b).
Figure 7. (a) Environmental (b) economic, and (c) social reasons for decreasing livestock productivity claimed by pastoral (black bars), agro-pastoral (white bars) and landless intensive livestock herders (grey bars).
Land 02 00726 g007

3.4.3. Social Reasons

Conflict over communal pasture was claimed to be the principal cause of declining herd sizes by over 60% of AP and P and 26% of the LI households (Figure 7c). Gender inequality was not an issue according to most albeit mainly male respondents only (three females were included). 26%, 38% and 10% of P, AP and LI farmers, respectively, complained that inequality in livestock feeding opportunities might undermine chances to actively contribute to sustainable livestock production. Further, over 26% of AP and P and 33% of LI farmers claimed unequal income opportunities and tenure insecurity to be the reason for livestock productivity decline (Figure 7c).

3.5. Educational Background and Income of Farmers

Our ANOVA results (based on the data in Table 9) showed that livestock farmers of different educational background did not differ significantly in their perceptions of what was required for farm sustainability in the P, AP nor LI systems. Requirements listed that can enhance sustainable livestock management were government subsidies, improved water supply, agricultural training/extension and land reforms. Likewise, there was no statistical significance on how rich, middle income and poor farmers (Table 9) worked towards conserving grazing species in all systems. Possible actions towards rangeland management included clearing of P. juliflora pods, controlling grazing numbers, and using manufactured feed.
Table 9. Income and education categories of P, AP and LI farmers.
Education & Income LevelsPercentage of Farmers
PAPLI
Formal professional4135
Community training34028
Indigenous education144667
High income153014
Middle income574610
Low income282376

4. Discussion

As proposed by [76], in interpreting sustainability, we consider a relative value, that is, a system is sustainable up to a certain degree over a certain period and not an absolute value as was the case with our study. Seasonal, decade and generational time assessments would make the sustainability assessment more solid, as time is a crucial factor with resource use.
Missing or insufficient land tenure policies were blamed for discouraging investment in sustainable rangeland management, also found by [52]. The fact that all farmers from the three systems relied extensively on communal lands accounted for their consensus in experiences over land tenure and sustainability reference motivations per tenure regime, was partly our claim. However privatization of all land to improve efficiency in rangeland management as envisaged by most respondents may fail to resolve equity issues, including the rights of historically disadvantaged groups such as women, herders and indigenous populations [77] in which case a broader range of measures can achieve increased tenure security, including recognition of group rights, and emphasizing the need for standards of transparency, accountability and conflict resolution to strengthen local institutions responsible for land management [78] which are some of the interventions that may solve issues discussed by [5]. Livestock were predominantly used as a source of food and income. Cultural issues and community perceptions, which would differ from one community to another and across systems, played an important role in our analyses. For example, our P interviews showed that no annual cash savings were necessary for their farm system to be economically sustainable while AP and LI agreed on a minimum of 15,000 ETB and 20,000 ETB, respectively, for annual savings as a positive indicator of sustainability.
Our selected sustainability indicators seemed well suitable for our agro-ecological zone and culture because they were measurable and where answers were sought from farmers, their cultural values were not bridged. Gender equality for example was a suitable indicator as we observed male dominion over household farm resources in all households with farmers willing to discuss the pros and cons of this domination. It was important to take track record of how this was changing over time. Rainfall as a measure of water availability was suitable for this agro ecological zone where almost all water supplies depended directly on rainfall. Despite a wide array of possible indicators, ours were based on data availability, duration of study and feasibility of data assessment within this study.
The purpose and interpretation of sustainability, based on our indicators, depends on its spatial and temporal time dimension [79], as for example dry and wet years would provide different sustainability results across the livestock production systems. However, reliance on rainfall as a principal measure of water availability in our study would be less meaningful if farmers are able to display a manifold of technological capacity, have the resources and understand ways to benefit from other water sources beyond direct dependence on rainfall, which unfortunately was not the case. As such although it remains unproven that humid areas are water sustainable for livestock farming while arid and sub humid areas are unsustainable, we must bear in mind that sub humid and arid areas enjoy sufficient degrees of rainfall at some periods of the year which may account for fluctuating sustainability trends while in humid areas, floods, type of farming system, stocking rates and water management techniques may undermine reliance on water availability as a sustainability indicator. Further, various assessment criteria might be inter-related such as household income and land tenure [68]. However, we use these indicators for relative assessment across the different livestock production systems, acknowledging that not all scientific disciplines and interactions will be fully covered by our indicators. Some pivotal indicators such as soil fertility and nutrient cycles have to be intertwined in the assessment in future, necessitating a more inter-disciplinary approach to sustainability assessment, which is becoming increasingly important [80]. Longer time scales to monitor farm systems and environmental consequences are essential but seasonal and short term year to year variations are also necessary [79].
For some indicators, it was difficult to agree on a unit; for example, the pesticide use was assessed in L∙household−1∙yr−1 for the AP and LI systems while P measured their usage in cc∙animal−1∙yr−1 across the different seasons. Further, pesticides such as Dursban 44 (chlorpyrifos), for example, are applied on beef cattle every 14 days at quantities that did not exceed 16 cc∙animal−1 but with strict regulations referring to the sex, age, and health state of the animals themselves [81]. Pesticide use may also strongly differ across seasons as our studies found pastoralists reporting a pesticide application of 20 cc every month in the rainy season and once a month in the dry season. These issues highlight the complexities involved with the indicator approach of measuring sustainability and therefore the scoring based on relative values for the various systems remained balanced. Scores as such would only provide estimates but can clearly tell us how trends in farm system processes are changing over time, which will form the logical basis for interventions.
In general, the indicators were helpful in highlighting knowledge gaps or areas, in which more data need to be collected. For instance, environmental indicators, based on farmer’s plant biodiversity knowledge, should be complemented by data collected during field trials [79]. Rainfall data only served as water availability index values whereas annual water availability would be best measured if pipe-borne water, underground water, wells and irrigation flows were measured as they are the most predominant water sources during the annual average eight months of dry season [41].
The different farming systems had some specific indicators, which demonstrated poor performances of specific sectors within a system. For example, although the AP system was overall sustainable, particular areas of production might still need improvement such as biodiversity conservation, land tenure, and gender equality where sustainability scores were relatively low. This agrees with [5] who claimed that the motivations behind sustainability assessment are twofold; to evaluate existing systems and to design interventions to avoid unsustainable practices.

5. Conclusion

In our study, agro-pastoralism (AP) reached the highest sustainability score compared to purely pastoral (P) and landless intensive (LI) systems but all systems had room for improvement to enhance their environmental, economic and social sustainability as they were all within 26%–34% below the maximum attainable sustainability standards of 90% agreed during group interviews. Our scores only represent system-specific estimates which partially reflected cultural patterns and way of life amongst farmers within the different livestock farming systems. These estimates can serve as a useful guide package to agricultural policy makers towards understanding what kind of interventions are most needed as well as how production trends might be changing over time. Incorporating our claims with the concept of sustainable capitalism as discussed by [82] gives politicians a platform for intervention. Having a world free of hunger requires a sustainable approach to livestock farming as aptly defined by the British Royal Society “sustainable intensification of global agriculture” which will be more of a green revolution; a revolution will be more political than scientific [83]. Hence the burden of solution lies on politicians and funders who must stand up to operationalize the work of field scientist.

Conflict of Interest

The authors declare no conflict of interest.

References

  1. Jahnke, H.E. Livestock Production Systems and Livestock Development in Tropical Africa; Kieler Wissenschaftsverlag Vauk: Kiel, Germany, 1982; pp. 1–5. [Google Scholar]
  2. Food and Agricultural Organisation (FAO). FAOSTAT. 1999. Available online: http://apps.fao.org/cgi-bin/nph.db.pl (accessed on 15 September 2012).
  3. Institute of Biodiversity Conservation (IBC). Available online: http://www.ibc.gov.et/biodiversity/components-of-biodiversity/animal-species-diversity (accessed on 30 August 2012).
  4. Central Statistical Agency (CSA). Agricultural Sample Survey Report on Livestock, Poultry, and Beehive Populations. Statistical Bulletin 206; CSA: Addis Ababa, Ethiopia, 1999; Volume II, p. 280. [Google Scholar]
  5. Hansen, J.W. Is agricultural sustainability a useful concept? Agric. Syst. 1996, 50, 117–143. [Google Scholar] [CrossRef]
  6. International Livestock Research Institute(ILRI). Livestock Policy Analysis; ILRI Training Manual 2; ILRI: Nairobi, Kenya, 1995; p. 249. [Google Scholar]
  7. Benin, S.; Ehui, S.; Pender, J. Policies for livestock development in the Ethiopian highlands. Environ. Dev. Sustain. 2003, 5, 491–510. [Google Scholar] [CrossRef]
  8. Deacon, R.T. Deforestation and the rule of law in a cross-section of countries. Land Econ. 1994, 70, 414–443. [Google Scholar] [CrossRef]
  9. Department for International Development (DFID); Pretty, J. Agricultural Sustainability. In Assessing Sustainability; Agriculture and Natural Resources Team, UK Department for International Development (DFID)/University of Essex Press: Colchester, UK, 2004; p. 8. [Google Scholar]
  10. Food and Agricultural Organization (FAO). Contributions of Smallholder Farmers and Pastoralists to the Development, Use and Conservation of Animal Genetic Resources. Information Document 4. Available online: http://www.fao.org/docrep/meeting/021/am216e.pdf (accessed on 2 November 2013).
  11. World Commission on Environment and Development. Our Common Future; Oxford University Press: Oxford, UK, 1987; p. 383. [Google Scholar]
  12. Seré, C.; Steinfeld, H.; Groeneworld, J. World Livestock Production Systems: Current Status, Issues and Trends; FAO Animal Production and Health Paper 127; FAO: Rome, Italy, 1996; p. 98. [Google Scholar]
  13. de Leeuw, P.N.; Thorpe, W. Low Input Cattle Production Systems in Tropical Africa: An Analysis of Actual and Potential Cow-Calf Productivity. In Proceedings of the All African Conference on Annual Agriculture Conference, Pretoria, South Africa, 1–4 April 1996; pp. 2–4.
  14. Blench, R.M. You Can’t Go Home Again. Pastoralism in the New Millenium. 2001, pp. 6–40. Available online: http://www.org.odi.uk/staff/r.blench (accessed on 13 March 2013).
  15. Nkurumwa, A.O.; Mwangi, J.G.; Kathuri, N.J. Livelihood Diversification and Enhanced Food Security through Agro-Pastoralism: Socio-Cultural and Other Challenges among Maasai Pastoralists of Narok North District of Kenya. In Proceedings of Second RUFORUM Biennial Meeting, Entebbe, Uganda, 20–24 September 2010; pp. 1633–1636.
  16. Gerber, P.; Mooney, H.A.; Dijkman, J.; Tarawali, S.; Haan, C.D. Chapter 1. Introduction. In Livestock in a Changing Landscape. Experiences and Regional Perspectives; Island Press: Washington, DC, USA, 2010; Volume 2, p. 7. [Google Scholar]
  17. Bourn, D.; Maitima, J.; Motsamai, B. Livestock and the Environment. In Livestock and Wealth Creation: Improving the Husbandry of Livestock Kept by the Poor in Developing Countries; Kitalyi, A.J., Jayasuriya, N., Owen, E., Smith, T., Eds.; Nottingham University Press: Nottingham, UK, 2005; pp. 145–165. [Google Scholar]
  18. Canagasaby, D.; Morton, J.; Rischkoowsky, B.; Thomas, D. Livestock Systems. In Livestock and Wealth Creation: Improving the Husbandry of Livestock Kept by Resource Poor People in Developing Countries; Kitalyi, A.J., Jayasuriya, N., Owen, E., Smith, T., Eds.; Nottingham University Press: Nottingham, UK, 2005; pp. 29–52. [Google Scholar]
  19. Steinfeld, H.; Mäki-Hokkonen, J. A classification of livestock production systems. World Anim. Rev. 1995, 84/85, 83–94. [Google Scholar]
  20. Drexhage, J.; Murphy, D. Sustainable Development: From Brundtland to Rio 2012. In Proceedings of the First Meeting of High Level Panel on Global Sustainability, New York, NY, USA, 19 September 2010; pp. 6–12.
  21. Dumanski, J.; Smyth, A.J.; Spendjian, G.; Swift, M.J.; Thornton, P.K. FESLM: An In ternational Framework for Evaluating Sustainable Land Management. In World Soil Resources Report 73; Food and Agriculture Organization of the United Nations: Rome, Italy, 1993; pp. 6–37. [Google Scholar]
  22. Bell, S.; Morse, S. Measuring Sustainability: Learning from Doing; Earthscan Publications: London, UK, 2003; pp. 3–48. [Google Scholar]
  23. Smith, C.S.; McDonald, G.T. Assessing the sustainability of agriculture at the planning stage. J. Environ. Manag. 1998, 52, 15–37. [Google Scholar] [CrossRef]
  24. Saradon, J.S. El Desarollo y Uso de Indicadores Para Evaluar la Sustentabilidad de los Agroecosystemas. In Agroecologia. El camino Hacia una Agricultural Sustentable. Edicions Cientificas Americanas; Scribd: San Francisco, CA, USA, 2002; pp. 393–414. [Google Scholar]
  25. Braat, L. The Predictive Meaning of Sustainability Indicators. In Search of Indicators of Sustainable Development; Onno, K., Verbruggen, H., Eds.; Kluwer Academic Publisher: Dordrecht, The Netherlands, 1991; pp. 57–70. [Google Scholar]
  26. Simon, D. Sustainable development. Theoretical construct or attainable goal? Environ. Conserv. 1989, 16, 41–48. [Google Scholar] [CrossRef]
  27. Senanayake, R. Sustainable agriculture: Definition and parameters for measurement. J. Sustain. Agric. 1991, 1, 6–30. [Google Scholar] [CrossRef]
  28. Lynam, J.K.; Herdt, R.W. Sense and sustainability: Sustainability as an objective in international agricultural research. Agric. Econ. 1989, 3, 381–398. [Google Scholar] [CrossRef]
  29. Chen, S.K. The establishment of evaluation and indices system for Chinese sustainable development. World Environ. 2000, 1, 1–9. [Google Scholar]
  30. Zehn, L.; Routray, J.T. Operational indicators for measuring agricultural sustainability in developing countries. Environ. Manag. 2002, 32, 34–44. [Google Scholar]
  31. Pretty, J.N. Regenerating Agriculture: Policies and Practice for Sustainability and Self-Reliance; Earthscan Publications Ltd.: London, UK, 1995; pp. 8–12. [Google Scholar]
  32. Monteith, J.L. Can sustainability be quantified? Indian J. Dryland Res. Dev. 1990, 5, 1–15. [Google Scholar]
  33. Ikerd, J. Two related but distinctly different concepts: Organic farming and sustainable agriculture. Small Farm. Today 1993, 10, 30–31. [Google Scholar]
  34. Webster, P. The challenge of sustainability at the farm level: Presidential address. J.Agric. Econ. 1999, 50, 371–387. [Google Scholar] [CrossRef]
  35. Torquebiau, E. Are tropical agro forestry gardens sustainable? Agric. Hum. Value. 1992, 9, 11–19. [Google Scholar]
  36. Gryseels, G. The Role of Livestock in the Generation of Smallholder Farm Income in Two Vertisol Areas of the Central Ethiopian Highlands. In Management of Vertisols in Sub-Saharan Africa: Proceedings of a Conference Held at the International Livestock Centre for Africa (ILCA), Addis Ababa, Ethiopia, 31 August–4 September 1987; Jutzi, S.C., Haque, I., McIntire, J., Stares, J.E.S., Eds.; International Livestock Center for Africa (ILCA): Addis Ababa, Ethiopia, 1988; pp. 345–358. [Google Scholar]
  37. Conway, G.R. The properties of agro-ecosystems. Agric. Syst. 1987, 24, 95–117. [Google Scholar] [CrossRef]
  38. Marten, G. Productivity, stability, sustainability, equality and autonomy as properties for agro ecosystems assessment. Agric. Syst. 1988, 26, 291–316. [Google Scholar] [CrossRef]
  39. Kaine, G.W.; Tozer, P.R. Stability, resilience and sustainability in pasture base grazing systems. Agric. Syst. 2005, 83, 27–48. [Google Scholar] [CrossRef]
  40. Central Statistical Agency (CSA). Statistical Abstract; Federal Democratic Republic of Ethiopia: Addis Ababa, Ethiopia, 2007.
  41. Melka-Werer Livestock Research Center. Meteorological Division; Ethiopian Agricultural Research Organization (EARO): Amibara, Ethiopia, 2011. [Google Scholar]
  42. Getachew, K.N. Among the Pastoral Afar in Ethiopia: Tradition, Continuity and Socioeconomic Change; International Books: Dublin, Germany, 2001. [Google Scholar]
  43. Tesfaye, G. Ecological diversity and dominant species of desert and semi desert ecosystem in the Afar Region. Biodivers. Newsl. 2002, 1, 11–14. [Google Scholar]
  44. Food and Agricultural Organisation (FAO). How to Feed the World by 2050. In Proceedings of FAO Expert Meeting, Rome, Italy, 24–26 June 2009; p. 2.
  45. Little, P.D.; Smith, K.; Cellarius, B.A.; Coppock, D.L.; Barrett, C. Avoiding disaster: Diversification and risk management among East African herders. Dev. Chang. 2001, 32, 401–433. [Google Scholar]
  46. Desta, S.; Coppock, D.L. Pastoralism under pressure: Tracking system change in Southern Ethiopia. Hum. Ecol. 2004, 32, 465–486. [Google Scholar] [CrossRef]
  47. Pedersen, J.; Benjaminsen, T. One leg or two? Food security and pastoralism in the Northern Sahel. Hum. Ecol. 2008, 36, 43–57. [Google Scholar] [CrossRef]
  48. Mueller, S. Evaluating the Sustainability of Agriculture: The Case of the Reventado River Watershed in Costa Rica. In European University Studies Series 5; Peter Lang GmbH: Frankfurt, Germany, 1997; p. 223. [Google Scholar]
  49. Praneetvatakul, S.; Janekarnkij, P.; Prayoonwong, K. Assessing the Sustainability of Agriculture. In Case of Mae Chaem Catchment, Northern Thailand; Pergamon: Oxford, UK, 2001; pp. 103–109. [Google Scholar]
  50. Thai Department of Land Development (DLD). Framework of Evaluation of Sustainable Land Management—A Case Study: Ban Pha Duea, Mae Fha Louang Districts, Chiangrai Province, Thailand; Thai Department of Land Development (DLD): Bangkok, Thailand, 1998.
  51. Tisdell, C. Economic indicators to assess the sustainability of conservation farming projects: An evaluation. Agric. Ecosyst. Environ. 1996, 57, 117–131. [Google Scholar] [CrossRef]
  52. Rohde, R.F.; Moleele, N.M.; Mphale, M.; Allsopp, N.; Chanda, R.; Hoffman, M.T.; Magole, L.; Young, E. Dynamics of grazing policy and practice: Environmental and social impacts in three communal areas of Southern Africa. Environ. Sci. Policy 2006, 9, 302–316. [Google Scholar] [CrossRef]
  53. Glantz, M.H. Draught and Hunger in Africa: Denying Famine a Future; Cambridge University Press: Cambridge, UK, 1987; pp. 8–9. [Google Scholar]
  54. Westoby, M.; Walker, B.; Noy-meir, I. Opportunistic management for rangelands not at equilibrium. J. Range Manag. 1989, 42, 266–274. [Google Scholar] [CrossRef]
  55. Vetter, S. Rangelands at equilibrium and non-equilibrium: Recent developments in the debate. J. Arid Environ. 2005, 62, 321–341. [Google Scholar] [CrossRef]
  56. White, L.D.; McGinty, A. Stocking Rate Decisions—Key to Successful Ranch; Texas Agricultural Extension Service, Texas A&M University System: San Angelo, TX, USA, 1999; p. 11. [Google Scholar]
  57. Tripp, R. Is low external input technology contributing to sustainable agricultural development? Nat. Resour. Perspect. 2006, 102, 4. [Google Scholar]
  58. Food and Agricultural Organization (FAO). International Code of Conduct on the Distribution and Use of Pesticides. In Proceedings of the 123rd Session of the FAO Council, Rome, Italy, 26–27 November 2003; p. 6.
  59. Wilson, R.H.; Charry, A.A.; Kemp, D.R. Performance indicators and benchmarking in Australian Agriculture: Synthesis and Perspectives; Schools of Accounting and Rural Management, Charles Sturt University: Orange, NSW, Australia, 2005; pp. 45–52. [Google Scholar]
  60. Yesuf, M.; Bluffstone, R. Poverty, risk aversion and path dependence in low income countries: Experimental evidence from Ethiopia. Am. J. Agric. Econ. 2009, 91, 1022–1037. [Google Scholar] [CrossRef]
  61. Fafchamps, M.; Lund, S. Risk-sharing networks in rural Philippines. Dev. Econ. 2003, 71, 261–287. [Google Scholar] [CrossRef]
  62. Chetty, R.; Looney, A. Consumption smoothing and the welfare consequences of social insurance in developing economies. J. Public Econ. 2006, 90, 2351–2356. [Google Scholar] [CrossRef]
  63. Abdulahi, M. The legal status of the communal land holding system in Ethiopia: The case of pastoral communities. Int. J. Minor. Group Right. 2007, 14, 85–125. [Google Scholar] [CrossRef]
  64. Hardin, G. The tragedy of the Commons. Science 1968, 162, 1243–1248. [Google Scholar] [CrossRef]
  65. Ostrom, E. Governing the Commons: The Evolution of Institutions for Collective Action; Cambridge University Press: Cambridge, UK/New York, NY, USA, 1990; pp. 1–11. [Google Scholar]
  66. Food and Agricultural Organisation (FAO). Land Tenure and Rural Development. In FAO Land Tenure Studies 3; FAO: Rome, Italy, 2002; pp. 7–18. [Google Scholar]
  67. Besley, T. Property rights and investment incentives: Theory and evidence from Ghana. J. Polit. Econ. 1995, 103, 903–937. [Google Scholar]
  68. Food and Agricultural Organisation (FAO)/Government Cooperative Programme. Improving Information on Women’s Contributions to Agricultural Production for Gender Sensitive Planning. Project Findings and Recommendations; FAO: Rome, Italy, 1998; pp. 1–10. [Google Scholar]
  69. Brklacich, M.; Bryant, C.R.; Smith, B. Review and appraisal of concept of sustainable food production systems. Environ. Manag. 1991, 15, 1–14. [Google Scholar] [CrossRef]
  70. Lorenz, M.O. Methods of measuring the concentration of wealth. J. Am. Stat. Assoc. 1905, 9, 209–217. [Google Scholar]
  71. Shephard, A. Inequality under the Labor Government; Briefing Note No 33; The Institute for Fiscal Studies, March 2003. Available online: http://www.duncanwil.co.uk/lorenz1.html (accessed on 16 August 2012).
  72. Food and Agricultural Organization (FAO). Chapter 3. Land Suitability Classifications. In A Framework for Land Evaluation; Soils Bulletin 32; FAO: Rome, Italy, 1976. [Google Scholar]
  73. Franco, J.A.; Gaspar, P.; Mesias, F.J. Economic analysis of scenarios for the sustainability of extensive livestock farming in Spain under CAP. Ecol. Econ. 2012, 74, 120–129. [Google Scholar] [CrossRef]
  74. Masera, O.; Astier, S.; López-Ridaura, S. Sustentabilidad y Manejo de los Recursos Naturales. El Marco de Evaluación MESMIS; Mundi-Prensa: Mexico City, México, 2000. [Google Scholar]
  75. Feeny, D.; Berkes, F.; McCay, B.J.; Acheson, J.M. The tragedy of the commons twenty-two years later. Hum. Ecol. 1990, 18, 1–19. [Google Scholar] [CrossRef]
  76. Ayatunde, A.A.; Leeuw, D.J.; Turner, M.D.; Said, M. Challenges of assessing the sustainability of (agro)-pastoral systems. Assess. Sustain. Dev. Anim. Prod. Syst. 2011, 139, 30–43. [Google Scholar]
  77. Deininger, K. Executive Summary—Chapter 1 and 2. Introduction and Property Rights to Land. In Land Policies for Growth and Poverty Reduction; World Bank and Oxford University Press: Washington, DC, USA, 2003; pp. 1–76. [Google Scholar]
  78. Kanji, N.; Cotula, L.; Hilhorst, T.; Toulmin, C.; Witten, W. Can Land Registration Serve Poor and Marginalized Groups? Summary Report; Securing Land Rights in Africa, Research Report I; Russell Press: Nottingham, UK, 2005; pp. 3–4. [Google Scholar]
  79. de Wit, J.; Oldenbroek, J.K.; van Keulin, H.; Zwart, D. Criteria for sustainable livestock production: A proposal for implementation. Agric. Ecosyst. Environ. 1995, 53, 219–229. [Google Scholar] [CrossRef]
  80. WVU Team Takes Interdisciplinary Approach to Study Climate Change’s Impact on Wetlands. Available online: http://wvutoday.wvu.edu/n/2012/03/22/wvu-team-takes-interdisciplinary-approach-to-study-climate-change-s-impact-on-wetlands (accessed on 2 November 2012).
  81. Steffey, K. Chapter 8. Insect Pest Management for Livestock and Livestock Buildings. In Illinois Agricultural Pest Management Handbook; College of Agricultural, University of Illinois Extension: Champaign, IL, USA, 1999; pp. 131–167. [Google Scholar]
  82. O’Cannor, J. Is Sustainable Capitalism Possible? Natural Causes. Essays on Ecological Marxism; Guilford Press: New York, USA, 1998. [Google Scholar]
  83. How to feed a hungry world. Nature 2010, 466, 531–532. [CrossRef]

