Article

Human Appropriation of Net Primary Production (HANPP) in an Agriculturally-Dominated Watershed, Southeastern USA

by
C. Brannon Andersen
1,*,
R. Kyle Donovan
1,† and
John E. Quinn
2
1
Department of Earth and Environmental Sciences, Furman University, 3300 Poinsett Highway, Greenville, SC 29613, USA
2
Department of Biology, Furman University, 3300 Poinsett Highway, Greenville, SC 29613, USA
*
Author to whom correspondence should be addressed.
Current address: Synterra Corp., 148 River Street, Suite 220, Greenville, SC 29601, USA.
Land 2015, 4(2), 513-540; https://doi.org/10.3390/land4020513
Submission received: 4 January 2015 / Revised: 9 June 2015 / Accepted: 11 June 2015 / Published: 18 June 2015
(This article belongs to the Special Issue Ecosystem Function and Land Use Change)

Abstract

:
Human appropriation of net primary production (HANPP) quantifies alteration of the biosphere caused by land use change and biomass harvest. In global and regional scale assessments, the majority of HANPP is associated with agricultural biomass harvest. We adapted these methods to the watershed scale and calculated land cover change and HANPP in an agricultural watershed in 1968 and 2011. Between 1968 and 2011, forest cover remained near 50% of the watershed, but row crop decreased from 26% to 0.4%, pasture increased from 19% to 32%, and residential area increased from 2% to 10%. Total HANPP decreased from 35% of potential Net Primary Productivity (NPP) in 1968 to 28% in 2011. Aboveground HANPP remained constant at 42%. Land use change accounted for 86%–89% of HANPP. Aboveground HANPP did not change despite the major shift in agricultural land use from row crop and pasture. The HANPP and land use change in Doddies Creek watershed reflects changing land use patterns in the southeastern US, driven by a complex interaction of local to global scale processes including change in farm viability, industrialization of agriculture, and demographic shifts. In the future, urbanization and biofuel production are likely to become important drivers of HANPP in the region. At the watershed scale, HANPP can be useful for improving land use decisions and landscape management to decrease human impact on the ecosystem and ensure the flow of ecosystem services.

1. Introduction

Terrestrial biomes have undergone extensive land use and land cover change [1,2]. Anthropogenic changes have dominated the landscape such that the biosphere has been described as being in “the Anthropocene Era” [3]. Indeed, the extent of human transformation of the terrestrial surface and associated ecosystem functions has resulted in the crossing of multiple planetary boundaries [4] in particular climate change, biodiversity loss, and an altered nitrogen cycle. Ellis [5] suggests that the human transformation of terrestrial ecosystems is now irreversible, as we have created novel ecosystems [6,7] at a rate that in and of itself is novel. Ellis [5] also indicates human action has intensively transformed at least 29% of the terrestrial surface to densely-settled and cropland anthropogenic biomes, suggesting we have crossed the global threshold of 20% for land use change. Perhaps the single most important driver of these changes is the shift of natural biomes to agricultural systems, which now cover 30%–40% of the terrestrial environment [1,8] of which 12% is dedicated to row crop production and 26% to pasture [9]. Particularly striking is the increase in pasture from 3% in 1700 to 26% in 2000 [8]. Demand for wood based biofuels creates a new, and potentially large, driver of land transformation [10,11,12], including pasture and cropland conversion from food production to fuel production [13,14,15].
Given that over a third of the Earth’s terrestrial surface is dedicated to production of food, fiber, and fuel, quantification of the impact of this appropriation is essential. However, a global scale assessment of land use change thresholds may not be suitable for application at local scales [16]. A need exists to better link global patterns of land use change with local ecological function, including human appropriation of natural resources, at smaller scales. One recent metric of human intensity of landscape change is human appropriation of net primary production (HANPP).
HANPP was developed as a quantitative measure of the engineering of natural ecosystems to meet human needs for resource supply and infrastructure development [17,18,19]. HANPP estimates the amount of potential annual biological productivity reduced by human activities, including row crop and timber harvest, grazing, fire, and land use change [20,21], all of which reduce the availability of energy to higher trophic levels and affects subsequent ecological functions and services supported [22]. To date, however, the HANPP method has primarily been applied at the global and regional scales rather than at smaller scales closer aligned with the heterogeneous nature (and working scale) of both human and natural systems.
HANPP has been measured at the global scale since the 1980s (e.g., [17,23,24]) with estimates of the human appropriation of potential net primary production (NPPpot) ranging from 20%–40%. The range in results reflected variations in methodology, particularly accounting of land cover change and harvests. More recently, Haberl et al. [19] found a global aggregate HANPP equivalent to ~24% (15.6 Pg·C/yr) of the total (above + below ground) NPPpot or ~29% of the aboveground NPPpot in 2000. For total HANPP, 53% was associated with harvest and another 40% was associated with land use change. When considering only above ground NPPpot, the amount of HANPP associated with harvest increases to ~71% and the amount associated with land use change decreases to ~18%. The remainder of the HANPP is associated with fires set by humans. Using slightly different assumptions, Krausmann et al. [21] showed that global aggregate total HANPP doubled between 1910 and 2005 from 13% of total NPPpot (6.9 Pg·C/yr) to 25% of total NPPpot (14.8 Pg·C/yr). However, these studies focus on global scale HANPP, and though Krausmann et al. [21] do consider continental scale variability, regional and local scales are not considered.
A number of studies have applied the HANPP method at the regional or national scale. The results of these studies HANPP at the national level in the early 21st century ranged from about 20% to about 75% (Figure 1) and is dominated by agriculture, often pasture (e.g., [25]). The studies also indicate that HANPP is spatially and temporally heterogeneous (Figure 1). Increased values of HANPP reflect increased row crop activity over time in Nova Scotia, Canada [26], and replacement of forest with pasture in New Zealand [27] or an evolving influence of harvest and land use change in the Philippines [28]. In contrast, industrialization of agriculture caused a decline in HANPP over time in Italy [29], Germany [30], Austria [31], Hungary [32], and Spain [33], although political and economic change also played a role in these countries. In the United Kingdom [34], increases in outsourcing of food production and the increase in industrial agriculture caused a decline in aboveground HANPP from the late 1950s to 2000, though agriculture remains dominant. The aboveground HANPP of South Africa was consistent and showed little change between 1961 and 2006 [35] and Austria showed little change between 1950 and 1995 [36]. Austria showed little variation despite considerable change in land cover during that time period, largely tied to agricultural intensification [36]. The Czech Republic [37] has only a single measure of HANPP with HANPP dominated by agricultural harvest. Similar to HANPP, the demand for NPP relative to supply has increased in Sahel region of Africa from 19% in 2000 to 41% in 2010 [38].
Figure 1. Range in aboveground HANPP over time reported by studies at regional to national scales. Some studies only have HANPP for a single year. For studies with temporal variation, only initial and final HANPP are shown.
Land 04 00513 g001
In summary, three main concepts emerge from these studies. First, estimates of HANPP indicate that land use change and harvests associated with agriculture dominate HANPP. Second, HANPP exhibited considerable spatial heterogeneity. Third, even where trends emerge, such as declining HANPP, the trends include exceptions and show considerable temporal variability. These three concepts suggest local scale studies could increase our understanding of how human interaction with the landscape affects HANPP.
Few, if any, studies have calculated HANPP at local scales using the watershed as the unit of assessment. Haberl et al. [39] did examine a series of 38 plots (600 m × 600 m) in a small region near Vienna, Austria where HANPP ranged from about 45% to about 95% of NPPpot, depending on the amount and intensity of agriculture. This suggests an opportunity to take advantage of the more accurate measures of the heterogeneous land use pattern captured at the watershed scale. Furthermore, application at the watershed scale is important because active management [40], mitigation [41], and research [42] occur at the watershed scale and reflect the unique attributes of each watershed [43].
Our study area is an agricultural watershed in the southeastern United States with a spatially variable mosaic of human and semi-natural ecosystems that have shifted over time. The first objective of this study was to determine whether methods of HANPP developed for global and regional studies could be applied to the watershed scale and document methodological challenges. The second objective was to determine how HANPP had changed between 1968 and 2011, a period of rapid urbanization and shift in agricultural practices in the region, and compare patterns to those results of regional and national scale studies. The third objective was to understand how teleconnections to global changes in agriculture drove changes in land use and HANPP at the watershed scale.

2. Methods

2.1. Study Area

Our study area was the 29.7 km2 (2970 hectares) Doddies Creek watershed, in Pickens County, SC, USA, embedded within the Southern Piedmont ecoregion (Figure 2). The climate of the region is subtropical, with a mean annual temperature of 15.8 °C and an average annual precipitation of 126.5 cm [44], which falls within the temperate deciduous forest biome [45,46]. The land use history of the watershed over the last 200 years is best characterized as agricultural. However, in the past two decades, land use and land cover change in the watershed is emblematic of rapidly expanding urban areas [47] and stable or declining forest cover [48] and farmland [49,50] across the southeast United States. Farmland abandonment has been partially in response to degradation of the local ultisols, primarily by topsoil erosion (e.g., [51]). For example, agricultural land cover declined slightly more than 80% in Pickens County between 1890 and 2012 [52]. The remaining farmland is dominated by pasture based operations [52]. Urbanization in the ecoregion is driven by a population increase 40% larger than other areas in the United States [47].

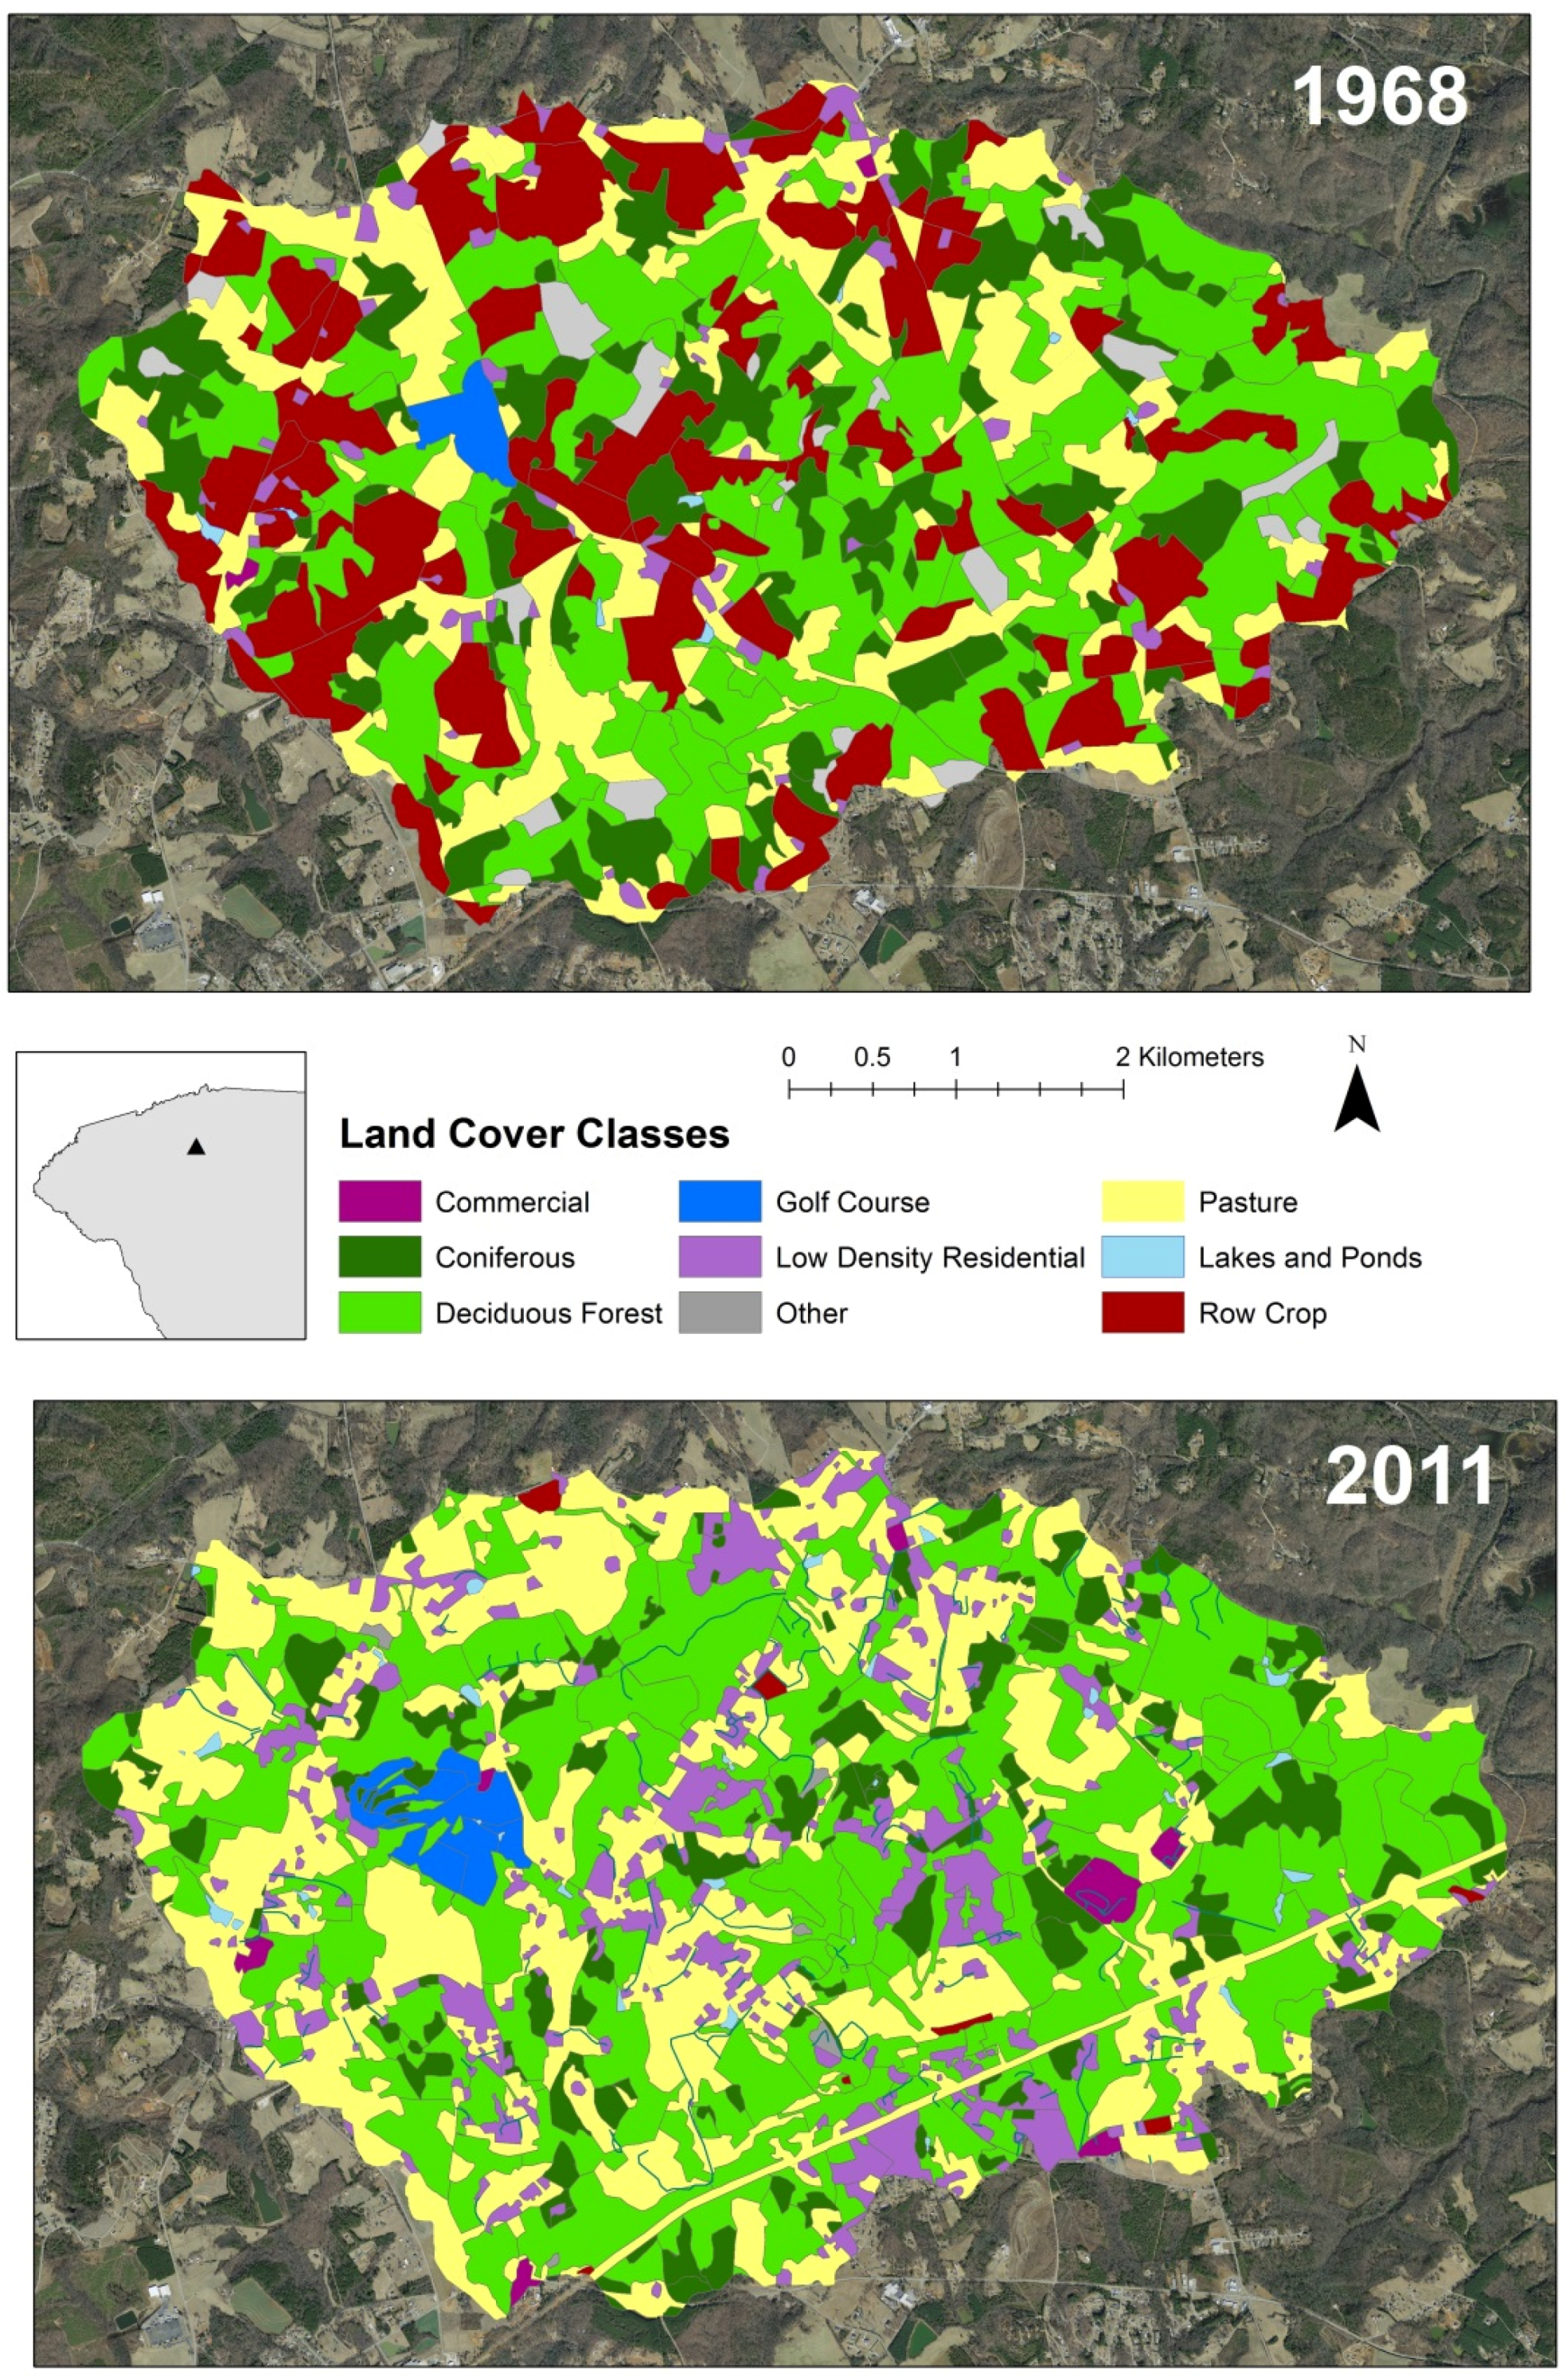
2.2. Classification of Land Cover Patterns for 1968 and 2011

We used ArcMap 10.1 to digitize aerial photograph mosaics from 1968 and 2011 and classify land cover patterns from each time period. Air photos were chosen for use over satellite imagery for 2011 to allow for methodological consistency between sampling periods. We identified 12 land cover classes and calculated the area for each land cover in 1968 and 2011 (Table 1). Low density residential, commercial, and other land covers were comprised of different ratios of turfgrass, deciduous forest, and impervious surface.
Figure 2. Aerial image from 2011 of the 29.7 km2 Doddies Creek watershed. Inset: The watershed (purple dot) is located within the Piedmont ecoregion (white border) in South Carolina (black border), USA.
Land 04 00513 g002
Table 1. Summary of percent land cover and total and aboveground estimates of NPPact for 12 identified land cover classes in Doddies Creek watershed for 1968 and 2011.
Land CoverEstimated Actual NPP (g·C·m−2·y·r−1)
Percent of Watershed19682011
19682011TotalAbovegroundTotalAboveground
Coniferous forests and plantations15.7%10.0%1004.0777.11004.0777.1
Deciduous forests7.9%39.0%1053.0723.21053.0723.2
Mixed forest24.2%NA1028.5750.2NANA
Transitional3.1%3.0%256.089.2256.0180.8
Row crop25.6%0.4%278.6234.6657.5563.4
Pasture, hay, and grasslands19.1%32.3%252.9134.0296.1156.9
Golf course turf grass0.8%1.7%1100.5786.11100.5786.1
Low density residential2.2%10.0%608.0325.2608.0325.2
Commercial0.1%0.9%75.136.175.136.1
Ponds and lakes0.2%0.6%0.00.00.00.0
Impervious surface1.1%2.0%0.00.00.00.0
OtherNA0.2%NANA435.9253.0
Total watershed area is 29.9 km2; Low density residential consists of 15% deciduous forest, 60% turfgrass, and 25% impervious surface; Commercial land cover consists of 0% deciduous forest, 10% turfgrass, and 90% impervious surface.

2.3. Calculation of Potential NPP (NPPpot)

Potential net primary production, NPPpot, is the estimated net primary production of an ecosystem with a particular set of environmental conditions. A variety of methods are available to calculate NPPpot [21,45,53,54,55,56]. We used the multiplicative, empirical model of Zaks et al. [55] to estimate NPPpot. The model is a modified and updated version of the Miami model that uses both temperature and precipitation data to calculate NPPpot (supplementary information). We calculated average temperature and precipitation data from a meteorological station in Greenville, SC, with a record extending from 1898 to 2012 [44]. While the multiplicative model is limited because it does not account for solar radiation or ambient carbon dioxide concentration, the relationship is empirically based, has been shown to generate reasonable predictions of NPPpot, and is easily understood [53,55]. Furthermore, the data necessary for this model are more readily available for researchers and practitioners interested in local scale processes than those data required for more detailed models.
To calculate NPPpot for the watershed, we assumed a 50% carbon content for dry organic matter from temperate trees [57]. We used the root:shoot ratio of 0.241 for “other temperate broadleaf forest/plantation” [58] to estimate aboveground NPPpot as a function of total NPPpot. This ratio assumes an older undisturbed deciduous forest that has a shoot biomass >150 Mg·ha−1 [58].

2.4. Calculation of Actual NPP (NPPact)

NPPact is the actual amount of NPP associated with vegetation growing within the watershed boundaries. We estimated NPPact using values from the literature adjusted to the specific characteristics of those land covers within Doddies Creek watershed.
We calculated net primary production (NPPact) for total and aboveground (Table 1) as the summed net primary production of existing vegetation in each type of land cover (NPPLC) in the study area (Equation (1)). Specifics for each land cover type are described below.
NPPact = Σ AreaLC × NPPLC

2.4.1. Forest Cover NPPact

Total NPPact values for the coniferous forest, coniferous plantation, and deciduous forest land covers were based on data specific to the state of South Carolina [59]. The results in Milesi et al. [49] compare reasonably well to the estimates of 1951–2007 total NPPact for the southeastern United States estimated by Tian et al. [60], given that those estimates include areas with low precipitation.
Calculation of aboveground NPPact from total NPPact required the use of a root:shoot ratio. We chose a root:shoot ratio for forested land cover from Mokany et al. [48]. Shoot biomass has proven to be more physiologically relevant [58] to the determination of the root:shoot ratio than other parameters, like vegetation age, because small variations in an ecosystem can have a substantial impact on vegetation growth. We calculated shoot biomass for forests in the Doddies Creek watershed using an empirical equation developed by Lefsky et al. [61], which relates mean canopy height to shoot biomass.
Shoot Biomass = 0.378 × Mean Canopy Height2
Raw LiDAR data from 2011 [62] were processed in ArcMap 10.1 to estimate a mean canopy height of 14 m for forested land cover in the watershed. The root:shoot ratio, selected from the shoot biomass categories of Mokany et al. [58], was used to calculate an aboveground NPPact for each forest type using the total NPPact data from Milesi et al. [59]. Data from the United States Forest Service [63] indicates that the breast diameter height for trees in 1968 were smaller than 2011, but no data exists for tree heights. Therefore, for the purposes of this study, we assume the difference in tree height does not make enough difference to affect the category of shoot biomass for root:shoot ratio. However, if NPPact is underestimated, then HANPPluc will be underestimated.

2.4.2. Row Crops and Pasture NPPact

The total and aboveground NPPact for row crops and pasture vegetation were back-calculated using data from the United States Department of Agriculture (USDA) Agricultural Census (USDA [52,64], Lobell et al. [65], Hicke et al. [66], and Haberl et al. [19]. Equations (3) and (4) [66] convert harvest data to NPPact in g·C·m−2·y−1.
P = Σ [ ( P C × M R Y × ( 1 M C ) × C ) / ( H I × f A G ) ]
N P P = P / Σ A
In Equation (3), production (P), is a function of production of crops in reported units (PC), mass per reported yield (MRY), harvest moisture content (MC), carbon conversion (C, 0.45 g C/g), harvest index (HI), and fraction of production allocated above ground (fAG). In Equation (4), total NPPact is a function of production and area of the crop. Crop production (PC) and crop area (A) were estimated for 1968 and 2011 using 1969 and 2012 USDA Census crop production data for Pickens County [52,64] for corn, soybeans, wheat sorghum, cotton, and hay. Data from Lobell et al. [65] were used to estimate MRY, MC, and HI for both row crops and hay. Data from Hicke et al. [66] were used for C and fAG. Aboveground NPPact for each crop type was calculated by setting fAG to a value of 1.0. A loss factor of 1.14 [19] was used to account for pre-harvest total NPPact losses during the growth period.

2.4.3. Turf Grass NPPact

Turf grass is an important component in golf course, commercial, and low density residential land cover types. The NPPact values and root:shoot ratios for turf grass were from Wu and Bauer [67] and Falk [68]. We assumed two different turf grass management practices. Turf grass in the golf course land cover was assumed to be well irrigated and heavily fertilized [67]. Turf grass for low-density residential and commercial land covers was assumed to never be fertilized nor irrigated, and during the growing season is mowed once every 2 weeks [68]. Since the golf course was being constructed in the 1968 aerial photograph, we assumed that turf grass had not yet begun to be maintained as described above. Wu and Bauer [67] estimated the total NPPact for golf courses to be 1100.5 g·C·m−2·y−1. Falk [68] estimated the total NPPact for minimally maintained residential lawns to be 751.1 g·C·m−2·y−1. To estimate aboveground NPPact, we used the ratio of root and shoot biomass for residential and golf course turf grasses in Falk [68] to calculate root to shoot ratios of 1.08 for residential turf grass and 0.4 for golf course turf grass. Golf courses and most rural residences in the region do not bag grass clippings, so we assumed that turf grass NPP is not harvested.

2.4.4. Residential, Commercial, Transitional, & Other NPPact

NPPact of residential, commercial, and other land covers was estimated as a mixture of turfgrass, deciduous forest, and impervious surface. Analysis of air photos indicated average residential land cover within the watershed consisted of approximately 60% turfgrass, 15% deciduous forest, and 25% impervious surface. Average commercial land cover consisted of approximately 10% turfgrass and 90% impervious surface. Land classified as “other” land use in 2011 was anthropogenically altered but not identifiable as residential or commercial. On average, these areas contained approximately 30% turfgrass, 20% deciduous forest, and 50% impervious surface. We assigned water bodies and impervious surfaces (e.g., buildings, roads, parking lots, and driveways) an NPPact of 0.00 g·C·m−2·y−1 [19]. Milesi et al. [59] defined the NPPact for transitional land cover (changing land cover with sparse vegetation) 25% of the NPPact of the second most dominant land cover. Given that air photo and visual observation suggests that transitional land cover is shrubland, we used the aboveground NPPact for transitional shrubland estimated for 1951–2007 of Tian et al. [60] for the southeastern United States. A root:shoot ratio of 1.837 [58] was used to estimate total NPPact for transitional shrubland.

2.5. Calculation of Harvested NPP (HANPPharv)

HANPPharv (Equation (5)) represents the amount of NPPact that was harvested by human activity and livestock and the amount of NPPact lost via pre-harvest herbivory. Harvest of crops includes livestock grazing or harvest of hay (HANPPharvH), harvest of row crops (HANPPharvR), and harvest of wood (HANPPharvW). NPPFR is carbon returned to the soil via livestock feces and is subtracted from the HANPPharvH.
HANPPharv = HANPPharvH NPPFR + HANPPharvR + HANPPharvW
We estimated the number of livestock (cattle, pigs, horses, sheep, goats, and mules) in the Doddies Creek watershed using data from the 1969 and 2012 USDA Census of Agriculture [52,64] (Supplementary Information). We assumed that the number of each type of livestock in the watershed were proportional to the percentage of Pickens County pasture located in the watershed (9.8% in 1968, 15.2% in 2011). We used species-specific daily feed intake values from Haberl et al. [19] to calculate consumption of fodder crops and we assumed fodder crop dry matter was 45% carbon [65]. In both years, cattle accounted for more than 84% of the feed demand. For Pickens County, feed demand was greater than available hay harvest in both 1968 and 2011. The imbalance was accounted for by commercial feed purchases of approximately $4.9 million (2011 dollars) in 1968 and $2.1 million in 2011 [52,53]. Thus, we have assumed that all hay in the watershed is either grazed by livestock or harvested and fed to livestock in the watershed. This assumption would hold even if the number livestock in the watershed were lower by a factor of 3.4 in 1968 and 2.1 in 2011.
To calculate the amount of carbon returned to the soil by livestock feces (NPPFR) we used data from Thomsen et al. [69] and assumed a 14% of the carbon in feed remains in the soil. Our assumption is that all manure is returned to the fields. Given the lack of confined animal feedlot operations in the watershed, we feel this assumption was reasonable.
We used 1969 and 2012 USDA Census of Agriculture data [52,64] to determine harvested area and yield for Pickens County for hay, corn, soybean, wheat, sorghum and cotton. Equation (3) was used to calculate the production of individual row crops and hay in kg·C·y−1. We calculated a harvest-weighted average HANPPharv for row crops using the area within the watershed identified as row crop and assuming that the harvest ratio among various crop harvests for the Doddies Creek watershed was the same as for Pickens County in 1969 and 2012 [52,64].
We used and compared two methods to estimate the area of timber harvest. First, we clipped the global forest loss estimates from Hansen et al. [70] at the extent of the watershed to calculate area of forest cover harvested in the watershed for 2011 and the 2010–2012 three-year average. This method was only applicable to the 2011 analysis as satellite data did not exist for 1968.
Second we estimated the volume of hardwood and softwood timber harvested using data from the United States Forest Service for Pickens County in 1968 and 2011 [63]. Timber harvest in the watershed was scaled to the percentage of Pickens County forested land located in the watershed (1.56% in 1968 and 1.52% in 2011). Harvest data was corrected for losses during harvest using the recovery rates in Haberl et al. [19] and then converted to biomass using densities provided by Haberl et al. [19].
We then back calculated the timber harvest area using these estimates of forest ecosystem biomass. We estimated that harvested biomass represented 96% of the forest ecosystem biomass based on data for South Carolina forests [71], and converted timber harvest biomass to forest ecosystem harvest biomass. We used the equation of Lefsky et al. [72] to estimate the forest ecosystem biomass per hectare (Equation (6)). We used LiDAR data to estimate mean canopy height for 2011. Using the estimated forest ecosystem biomass per hectare for South Carolina [71], we then calculated the area of timber harvest for watershed. To estimate the HANPPharvW, we multiplied the estimated timber harvest area by the weighted total and aboveground NPPact for forest in the watershed.
Aboveground Biomass (Mg/ha) = 20.7 + 0.098 × Mean Canopy Height2
The Hansen et al. [70] estimate of forest cover loss indicated a decline in forest cover in the watershed of 2.07 ha in 2011, with three year average (2010–2012) of forest area decline of 11.7 ha. Back calculations of timber harvest area suggested a range of timber harvest areas from 6.9 to 10.4 ha. The estimated timber harvest area for 1968 likely is a slight underestimate because tree heights were shorter in 1968 based on a comparison of the distribution of breast-height diameter of trees in 1968 and 2011 [63]. Satellite data does not exist for 1968, so only back calculated estimates are used to determine the area of timber harvest and HANPPharvW.

2.6. Calculation of HANPP

HANPP is defined by Haberl et al. [19] as the amount of potential net primary production (NPPpot) appropriated by humans because of land use change (HANPPluc) and harvesting (HANPPharv) of crops, hay, and timber (Figure 3; Equation (7)). HANPPluc is the difference between NPPpot and NPPact. All units are in g·C·y−1 for the watershed. Percent HANPP is the ratio of HANPP to NPPpot.
HANPP = (NPPpot − NPPact) + HANPPharv
Figure 3. Conceptual model of HANPP. NPPpot is potential NPP of vegetation assuming average climate conditions, NPPact is actual NPP in the watershed, HANPPluc is NPP loss caused by land use change, HANPPharv includes both NPP harvested by humans (used) and NPP lost via herbivory (unused). NPPeco is the NPP remaining in the landscape ecosystem post-harvest. Modified from Haberl et al. [56].
Land 04 00513 g003

2.7. Sensitivity Analysis

We calculated Sobel sensitivity indices [73] from the sensitivity package [74] for Program R [75] to evaluate the sensitivity of watershed HANPPharv model output extrapolated from county input variables via Monte Carlo simulations.

3. Results

3.1. Land Cover Change

Land cover in 1968 (Figure 4) was dominated by agriculture and forest. Agriculture covered about 45% of the watershed, with row crop constituting more than half of the agricultural land cover. Nearly half the area of the watershed was forested land cover. Developed (low-density residential, commercial, and roads) land cover was less than 3.5% of the watershed. Land cover in 2011 (Figure 4) was again largely forest and agriculture. However, although forest cover increased slightly, agricultural land cover decreased by about 12% and shifted to nearly all pasture (Figure 5). Developed land cover increased to over 12%, driven by increase in low-density residential land cover (Figure 5). Our land cover analysis results align well with the remotely sensed estimates from USDA Cropscape for 2011 [76]. Overall, land cover change between 1968 and 2011 (Figure 5) was most evident in a slight recovery of forest, shift from row crop to pasture, and agriculture being replaced by low-density residential land cover.
Figure 4. Land cover classification for Doddies Creek watershed in 1968 and 2011.
Land 04 00513 g004

3.2. Estimates of NPPact

The estimated aboveground NPPact for the watershed was 13.7 Gg·C·y−1 in 1968 and 13.8 Gg·C·y−1 in 2011, a 0.7% increase in 40 years. Estimated total NPPact was 18.9 Gg in 1968 and 20.8 Gg in 2011, a 10% increase. The estimated aboveground and total NPPact was dominated by forest land cover in both 1968 and 2011 (Table 1, Figure 6a). The NPPact of pasture nearly doubled between 1968 and 2011 for both total and aboveground (Table 1, Figure 6b). This primarily reflects an over 400 ha increase in the area of pastureland combined with an increase in NPP of hay. Although, the corn and soybean NPP increased per unit area between 1968 and 2011 (Table 1), the contribution of row crop to the total and aboveground NPPact of the watershed decreased from over 12% to less than 1%, reflecting the decline in row crop area. Wheat, sorghum, and cotton were absent from the landscape by 2011. During that same time, the contribution of low-density residential land cover to total and aboveground NPPact increased from about 1.5% to over 7% (Figure 6). Although the NPPact of golf course turfgrass is high, the contribution to watershed scale NPPact is less than 3%. Commercial and other land covers constituted less than 2% of NPP. Overall, unlike global estimates, the watershed measure of NPPact reflects changes in land cover within the watershed rather than agricultural harvest.
Figure 5. Change in percent of total area for different land covers for the Doddies Creek watershed between 1968 and 2011.
Land 04 00513 g005

3.3. Estimates of HANPPharv

Aboveground HANPPharv for the watershed declined about 4% between 1968 and 2011. This change conceals a major redistribution within the harvest data (Figure 7). Net hay harvest (grazing-fecal return) in the watershed increased from 29% to 92% of HANPPharv. Row crop harvest declines from 59% to 2% of HANPPharv, and timber harvest declines from 12% to 6% of HANPPharv. The decline in row crop harvest occurred despite corn yield nearly doubling and soybean yield increasing nearly 1.5 fold. Weighted crop yields increased from 82 g·C·m−2·y−1 to 198 g·C·m−2·y−1. However, the total row crop harvest declined from 621 Mg·C·y−1 in 1968 to 21 Mg·C·y−1 in 2011. Hay yields also increased from 117 g·C·m−2·y−1 in 1968 to 138 C·m−2·y−1 in 2011. Assuming all visually identified pasture in the watershed was actively grazed or harvested to meet estimated feed demand, the hay harvest in 1968 was about 663 Mg·C·y−1 and the hay harvest in 2011 was 1322 Mg·C·y−1. Aboveground timber harvest decreased by more than half, from 900 Mg·C·y−1 to about 400 Mg·C·y−1. Based on tree harvest data, we estimated 15 to 24 ha were deforested in 1968 and 3 to 11 ha were deforested in 2011. For both years, this represents less than 2% of the forested land cover in the watershed, thus, variance in HANPPharvW makes little or no impact on HANPP.
Figure 6. Percentage of aboveground NPPact in the Doddies Creek watershed for all (a) land cover types and (b) non forest land cover types in 1968 and 2011. Aboveground NPPact for the entire watershed was 13.7 Gg·C·y−1 in 1968 and 13.8 Gg·C·y−1 in 2011. A similar pattern of change was observed for total NPPact.
Land 04 00513 g006
Figure 7. Percent of HANPPharv for 1968 and 2011 for row crop, pasture, and timber harvest. Calculated as HANPPharv = HANPPharvH − NPPFR + HANPPharvR + HANPPharvW.
Land 04 00513 g007

3.4. Sensitivity Analysis

Review of Sobel sensitivity indices [73] for the four input variables in HANPPharv suggested these estimates were relatively insensitive (Sobol indices < 0.35) to simulated change. Likewise, input parameters for NPPact of hay, corn and soybean were insensitive to simulated change with the exception of mass per reported yield across all three crops in both years, though it was less sensitive in the NPPact estimations for hay in 1968.

3.5. Estimates of HANPP

HANPP results are based on an estimated total NPPpot of 27.3 Gg·C·y−1 and aboveground NPPpot of 22.0 Gg·C·y−1 for Doddies Creek watershed. Aboveground HANPP remained the same between 1968 and 2011 at about 9.3 Gg·C·y−1, or about 43%. Total HANPP, however, decreased from 9.4 Gg·C·y−1 to 7.7 Gg·C·y−1, or from 35% to 28%. For both 1968 and 2011, about 87% of total HANPP and 89% of aboveground HANPP was attributed to land use change.
Although aHANPP did not change between 1968 and 2011, the contribution of land covers to aHANPP did change (Figure 8) because of shifts in land cover composition (Figure 9). The contribution of row crop land cover to aHANPP declined from nearly half the aHANPP to less than one percent. In contrast, the contribution of pasture increased 30%. The contribution of residential land cover to aHANPP increased by more than 10% at the expense of agricultural land cover.
Figure 8. Aboveground HANPP percentage of total NPPpot in the Doddies Creek watershed for important land covers in 1968 and 2011. Aboveground HANPP for the entire watershed was 9.7 Gg·C·y−1 ub 1968 and 9.0 Gg·C·y−1 in 2011. A similar pattern of change was observed for total HANPP.
Land 04 00513 g008
Figure 9. Spatial distribution of percent HANPP (HANPP/NPPpot) for (A) 1968; (B) 2011, and (C) the difference.
Land 04 00513 g009aLand 04 00513 g009b

4. Discussion

The spatial and temporal variability of HANPP at global and regional scales reflects the complex relationships between socioeconomic and ecological determinants of land use and land cover change. However, the low resolution of such analyses averages local heterogeneity. Indeed, Krausmann et al. [77] suggest that higher resolution case studies are needed to improve our understanding of the determinants of HANPP that result in the observed spatial heterogeneity. Our study of Doddies Creek watershed provides, to our knowledge, the first high-resolution, watershed-scale case study of change in HANPP. The observed spatial and temporal change in HANPP in the Doddies Creek watershed are similar to patterns observed in larger spatial scale assessments of HANPP. However, more so than studies at broader scales, we are able to link temporal shifts in local HANPP to both local land use decisions and national-level socioeconomic factors beyond the study region. This link, reflecting teleconnections [11], demonstrates the value of HANPP as a potential part of the toolkit for local-scale sustainability efforts that incorporates and connects local and global scale drivers of land use and land cover change. Thus, this study begins to fill a gap in HANPP research by demonstrating applicability of the method at the watershed scale [56].

4.1. Methodological Challenges and Limitations of HANPP at the Watershed Scale

Application of HANPP methodology to the smaller watershed scale does face several challenges and limitations associated with data [22,56]. First, many models of estimating NPPpot are in use (e.g., [53,54,55]) each with advantages and disadvantages. For example, the model used here resulted in estimated NPPact of forested land cover, the largest land cover in the watershed, being greater than calculated NPPpot which lead to increased HANPP. Although this result could reflect human influence such as nitrogen fertilization of the forests, it may also be a methodological artifact that leads to an underestimate of HANPP. Additionally, because of the model we used, we assumed that NPPpot is the same in 1968 and 2011. Our methodological choice does not account for changing atmospheric CO2 concentrations, which may cause NPPpot to increase over time [22], although degraded soil conditions in the Piedmont may limit the effect.
A second limitation is scaling of available data, a common problem in global and national level HANPP studies [22]. In our study, most of the NPPact data for forested and transitional land cover are from regional studies and agricultural and timber harvest data are from county level surveys. Application of NPPact data to the local watershed scale relied on assumptions regarding types and biomass of the forest. Though forest biomass estimates are somewhat constrained for 2011 by a LiDAR estimate of canopy height, no constraint existed for 1968. As a result, the fact that NPPact is greater than NPPpot could also be caused by an overestimate of NPPact for the watershed, as United States Forest Service breast-height diameter data [63] indicates that trees in Pickens County were smaller in 1968 than in 2011.
Estimates for HANPPharv were somewhat better, because harvest data is available at the county level. However, extrapolation of data for row crop, hay, and timber harvest and livestock numbers to the watershed scale involves important assumptions. First, agricultural survey data are collected every five years, and are not from the same year as the air photos. Second, given the lack of farm-level data, we assumed that we could scale livestock and harvest data proportionally to land area. Third, harvest indices also are an estimate based on the literature, and can be variable given local environmental conditions and farming methods [37]. Fourth, our estimate of grazing by livestock is constrained by a lack of actual grazing data, and is focused on estimated generic feed requirements [19,22]. However, the feed demand is greater than the available hay, even if livestock numbers where half of our estimate. Fifth, HANPPharvW requires extrapolation of timber harvest data from the county scale to the watershed scale and also requires assumptions regarding forest ecosystem biomass, which are difficult to estimate. Sixth, exact forest, turfgrass, and impervious surface proportions of low density residential and commercial land covers were quite variable. For this watershed, the small percentage of these two land covers (<15%) minimizes this issue. However, complex small-scale heterogeneity is typical of urban watersheds [78], and may make application of this method to urbanized watersheds more difficult and time consuming when air photos are used for time periods prior to satellite imagery. Despite these limitations, sensitivity analysis results suggest that extrapolation of county data for HANPPharv calculations were not sensitive to our assumptions. Thus, application of global HANPP methods to the watershed scale appears to give useful and reasonable results.

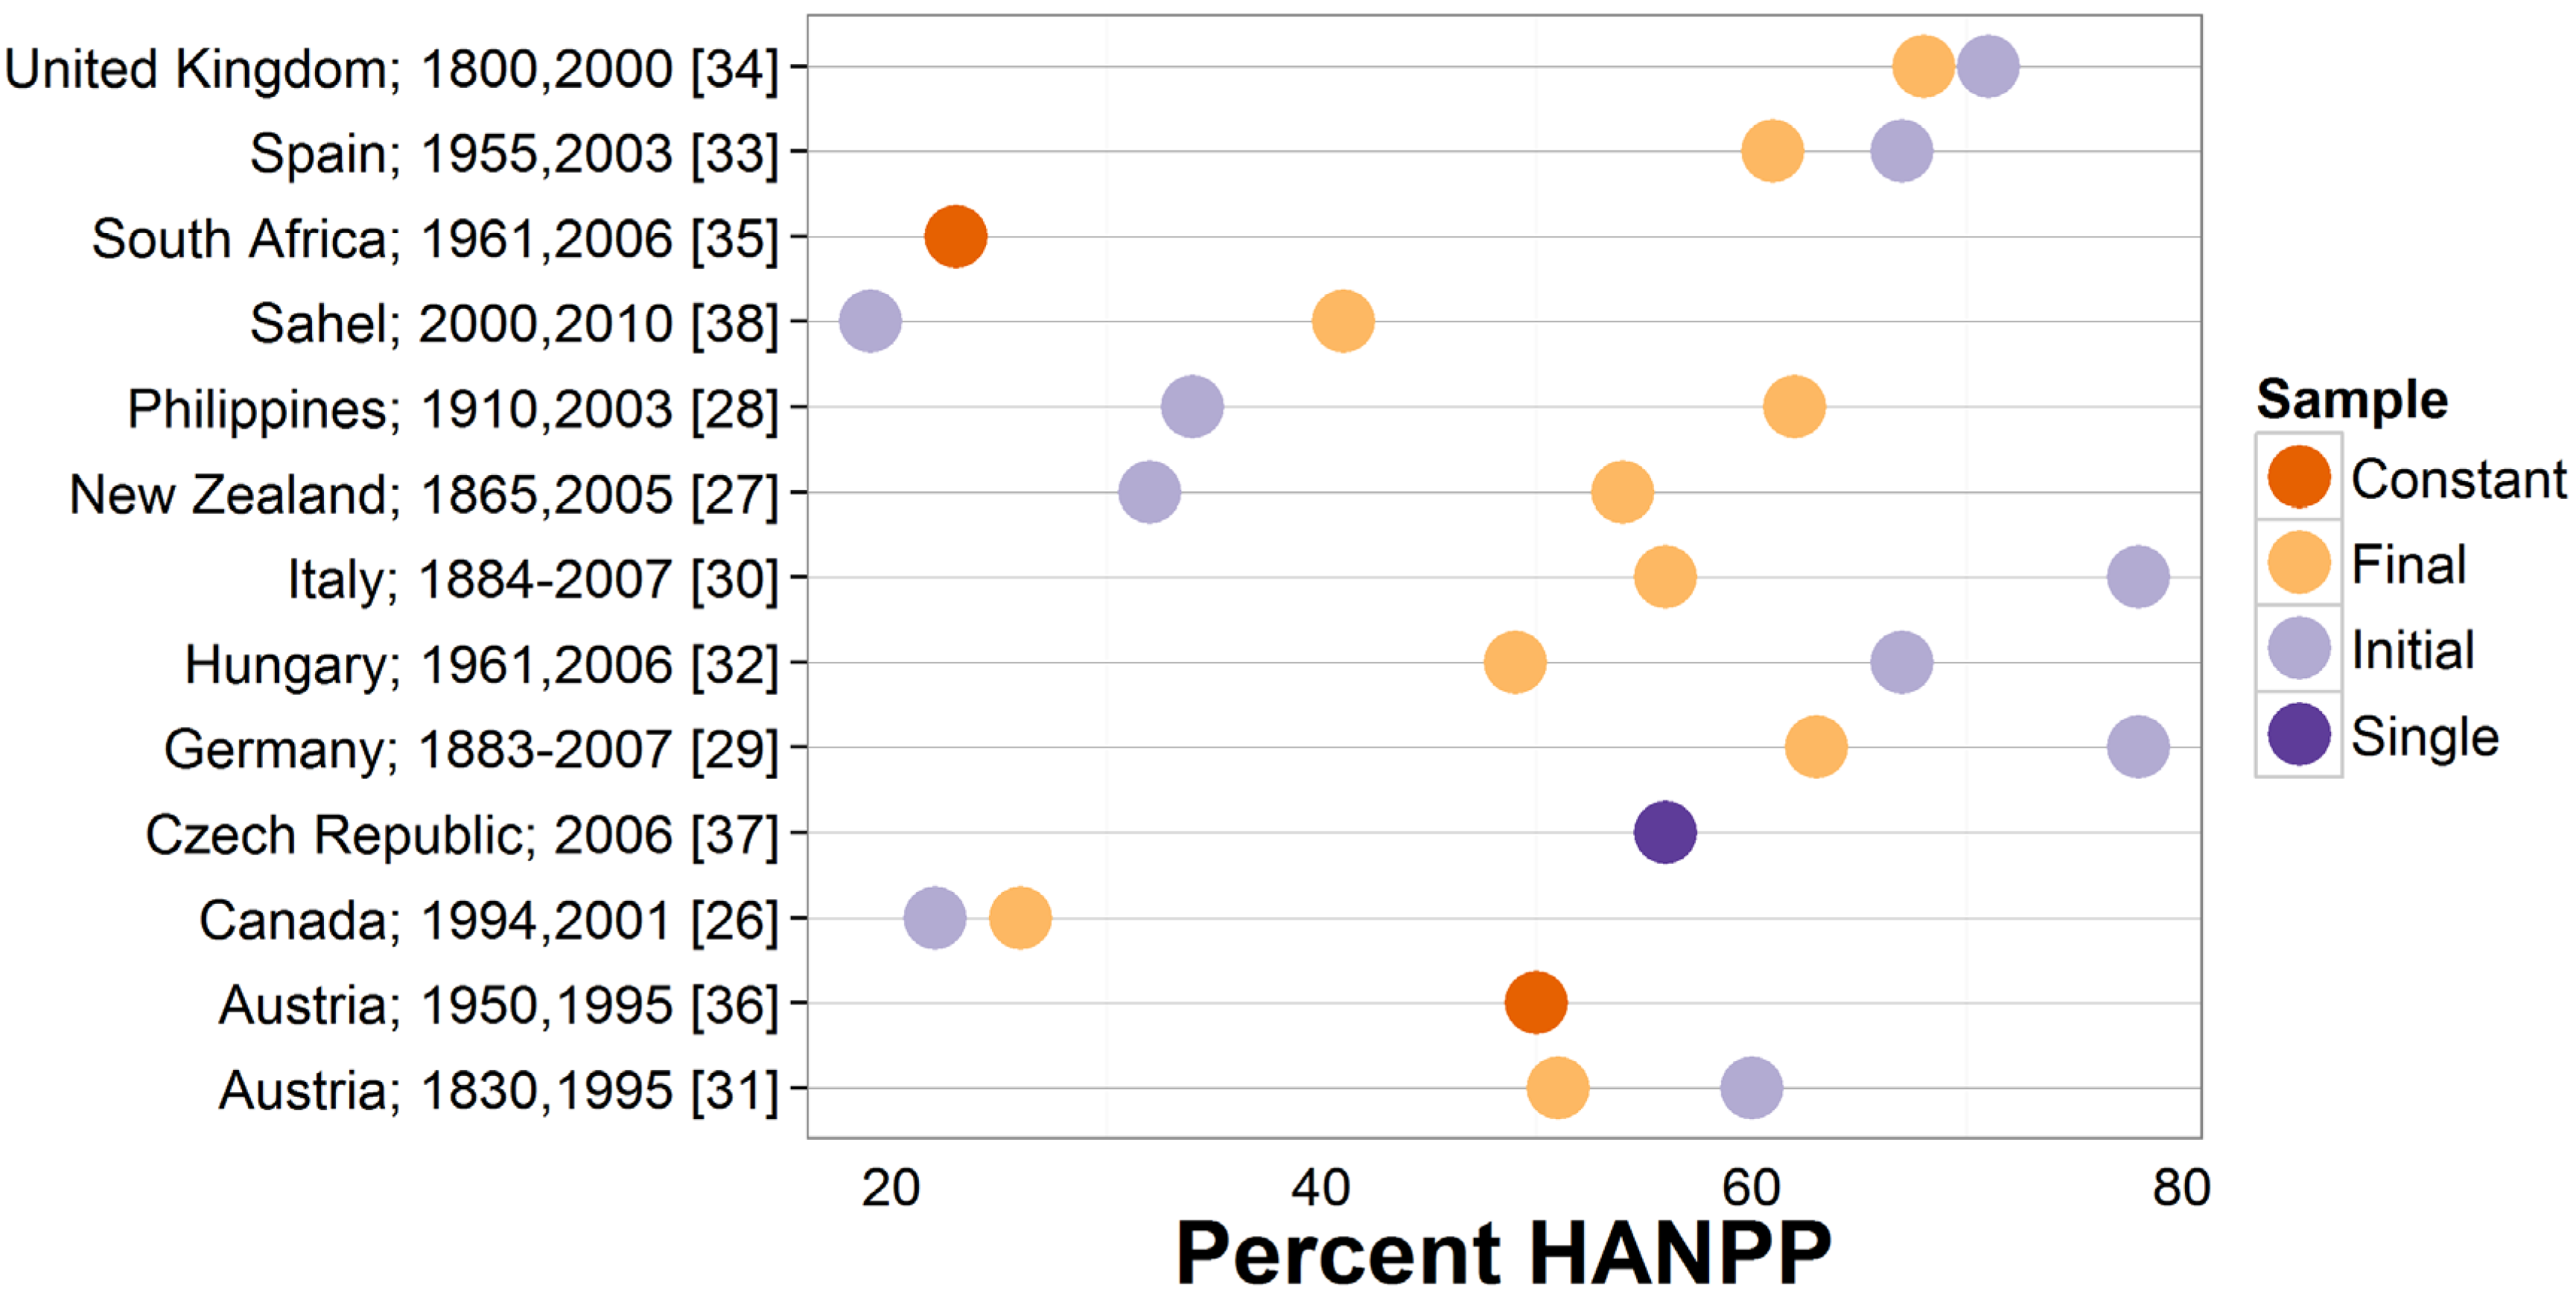
4.2. Comparison to Regional and National Patterns of HANPP

The measured total and aboveground HANPP at the watershed scale in both 1968 and 2011 are relatively low compared to regional and national scale studies (Figure 1). Given, however, that almost half of Doddies Creek watershed is semi-natural forest (Figure 4), measured HANPP compares well with the Czech Republic where aHANPP was measured between 60%–70% in areas of intensive agriculture, but was as low as 44% in areas with more semi-natural vegetation [37]. Likewise, in agricultural landscapes of Austria, a higher proportion of forested land and lower agricultural intensity correlated with HANPP as low as 45% [39]. In addition, the impacts of agriculture and developed land cover are offset by NPPact being greater than NPPpot for forested land cover, similar again to data reported from Czech Republic [37].
Total HANPP in Doddies Creek watershed declined over time, while abovegound HANPP remained relatively constant. The results reflect a shift in agricultural land use from row crop and pasture to pasture with some low density residential development, but little change in forested land cover. Thus, land use change from forest to agriculture constitutes nearly 90% of the aHANPP in Doddies Creek watershed. South Africa [35] and Austria [36] did have estimates of HANPP that did not differ between a comparable 50 year time span. For South Africa [35], the aboveground HANPP remained constant despite significant changes in land use associated with agricultural intensification and socio-political change. For Austria [36], forest cover increased and urban area increased, whereas agricultural land decreased. Decreases in agricultural land cover were offset by increases in harvest and aboveground NPPact associated with agricultural intensification. In contrast, studies of Spain [33], Hungary [32], New Zealand [27], and the United Kingdom [34] all showed declines in aHANPP over time. In each of these nations, decline in aHANPP was associated with a decrease in row crop cover caused by industrialization of agriculture and concomitant increases in pasture or forest cover.

4.3. Agroecological Teleconnections and Feedbacks

Global yield growth as a function of the industrialization of agriculture [79,80] has resulted in a decoupling between global HANPP and growth of population and the economy [21], and decline of HANPP in some countries [25], but not in others [35,36] (Figure 1). The shift in HANPPharv in Doddies Creek watershed from a mix of row crop and pasture to primarily pasture reflects the local impact of the above global agricultural industrialization. Indeed, in more developed nations, agricultural intensification has led to a decrease in cropland and HANPP [21,25], though with different causative factors.
Thus, at the local scale, changes in HANPP reflect teleconnections to regional and global drivers, particularly the extent and intensification of agroecosystems as part of ongoing global agrarian-industrial transition [81]. Between 1970 and 2005, the global extent of row crop cover increased between 12% and 21% [81], while yields increased 123% [82]. Trends may have slowed more recently (1985–2005), with the area of cropland and pasture increasing by 3% globally and yield increases varying between cereal, oil, and fodder crops [83,84]. In contrast, within North America, yields of row crops have increased [50,85], while in the area of row-crop land cover is estimated to be declining at a rate of 500,000 ha per year [85]. In the Piedmont region of the Southeastern United States, the area of agricultural land cover has held steady, but row crop has been replaced by pasture as row crop production shifted to other areas of the country [50]. More locally, row crop cover decreased in Pickens County by approximately 75% between 1968 and 2011 [42,62] and decreased by 99% in Doddies Creek watershed.
The decline in arable cropland in the Doddies Creek watershed, as for much of the Piedmont, was potentially related to a number of ecological and socioeconomic factors. This decline might be a function of local soil degradation [41] or that farms in the Piedmont are too small and hilly to be economically competitive with large-scale industrial agriculture in the Midwest United States [50,67]. The poor economic return of farming (e.g., [50]) has made urban sprawl increasingly viable, including in the Piedmont ecoregion [48,50,86] and South Carolina specifically [49]. Shifts in population from the northern U.S. to the southern U.S. caused growth in the footprint of metropolitan regions between Atlanta and Charlotte [47]. Following this pattern, low-density residential land cover increased from 2% to 10% of the Doddies Creek watershed.
Alternatively, the emerging market for biofuels creates a new, and potentially large, driver of land transformation [10,11]. The increased production of biomass required for energy [10] will require expansion of agricultural land, as well as expansion of biofuel production into pasture land and marginal cropland [13,14,87]. This new demand may lead to increased competition for land between the production of food and the production of biofuels for energy [13]. Demand for renewable energy in the European Union, driven by policy, already is exerting increased pressure on forests in the southern United States because of the demand for wood pellets for fuel [12]. Abandoned cropland and pasture land in the United States, especially in the southeastern US, is a likely target for bioenergy expansion [15]. In addition to pellets made from wood [14], switchgrass shows potential for making fuel pellets for export [88,89]. In the short term, a period of reforestation of pasture for fuel pellet production would cause a decrease in aHANPP. A conversion of current cropland in the Doddies Creek watershed to switchgrass production should result in an increase in aHANPP because carbon would no longer be returned to the soil via livestock feces.

4.4. Applications to Land Use Change and Scenario Planning

Consideration of the teleconnections of a watershed scale assessment of HANPP provides further evidence that the relationship between land use change, agriculture, and HANPP is complex [77] and local land management for provision of ecological functions needs to reflect local socio-ecological conditions but consider a global context [90]. Unlike the larger scale estimates of HANPP, our results more accurately reflect spatial heterogeneity, which would allow local land owners and decision makers to use these data for future land use planning. Specifically, integrating a widely recognized global measure of land use intensity (i.e., HANPP) to local land use change and associated decisions enables individuals and groups to track change in land use intensity over time and embed decision making and policy development into a global context. Temporal changes in HANPP could then be interpreted in terms of feedbacks between global food and energy systems, regional migrations, and the history of local land use not necessarily evident at a single scale of assessment. In addition, because of the measurements that go into estimating HANPP (land cover change and biomass harvest), consideration of HANPP can help better elucidate how current and future land use decisions might simultaneously impact multiple ecological functions and ecosystem states (sensu [91]). In this way, HANPP provides a more complete measure of the impacts of changes in intensity of local land use valuable for scenario planning. Such scenario planning could identify tradeoffs of different land cover proportions and arrangements proposed and tracked (e.g., [47,92,93,94,95]) and could be used to link multiple watershed scale assessments across to a region, building a bottom up assessment of change to complement regional and global scale measures. Below, we consider the application of these ideas given the expected change to southern Piedmont [47] in which the Doddies Creek watershed is embedded within.
Given the recognized feedbacks between local, regional, and global drivers in the southern Piedmont region, the greatest change in land use will likely be an increase in urban areas [47,50] at the expense of farmland and its associated functions, unless biofuel production on small farms becomes lucrative. Assuming the pattern of development follows the rest of the region (e.g., [42]), the pasture land in the watershed could become a potential target for commercial and residential development and limited reforestation. Thus, land use change most likely will continue to be the primary driver of HANPP in the region.
Our data indicates that low density residential land cover with trees had a lower HANPP than pasture. These results suggest the conversion of row crop or pasture land cover back to patchy suburban forest should result in a decrease in watershed HANPP. This concept, however, needs to be tested further with higher levels of housing density. The lower HANPP of low-density residential land use (HANPP = 50%–60%) suggests an increase in ecological function over the land use it is replacing, i.e., agriculture (HANPP = 70%–80%). Consequently, the impact of sprawling growth may in fact increase ecological functions in populated forest anthromes if sufficient forest cover be maintained or restored as part of neighborhood development plans.
Loss of agroecosystems from a watershed may decrease intensity of land use, but agricultural land does provide important ecological functions. Perhaps the most important is food production, but agricultural lands also provides a range of other essential ecosystem services, such as soil conservation, aesthetic landscapes, and habitat [96]. Therefore, though it may reflect greater land use intensity, the resiliency of local communities is enhanced by a productive local agroecosystem and the relationship between land use intensity and food sovereignty should be considered.

4.5. Future Work

Future work should continue to address scaling issues when calculating HANPP. Our study addressed the challenge of measuring HANPP at a middle-level scale between the plot [39] and region [28] scale of past measures of HANPP. A significant methodological challenge for watershed scale studies is the application of data collected at different spatial scales and at different times than available air photo or satellite data. The semi-decadal collection of county-level agricultural data in the United States or regional studies of NPPact for forests are good examples. Standardizing methods by which data are scaled, both spatially and temporally, would improve future comparisons. In addition to scale, future research should continue to address the sensitivity of HANPP calculations to uncertainties associated with assumptions about available data. Indeed such an assessment would also be valuable in identifying key factors or drivers of change in HANPP at given scales, thus better connecting HANPP to regional and local management efforts. Such efforts will be particularly important for the application of HANPP methods to urbanized watersheds with complex, heterogeneous land use patterns [57].
The lower HANPP of low-density residential relative to agriculture suggests a lower intensity of land use and perhaps a change benefiting biodiversity. However, the relationship between HANPP and biodiversity and between ecosystem function, biodiversity, and land use intensity remains unclear [97], particularly in agroecosystems [94] with lower NPP [98]. This suggests future research is needed to evaluate relationships between HANPP, biodiversity, and ecosystem function. Past work linking function to biodiversity in agriculture provides a starting point within one land use type. For example, pasture or managed grasslands support greater biodiversity and ecological function, for example pollination and biological control, then high-intensity row crops [99,100]. Haberl et al. [39], in a study of small plots in Austria, did show that an increase HANPP was correlated to a decrease in biodiversity, especially at an HANPP above 50%, but the conclusions of plot-scale projects are difficult to scale up. Thus, to better connect spatial and temporal patterns of HANPP to patterns of biodiversity and related functions and services and thus identify unique conservation opportunities in human systems [101], it would be valuable in the future to simultaneously assess HANPP, biodiversity, and ecological function as a watershed transitions from row crop to pasture and ideally monitor the subsequent transition from pasture to urban.

5. Conclusions

This study successfully applied global scale methods of estimating HANPP at a local watershed scale, filling a gap in HANPP research [46]. This application also demonstrates that temporal shifts in local land use and subsequent decline in HANPP and stability of aHANPP reflects complex teleconnections between local farming, global scale industrialization of agriculture, and shifting demographics. Lastly, the results indicate the value of HANPP as a potential multi-scale indicator that links local and global drivers of land cover change and could potentially improve local land use planning.

Supplementary Materials

Supplementary materials can be accessed at: https://www.mdpi.com.

Acknowledgments

This research is a part of the River Basins Research Initiative at Furman University. Research was supported by a Furman University Furman Advantage grant to Kyle Donovan. We thank Helmut Haberl (Institute of Social Ecology, Alpen-Adria University, Vienna, Austria) for help with method development. Comments and suggestions from the editor and two anonymous reviewers substantially improved the manuscript.

Author Contributions

C.B.A. and R.K.D. conceived and designed the research. R.K.D. and J.E.Q. conducted land cover analysis and acquired literature data. C.B.A., R.K.D., and J.E.Q. developed the spreadsheet model and figures, researched the literature, and wrote the manuscript.

Conflicts of Interest

The authors declare no conflict of interest.

References

  1. Sterling, S.; Ducharne, A. Comprehensive data set of global land cover change for land surface model applications. Glob. Biogeochem. Cycles 2008, 22, 1–20. [Google Scholar] [CrossRef]
  2. Ellis, E.; Ramunkutty, N. Putting people on the map: Anthropogenic biomes of the world. Front. Ecol. Environ. 2008, 6, 439–447. [Google Scholar] [CrossRef]
  3. Crutzen, P. Geology of mankind. Nature 2002, 415, 23. [Google Scholar] [CrossRef] [PubMed]
  4. Rockström, J.; Steffen, W.; Noone, K.; Persson, Å; Chapin, F.S.; Lambin, E.F.; Lenton, T.M.; Scheffer, M.; Folke, C.; Schellnhuber, H.J.; et al. A safe operating space for humanity. Nature 2009, 461, 472–475. [Google Scholar] [CrossRef] [PubMed]
  5. Ellis, E. Anthropogenic transformation of the terrestrial biosphere. Philos. Trans. R. Soc. A 2011, 369, 1010–1035. [Google Scholar] [CrossRef] [PubMed]
  6. Hobbs, R.J.; Arico, S.; Aronson, J.; Baron, J.S.; Bridgewater, P.; Cramer, V.A.; Epstein, P.R.; Ewel, J.J.; Klink, C.A.; Lugo, A.E.; et al. Novel ecosystems: Theoretical and management aspects of the new ecological world order. Glob. Ecol. Biogeogr. 2006, 15, 1–7. [Google Scholar] [CrossRef]
  7. Lindenmayer, D.B.; Fischer, J.; Felton, A.; Crane, M.; Michael, D.; Macgregor, C.; Montague-Drake, R.; Manning, A.; Hobbs, R.J. Novel ecosystems resulting from landscape transformation create dilemmas for modern conservation practice. Conserv. Lett. 2008, 1, 129–135. [Google Scholar] [CrossRef]
  8. Ellis, E.; Goldewijk, K.K.; Siebert, S.; Lightman, D.; Ramunkutty, N. Anthropogenic transformation of biomes, 1700–2000. Glob. Ecol. Biogeogr. 2010, 19, 589–606. [Google Scholar] [CrossRef]
  9. Ramunkutty, N.; Evan, A.T.; Monfreda, C.; Foley, J.A. Farming the planet: 1. Geographic distribution of global agricultural lands in the year 2000. Glob. Biogeochem. Cycles 2008, 22. [Google Scholar] [CrossRef]
  10. Haberl, H.; Erb, K.-H.; Krausmann, F.; Running, S.; Searchinger, T.D.; Smith, W.K. Bioenergy: How much can we expect for 2050? Environ. Res. Lett. 2013, 8. [Google Scholar] [CrossRef]
  11. Liu, J.; Mooney, H.; Hull, V.; Davis, S.J.; Gaskell, J.; Hertel, T.; Lubchenco, J.; Seto, K.C.; Gleick, P.; Kremen, C.; et al. Sustainability. Systems Integration for Global Sustainability. Science 2015, 347. [Google Scholar] [CrossRef] [PubMed]
  12. Abt, K.L.; Abt, R.C.; Galik, C.S.; Skog, K.E. Effect of Policies on Pellet Production and Forests in the U.S. South: A Technical Document Supporting the Forest Service Update of the 2010 RPA Assessment; General Technical Report SRS-202; US Forest Service, Southern Research Station: Asheville, NC, USA, 2014. [Google Scholar]
  13. Johansson, D.J.A.; Azar, C. A scenario based analysis of land competition between food and bioenergy production in the U.S. Clim. Chang. 2007, 82, 267–291. [Google Scholar] [CrossRef]
  14. Miyake, S.; Renouf, M.; Peterson, A.; McAlpine, C.; Smith, C. Land-use and environmental pressures resulting from current and future bioenergy crop expansion: A review. J. Rural Stud. 2012, 28, 650–658. [Google Scholar] [CrossRef]
  15. Zumkehr, A.; Campbell, J.E. Historical U.S. cropland areas and potential for bioenergy production on abandoned croplands. Environ. Sci. Technol. 2013, 47, 3840–3847. [Google Scholar] [CrossRef] [PubMed]
  16. Brook, B.W.; Ellis, E.C.; Perring, M.P.; Mackay, A.W.; Blomqvist, L. Does the terrestrial biosphere have planetary tipping points? Trends Ecol. Evol. 2013, 28, 396–401. [Google Scholar] [CrossRef] [PubMed]
  17. Vitousek, P.M.; Ehrlich, P.R.; Ehrlich, A.H.; Matson, P.A. Human Appropriation of the Products of Photosynthesis. Bioscience 1986, 36, 368–373. [Google Scholar] [CrossRef]
  18. Haberl, H.; Wackernagel, M.; Krausmann, F.; Erb, K.H.; Monfreda, C. Ecological footprints and human appropriation of net primary production: A comparison. Land Use Policy 2004, 21, 279–288. [Google Scholar] [CrossRef]
  19. Haberl, H.; Erb, K.H.; Krausmann, F.; Gaube, V.; Bondeau, A.; Piutzar, C.; Gingrich, S.; Lucht, W.; Fischer-Kowalski, M. Quantifying and mapping the human appropriation of net primary production in earth’s terrestrial ecosystems. Proc. Natl. Acad. Sci. USA 2007, 104, 12942–12947. [Google Scholar] [CrossRef] [PubMed]
  20. Bishop, J.D.K.; Amaratunga, G.A.J.; Rodriguez, C. Quantifying the limits of HANPP and carbon emissions which prolong total species well-being. Environ. Dev. Sustain. 2010, 12, 213–231. [Google Scholar] [CrossRef]
  21. Krausmann, F.; Erb, K.H.; Gingrich, S.; Haberl, H.; Bondeau, A.; Gaube, V.; Lauk, C.; Plutzar, C.; Searchinger, T.D. Global human appropriation of net primary production doubled in the 20th century. Proc. Natl. Acad. Sci. USA 2013, 110, 10324–10329. [Google Scholar] [CrossRef] [PubMed]
  22. Erb, K.H.; Krausmann, F.; Gaube, V.; Gingrich, S.; Bondeau, A.; Fischer-Kowalski, M.; Haberl, H. Analyzing the global human appropriation of net primary production—Processes, trajectories, implications. An introduction. Ecol. Econ. 2009, 69, 250–259. [Google Scholar] [CrossRef]
  23. Rojstaczer, S.; Sterling, S.M.; Moore, N.J. Human appropriation of photosynthesis products. Science 2001, 294, 2549–2552. [Google Scholar] [CrossRef] [PubMed]
  24. Imhoff, M.L.; Bounoua, L.; Ricketts, T.; Loucks, C.; Harriss, R.; Lawrence, W.T. Global patterns in human consumption of net primary productivity. Nature 2004, 429, 870–873. [Google Scholar] [CrossRef] [PubMed]
  25. Krausmann, F.; Gingrich, S.; Haberl, H.; Erb, K.H.; Musel, A.; Kastner, T.; Kohlheb, N.; Niedertscheider, M.; Schwartzmüller, E. Long-term trajectories of the human appropriation of net primary production: Lessons from six national case studies. Ecol. Econ. 2012, 77, 129–138. [Google Scholar] [CrossRef] [PubMed]
  26. O’Neill, D.W.; Tyedmers, P.H.; Beazley, K.F. Human appropriation of net primary production (HANPP) in Nova Scotia, Canada. Reg. Environ. Chang. 2007, 7, 1–14. [Google Scholar] [CrossRef]
  27. Fetzel, T.; Gradwohl, M.; Erb, K.H. Conversion, intensification, and abandonment: A human appropriation of net primary production approach to analyze historic land use dynamics in New Zealand, 1860–2005. Ecol. Econ. 2014, 97, 201–208. [Google Scholar] [CrossRef]
  28. Kastner, T. Trajectories in human domination of ecosystems: Human appropriation of net primary production in the Philippines during the 20th century. Ecol. Econ. 2009, 69, 260–269. [Google Scholar] [CrossRef]
  29. Niedertscheider, M.; Kuemmerle, T.; Muller, D.; Erb, K.-H. Exploring the effects of drastic institutional and socio-economic changes on land system dynamics in Germany between 1883 and 2007. Glob. Environ. Chang. 2014, 28, 98–108. [Google Scholar] [CrossRef] [PubMed]
  30. Niedertscheider, M.; Erb, K.-H. Land system change in Italy from 1884 to 2007: Analyzing north-south divergence on the basis of an integrated indicator framework. Land Use Policy 2014, 39, 366–375. [Google Scholar] [CrossRef] [PubMed]
  31. Krausmann, F. Land use and industrial modernization: An empirical analysis of human influence on the functioning of ecosystems in Austria 1830–1995. Land Use Policy 2001, 18, 17–26. [Google Scholar] [CrossRef]
  32. Kohlheb, N.; Krausmann, F. Land use change, biomass production and HANPP: The case of Hungary 1961–2005. Ecol. Econ. 2009, 69, 292–300. [Google Scholar] [CrossRef]
  33. Schwarzlmüller, E. Human appropriation of aboveground net primary production in Spain, 1955–2003: An empirical analysis of the industrialization of land use. Ecol. Econ. 2009, 69, 282–291. [Google Scholar] [CrossRef]
  34. Musel, A. Human appropriation of net primary productivity in the United Kingdom, 1800–2000. Changes in society’s impact on ecological energy flows during the agrarian-industrial transition. Ecol. Econ. 2009, 69, 270–281. [Google Scholar] [CrossRef]
  35. Niedertschnieder, M.; Gingrich, S.; Erb, K.H. Changes in land use in South Africa between 1961 and 2006: An integrated socio-ecological analysis based on the human appropriation of net primary production framework. Reg. Environ. Chang. 2012, 12, 715–727. [Google Scholar] [CrossRef]
  36. Haberl, H.; Erb, K.H.; Krausmann, F.; Loibl, W.; Schulz, N.; Weisz, H. Changes in ecosystem processes induced by land use: Human appropriation of aboveground NPP and its influence on standing crop in Austria. Glob. Biogeochem. Cycles 2001, 15, 929–942. [Google Scholar] [CrossRef]
  37. Vačkář, D.; Orlitová, E. Human appropriation of aboveground photosynthetic production in the Czech Republic. Reg. Environ. Chang. 2011, 11, 519–529. [Google Scholar] [CrossRef]
  38. Abdi, A.M.; Seaquist, J.; Tenenbaum, D.E.; Eklundh, L.; Ardö, J. The supply and demand of net primary production in the Sahel. Environ. Res. Lett. 2014, 9. [Google Scholar] [CrossRef]
  39. Haberl, H.; Schulz, N.B.; Plutzar, C.; Erb, K.H.; Krausmann, F.; Loibl, W.; Moser, D.; Sauberer, N.; Weisz, H.; Zechmeister, H.G.; et al. Human appropriation of net primary production and species diversity in agricultural landscapes. Agric. Ecosyst. Environ. 2004, 102, 213–218. [Google Scholar] [CrossRef]
  40. Clark, B.T.; Burkardt, N.; King, D. Watershed management and organizational dynamics: Nationwide findings and regional variation. Environ. Manag. 2005, 36, 297–310. [Google Scholar] [CrossRef] [PubMed]
  41. Zedler, J.B. Wetlands at your service: Reducing impacts of agriculture at the watershed scale. Front. Ecol. Environ. 2003, 1, 65–72. [Google Scholar] [CrossRef]
  42. Muthukrishnan, S.; Lewis, G.P.; Andersen, C.B. Chapter 24. Relations among land cover, vegetation index, and nitrate concentrations in streams of the Enoree River Basin, piedmont region of South Carolina, USA. In Concepts and Applications in Environmental Geochemistry; Sarkar, D., Datta, R., Hannigan, R., Eds.; Elsevier Press: New York, NY, USA, 2007; pp. 515–539. [Google Scholar]
  43. Raich, J.W.; Rastetter, E.B.; Melillo, J.M.; Kicklighter, D.W.; Steudler, P.A.; Peterson, B.J.; Grace, A.L.; Moore, B., III; Vorosmarty, C.J. Potential net primary productivity in South America: Application of a global model. Ecol. Appl. 1991, 4, 399–429. [Google Scholar] [CrossRef]
  44. National Oceanic and Atmospheric Administration. National Climate Data Center. Available online: http://www.ncdc.noaa.gov/cdo-web/datasets/GHCNDMS/locations/CITY:US450005/detail (accessed on 5 December 2014).
  45. Leith, H. Modeling the primary productivity of the world. In Primary Production of the Biosphere; Leith, H., Whittaker, R., Eds.; Springer-Verlag: New York, NY, USA, 1975; pp. 237–263. [Google Scholar]
  46. Olson, D.M.; Dinerstein, E.; Wikramanayake, E.D.; Burgess, N.D.; Powell, G.V.; Underwood, E.C.; D’Amico, J.A.; Itoua, I.; Strand, H.E.; Morrison, J.C. Terrestrial ecoregions of the world: A new map of life on Earth. Bioscience 2001, 51, 933–938. [Google Scholar] [CrossRef]
  47. Terando, A.J.; Costanza, J.; Belyea, C.; Dunn, R.R.; McKerrow, A.; Collazo, J.A. The Southern Megalopolis: Using the past to predict the future of urban sprawl in the Southeast US. PLoS ONE 2014, 9, e102261. [Google Scholar] [CrossRef] [PubMed]
  48. Drummond, M.A.; Loveland, T.R. Land-use pressure and a transition to forest-cover loss in the eastern United States. Bioscience 2010, 60, 286–298. [Google Scholar] [CrossRef]
  49. Waisanen, P.J.; Bliss, N.B. Changes in population and agricultural land in conterminous United States counties, 1790 to 1997. Glob. Biogeochem. Cycles 2002, 16. [Google Scholar] [CrossRef]
  50. Napton, D.E.; Auch, R.F.; Headly, R.; Taylor, J.L. Land use changes and their driving factors in the Southeastern United States. Reg. Environ. Chang. 2010, 10, 37–53. [Google Scholar] [CrossRef]
  51. Daniels, R.B. Chapter 12. Soil erosion and degradation in the southern Piedmont of the USA. In Land Transformation in Agriculture; Wolman, M.G., Fournier, F.G.A., Eds.; John Wiley and Sons: New York, NY, USA, 1987; pp. 407–428. [Google Scholar]
  52. United States Department of Agriculture. Census of Agriculture: 2012 Census Volume 1, Chapter 2: County Level Data. Available online: http://www.agcensus.usda.gov/Publications/2012/Full_Report/Volume_1,_Chapter_2_County_Level/South_Carolina/ (accessed on 15 October 2014).
  53. Cramer, W.; Field, C.B. Comparing global models of terrestrial net primary productivity (NPP): Introduction. Glob. Chang. Biol. 1999, 5. [Google Scholar] [CrossRef]
  54. Adams, B.; White, A.; Lenton, T. An analysis of some diverse approaches to modelling terrestrial net primary productivity. Ecol. Model. 2004, 177, 353–391. [Google Scholar] [CrossRef]
  55. Zaks, D.P.M.; Ramankutty, N.; Barford, C.C.; Foley, J.A. From Miami to Madison: Investigating the relationship between climate and terrestrial net primary production. Glob. Biogeochem. Cycles 2007, 21. [Google Scholar] [CrossRef]
  56. Haberl, H.; Erb, K.H.; Krausmann, F. Human appropriation of net primary production: Patterns, trends, and planetary boundaries. Annu. Rev. Environ. Resour. 2014, 39, 363–391. [Google Scholar] [CrossRef]
  57. Thomas, S.C.; Martin, A.R. Carbon content of tree tissues: A synthesis. Forests 2012, 3, 332–352. [Google Scholar] [CrossRef]
  58. Mokany, K.; Raison, R.; Prokushkin, A.S. Critical analysis of root:shoot ratios in terrestrial biomes. Glob. Chang. Biol. 2006, 12, 84–96. [Google Scholar] [CrossRef]
  59. Milesi, C.; Elvidge, C.D.; Nemani, R.R.; Running, S.W. Assessing the impact of urban land development on net primary productivity in the southeastern United States. Remote Sens. Environ. 2003, 86, 401–410. [Google Scholar] [CrossRef]
  60. Tian, H.; Chen, G.; Liu, M.; Zhang, C.; Sun, G.; Lu, C.; Xu, X.; Ren, W.; Pan, S.; Chappelka, A. Model estimates of net primary productivity, evapotranspiration, and water use efficiency in the terrestrial ecosystems of the southern United States during 1895–2007. For. Ecol. Manag. 2010, 259, 1311–1327. [Google Scholar] [CrossRef]
  61. Lefsky, M.A.; Cohen, W.B.; Harding, D.J.; Parker, G.G.; Acker, S.A.; Gower, S.T. Lidar remote sensing of above-ground biomass in three biomes. Glob. Ecol. Biogeogr. 2001, 11, 393–399. [Google Scholar] [CrossRef]
  62. United States Geological Survey. Earth Explorer. Available online: http://earthexplorer.usgs.gov/ (accessed on 22 July 2013).
  63. USFS Forest Inventory Data Online Web-Application Version: FIDO 1.5.1.05b. U.S. Department of Agriculture, Forest Service: St. Paul, MN, USA. http://apps.fs.fed.us/fia/fido/index.html(accessed on 31 January 2015).
  64. United States Department of Agriculture. Census of Agriculture: 1969 Census, Volume 1, Part 27, Chapters 1 and 4. Available online: http://agcensus.mannlib.cornell.edu/AgCensus/getVolumeOnePart.do?year=1969&part_id=301&number=27&title=South%20Carolina (accessed on 15 October 2014).
  65. Lobell, D.; Hicke, J.; Asner, G.; Field, C.; Tucker, C.; Los, S. Satellite estimates of productivity and light use efficiency in United States agriculture, 1982–1998. Glob. Chang. Biol. 2002, 8, 722–735. [Google Scholar] [CrossRef]
  66. Hicke, J.A.; Lobell, D.B.; Asner, G.P. Cropland area and net primary production computed from 30 years of USDA agricultural harvest data. Earth Interact. 2004, 8, 1–20. [Google Scholar] [CrossRef]
  67. Wu, J.; Bauer, M.E. Estimating net primary production of turfgrass in an urban-suburban landscape with QuickBird imagery. Remote Sens. 2012, 4, 849–866. [Google Scholar] [CrossRef]
  68. Falk, J.H. The primary productivity of lawns in a temperate environment. J. Appl. Ecol. 1980, 17, 689–695. [Google Scholar] [CrossRef]
  69. Thomsen, I.K.; Olesen, J.E.; Møller, H.B.; Sørensen, P.; Christensen, B.T. Carbon dynamics and retention in soil after anaerobic digestion of dairy cattle feed and faeces. Soil Biol. Biochem. 2013, 58, 82–87. [Google Scholar] [CrossRef]
  70. Hansen, M.C.; Potapov, P.V.; Moore, R.; Hancher, M.; Turubanova, S.A.; Tyukavina, A.; Thau, D.; Stehman, S.V.; Goetz, S.J.; Loveland, T.R.; et al. High-Resolution global maps of 21st-century forest cover change. Science 2013, 342, 850–853. [Google Scholar] [CrossRef] [PubMed]
  71. Birdsey, R.A. Carbon Storage and Accumulation in United States Forest Ecosystems; Forest Service General Technical Report WO-59; United States Department of Agriculture: Washington DC, USA, 1992; Available online: http://www.nrs.fs.fed.us/pubs/gtr/gtr_wo059.pdf (accessed on 12 February 2015).
  72. Lefsky, M.A.; Harding, D.J.; Keller, M.; Cohen, W.B.; Carabajal, C.C.; Espirito-Santo, F.D.B.; Hunter, M.O.; de Oliveira, R., Jr. Estimates of forest canopy height and aboveground biomass using ICESat. Geophys. Res. Lett. 2005, 32. [Google Scholar] [CrossRef]
  73. Sobol, I.M. Global sensitivity indices for nonlinear mathematical models and their Monte Carlo estimates. Math. Comput. Simul. 2001, 55, 271–280. [Google Scholar] [CrossRef]
  74. Pujol, P.; Iooss, B.; Janon, A. Sensitivity Analysis. 2015; R Package Version 1.11. Available online: http://CRAN.R-project.org/package=sensitivity(accessed on 11 March 2015). [Google Scholar]
  75. R Core Team. R: A Language and Environment for Statistical Computing. 2014; R Foundation for Statistical Computing: Vienna, Austria. Available online: http://www.R-project.org/(accessed on 11 March 2015). [Google Scholar]
  76. United States Department of Agriculture. National Agricultural Statistics Service Cropscape-Cropland Data Layer. Available online: http://nassgeodata.gmu.edu/CropScape/ (accessed on 23 July 2013).
  77. Krausmann, F.; Haberl, H.; Erb, K.; Wiesinger, M.; Gaube, V.; Gingrich, S. What determines geographical patterns of the global human appropriation of net primary production? J. Land Use Sci. 2009, 4, 15–33. [Google Scholar] [CrossRef]
  78. Bain, D.J.; Hale, R.L.; Wollheim, W.M. Hotbeds of biogeochemical diversity: Insights from urban long-term ecological research sites. Elements 2012, 8, 435–438. [Google Scholar] [CrossRef]
  79. Hazel, P.; Wood, S. Drivers of change in global agriculture. Philos. Trans. R. Soc. B 2008, 363, 495–515. [Google Scholar] [CrossRef] [PubMed]
  80. Tilman, D.; Cassman, K.G.; Matson, P.A.; Naylor, R.; Polasky, S. Agricultural sustainability and intensive production practices. Nature 2002, 418, 671–677. [Google Scholar] [CrossRef] [PubMed]
  81. Krausmann, F.; Fischer-Kowalski, M.; Schandl, H.; Eisenmenger, N. The global sociometabolic transition: Past and present metabolic profiles and their future trajectories. J. Ind. Ecol. 2008, 12, 637–656. [Google Scholar] [CrossRef]
  82. Rudel, T.K.; Schneider, L.; Uriarte, M.; Turner, B.L., 2nd; DeFries, R.; Lawrence, D.; Geoghegan, J.; Hecht, S.; Ickowitz, A.; Lambin, E.F.; et al. Agricultural intensification and changes in cultivated Areas, 1970–2005. Proc. Natl. Acad. Sci. USA 2009, 106, 20675–20680. [Google Scholar] [CrossRef] [PubMed]
  83. Foley, J.A.; Ramankutty, N.; Brauman, K.A.; Cassidy, E.S.; Gerber, J.S.; Johnston, M.; Mueller, N.D.; O’Connell, C.; Ray, D.K.; West, P.C. Solutions for a cultivated planet. Nature 2011, 478, 337–342. [Google Scholar] [CrossRef] [PubMed]
  84. Ray, D.K.; Ramankutty, N.; Mueller, N.D.; West, P.C.; Foley, J.A. Recent patterns of crop yield growth and stagnation. Nat. Commun. 2012, 3, 1293. [Google Scholar] [CrossRef] [PubMed]
  85. Francis, C.A.; Hansen, T.E.; Fox, A.A.; Hesje, P.J.; Nelson, H.E.; Lawseth, A.E.; English, A. Farmland Conversion to Non-Agricultural Uses in the US and Canada: Current Impacts and Concerns for the Future. Int. J. Agric. Sustain. 2012, 10, 8–24. [Google Scholar] [CrossRef]
  86. Brown, D.G.; Johnson, K.M.; Loveland, T.R.; Theobald, D.M. Rural land-use trends in the conterminous United States, 1950–2000. Ecol. Appl. 2005, 15, 1851–1863. [Google Scholar] [CrossRef]
  87. Smith, W.K.; Cleveland, C.C.; Reed, S.C.; Miller, N.L.; Running, S.W. Bioenergy potential of the United States constrained by satellite observations of existing productivity. Environ. Sci. Technol. 2012, 46, 3536–3544. [Google Scholar] [CrossRef] [PubMed]
  88. Sharp, B.E.; Miller, S.A. Estimating maximum land use change potential from a regional biofuel industry. Energy Policy 2014, 65, 261–269. [Google Scholar] [CrossRef]
  89. Bergman, R.D.; Reed, D.L.; Taylor, A.M.; Harper, D.P.; Hodges, D.G. Cradle-to-gate life cycle assessment of switchgrass fuel pellets manufactured in the southeastern United States. Wood Fiber Sci. 2015, 47, 1–13. [Google Scholar]
  90. DeFries, R.S.; Ellis, E.C.; Chapin, F.S., III; Matson, P.A.; Turner, B.L., II; Agrawal, A.; Crutzen, P.; Field, C.; Gleick, P.; Karieva, P.; et al. Planetary opportunities: A social contract for global science change to contribute to a sustainable future. BioScience 2012, 62, 603–606. [Google Scholar] [CrossRef]
  91. Bennett, E.M.; Peterson, G.D.; Gordon, L.J. Understanding relationships among multiple ecosystem services. Ecol. Lett. 2009, 12, 1394–1404. [Google Scholar] [CrossRef] [PubMed]
  92. O’Neill, D.W. Measuring progress in the degrowth transition to a steady state economy. Ecol. Econ. 2014, 84, 221–231. [Google Scholar] [CrossRef]
  93. Polasky, S.; Nelson, E.; Camm, J.; Csuti, B.; Fackler, P.; Lonsdorf, E.; Montgomery, C.; White, D.; Arthur, J.; Garber-Yonts, B. Where to put things? Spatial land management to sustain biodiversity and economic returns. Biol. Conserv. 2008, 141, 1505–1524. [Google Scholar] [CrossRef]
  94. Fischer, J.; Abson, D.J.; Butsic, V.; Chappell, M.J.; Ekroos, J.; Hanspach, J.; Kuemmerle, T.; Smith, H.G.; Wehrden, H. Land sparing versus land sharing: Moving forward. Conserv. Lett. 2014, 7, 149–157. [Google Scholar] [CrossRef]
  95. Kragt, M.E.; Robertson, M.J. Quantifying ecosystem services trade-offs from agricultural practices. Ecol. Econ. 2014, 102, 147–157. [Google Scholar] [CrossRef]
  96. Zhang, W.A.; Ricketts, T.H.; Kremen, C.; Carney, K.; Swinton, S.M. Ecosystem services and dis-services to agriculture. Ecol. Econ. 2007, 64, 253–260. [Google Scholar] [CrossRef]
  97. Haberl, H.; Gaube, V.; Diaz-Delgado, R.; Krauze, K.; Neuner, A.; Peterseil, J.; Plutzar, C.; Singh, S.J.; Vadineanu, A. Towards an integrated model of socioeconomic biodiversity drivers, pressures and impacts. A feasibility study based on three European long-term socio-ecological research platforms. Ecol. Econ. 2009, 68, 1797–1812. [Google Scholar] [CrossRef] [Green Version]
  98. DeFries, R. Past and future sensitivity of primary production to human modification of the landscape. Geophys. Res. Lett. 2002, 29. [Google Scholar] [CrossRef]
  99. Robertson, B.A.; Porter, C.; Landis, D.A.; Schemske, D.W. Agroenergy crops influence the diversity, biomass, and guild structure of terrestrial arthropod communities. BioEnergy Res. 2012, 5, 179–188. [Google Scholar] [CrossRef]
  100. Altieri, M.A. The ecological role of biodiversity in agroecosystems. Agric. Ecosyst. Environ. 1999, 74, 19–31. [Google Scholar] [CrossRef]
  101. Martin, L.J.; Quinn, J.E.; Ellis, E.C.; Shaw, M.R.; Dorning, M.; Kraft, C.E.; Hallett, L.; Heller, N.E.; Hobbs, R.J.; Law, E.; et al. Conservation opportunities across the world’s anthromes. Divers. Distrib. 2014, 20, 745–755. [Google Scholar] [CrossRef]

