Modeling Future Land Cover Changes and Their Effects on the Land Surface Temperatures in the Saudi Arabian Eastern Coastal City of Dammam


Abstract
:1. Introduction
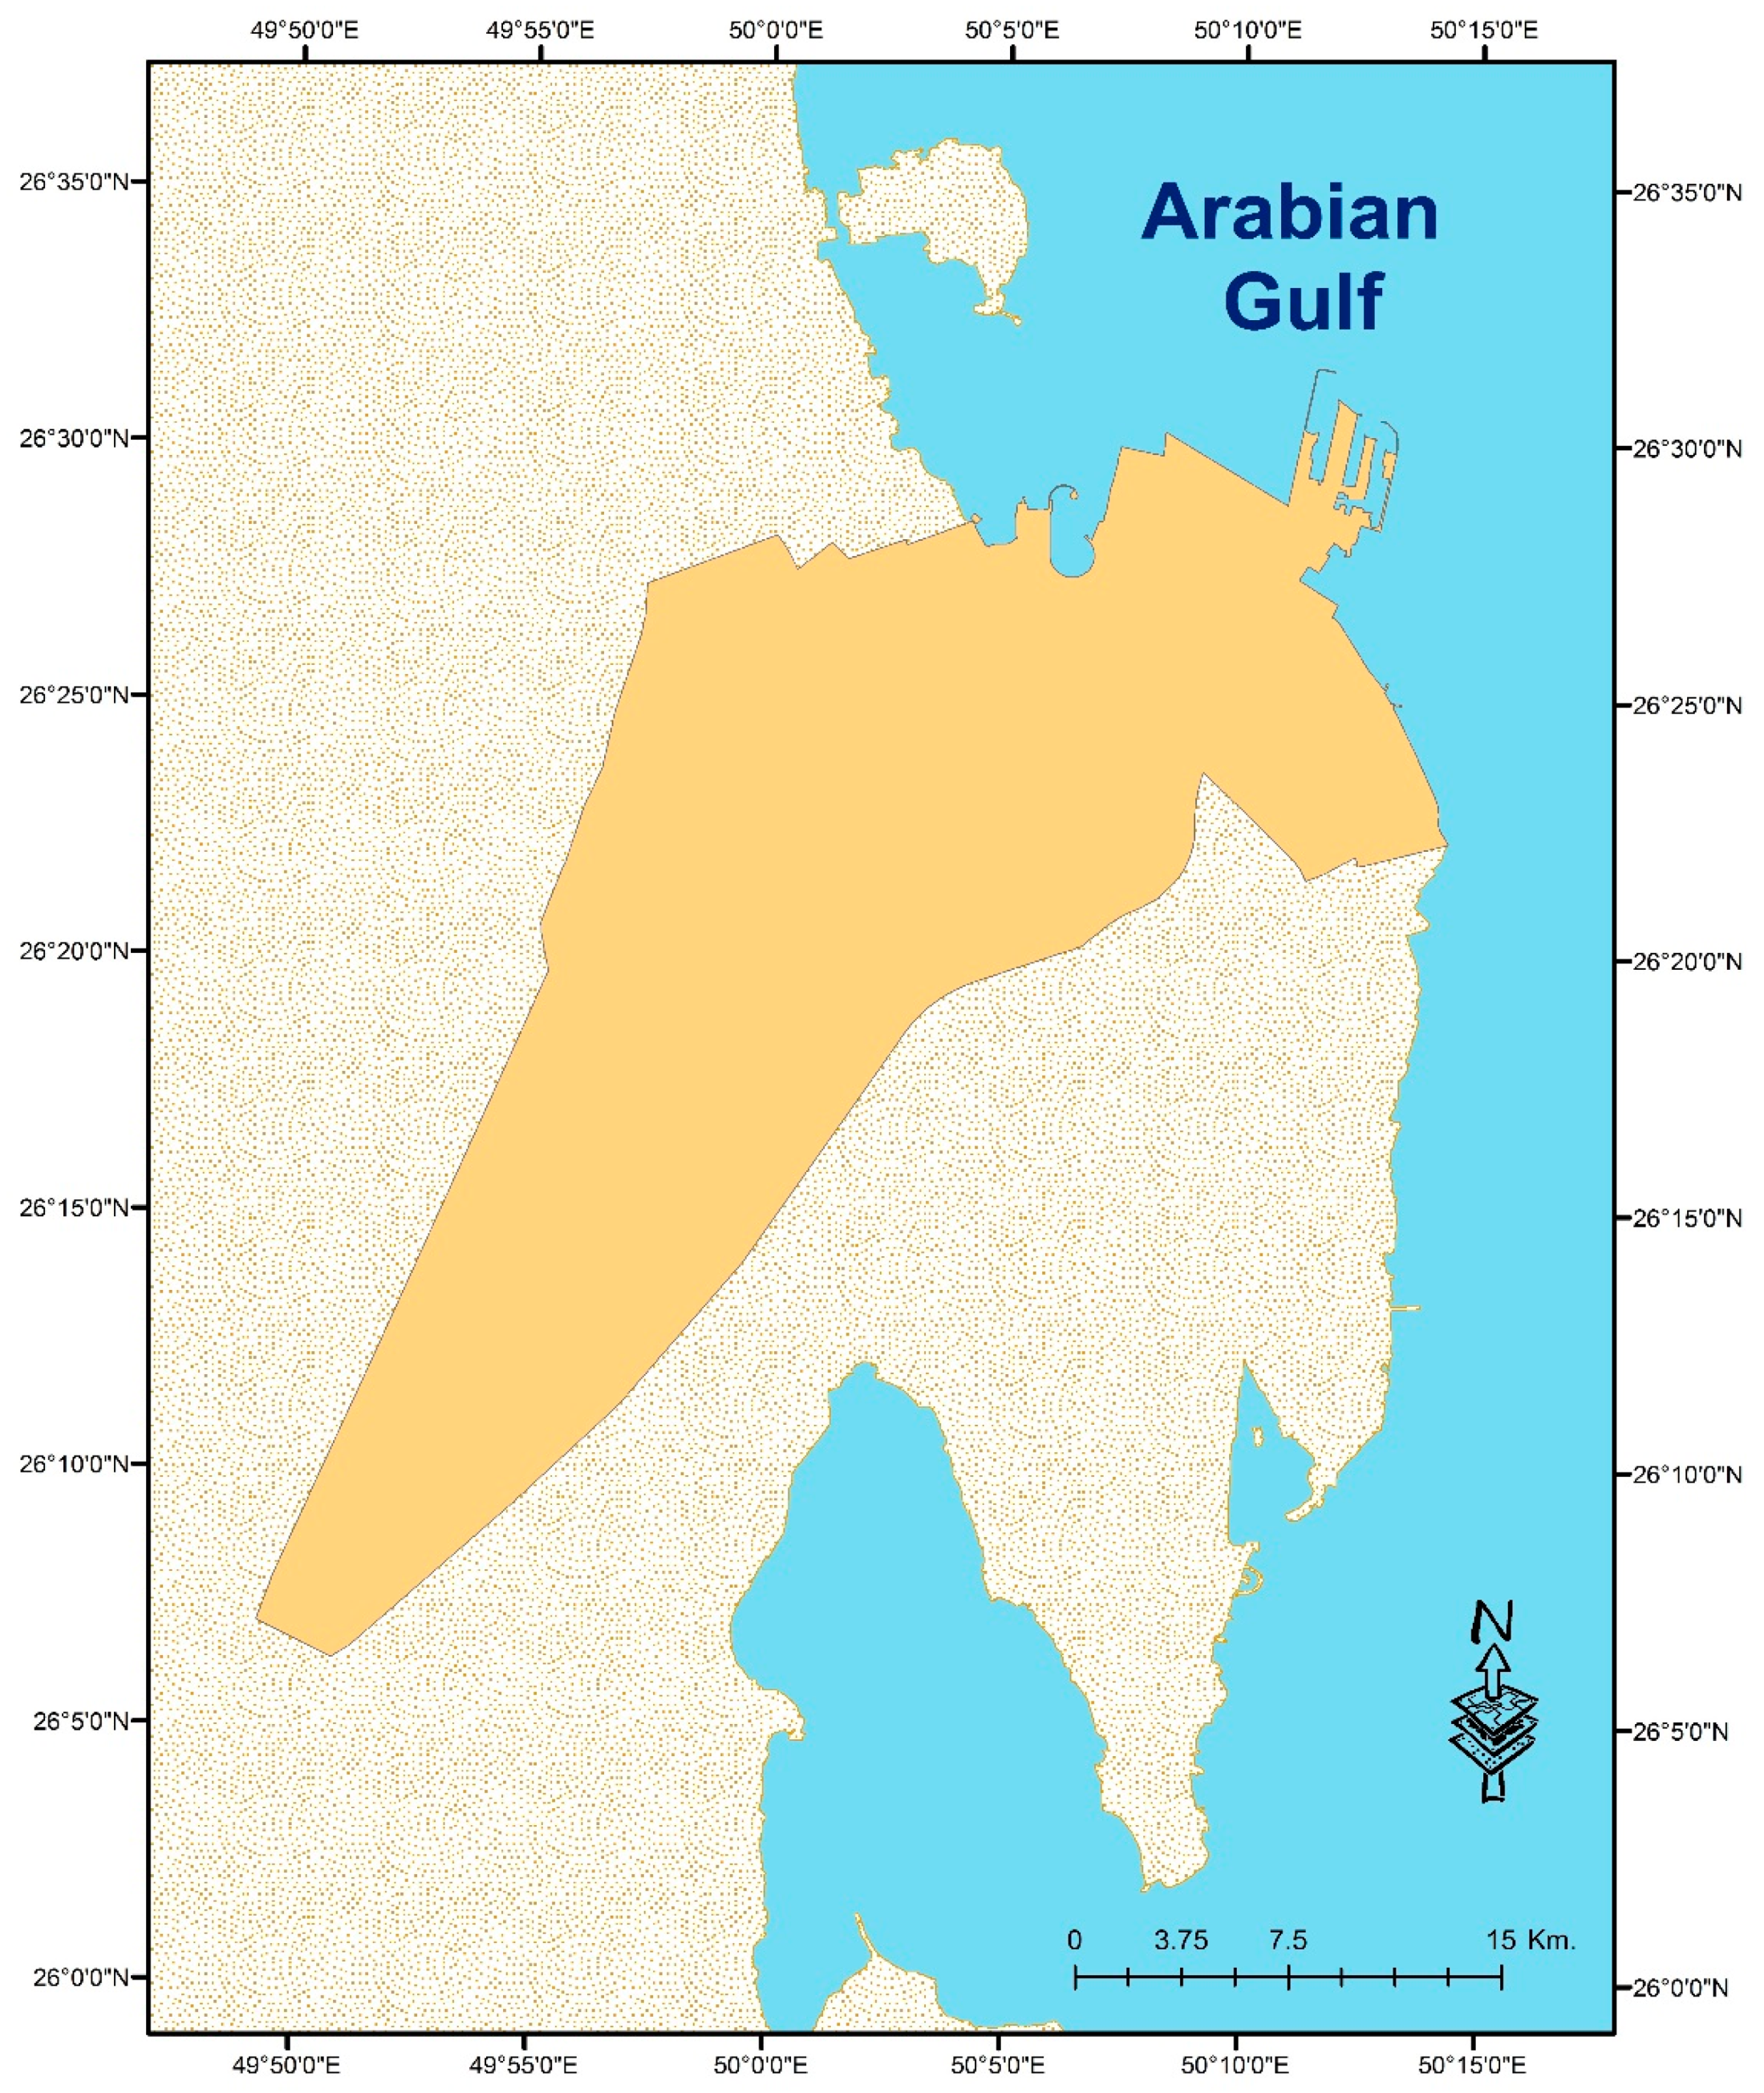
2. Study Area
3. Methodology
3.1. Data Collection, Classification, Accuracy Assessments
3.2. Derivation of LSTs
3.3. Modeling the Land Cover for 2026
3.4. Modeling of LST for 2026
4. Results
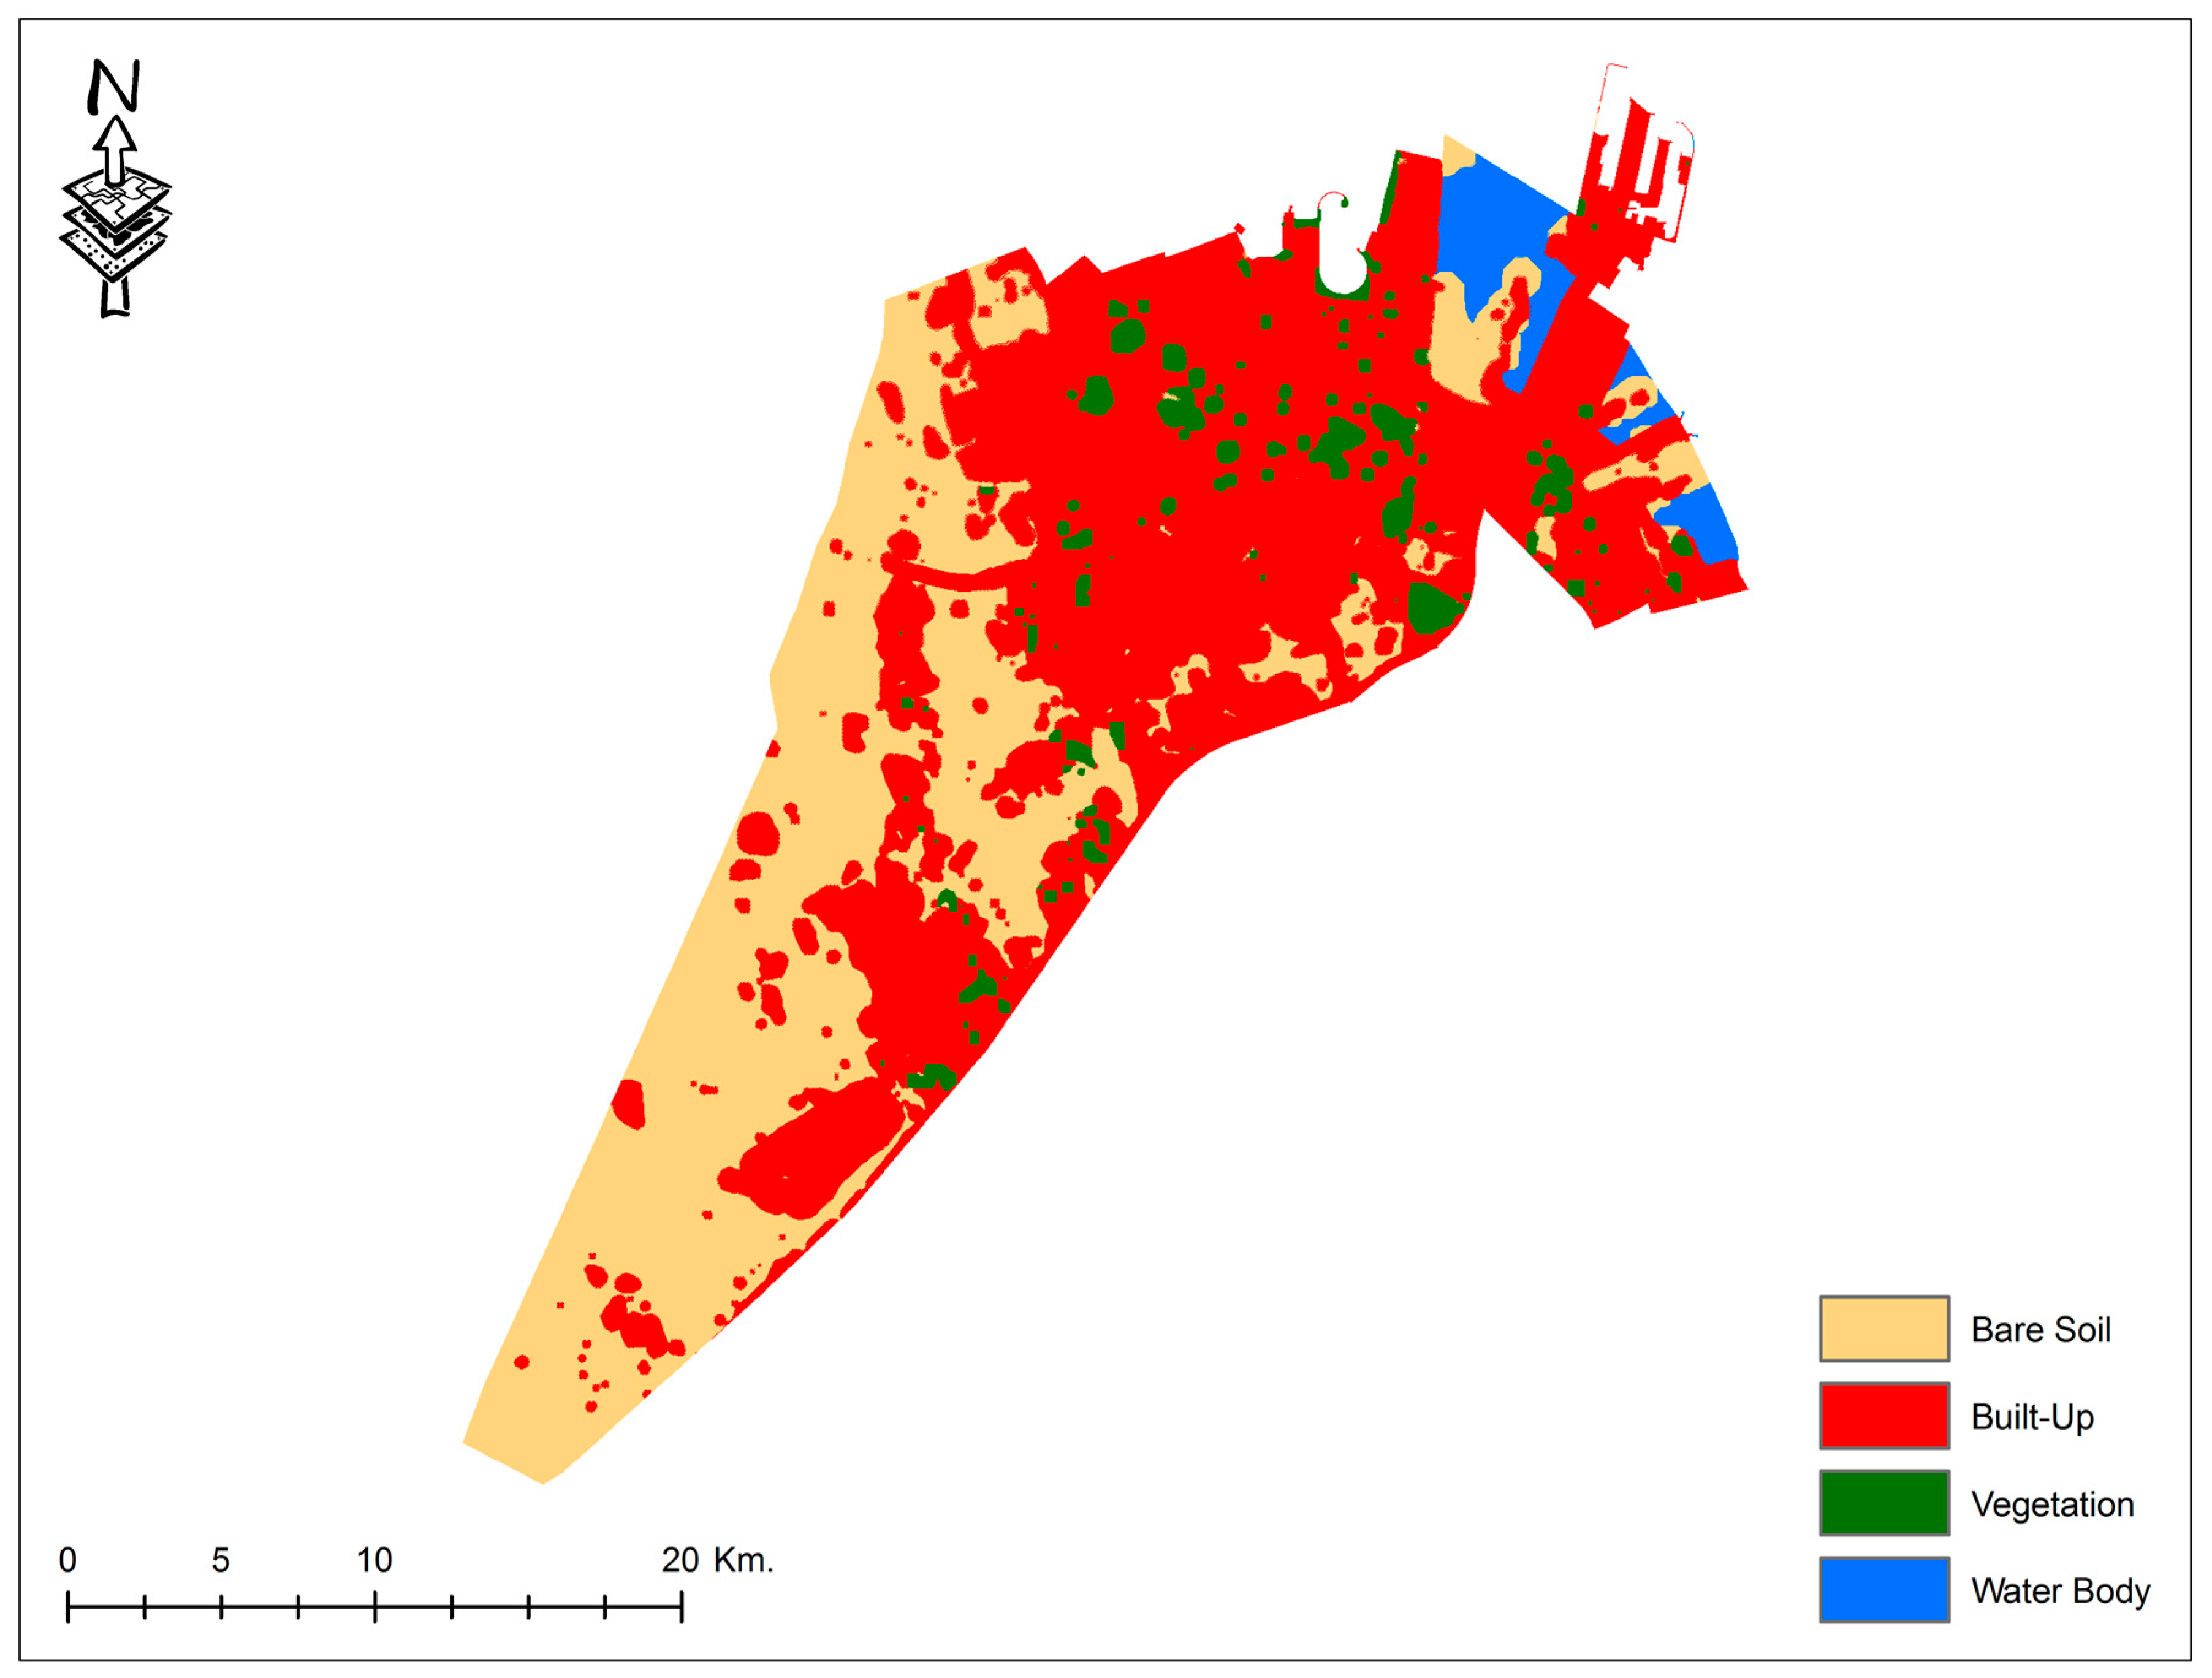
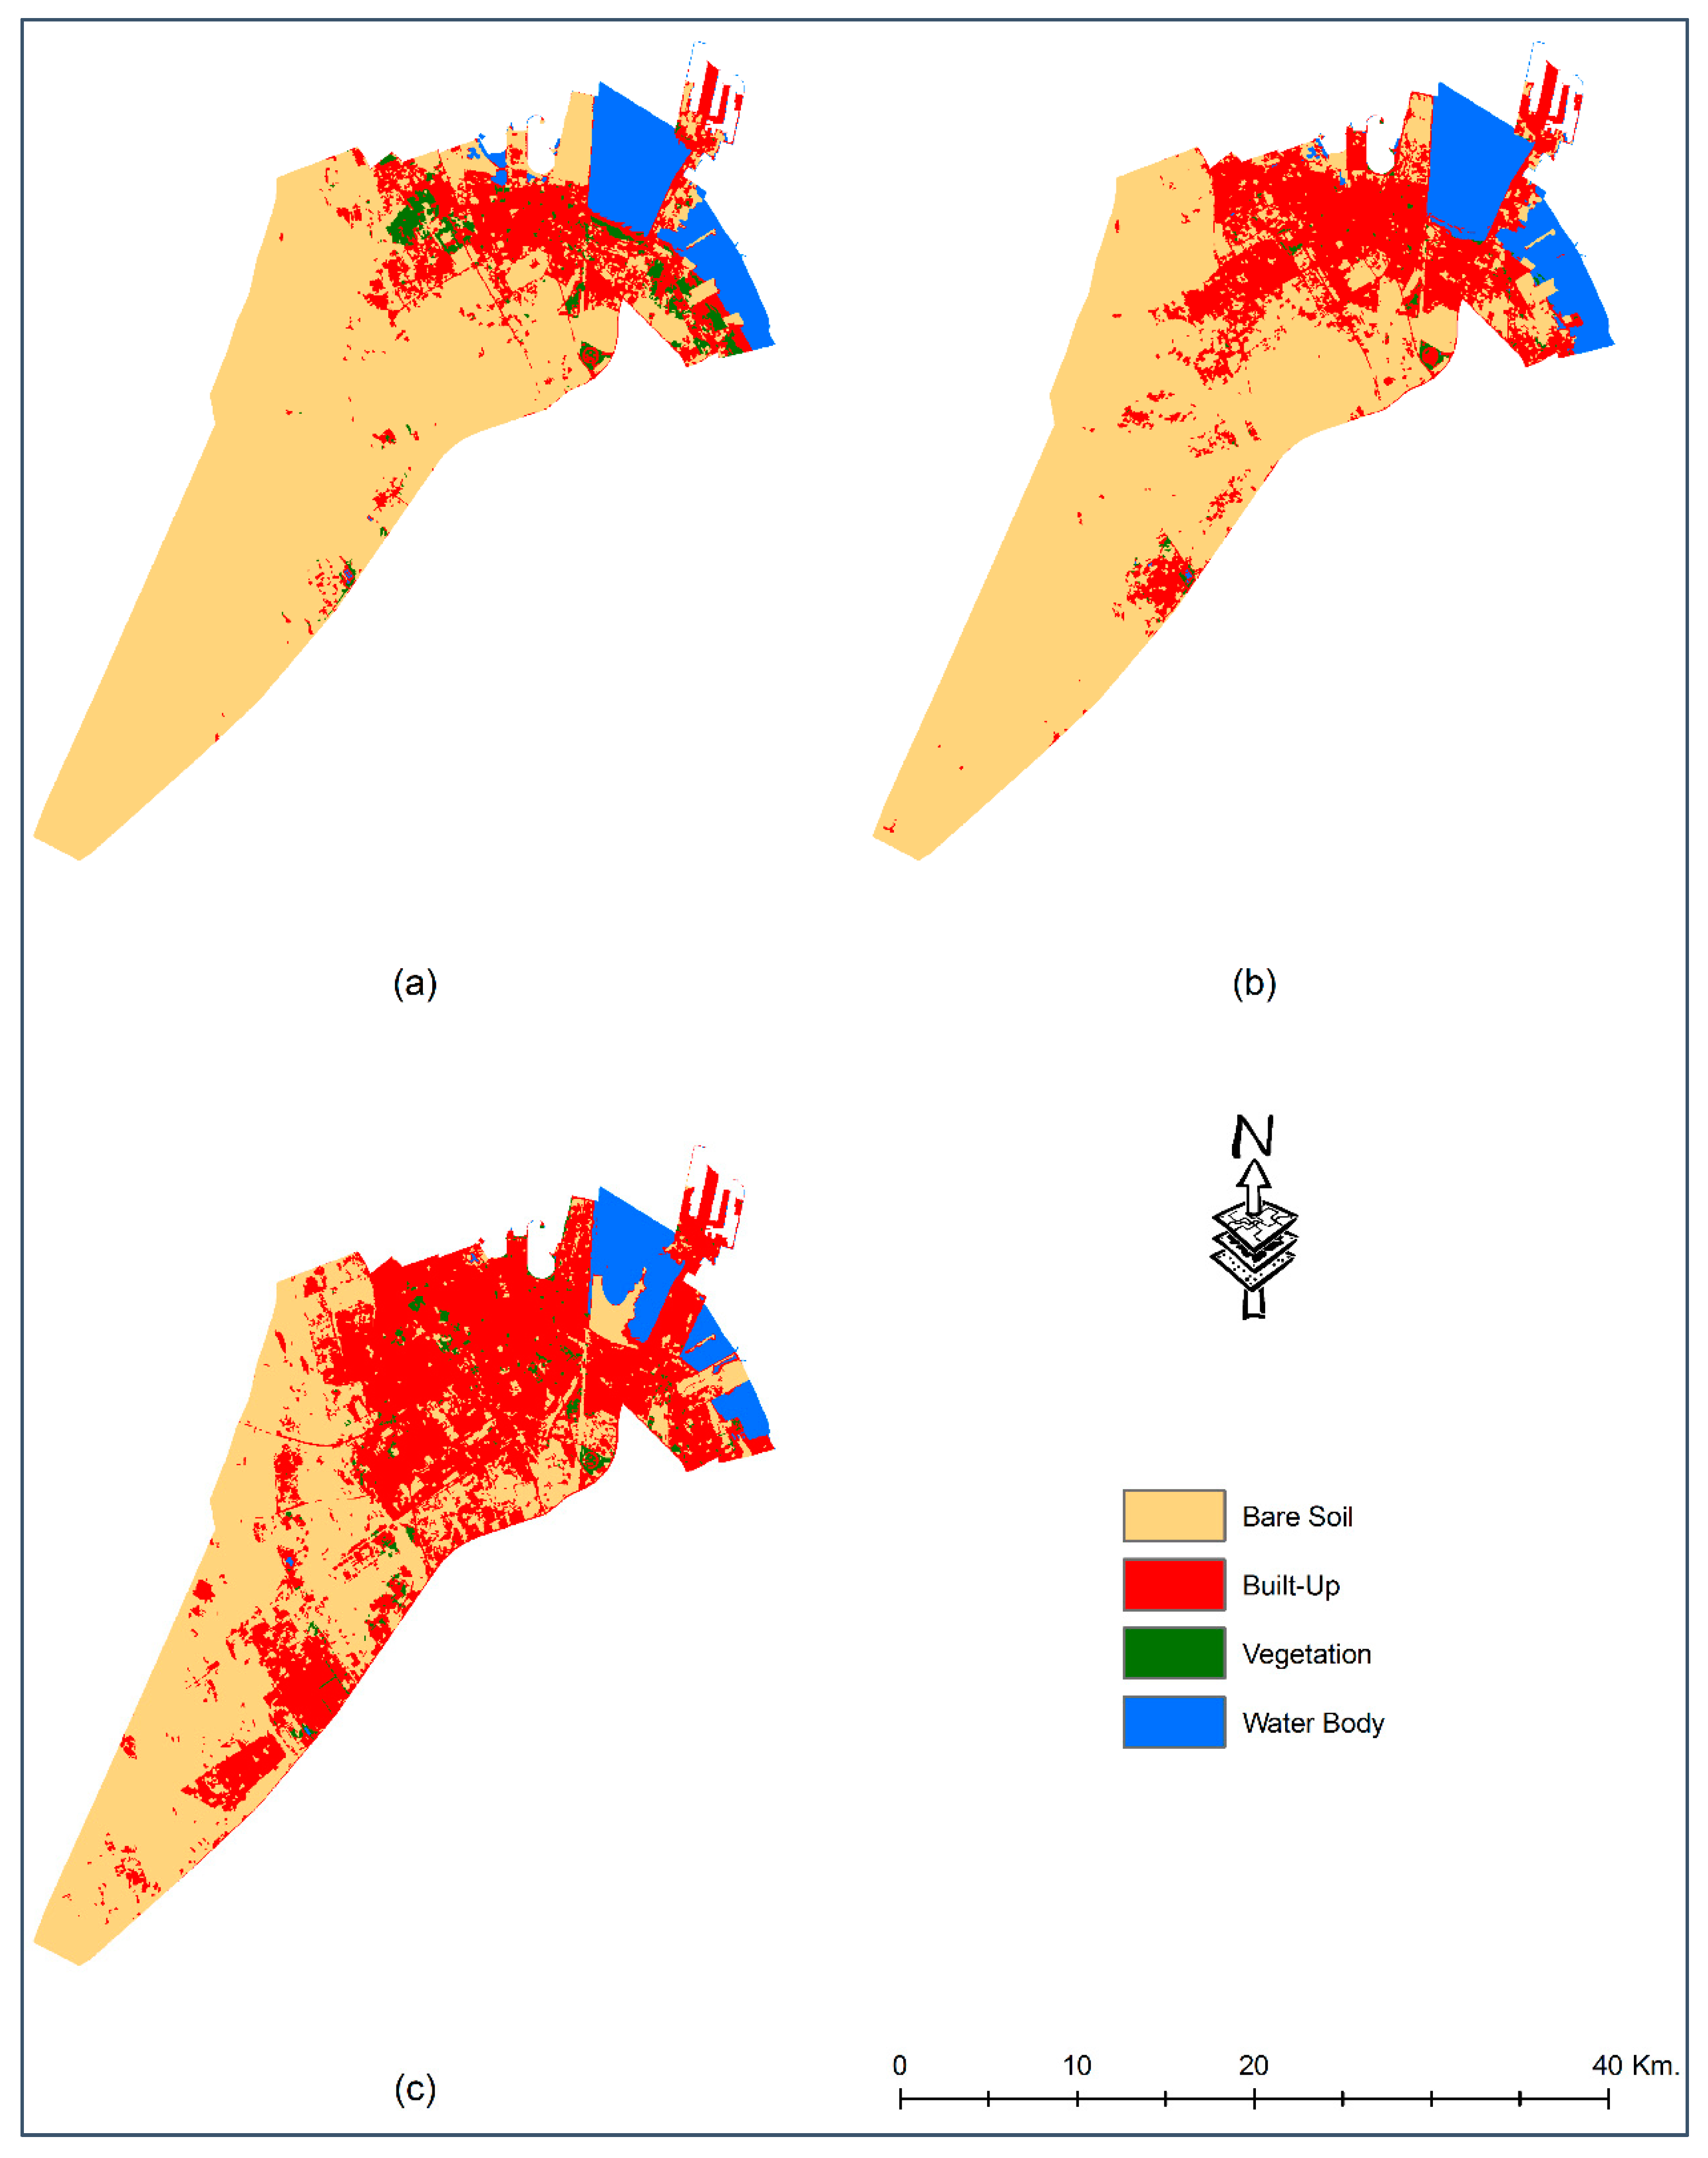
4.1. Changes in LULC in Dammam
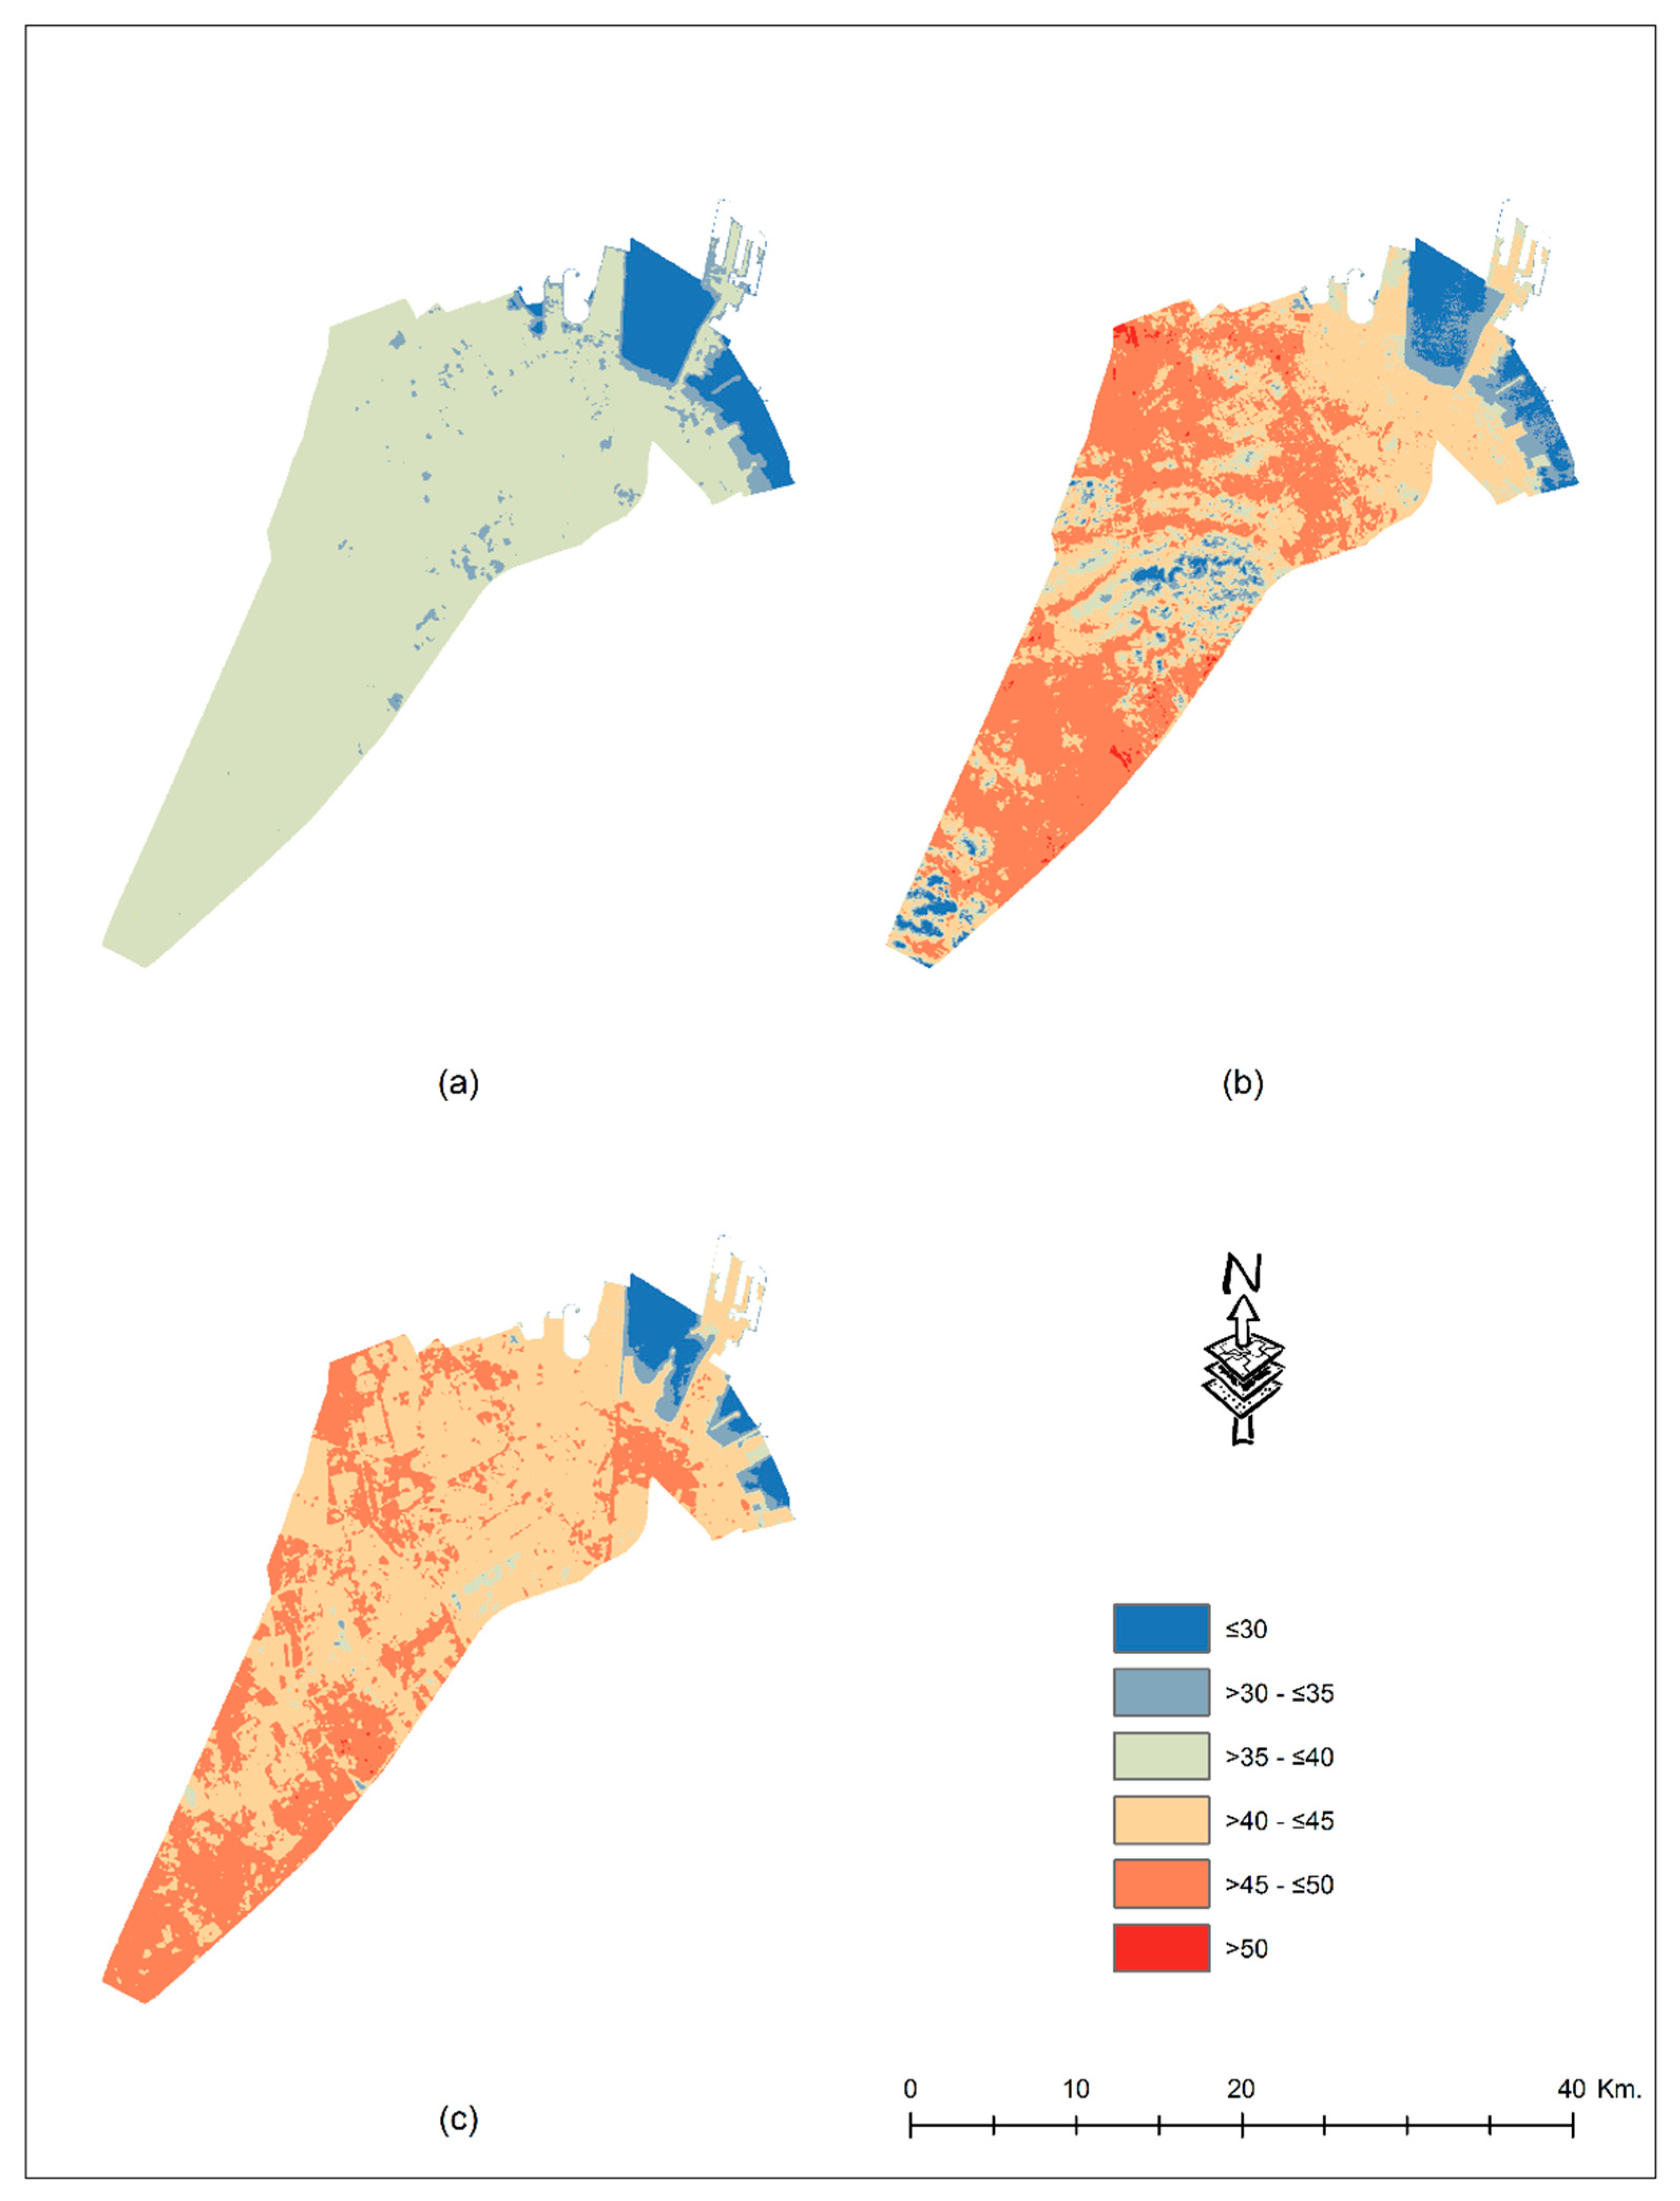
4.2. Distribution and Changes of LST in LULC in Dammam
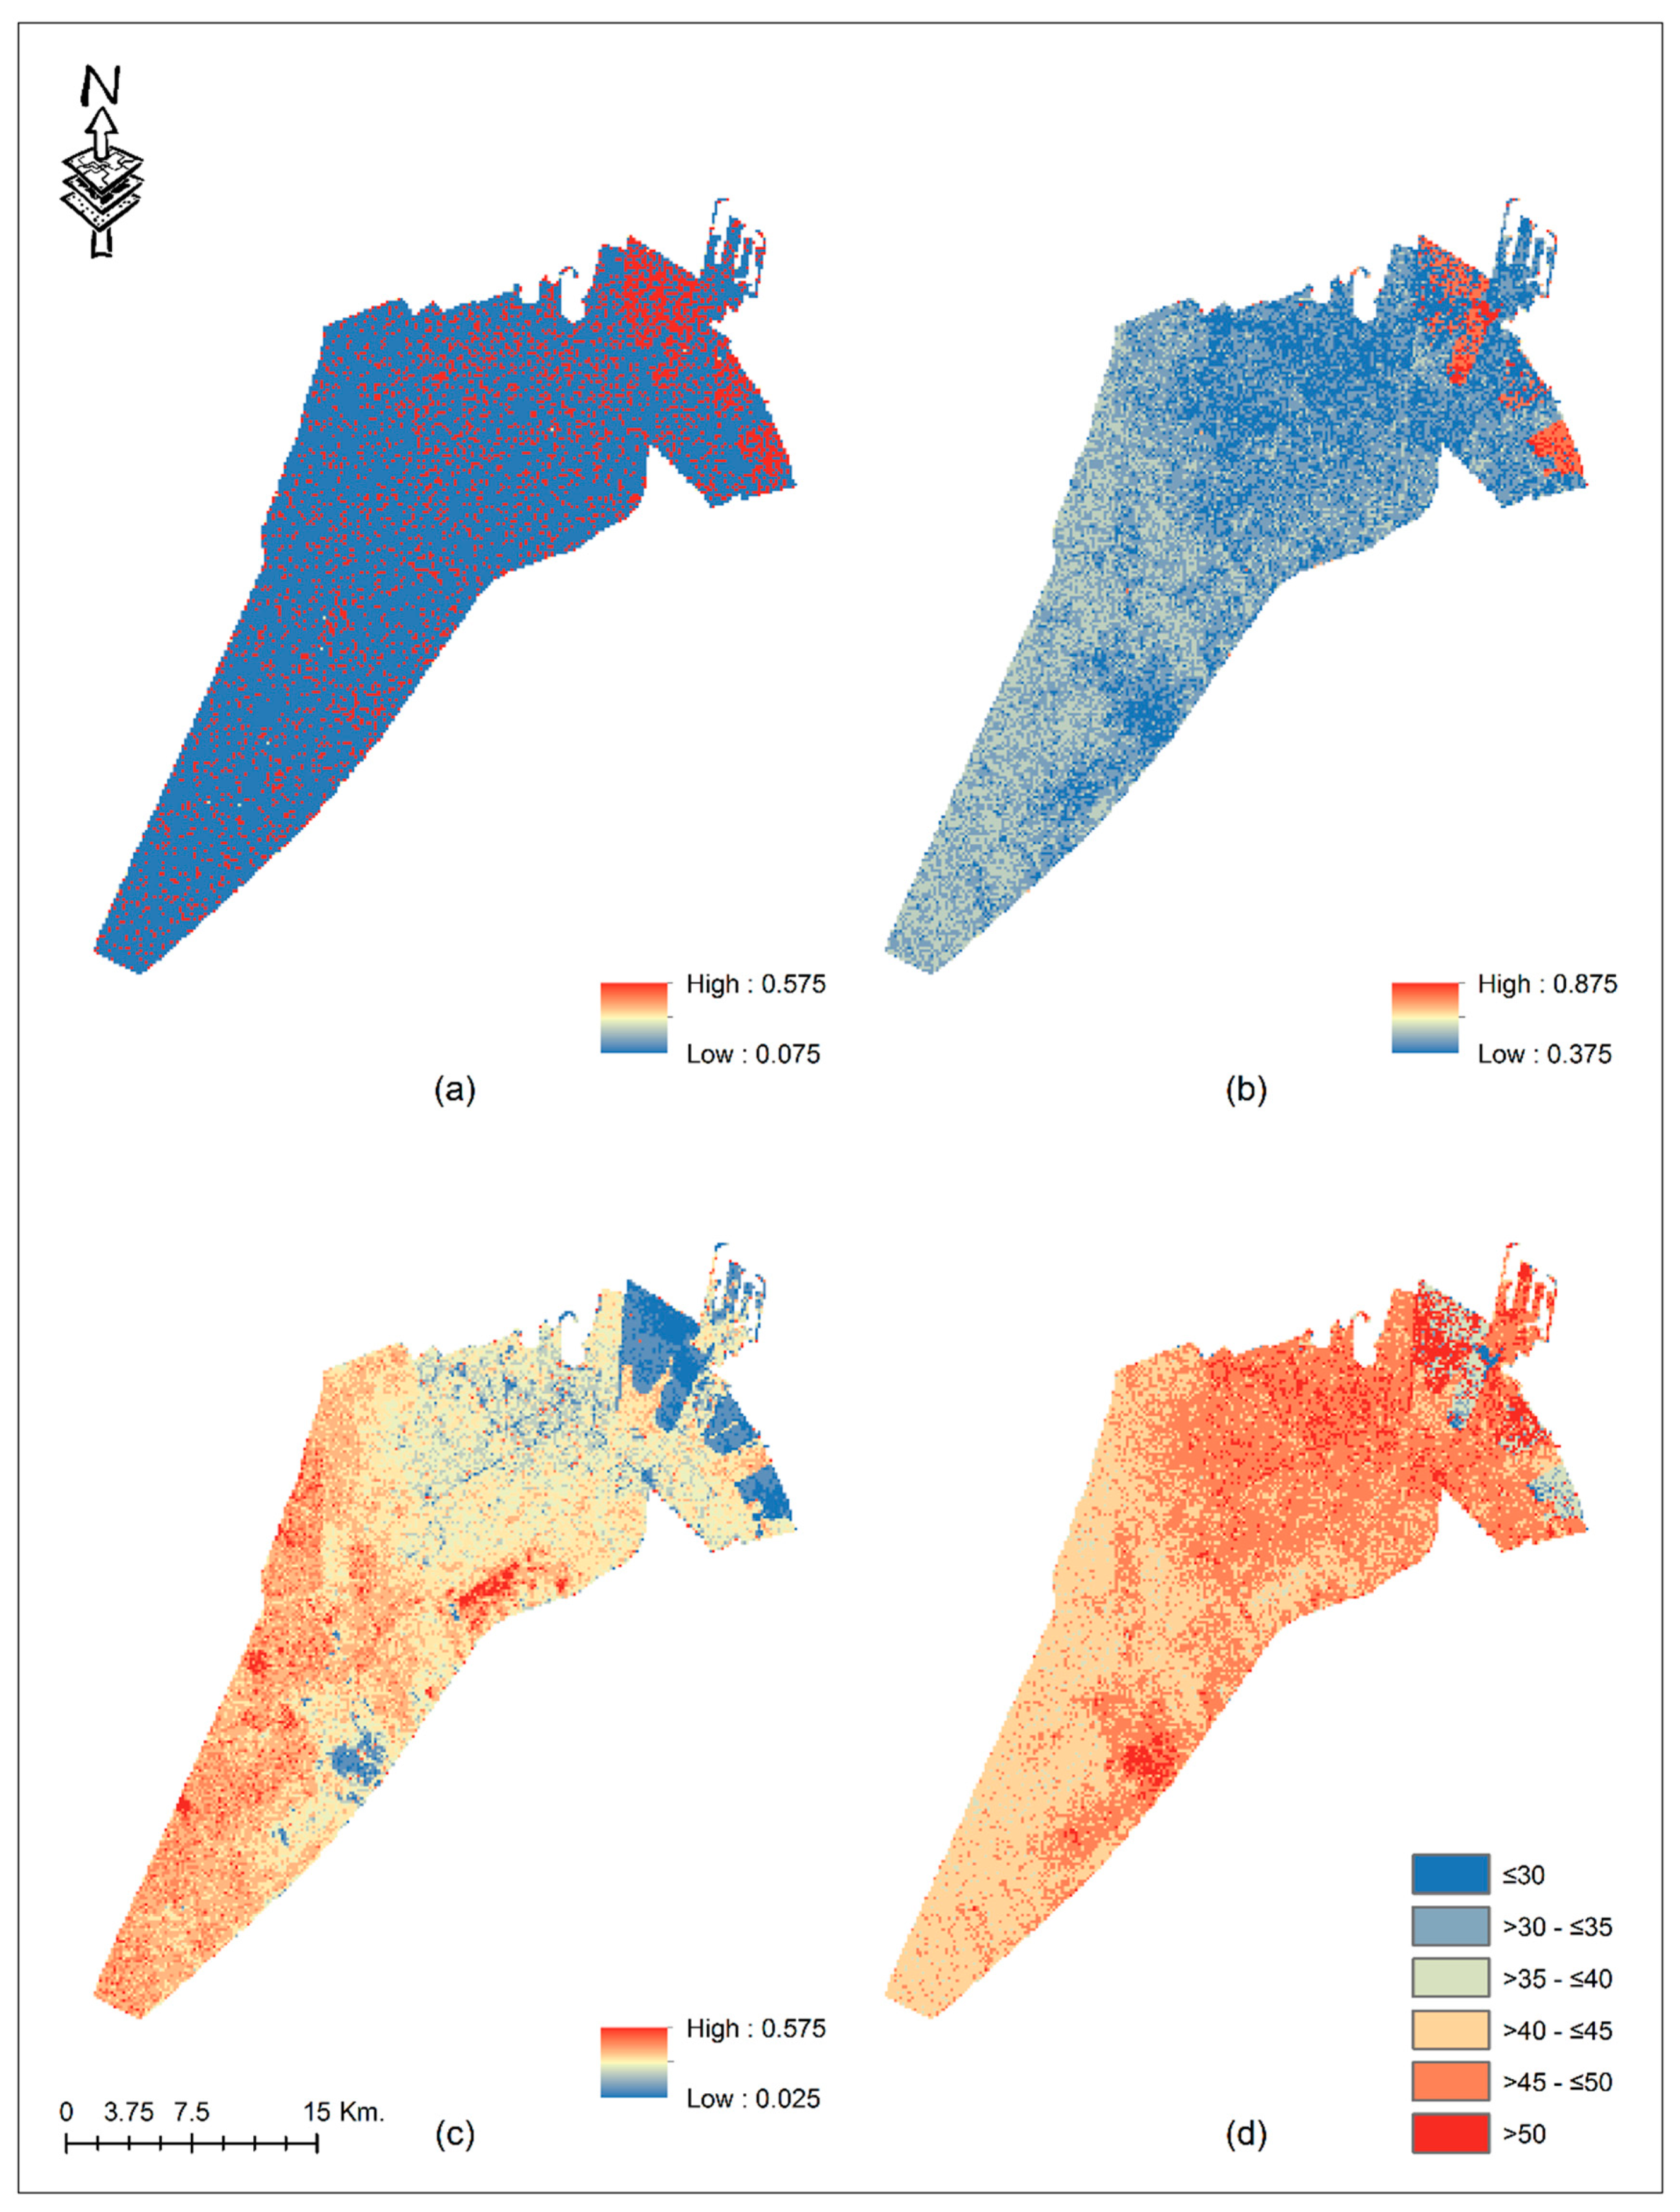
4.3. Modeling of LULC and LST for 2026
5. Discussions
5.1. Changes in LULC and LSTs
5.2. LULC and LST Modeling for 2026
6. Conclusions
Acknowledgments
Author Contributions
Conflicts of Interest
References
- McKinney, M.L. Urbanization, Biodiversity, and Conservation. Bioscience 2002, 52, 883. [Google Scholar] [CrossRef]
- Uttara, S.; Elliot, S. Impacts of Urbanization on Environment. Int. J. Res. Eng. Appl. Sci. 2012, 2, 1637–1645. [Google Scholar]
- Maimaitiyiming, M.; Ghulam, A.; Tiyip, T.; Pla, F.; Latorre-Carmona, P.; Halik, Ü.; Sawut, M.; Caetano, M. Effects of green space spatial pattern on land surface temperature: Implications for sustainable urban planning and climate change adaptation. ISPRS J. Photogramm. Remote Sens. 2014, 89, 59–66. [Google Scholar] [CrossRef]
- Gaffin, S.R.; Rosenzweig, C.; Khanbilvardi, R.; Parshall, L.; Mahani, S.; Glickman, H.; Goldberg, R.; Blake, R.; Slosberg, R.B.; Hillel, D. Variations in New York city’s urban heat island strength over time and space. Theor. Appl. Climatol. 2008, 94, 1–11. [Google Scholar] [CrossRef]
- Wong, N.H.; Jusuf, S.K. GIS-based greenery evaluation on campus master plan. Landsc. Urban Plan. 2008, 84, 166–182. [Google Scholar] [CrossRef]
- Lai, L.W.; Cheng, W.L. Urban heat island and air pollution--an emerging role for hospital respiratory admissions in an urban area. J. Environ. Health 2010, 72, 32–35. [Google Scholar] [PubMed]
- Priyadarsini, R. Urban Heat Island and its Impact on Building Energy Consumption. Adv. Build. Energy Res. 2009, 3, 261–270. [Google Scholar] [CrossRef]
- Rahman, M.T. Detection of Land Use/Land Cover Changes and Urban Sprawl in Al-Khobar, Saudi Arabia: An Analysis of Multi-Temporal Remote Sensing Data. ISPRS Int. J. Geo-Inf. 2016, 5, 15. [Google Scholar] [CrossRef]
- Al-Ahmadi, F.; Hames, A. Comparison of Four Classification Methods to Extract Land Use and Land Cover from Raw Satellite Images for Some Remote Arid Areas, Kingdom of Saudi Arabia. J. King Abdulaziz Univ. Sci. 2009, 20, 167–191. [Google Scholar] [CrossRef]
- Madugundu, R.; Al-Gaadi, K.A.; Patil, V.C.; Tola, E. Detection of Land Use and Land Cover Changes in Dirab Region of Saudi Arabia Using Remotely Sensed Imageries. Am. J. Environ. Sci. 2014, 10, 8–18. [Google Scholar] [CrossRef]
- Al-Hathloul, S.; Rahman, M.A. Dynamism of metropolitan areas: The case of metropolitan Dammam, Saudi Arabia. J. Gulf Arab. Penins. Stud. 2003, 29, 11–43. [Google Scholar]
- Aguilar, A.G.; Ward, P. Globalization, regional development, and mega-city expansion in Latin America: Analyzing Mexico City’s peri-urban hinterland. Cities 2003, 20, 3–21. [Google Scholar] [CrossRef]
- Thapa, R.B.; Murayama, Y. Examining Spatiotemporal Urbanization Patterns in Kathmandu Valley, Nepal: Remote Sensing and Spatial Metrics Approaches. Remote Sens. 2009, 1, 534–556. [Google Scholar] [CrossRef]
- Dewan, A.M.; Yamaguchi, Y. Land use and land cover change in Greater Dhaka, Bangladesh: Using remote sensing to promote sustainable urbanization. Appl. Geogr. 2009, 29, 390–401. [Google Scholar] [CrossRef]
- Jamali, N.A.; Rahman, M.T. Utilization of Remote Sensing and GIS to Examine Urban Growth in the City of Riyadh, Saudi Arabia. J. Adv. Inf. Technol. 2016, 7, 297–301. [Google Scholar]
- Rahman, M.T.; Rashed, T. Urban tree damage estimation using airborne laser scanner data and geographic information systems: An example from 2007 Oklahoma ice storm. Urban For. Urban Green. 2015, 14, 562–572. [Google Scholar] [CrossRef]
- Alwashe, M.A.; Bokhari, A.Y. Monitoring vegetation changes in Al Madinah, Saudi Arabia, using Thematic Mapper data. Int. J. Remote Sens. 1993, 14, 191–197. [Google Scholar] [CrossRef]
- Al-Rowili, M.S.; Fadda, E.H.; Vaughan, R.A. A Comparison of Data Fusion and Unsupervised Classification for Change Detection in Jeddah, Saudi Arabia. In Proceedings of the 22nd Symposium of the European Association of Remote Sensing Laboratories, Prague, Czech Republic, 4–6 June 2002. [Google Scholar]
- Aljoufie, M.; Zuidgeest, M.; Brussel, M.; Maarseveen, M.V. Spatial–temporal analysis of urban growth and transportation in Jeddah City, Saudi Arabia. Cities 2013, 31, 57–68. [Google Scholar] [CrossRef]
- Al-Harbi, K.M. Monitoring of agricultural area trend in Tabuk region—Saudi Arabia using Landsat TM and SPOT data. Egypt. J. Remote Sens. Sp. Sci. 2010, 13, 37–42. [Google Scholar] [CrossRef]
- Al-Gaadi, K.A.; Samdani, M.S.; Patil, V.C. Assessment of Temporal Land Cover Changes in Saudi Arabia Using Remotely Sensed Data Precision Agriculture Research Chair, College of Food and Agriculture Sciences. Middle-East J. Sci. Res. 2011, 9, 711–717. [Google Scholar]
- Rao, P.K. Remote sensing of urban “heat islands” from an environmental satellite. Bull. Am. Meteorol. Soc. 1972, 53, 647–648. [Google Scholar]
- Yuan, F.; Bauer, M.E. Comparison of impervious surface area and normalized difference vegetation index as indicators of surface urban heat island effects in Landsat imagery. Remote Sens. Environ. 2007, 106, 375–386. [Google Scholar] [CrossRef]
- Xiao, R.B.; Weng, Q.H.; Ouyang, Z.Y.; Li, W.F.; Schienke, E.W.; Zhang, Z.M. Land surface temperature variation and major factors in Beijing, China. Photogramm. Eng. Remote Sens. 2008, 74, 451–461. [Google Scholar] [CrossRef]
- Li, X.; Zhou, W.; Ouyang, Z.; Xu, W.; Zheng, H. Spatial pattern of greenspace affects land surface temperature: Evidence from the heavily urbanized Beijing metropolitan area, China. Landsc. Ecol. 2012, 27, 887–898. [Google Scholar] [CrossRef]
- Dousset, B.; Gourmelon, F. Satellite multi-sensor data analysis of urban surface temperatures and landcover. J. Photogramm. Remote Sens. 2003, 58, 43–54. [Google Scholar] [CrossRef]
- Chaudhuri, G.; Mishra, N.B. Spatio-temporal dynamics of land cover and land surface temperature in Ganges-Brahmaputra delta: A comparative analysis between India and Bangladesh. Appl. Geogr. 2016, 68, 68–83. [Google Scholar] [CrossRef]
- Ahmed, B.; Kamruzzaman, M.; Zhu, X.; Rahman, M.S.; Choi, K. Simulating Land Cover Changes and Their Impacts on Land Surface Temperature in Dhaka, Bangladesh. Remote Sens. 2013, 5, 5969–5998. [Google Scholar] [CrossRef]
- El Abidine, E.M.Z.; Mohieldeen, Y.E.; Mohamed, A.A.; Modawi, O.; AL-Sulaiti, M.H. Heat wave hazard modelling: Qatar case study. QScience Connect 2014. [Google Scholar] [CrossRef]
- Rasul, A.; Balzter, H.; Smith, C. Spatial variation of the daytime Surface Urban Cool Island during the dry season in Erbil, Iraqi Kurdistan, from Landsat 8. Urban Clim. 2015, 14, 176–186. [Google Scholar] [CrossRef]
- Lazzarini, M.; Marpu, P.R.; Ghedira, H. Temperature-land cover interactions: The inversion of urban heat island phenomenon in desert city areas. Remote Sens. Environ. 2013, 130, 136–152. [Google Scholar] [CrossRef]
- Radhi, H.; Sharples, S. Quantifying the domestic electricity consumption for air-conditioning due to urban heat islands in hot arid regions. Appl. Energy 2013, 112, 371–380. [Google Scholar] [CrossRef]
- General Authority for Statistics Population Statistics. Available online: http://www.stats.gov.sa/en/ (accessed on 15 October 2014).
- WeatherSpark Historical Weather for 2014 in Dammam, Saudi Arabia. Available online: https://weatherspark.com/history/32759/2014/Dammam-Eastern-Province-Saudi-Arabia (accessed on 1 January 2015).
- NASA Landsat 4–7 Thermal Data to be Resampled to 30 Meters. Available online: https://landsat.gsfc.nasa.gov/landsat-4–7-thermal-data-to-be-resampled-to-30-meters/ (accessed on 30 April 2017).
- Rozenstein, O.; Karnieli, A. Comparison of methods for land-use classification incorporating remote sensing and GIS inputs. Appl. Geogr. 2011, 31, 533–544. [Google Scholar] [CrossRef]
- Rozenstein, O.; Qin, Z.; Derimian, Y.; Karnieli, A. Derivation of land surface temperature for landsat-8 TIRS using a split window algorithm. Sensors (Switzerland) 2014, 14, 5768–5780. [Google Scholar] [CrossRef] [PubMed]
- Coll, C.; Galve, J.M.; Sánchez, J.M.; Caselles, V. Validation of Landsat-7/ETM+ Thermal-Band Calibration and Atmospheric Correction With Ground-Based Measurements. IEEE Trans. Geosci. Remote Sens. 2010, 48, 547–555. [Google Scholar] [CrossRef]
- Ma, Y.; Kuang, Y.; Huang, N. Coupling urbanization analyses for studying urban thermal environment and its interplay with biophysical parameters based on TM/ETM+ imagery. Int. J. Appl. Earth Obs. Geoinf. 2010, 12, 110–118. [Google Scholar] [CrossRef]
- Wukelic, G.E.; Gibbons, D.E.; Martucci, H.P.; Foote, H.P. Radiometric calibration of Landsat Thematic Mapper thermal band. Remote Sens. Environ. 1989, 28, 339–347. [Google Scholar] [CrossRef]
- Butler, K. Deriving Temperature from Landsat 8 Thermal Bands (TIRS). Available online: http://blogs.esri.com/esri/arcgis/2014/01/06/deriving-temperature-from-landsat-8-thermal-bands-tirs/ (accessed on 3 January 2015).
- Almutairi, M.K. Derivation of Urban Heat Island for Landsat-8 TIRS Riyadh City (KSA). J. Geosci. Environ. Prot. 2015, 3, 18–23. [Google Scholar] [CrossRef]
- Triantakonstantis, D.; Mountrakis, G. Urban Growth Prediction: A Review of Computational Models and Human Perceptions. J. Geogr. Inf. Syst. 2012, 4, 555–587. [Google Scholar] [CrossRef]
- Guan, D.G.; Li, H.F.; Inohae, T.; Su, W.; Nagaie, T.; Hokao, K. Modeling urban land use change by the integration of cellular automaton and Markov model. Ecol. Modell. 2011, 222, 3761–3772. [Google Scholar] [CrossRef]
- Moghadam, H.S.; Helbich, M. Spatiotemporal urbanization processes in the megacity of Mumbai, India: A Markov chains-cellular automata urban growth model. Appl. Geogr. 2013, 40, 140–149. [Google Scholar] [CrossRef]
- Gong, W.; Li, Y.; Fan, W.; Stott, P. Analysis and simulation of land use spatial pattern in Harbin prefecture based on trajectories and cellular automata-Markov modelling. Int. J. Appl. Earth Obs. Geoinf. 2015, 34, 207–216. [Google Scholar] [CrossRef]
- Halmy, M.W.A.; Gessler, P.E.; Hicke, J.A.; Salem, B.B. Land use/land cover change detection and prediction in the north-western coastal desert of Egypt using Markov-CA. Appl. Geogr. 2015, 63, 101–112. [Google Scholar] [CrossRef]
- Roy, H.G.; Fox, D.M.; Emsellem, K. Predicting Land Cover Change in a Mediterranean Catchment at Different Time Scales. In Proceedings of the 14th International Conference on Computational Science and Its Applications (ICCSA 2014), Guimarães, Portugal, 30 June–3 July 2014; Murgante, B., Misra, S., Rocha, A.M.A.C., Torre, C., Rocha, J.G., Falcao, M.I., Taniar, D., Apduhan, B.O., Gervasi, O., Eds.; Springer International: Cham, Switzerland, 2014; Volume 8582, pp. 315–330. [Google Scholar]
- Visser, H.; Najs, T.D. The Map Comparison Kit. Environ. Model. Softw. 2006, 21, 346–358. [Google Scholar] [CrossRef]
- Chen, X.-L.; Zhao, H.-M.; Li, P.-X.; Yin, Z.-Y. Remote sensing image-based analysis of the relationship between urban heat island and land use/cover changes. Remote Sens. Environ. 2006, 104, 133–146. [Google Scholar] [CrossRef]
- Huete, A.R. A soil-adjusted vegetation index (SAVI). Remote Sens. Environ. 1988, 25, 295–309. [Google Scholar] [CrossRef]
- McFeeters, S.K. The use of the Normalized Difference Water Index (NDWI) in the delineation of open water features. Int. J. Remote Sens. 1996, 17, 1425–1432. [Google Scholar] [CrossRef]
- Xu, H. A Study on Information Extraction of Water Body with the Modified Normalized Difference Water Index (MNDWI). J. Remote Sens. 2005, 9, 511–517. [Google Scholar]
- Zha, Y.; Gao, J.; Ni, S. Use of normalized difference built-up index in automatically mapping urban areas from TM imagery. Int. J. Remote Sens. 2003, 24, 583–594. [Google Scholar] [CrossRef]
- Alqurashi, A.F.; Kumar, L. Land Use and Land Cover Change Detection in the Saudi Arabian Desert Cities of Makkah and Al-Taif Using Satellite Data. Adv. Remote Sens. 2014, 3, 106–119. [Google Scholar] [CrossRef]
- Al-sharif, A.A.A.; Pradhan, B.; Shafri, H.Z.M.; Mansor, S. Spatio-temporal analysis of urban and population growths in tripoli using remotely sensed data and GIS. Indian J. Sci. Technol. 2013, 6, 5134–5142. [Google Scholar]
- Corner, R.J.; Dewan, A.M.; Chakma, S. Monitoring and Prediction of Land-Use and Land-Cover (LULC) Change. In Dhaka Megacity: Geospatial Perspectives on Urbanisation, Environment and Health; Dewan, A.M., Corner, R.J., Eds.; Springer: Dordrecht, The Netherlands, 2014; pp. 75–97. [Google Scholar]
- Abou-Korin, A.A. Impacts of Rapid Urbanisation in the Arab World: the Case of Dammam Metropolitan Area, Saudi Arabia. In 5th Int’l Conference and Workshop on Built Environment in Developing Countries (ICBEDC 2011); University Sains Malaysia: Pulao Pinang, Malaysia, 2011; pp. 1–25. [Google Scholar]
- Al-Hathloul, S.; Mughal, M.A. Urban growth management-the Saudi experience. Habitat Int. 2004, 28, 609–623. [Google Scholar] [CrossRef]
- Aina, Y.A.; Merwe, J.H.V.; Alshuwaikhat, H.M. Urban Spatial Growth and Land Use Change in Riyadh: Comparing Spectral Angle Mapping and Band Ratioing Techniques. In Proceedings of the Academic Track of the 2008 Free and Open Source Software for Geospatial (FOSS4G) Conference, Incorporating the GISSA 2008 Conference, Cape Town, South Africa, 29 September–4 October 2008; pp. 51–57. [Google Scholar]
- Abdi, A. Using Landsat ETM+ to Assess Land Cover and Land Surface Temperature Change in Dubai between 1999 and 2009. Available online: http://www.hakimabdi.com/20120729/using-landsat-etm-to-assess-land-cover-and-land-surface-temperature-change-in-dubai-between-1999-and-2009/ (accessed on 3 March 2016).
- Peña, M.A. Examination of the Land Surface Temperature Response for Santiago, Chile. Photogramm. Eng. Remote Sens. 2009, 75, 1191–1200. [Google Scholar] [CrossRef]
- Brazel, A.; Selover, N.; Vose, R.; Heisler, G. The tale of two climates—Baltimore and Phoenix urban LTER sites. Clim. Res. 2000, 15, 123–135. [Google Scholar] [CrossRef]
- Tewolde, M.G.; Cabral, P. Urban Sprawl Analysis and Modeling in Asmara, Eritrea. Remote Sens. 2011, 3, 2148–2165. [Google Scholar] [CrossRef]
- Araya, Y.H.; Cabral, P. Analysis and Modeling of Urban Land Cover Change in Setúbal and Sesimbra, Portugal. Remote Sens. 2010, 2, 1549–1563. [Google Scholar] [CrossRef]
- Han, H.; Yang, C.; Song, J. Scenario Simulation and the Prediction of Land Use and Land Cover Change in Beijing, China. Sustainability 2015, 7, 4260–4279. [Google Scholar] [CrossRef]
- Bhatta, B. Causes and Consequences of Urban Growth and Sprawl. In Analysis of Urban Growth and Sprawl from Remote Sensing Data; Advances in Geographic Information Science; Springer: Berlin/Heidelberg, Germany, 2010; pp. 17–36. [Google Scholar]
- Pal, J.S.; Eltahir, E.A.B. Future temperature in southwest Asia projected to exceed a threshold for human adaptability. Nat. Clim. Chang. 2016, 6, 197–200. [Google Scholar] [CrossRef]
- Li, Z.; Guo, X.; Dixon, P.; He, Y. Applicability of Land Surface Temperature (LST) estimates from AVHRR satellite image composites in northern Canada. Prairie Perspect. 2008, 11, 119–130. [Google Scholar]


| Date of Acquisition | Path and Row | Landsat Sensor | Spatial Resolution of Multi-Spectral Bands | Spatial Resolution of Thermal Bands |
|---|---|---|---|---|
| 16 August 1990 | 164/42 | TM | 30 m | 120 m (resampled to 30 m) |
| 24 July 2002 | 164/42 | ETM+ | 30 m | 60 m (resampled to 30 m) |
| 2 August 2014 | 164/42 | OLI | 30 m | 100 m (resampled to 30 m) |
| Land Cover Class | Description |
|---|---|
| Built-up | Residential, industrial, transportation networks, and commercial infrastructures. |
| Bare soil | Sand, vacant lands, bare soils. |
| Vegetation | Trees, parks, playgrounds, grasslands. |
| Water body | Lakes and coastal water. |
| Kappa Components | CAM | SM | MLPM |
|---|---|---|---|
| Overall Kappa | 0.56 | 0.30 | 0.45 |
| Overall Klocation | 0.67 | 0.36 | 0.62 |
| Overall Khisto | 0.83 | 0.83 | 0.73 |
| Fraction Correct | 0.75 | 0.60 | 0.69 |
| Index | Equation | Reference | |
|---|---|---|---|
| Landsat TM and ETM+ | Landsat OLI | ||
| NDBsI | [50] | ||
| NDVI | [50] | ||
| SAVI | [51] | ||
| NDWI | [52] | ||
| MNDWI | [53] | ||
| NDBI | [54] | ||
| Land Cover Class | 1990 | 2002 | 2014 | |||
|---|---|---|---|---|---|---|
| Area | % | Area | % | Area | % | |
| Bare soil/sand | 48,863 | 74.79 | 44,227 | 67.69 | 32,231 | 49.33 |
| Built-up area | 9368 | 14.34 | 15,039 | 23.02 | 28,267 | 43.27 |
| Vegetation | 1785 | 2.73 | 370 | 0.57 | 1041 | 1.59 |
| Water body | 5317 | 8.14 | 5697 | 8.72 | 3794 | 5.81 |
| Total | 65,333 | 100 | 65,333 | 100 | 65,333 | 100 |
| 2002 | ||||||
|---|---|---|---|---|---|---|
| Bare Soil/Sand | Built-Up Area | Vegetation | Water Body | Total | ||
| 1990 | Bare soil/sand | 42,803 | 5969 | 74 | 17 | 48,863 |
| Built-up area | 883 | 8061 | 37 | 387 | 9368 | |
| Vegetation | 438 | 949 | 252 | 146 | 1785 | |
| Water body | 103 | 60 | 7 | 5147 | 5317 | |
| Total | 44,227 | 15,039 | 370 | 5697 | 65,333 | |
| 2014 | ||||||
|---|---|---|---|---|---|---|
| Bare Soil/Sand | Built-Up Area | Vegetation | Water Body | Total | ||
| 2002 | Bare soil/sand | 30,131 | 13,824 | 250 | 22 | 44,227 |
| Built-up area | 995 | 13,427 | 608 | 9 | 15,039 | |
| Vegetation | 49 | 147 | 174 | 0 | 370 | |
| Water body | 1056 | 869 | 9 | 3763 | 5697 | |
| Total | 32,231 | 28,267 | 1041 | 3794 | 65,333 | |
| Land Cover Class | 1990 | 2002 | 2014 |
|---|---|---|---|
| Bare Soil | 37.62 | 44.41 | 45.09 |
| Built-Up Area | 36.42 | 43.42 | 44.12 |
| Vegetation | 35.71 | 38.85 | 43.01 |
| Water Body | 29.04 | 30.69 | 30.64 |
| Ranges of LST (°C) | Areal Coverage (%) | |||
|---|---|---|---|---|
| 1990 | 2002 | 2014 | 2026 | |
| ≤30 | 7.86 | 6.14 | 3.81 | 0 |
| 31 to 35 | 5.07 | 6.44 | 2.3 | 0.29 |
| 36 to 40 | 87.07 | 9.9 | 2.58 | 1.38 |
| 41 to 45 | 0 | 36.11 | 58.69 | 2.35 |
| 46 to 50 | 0 | 40.9 | 32.57 | 35.06 |
| >50 | 0 | 0.51 | 0.05 | 60.92 |
| Land Cover Class | Area | % |
|---|---|---|
| Bare soil | 23,925 | 36.62 |
| Built-up area | 35,986 | 55.08 |
| Vegetation | 3240 | 4.96 |
| Water body | 2182 | 3.34 |
| Total | 65,333 | 100 |
© 2017 by the authors. Licensee MDPI, Basel, Switzerland. This article is an open access article distributed under the terms and conditions of the Creative Commons Attribution (CC BY) license (http://creativecommons.org/licenses/by/4.0/).
Share and Cite
Rahman, M.T.; Aldosary, A.S.; Mortoja, M.G. Modeling Future Land Cover Changes and Their Effects on the Land Surface Temperatures in the Saudi Arabian Eastern Coastal City of Dammam. Land 2017, 6, 36. https://doi.org/10.3390/land6020036
Rahman MT, Aldosary AS, Mortoja MG. Modeling Future Land Cover Changes and Their Effects on the Land Surface Temperatures in the Saudi Arabian Eastern Coastal City of Dammam. Land. 2017; 6(2):36. https://doi.org/10.3390/land6020036
Chicago/Turabian StyleRahman, Muhammad Tauhidur, Adel S. Aldosary, and Md. Golam Mortoja. 2017. "Modeling Future Land Cover Changes and Their Effects on the Land Surface Temperatures in the Saudi Arabian Eastern Coastal City of Dammam" Land 6, no. 2: 36. https://doi.org/10.3390/land6020036
APA StyleRahman, M. T., Aldosary, A. S., & Mortoja, M. G. (2017). Modeling Future Land Cover Changes and Their Effects on the Land Surface Temperatures in the Saudi Arabian Eastern Coastal City of Dammam. Land, 6(2), 36. https://doi.org/10.3390/land6020036