Land‐Use and Land‐Cover Change in the Páramo of South‐Central Ecuador, 1979–2014


Abstract
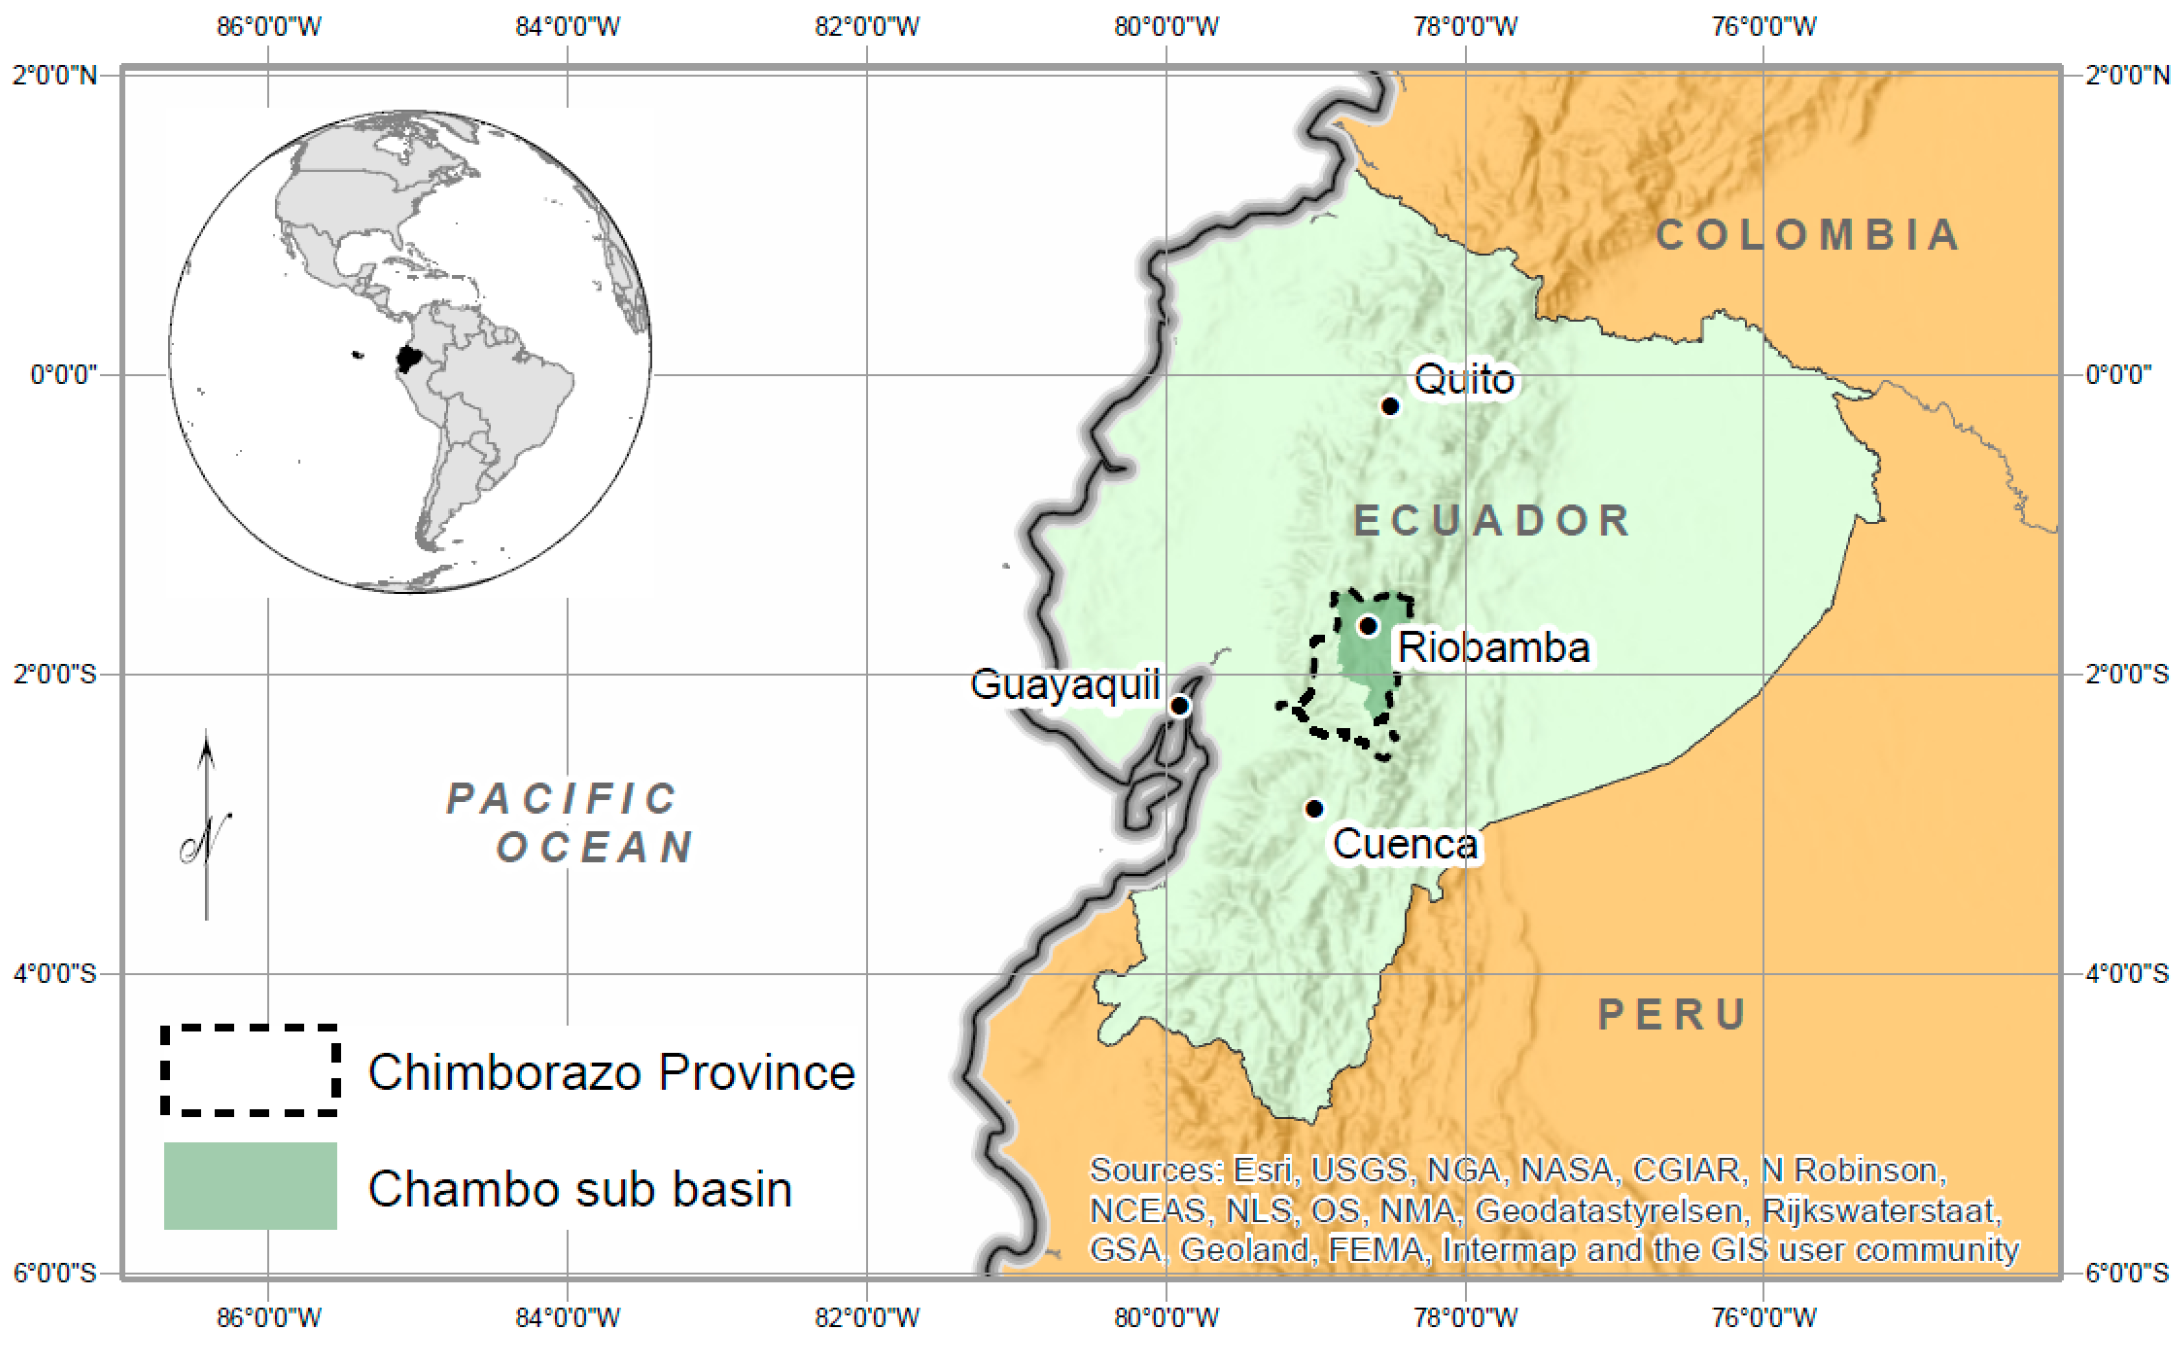
:1. Introduction
2. Data and Methods
- PBandN = Reflectance for Band N (at-surface reflectance);
- Lλ = Spectral radiance at the sensor’s aperture;
- LλSHV = Spectral radiance at the sensor’s aperture for the SHV (path radiance or upwelling diffuse sky irradiance);
- d = Earth-Sun distance in astronomical units;
- ESunλ = Mean solar exoatmospheric irradiance (solar spectral irradiance);
- θS = Solar elevation in degrees;
- τv = Atmospheric transmittance in the sensor direction;
- τz = Atmospheric transmittance in the illumination direction;
- Edown = Downwelling diffuse sky irradiance.
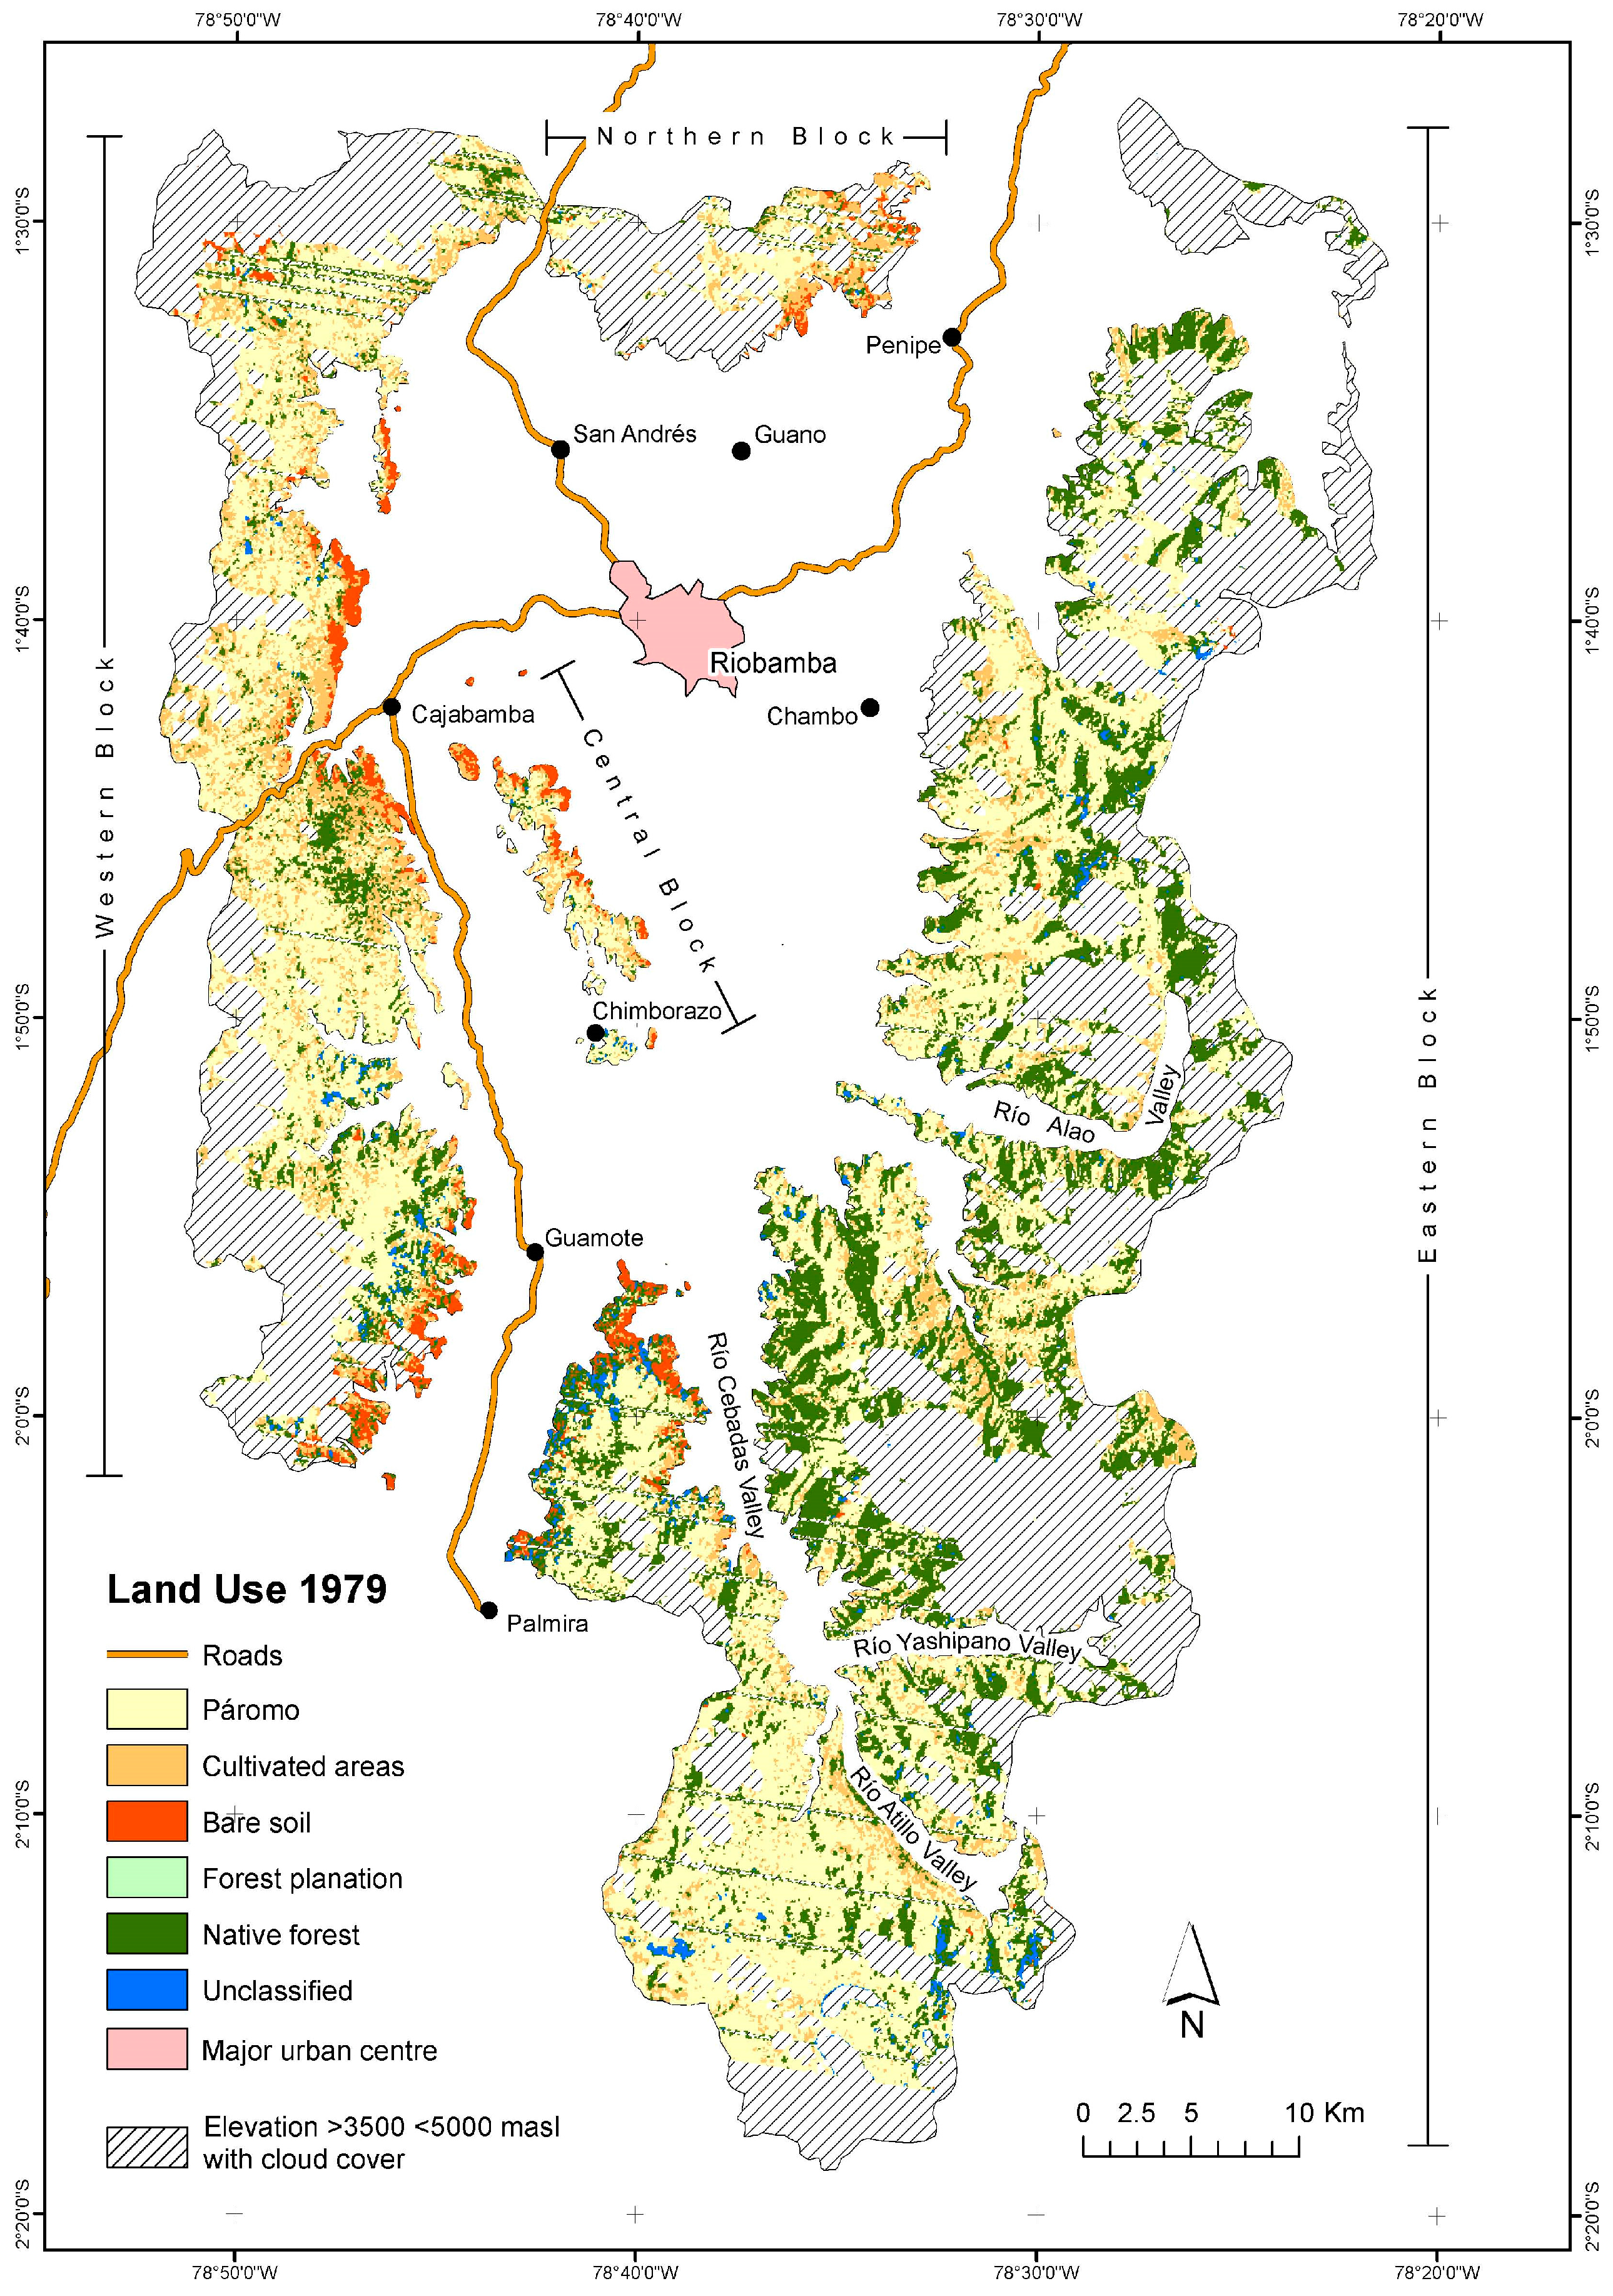
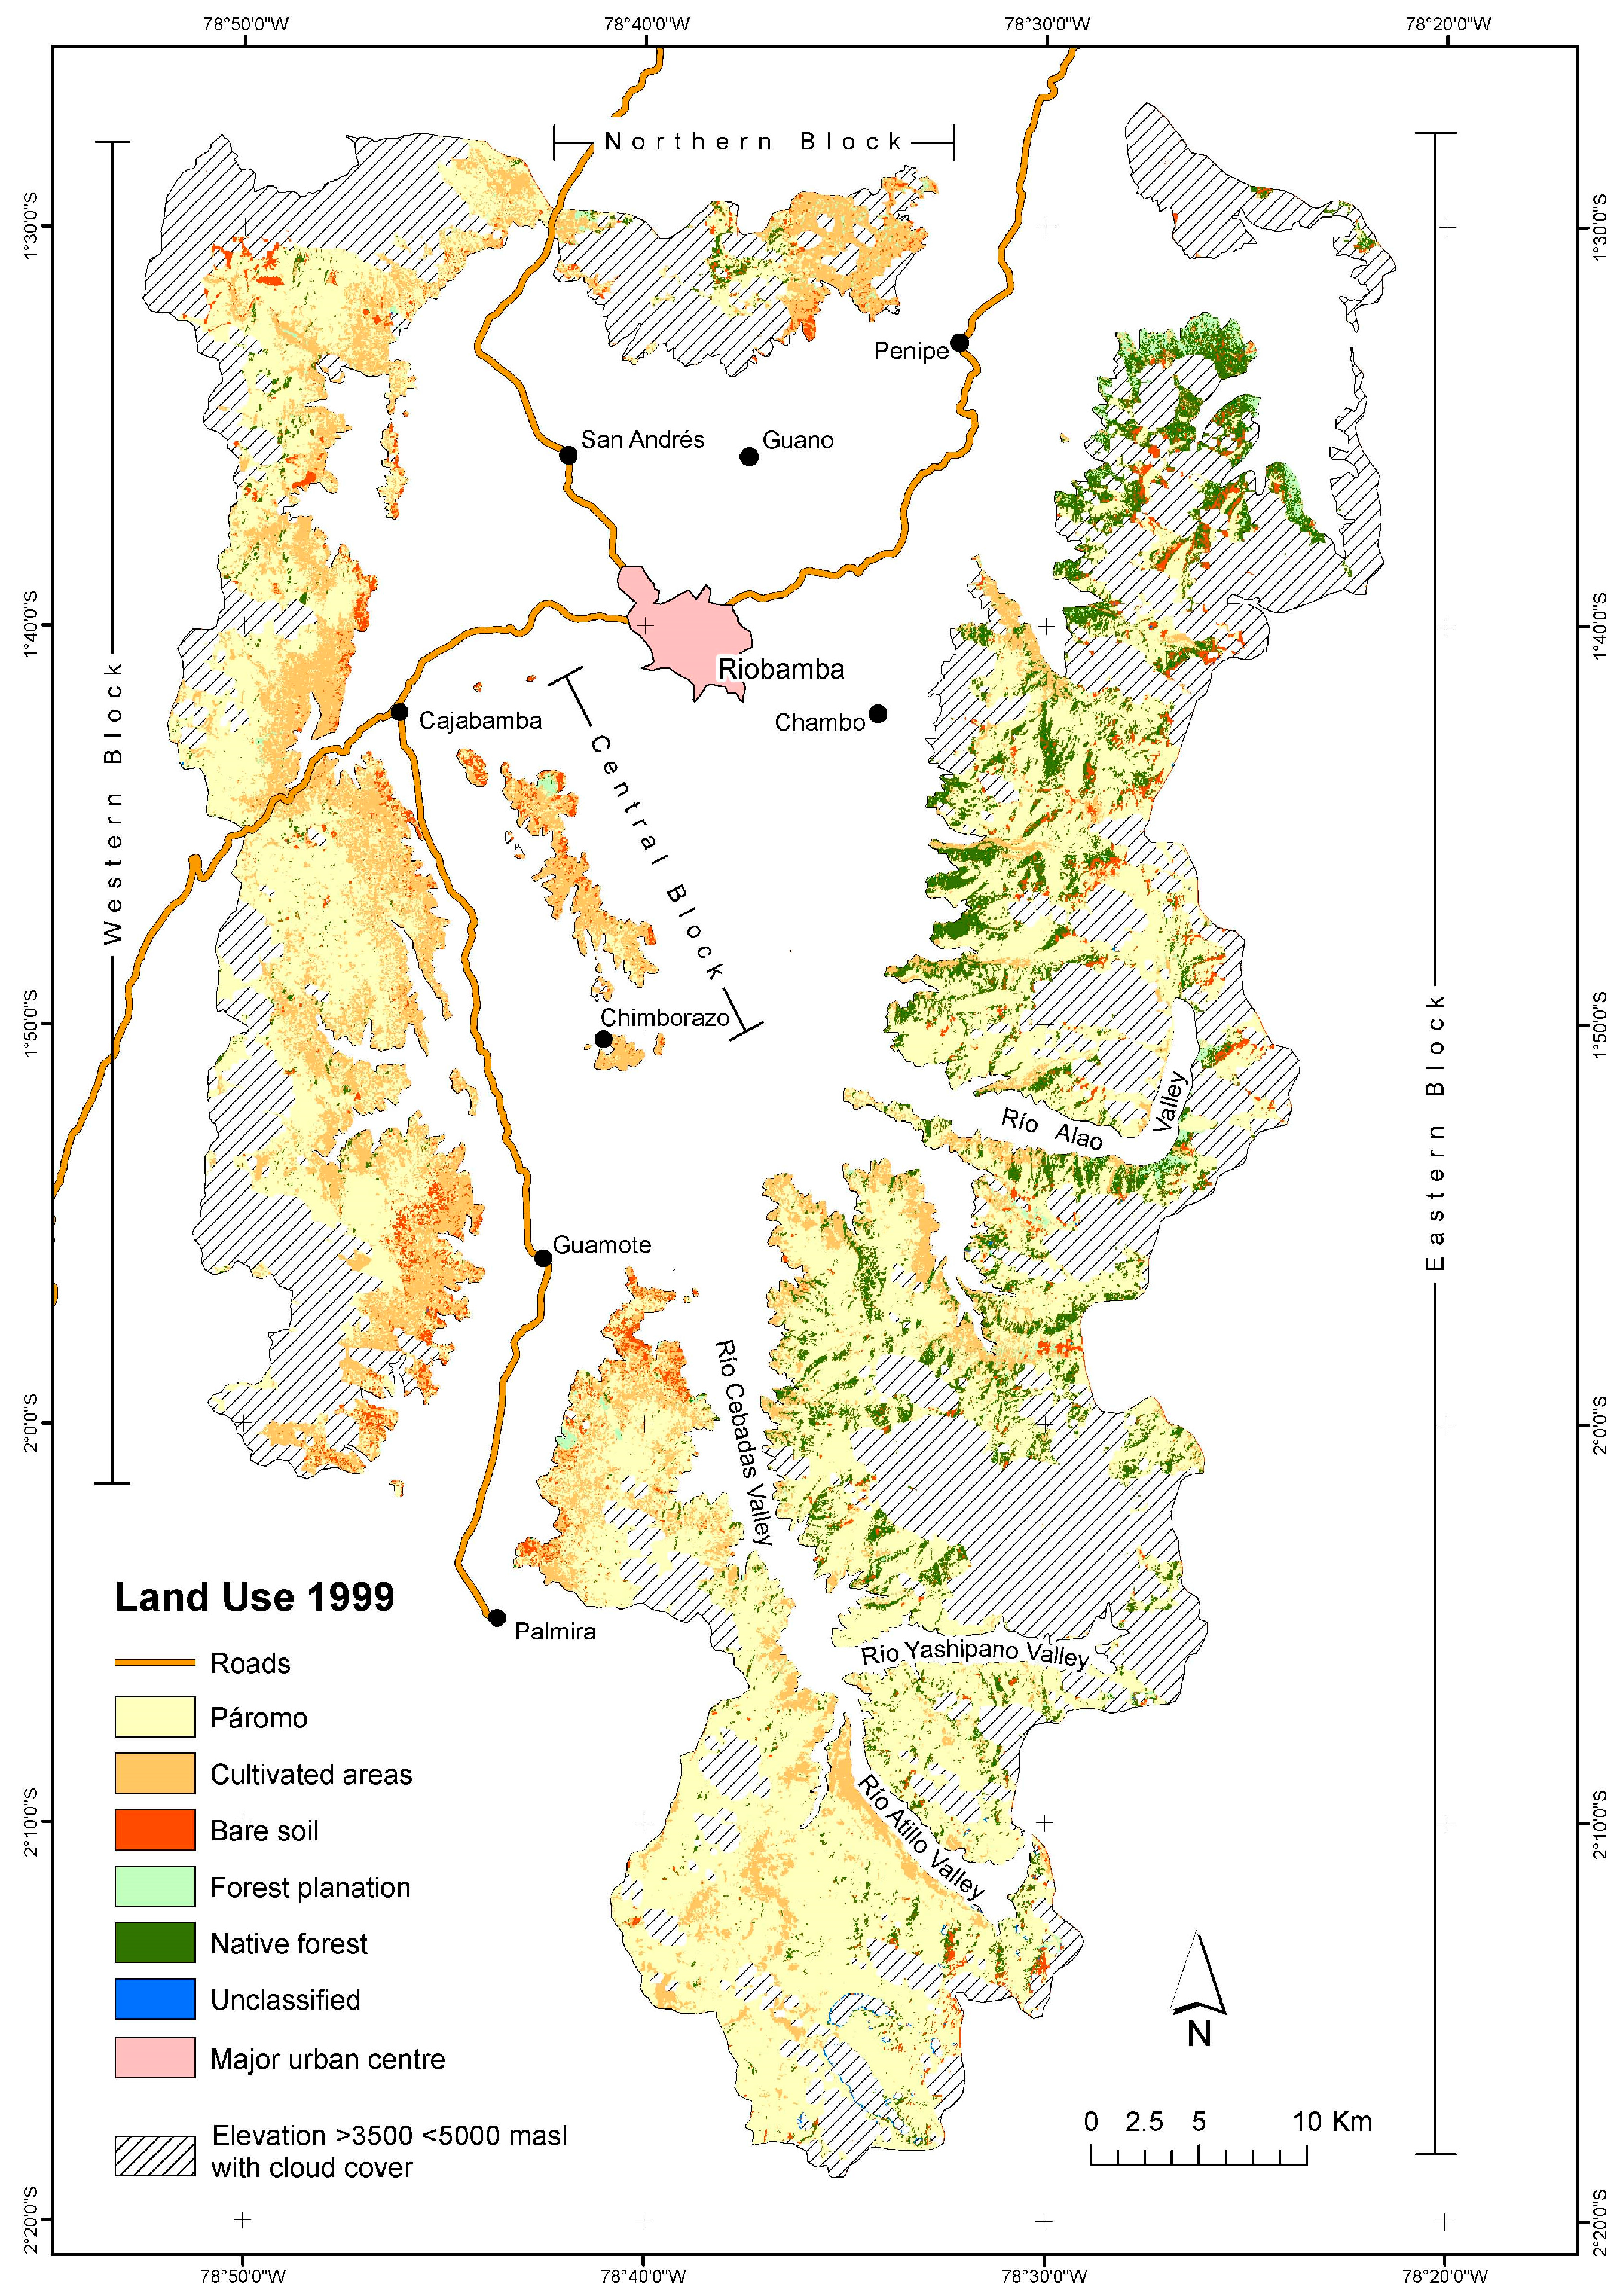
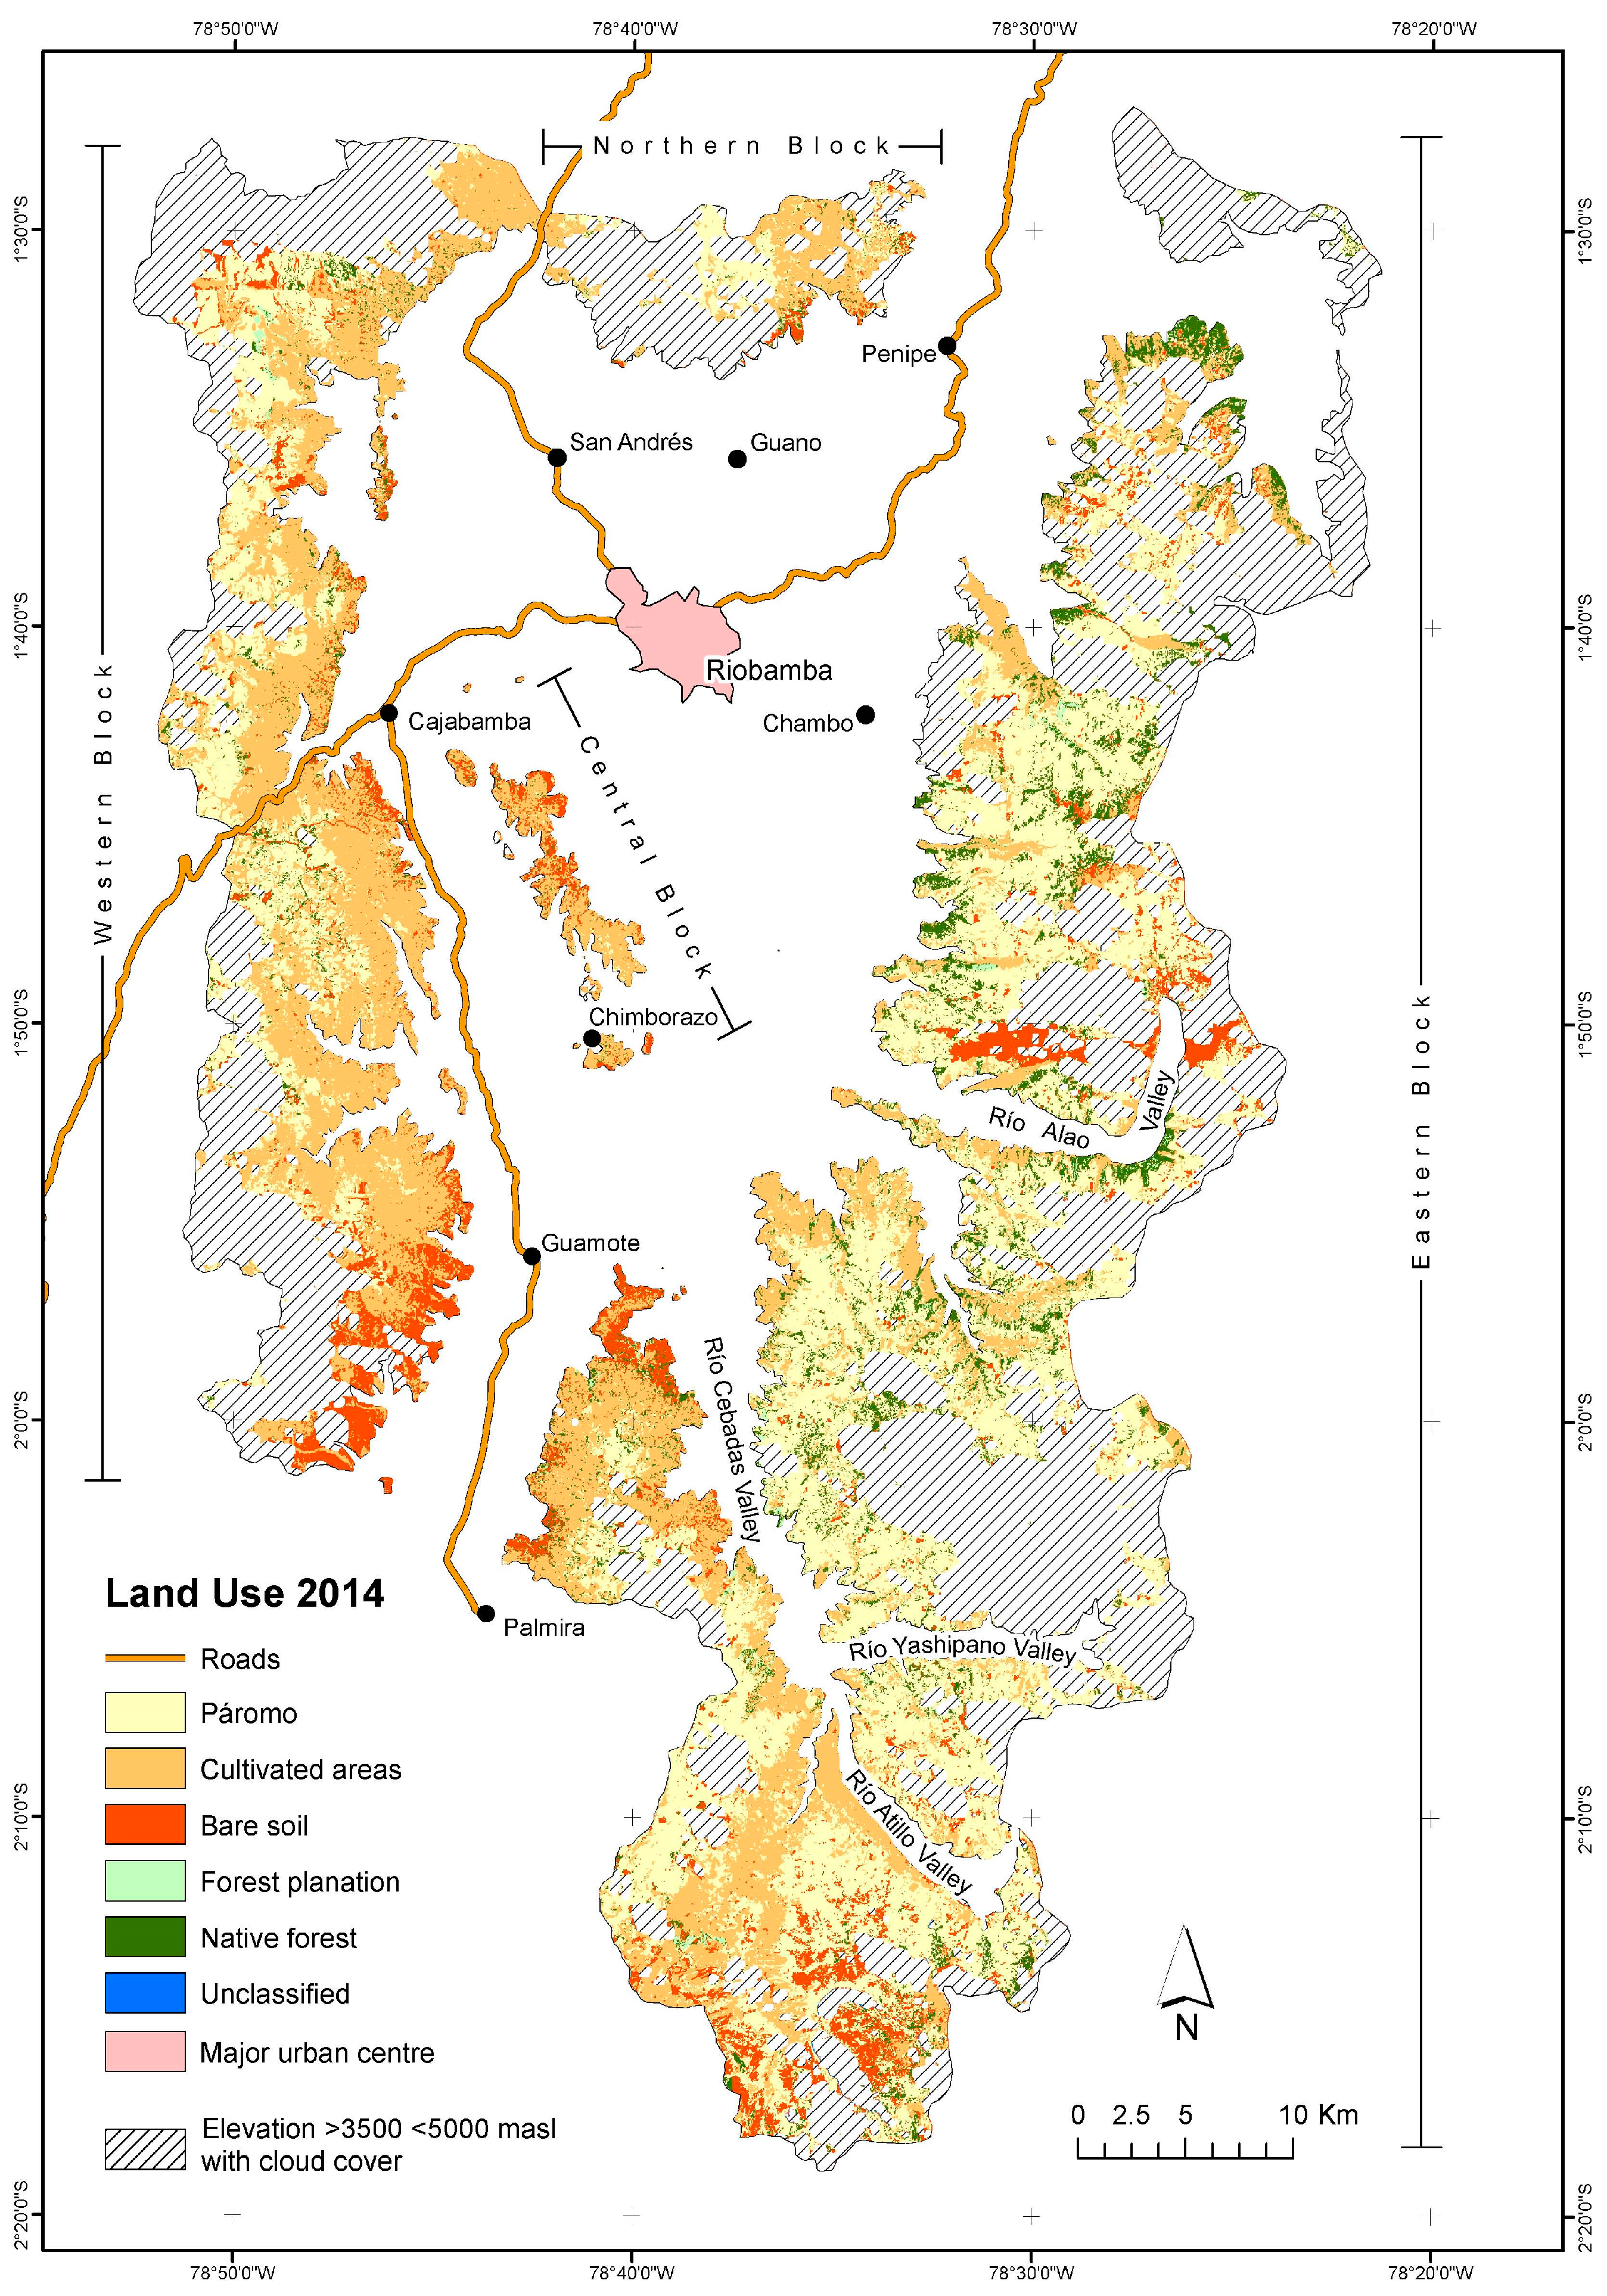
3. Results
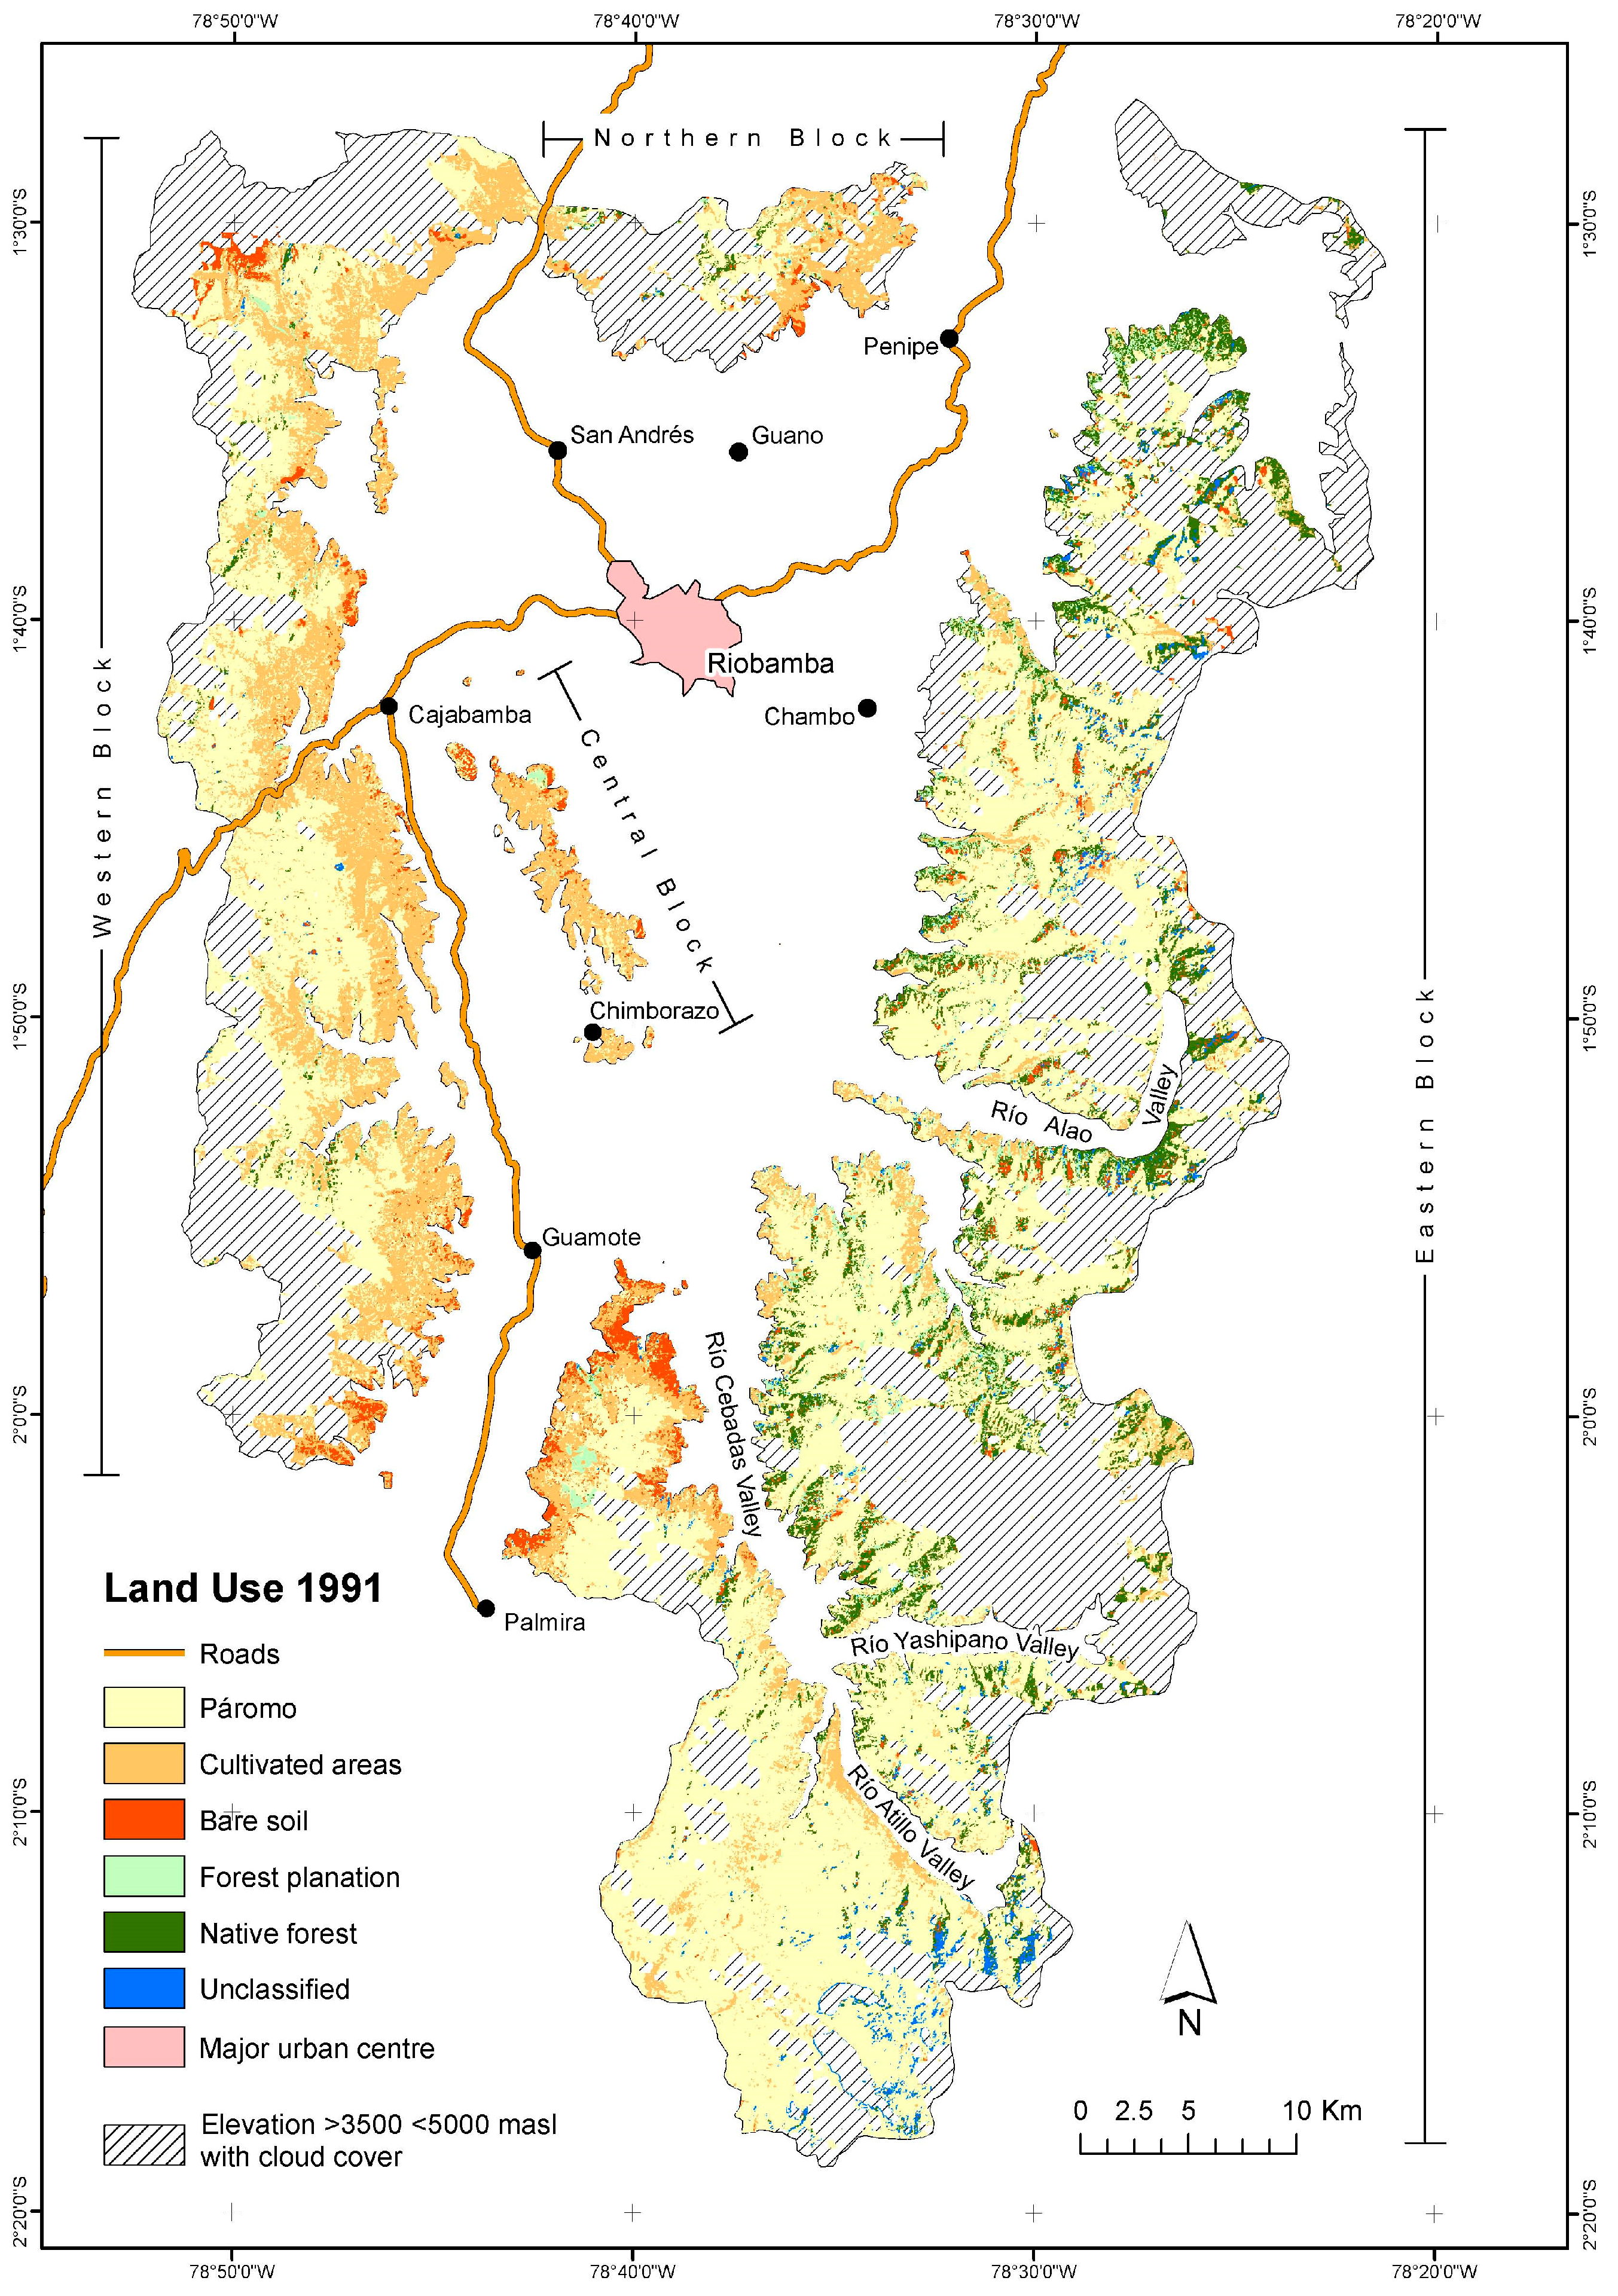
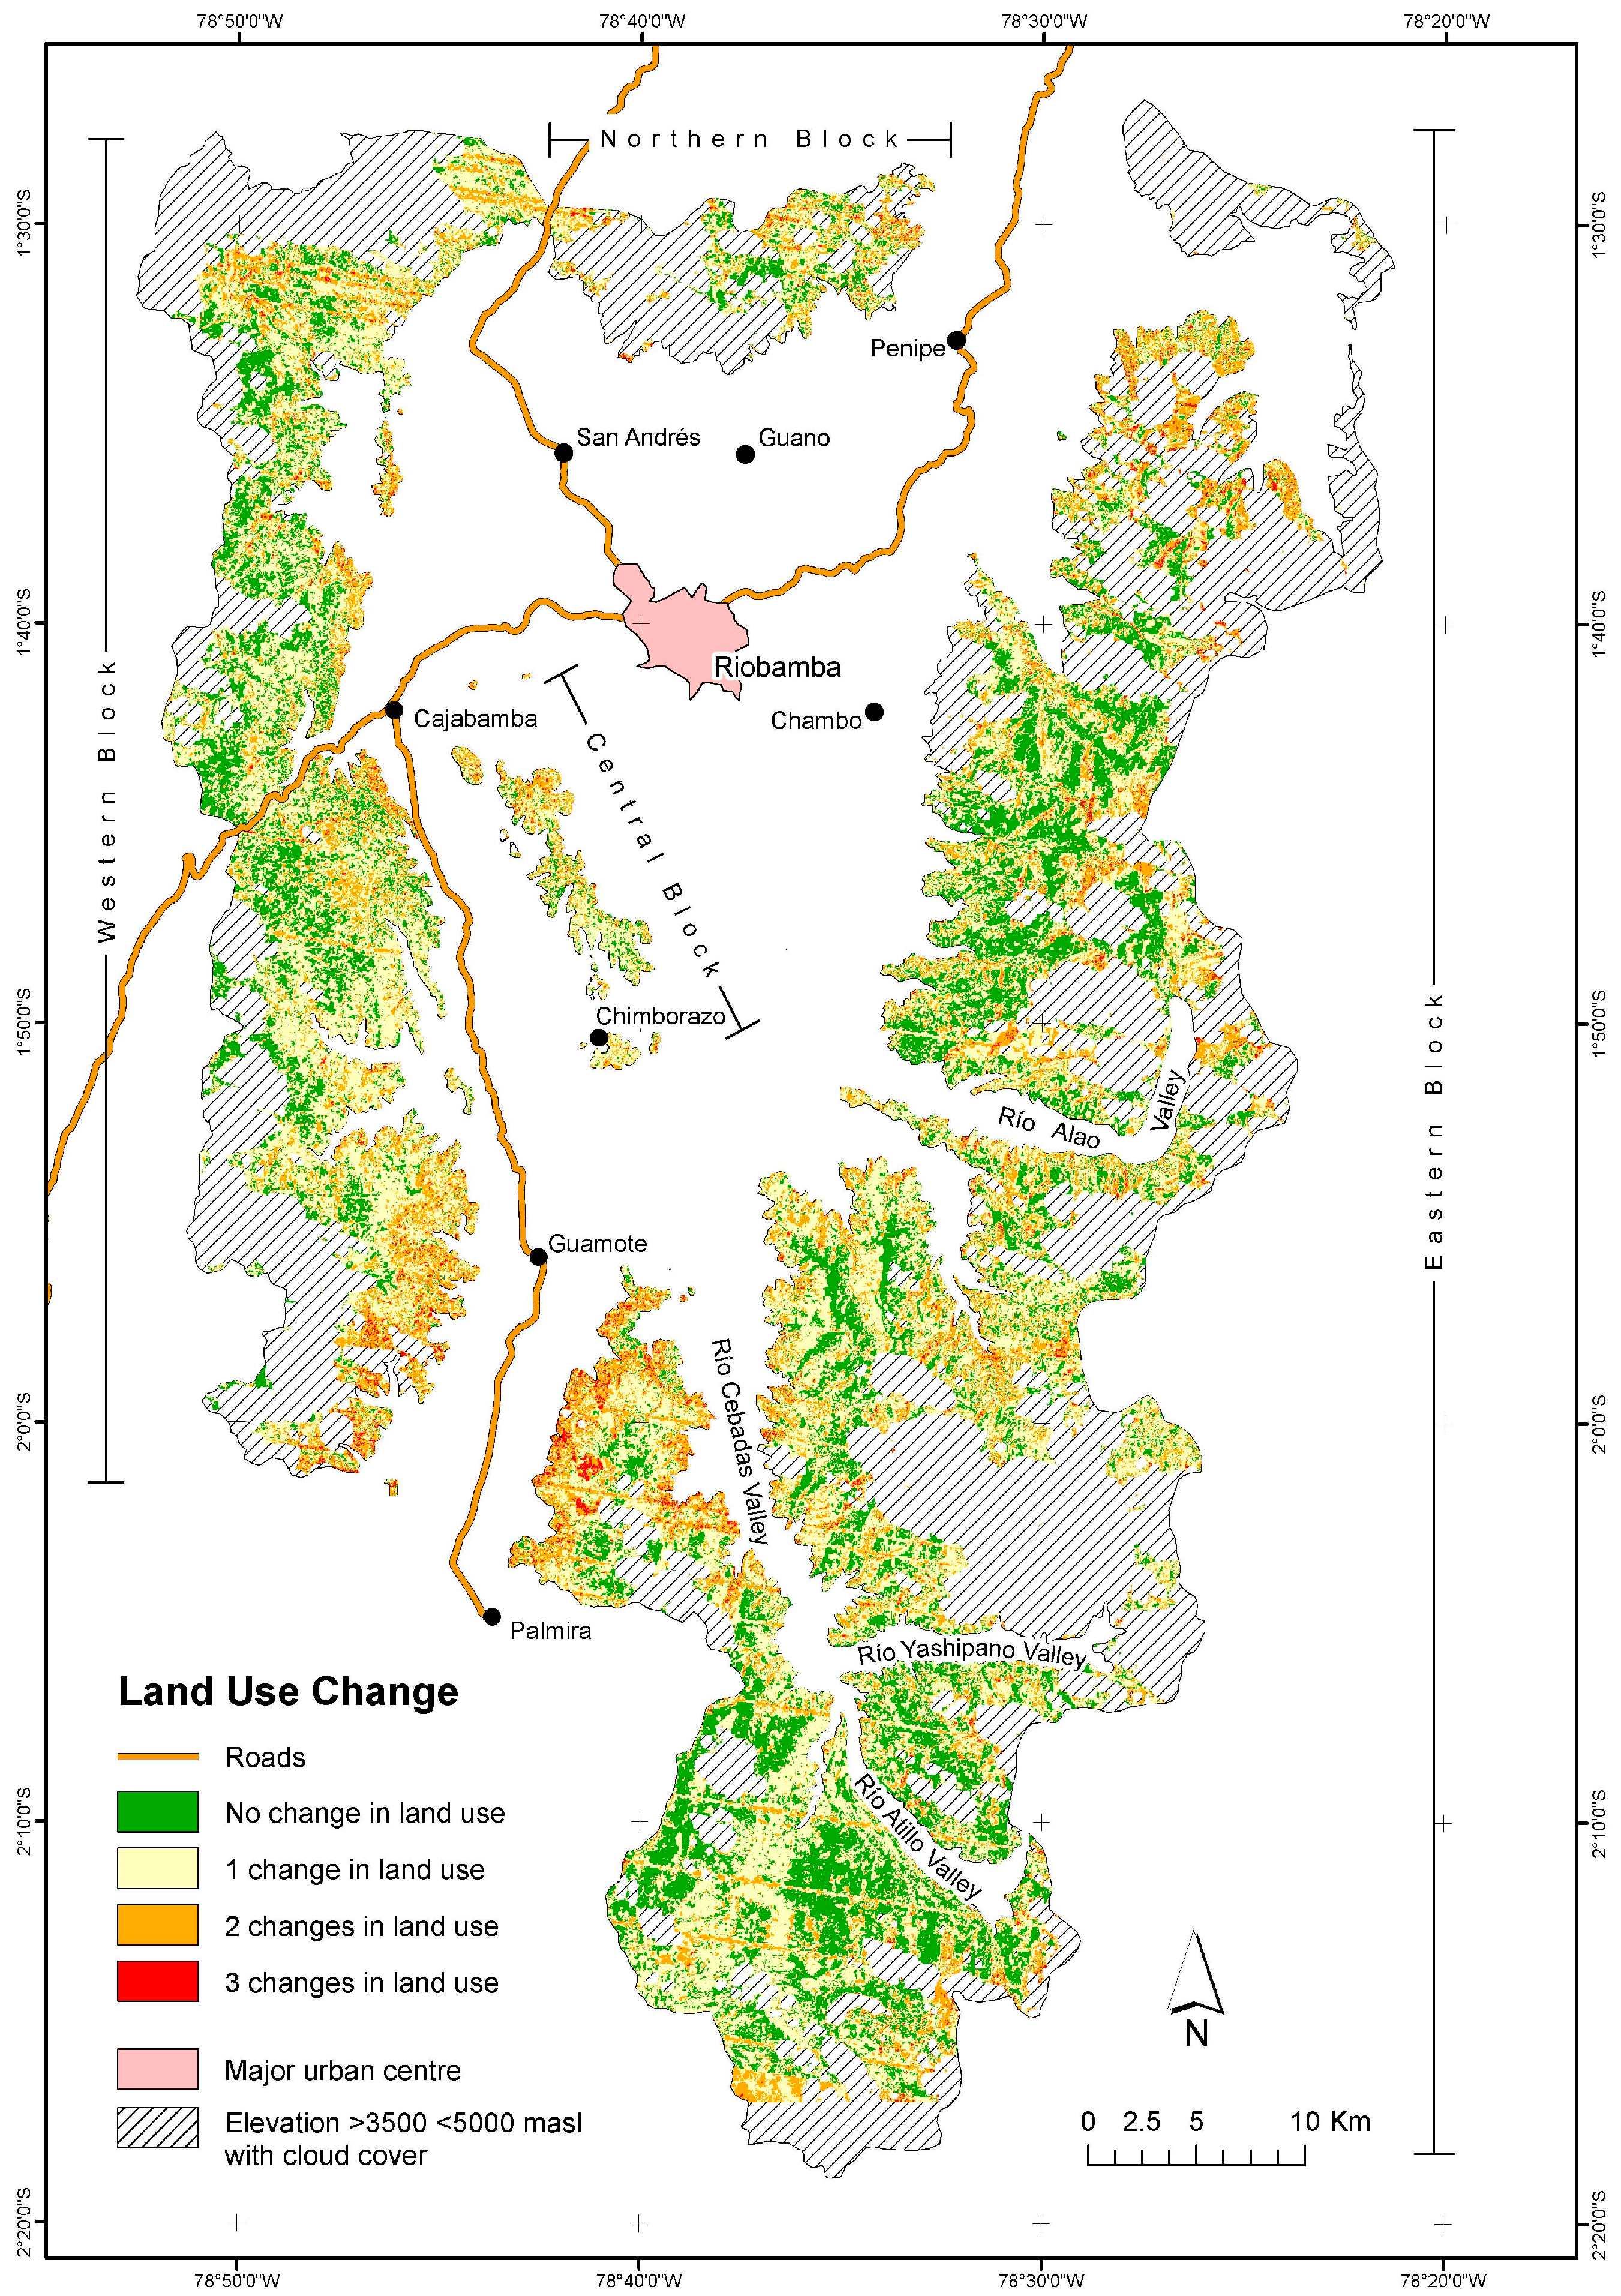
- (i)
- A small block of land to the north between Volcán Chimborazo and Volcán Tungurahua–the northern block;
- (ii)
- A small northwest-southeast aligned area in the center west of the basin—the central block;
- (iii)
- The continental divide to the west—the western block; and
- (iv)
- The interfluve between the Chambo basin and other rivers flowing into the Río Pastaza—the eastern block.
4. Explaining Land-Use Change in the Chambo Basin
4.1. Drivers of Land-Use and Land-Cover Change: 1950–1979
4.2. Post-1979 Drivers of Land-Use and Land-Cover Change: Forestry Policies
4.3. Demography and Infrastructure Development as Drivers Since 1979
4.4. Limitations
5. Conclusions
Acknowledgements
Author Contributions
Conflicts of Interest
References
- Barthlott, W.; Rafiqpoor, D. Global Centers of Vascular Plant Diversity. Nova Acta Leopoldina 2005, NF92, 61–83. [Google Scholar]
- Luteyn, J.L. Páramos: A Checklist of Plant Diversity, Geographic Distribution and Botanical Literature; Memoirs of the New York Botanic Garden 84; The New York Botanic Garden Press: New York, NY, USA, 1999. [Google Scholar]
- Madriñán, S.; Cortés, A.J.; Richardson, J.E. Páramo is the world’s fastest evolving and coolest biodiversity hotspot. Front. Genet. 2013, 4, 192. [Google Scholar] [CrossRef] [PubMed]
- Sklenář, P.; Balslev, H. Geographic flora elements in the Ecuadorian superpáramo. Flora 2007, 202, 50–61. [Google Scholar] [CrossRef]
- Sklenář, P.; Ramsay, P.N. Diversity of zonal páramo plant communities in Ecuador. Divers. Distrib. 2001, 7, 113–124. [Google Scholar] [CrossRef]
- Vásconez, P.M.; Hofstede, R.G.M. Los páramos ecuatorianos. In Bótancia Económica de los Andes Centrales; Morares, M., Øllegard, B., Kvist, L.P., Borchsenius, F., Balslev, H., Eds.; Universidad Mayor San Andrés: La Paz, Bolivia, 2006; pp. 91–109. [Google Scholar]
- Young, K.R.; Ulloa, U.C.; Luteyn, J.L.; Knapp, S. Plant Evolution and Endemism in Andean South America: An Introduction. Bot. Rev. 2002, 68, 4–21. [Google Scholar] [CrossRef]
- Buytaert, W.; Célleri, R.; de Bièvre, B.; Cisneros, F. Hidrología del páramo andino: Propiedades, Importancia, Vulnerabilidad. Rev. Colomb. Tiene Páramos 2012, 2, 8–27. [Google Scholar]
- Buytaert, W.; Célleri, R.; De Bièvre, B.; Cisneros, F.; Wyseure, G.; Deckers, J.; Hofstede, R. Human impact of the hydrology of Andean páramos. Earth-Sci. Rev. 2006, 79, 53–72. [Google Scholar] [CrossRef]
- Célleri, R.; Feyen, J. The Hydrology of Tropical Andean Ecosystems: Importance, Knowledge, Status and Perspectives. Mt. Res. Dev. 2009, 4, 350–355. [Google Scholar] [CrossRef]
- Food and Agricultural Organization of the United Nations (FAO). Review of World Water Resources by Country; FAO: Rome, Italy, 2003; Available online: ftp://ftp.fao.org/agl/aglw/docs/wr23e.pdf (accessed on 24 February 2017).
- Harden, C.P. Human impacts on headwater fluvial systems in the northern and central Andes. Geomorphology 2006, 79, 249–263. [Google Scholar] [CrossRef]
- Minaya, V.; Corzo, G.; Romero, H.; van der Kwast, J.; Latinga, E.; Mynett, A. Analysis of biomass and carbon distribution in the Ecuadorian alpine grassland. In Proceedings of the 2nd International Conference on Environment, Energy and Biotechnology (ICEEB), Kuala Lumpur, Malaysia, 8–9 June 2013. [Google Scholar]
- Mosquera, G.M.; Lazo, P.X.; Célleri, R.; Wilcox, B.P.; Crespo, P. Runoff from tropical alpine grasslands increases with areal extent of wetlands. Catena 2015, 125, 120–128. [Google Scholar] [CrossRef]
- Podwojewski, P.; Poulenard, J. Los suelos de los páramos del Ecuador. In Los Suelos del Páramo Serie Páramo 5; Mena, P.A., Josse, C., Medina, G., Eds.; GTP/Abya Yala: Quito, Ecuador, 2000; pp. 7–27. [Google Scholar]
- Worldwide Fund for Nature (WWF) Northern Andean Páramo 2017. Available online: http://wwf.panda.org/about_our_earth/ecoregions/northern_andean_paramo.cfm (accessed on 24 February 2017).
- Balslev, H.; Luteyn, J.L. Páramo: An Andean Ecosystem under Human Influence; Balslev, H., Luteyn, J.L., Eds.; Academic Press: London, UK, 1992. [Google Scholar]
- Gade, D.W. Nature and Culture in the Andes; University of Wisconsin Press: Madison, WI, USA, 1999. [Google Scholar]
- Hofstede, R.G.M. El impacto de las actividades humanas sobre el páramo. In Los Páramos del Ecuador: Particularidades, Problemas y Perspectives; Mena, P., Medina, G., Hofstede, R.G.M., Eds.; Abya Yala/Proyecto Páramo: Quito, Ecuador, 2001; pp. 161–185. [Google Scholar]
- Mena, P.A.; Morales, M.P.; Ortiz, G.R.; Rivadeneria, S.; Suárez, E.; Terán, J.F.; Velázquez, C. Gente y Ambiente de Páramo: Realidades y Perspectivas en el Ecuador; EcoCiencia/Abya Yala: Quito, Ecuador, 2008. [Google Scholar]
- Young, K.R. Stasis and flux in long-inhabited locales: Change in rural Andean landscapes. In Land Change Science in the Tropics; Millington, A.C., Jepson, W.E., Eds.; Springer: Boston, MA, USA, 2008; pp. 11–32. [Google Scholar]
- Sierra, R. The role of domestic timber markets in tropical deforestation and forest degradation in Ecuador: Implications for conservation planning and policy. Ecol. Econ. 2001, 36, 327–340. [Google Scholar] [CrossRef]
- Anderson, E.P.; Marengo, J.; Villalba, R.; Halloy, S.; Young, B.; Cordero, D.; Gast, F.; Jaimes, E.; Ruiz, D. Consequences of Climate Change for Ecosystems and Ecosystem Services in the Tropical Andes. In Climate Change and Biodiversity in the Tropical Andes; Herzog, S.K., Martinez, R., Jørgensen, P.M., Tiessen., H., Eds.; Inter-American Institute for Global Change Research (IAI): Montevideo, Uruguay; Scientific Committee on Problems of the Environment (SCOPE): Amstelveen, The Netherland, 2011; pp. 1–19. [Google Scholar]
- Buytaert, W.; Cuesta-Camacho, F.; Tobón, C. Potential impacts of climate change on the environmental services of humid tropical alpine regions. Glob. Ecol. Biogeogr. 2011, 20, 19–33. [Google Scholar] [CrossRef]
- Young, B.; Young, K.R.; Josse, C. Vulnerability of Tropical Andean Ecosystems to Climate Change. In Climate Change and Biodiversity in the Tropical Andes; Herzog, S.K., Martinez, R., Jørgensen, P.M., Tiessen, H., Eds.; Inter-American Institute for Global Change Research (IAI): Montevideo, Uruguay; Scientific Committee on Problems of the Environment (SCOPE): Amstelveen, The Netherland, 2011; pp. 170–182. [Google Scholar]
- Hofstede, R.; Coppus, R.; Vásconez, P.M.; Segarra, P.; Wolf, J.; Sevink, J. El Estado de Conservacion de los páramos de pajonal en el Ecuador. Ecotropicos 2002, 15, 3–18. [Google Scholar]
- Ortiz, D.; Mena, P. Las Áreas Protegides y los Páramos Serie Páramo 10; GTP/Abya Yala: Quito, Ecuador, 2002. [Google Scholar]
- Balthazar, V.; Vanacker, V.; Molina, A.; Lambin, E.F. Impacts of forest cover change on ecosystem services in high Andean mountains. Ecol. Indic. 2015, 48, 63–75. [Google Scholar] [CrossRef]
- Wigmore, O.; Gao, J. Spatiotemporal dynamics of a páramo ecosystem in the Northern Ecuadorian Andes 1988–2007. J. Mt. Sci. 2014, 11, 708–716. [Google Scholar] [CrossRef]
- Curatola Fernández, G.F.; Obermeier, W.A.; Gerique, A.; López Sandoval, M.F.; Lehnert, L.W.; Thies, B.; Bendix, J. Land Cover Change in the Andes of Southern Ecuador—Patterns and Drivers. Remote Sens. 2015, 7, 2509–2542. [Google Scholar] [CrossRef]
- Henry, A.; Mabit, L.; Jaramillio, R.E.; Cartagena, Y.; Lynch, J. Land use effects on erosion and carbon storage of the Río Chimbo watershed, Ecuador. Plant Soil 2011, 367, 477–491. [Google Scholar] [CrossRef]
- Buytaert, W.; Wyseure, G.; de Bièvre, B.; Decikers, J. The effect of land-use changes on the hydrological behaviour of Histic Andosols in south Ecuador. Hydrol. Process. 2005, 19, 3985–3997. [Google Scholar] [CrossRef]
- Farley, K.A.; Bremer, L.L.; Harden, C.P.; Hartsig, J. Changes in carbon storage under alternative land uses in biodiverse Andean grasslands: Implications for ecosystem services. Conserv. Lett. 2013, 6. [Google Scholar] [CrossRef]
- Hofstede, R.G.M. Effects of livestock farming and recommendations for management and conservation of Páramo grassland (Colombia). Land Degrad. Rehabil. 1995, 6, 133–147. [Google Scholar] [CrossRef]
- Hofstede, R.G.M.; Hofstede, J.; Groenendjik, J.; Coppus, R.; Sevink, J. The impact of pine plantations on soils and vegetation in the Ecuadorian high Andes. Mt. Res. Dev. 2002, 22, 159–167. [Google Scholar] [CrossRef]
- Molina, A.; Givers, G.; Poesen, J.; van Hemelryck, H.; de Bièvre, B.; Vanacker, V. Environmental factors controlling spatial variation in sediment yield in a central Andean mountain area. Geomorphology 2008, 98, 176–186. [Google Scholar] [CrossRef]
- Podwojewski, P.; Poulenard, J. Los degradación de los en los páramos. In Los Suelos del Páramo Serie Páramo 5; Mena, P.A., Josse, C., Medina, G., Eds.; GTP/Abya Yala: Quito, Ecuador, 2000; pp. 7–27. [Google Scholar]
- Poulenard, J.; Podwojewski, P.; Janeau, J.L.; Collinet, J. Runoff and soil erosion under rainfall simulation of Andisols from the Ecuadorian Páramo: Effect of tillage and burning. Catena 2001, 45, 185–207. [Google Scholar] [CrossRef]
- Spehn, E.M.; Liberman, M.; Körner, C. (Eds.) Land Use Change and Mountain Biodiversit; CRC Press: Boca Raton, FL, USA, 2003. [Google Scholar]
- Peters, T.; Drobnik, T.; Meyer, H.; Rankl, M.; Richter, M.; Rollenbeck, R.; Thies, B.; Bendix, J. Environmental Changes Affecting the Andes of Ecuador. In Ecosystem Services, Biodiversity and Environmental Change in a Tropical Mountain Ecosystem of South Ecuador; Bendix, J., Beck, E., Bräuning, A., Makeschin, F., Mosandl, R., Scheu, S., Wilcke, W., Eds.; Springer: New York, NY, USA, 2013; pp. 19–30. [Google Scholar]
- Farley, K.A.; Anderson, W.A.; Bremer, L.L.; Harden, C.P. Compensation for ecosystems services: An evaluation of efforts to achieve conservation and development in Ecuadorian páramo grasslands. Environ. Conserv. 2011, 38, 393–405. [Google Scholar] [CrossRef]
- Mena, P.; Medina, G. Los páramos en el Ecuador. In Los páramos del Ecuador; Mena, P., Medina, G., Hofstede, R., Eds.; Proyecto Páramo: Quito, Ecuador, 2001; pp. 1–24. [Google Scholar]
- Raes, L.; Mohebalian, P. TEEB Case: The Socio Bosque Program for Rainforest and Páramo Conservation, Ecuador. 2014. Available online: http://doc.teebweb.org/wp-content/uploads/2014/09/The-Socio-Bosque-Programme-for-Rainforest-and-Paramo-Conservation_2014.pdf (accessed on 24 February 2017).
- De Koning, G.H.J.; Verburg, P.; Veldkamp, A.; Fresco, L.O. Multi-scale modelling of land use change dynamics in Ecuador. Agric. Syst. 1999, 61, 77–93. [Google Scholar] [CrossRef]
- Colby, J.D.; Keating, P.L. Land cover classification using Landsat TM imagery in the tropical highlands: The influence of anisotropic reflectance. Int. J. Remote Sens. 1998, 19, 1479–1497. [Google Scholar] [CrossRef]
- Conese, C.; Maselli, F. Use of multitemporal information to improve classification performance of TM scenes in complex terrain. ISPRS J. Photogramm. Remote Sens. 1991, 46, 187–197. [Google Scholar] [CrossRef]
- Martinuzzi, S.; Gould, W.A.; Ramos González, O.M. Creating Cloud-Free Landsat ETM+ Data Sets in Tropical Landscapes: Cloud and Cloud-Shadow Removal; General Technical Report IITF-GTR-32; USDA: Washington, DC, USA, 2007.
- Jokisch, B.D.; Lair, B.M. One last stand? Forests and change on Ecuador’s eastern Cordillera. Geogr. Rev. 2002, 92, 235–256. [Google Scholar] [CrossRef]
- Instiuto Nacional Estadistica y Censos (INEC), 2017. Available online: http://www.inec.gob.ec (accessed on 24 February 2017).
- AGUAChambo, Consejo de Subcuenca, (No Date), Subcuenca Chambo. Available online: https://subcuencachambo.wordpress.com/comite-de-gestion/ (accessed on 24 February 2017).
- USGS (United Stated Geological Survey). Landsat Higher Level Science Data Products. 2015. Available online: http://landsat.usgs.gov/CDR_ECV.php (accessed on 10 April 2017).
- Feng, M.; Sexton, J.O.; Huang, C.; Masek, J.G.; Vermote, E.F.; Gao, F.; Narasimhan, R.; Channan, S.; Wolfe, R.E.; Townshend, J.R. Global surface reflectance products from Landsat: Assessment using coincident MODIS observations. Remote Sens. Environ. 2013, 134, 267–293. [Google Scholar] [CrossRef]
- Vuolo, F.; Mattiuzzi, M.; Atzberger, C. Comparison of the Landsat Surface Reflectance Climate Data Record (CDR) and manually atmospherically data in a semi-arid European study area. Int. J. Appl. Earth Obs. Geoinf. 2015, 42, 1–10. [Google Scholar] [CrossRef]
- Masek, J.G.; Vermote, E.F.; Saleous, N.E.; Wolfe, R.; Hall, F.G.; Huemmrich, K.F.; Gao, F.; Kutler, J.; Lim, T. A Landsat Surface Reflectance Dataset for North America, 1990–2000. IEEE Geosci. Remote Sens. Lett. 2006, 3, 68–72. [Google Scholar] [CrossRef]
- USGS (United Stated Geological Survey). Landsat Surface Reflectance High Level Data Products. 2015. Available online: http://landsat.usgs.gov/documents/cdr_sr_product_guide.pdf (accessed on 17 September 2015).
- Chavez, P. Image-based atmospheric corrections revisited and improved. Photogramm. Eng. Remote Sens. 1996, 62, 1025–1036. [Google Scholar]
- Instituto Geográfico Militar. IGM 2010. Available online: http://www.geoportaligm.gob.ec/portal/index.php/descarga-de-servicios-wms-del-igm/ (accessed on 15 August 2011).
- Plan de Desarrolloy Ordenamiento Territorial 2010–2030. Available online: https://www.slideshare.net/metroya/planes-de-desarrollo-y-ordenamiento-territorial (accessed on 10 April 2017).
- International Potato Center (IPC). World Potato Atlas. Lima, Peru. Available online: https://research.cip.cgiar.org/confluence/display/wpa/Ecuador (accessed on 1 June 2016).
- Buytaert, W.; Iñiguez, V.; de Bièvre, B. The effects of afforestation and cultivation on water yield in the Andean páramo. For. Ecol. Manag. 2007, 251, 22–30. [Google Scholar] [CrossRef]
- Gounard, P. Land use in the Andean region of Ecuador: From Inventory to Analysis. Land Use Policy 1988, 5, 341–348. [Google Scholar] [CrossRef]
- Farley, K.A. Grasslands to tree plantations: Forest transition in the Andes of Ecuador. Ann. Assoc. Am. Geogr. 2007, 5, 341–348. [Google Scholar] [CrossRef]
- Farley, K.A. Pathways to forest transition: Local case studies from the Ecuadorian Andes. J. Lat. Am. Geogr. 2010, 9, 6–26. [Google Scholar]
- Bremer, L.L.; Farley, K.A.; Lopez-Carr, D.L. What factors influence participation in payment for ecosystem services programs? An evaluation of Ecuador’s SocioPáramo program. Land Use Policy 2014, 36, 122–133. [Google Scholar] [CrossRef]
- Zomer, R.J.; Trabucco, A.; Ustin, S.L. Building spectral libraries for wetlands land cover classification and hyperspectral remote sensing. J. Environ. Manag. 2009, 90, 2170–2177. [Google Scholar] [CrossRef] [PubMed]
- Fjeldså, J. Polylepis Forests—Vestiges of a vanishing ecosystem in the Andes. Ecotropia 2002, 8, 111–123. [Google Scholar]
- Chen, J.; Chen, J.; Liao, A.; Cao, X.; Chen, L.; Chen, X.; He, C.; Han, G.; Peng, S.; Lu, M.; et al. Global land cover mppping at 30 m resolution: A POK-based operational approach. ISPRS J. Photogramm. Remote Sens. 2015, 103, 7–27. [Google Scholar] [CrossRef]


| Date | Satellite/Sensor | Spatial Resolution (m) | Download Details |
|---|---|---|---|
| 4 February 1979 | Landsat 2/MSS | 80 | 8-bit quantized radiance data |
| 18 December 1991 | Landsat 5/TM | 30 | Surface reflectance calibrated images from Landsat Higher Level Science Data Products archive |
| 14 November 1999 | Landsat 7/ETM+ | 30 | |
| 30 October 2014 | Landsat 8/OLI | 30 |
| Land Use | 1979 | 1991 | 1999 | 2014 |
| Páramo | 63,073 | 76,370 | 74,712 | 54,733 |
| Native forest | 30,795 | 12,225 | 9024 | 8234 |
| Bare soil | 3572 | 2661 | 3221 | 11,206 |
| Wetlands | 1693 | 108 | 1785 | 31 |
| All natural and semi-natural | 99,133 | 91,454 | 88,742 | 74,204 |
| Land Cover | 1979 | 1991 | 1999 | 2014 |
| Forest plantations | 0 | 2093 | 4359 | 519 |
| Agricultural areas | 18,745 | 26,700 | 28,124 | 46,473 |
| All modified land uses | 18,745 | 28,803 | 32,473 | 46,992 |
| Land-Use and Land-Cover Transition Pathways | Inter-Image Periods | |||||
|---|---|---|---|---|---|---|
| 1979–1991 | 1991–1999 | 1999–2014 | ||||
| ha | % | ha | % | ha | % | |
| Páramo to agriculture | 11,650 | 18 | 7647 | 10 | 21,665 | 29 |
| Páramo to forest plantation | 994 | 2 | 453 | 1 | 288 | <1 |
| Páramo to bare soil | 518 | <1 | 312 | <1 | 6037 | 5 |
| Native forest to páramo | 14,303 | 46 | 2606 | 21 | 6570 | 73 |
| Native forest to agriculture | 5216 | 17 | 828 | 7 | 1883 | 21 |
| Native forest to forest plantation | 2629 | 9 | 0 | 0 | 117 | 1 |
| Native forest to bare soil | 521 | 2 | 46 | <1 | 328 | 4 |
| Agriculture to páramo | 9049 | 48 | 9917 | 37 | 2280 | 8 |
| Agriculture to forest plantation | 420 | 2 | 328 | 1 | 49 | <1 |
| Agriculture to bare soil | 466 | 3 | 1216 | 5 | 2726 | 10 |
| Forest plantation to páramo | 1044 | <1 | 439 | 21 | 360 | 8 |
| Forest plantation to agriculture | 0 | 0 | 1044 | 50 | 907 | 21 |
| Forest plantation to bare soil | 0 | 0 | 24 | 1 | 24 | 1 |
| Unchanged Areas | ||||||
| Páramo | 47,578 | 75 | 60,473 | 79 | 43,769 | 59 |
| Native forest | 6173 | 20 | 4330 | 35 | 2901 | 32 |
| Land-Use Transition Pathways | Inter-Image Period | ||
|---|---|---|---|
| 1979–1991 | 1991–1999 | 1999–2014 | |
| ha | ha | Ha | |
| All land uses to timber plantations | 4.034 | 835 | 554 |
| Timber plantations to all land uses | 1044 | 1507 | 1291 |
| Net establishment of mature timber plantations | +2990 | −672 | −737 |
| Canton | Population (1990 Census) | Population Increase 1990–2001 (Persons/Annum) | Population Increase 2001–2010 (Persons/Annum) |
|---|---|---|---|
| Chambo | 11,885 | +89.8 | +159.8 |
| Guano | 42,851 | +71.1 | +551.4 |
| Pinipe | 6739 | −83.9 | +28.2 |
| Rióbamba | 225,471 | +268.59 | +362.9 |
© 2017 by the authors. Licensee MDPI, Basel, Switzerland. This article is an open access article distributed under the terms and conditions of the Creative Commons Attribution (CC BY) license (http://creativecommons.org/licenses/by/4.0/).
Share and Cite
Ross, C.; Fildes, S.; Millington, A. Land‐Use and Land‐Cover Change in the Páramo of South‐Central Ecuador, 1979–2014. Land 2017, 6, 46. https://doi.org/10.3390/land6030046
Ross C, Fildes S, Millington A. Land‐Use and Land‐Cover Change in the Páramo of South‐Central Ecuador, 1979–2014. Land. 2017; 6(3):46. https://doi.org/10.3390/land6030046
Chicago/Turabian StyleRoss, Cristina, Stephen Fildes, and Andrew Millington. 2017. "Land‐Use and Land‐Cover Change in the Páramo of South‐Central Ecuador, 1979–2014" Land 6, no. 3: 46. https://doi.org/10.3390/land6030046
APA StyleRoss, C., Fildes, S., & Millington, A. (2017). Land‐Use and Land‐Cover Change in the Páramo of South‐Central Ecuador, 1979–2014. Land, 6(3), 46. https://doi.org/10.3390/land6030046