1. Introduction
In the last decade, one of the priorities of many governments around the world has been to promote the consumption of fruits and vegetables [
1]. The supply of vegetables has increased in all regions of the world, but gaps between food production and access to food (usually linked to income inequality, distribution, social outbreaks, or disasters), still mean more than 10% of the world population consume less, or none, of what is recommended as the minimum dietary energy requirement [
2]. The spatial inequality in accessing vegetables for consumption is exemplified by the following example. In the year 2000, North America had an availability of 98.3 kg/capita/year (~269.32 g/capita/day), while in South America availability was only 47.8 kg/capita/year (~131 g/capita/day), a difference better explained by agricultural policies and incentives than by land availability and climatic conditions [
3]. The Food and Agriculture Organization of the United Nations (FAO) [
2] has pointed out that climate change in the form of rainfall and temperature patterns is likely to reduce crop yields and be a major obstacle to food security in Latin America and the Caribbean. One example is the anomalous shortage of rainfall in southeastern Brazil between 2013 and 2015 [
4], which resulted in great production losses in São Paulo’s green belt area, reducing fresh vegetable availability in the metropolitan area by 40%–90% for leafy vegetables. The losses caused an average increase of 10% in prices of vegetables. Perishable products, especially (for example lettuce, broccoli, watercress, and chayote), were up to 70% more expensive in January of 2015 [
5], hindering people's economic access to these foods.
Lack of organization of the highly informal national supply side is another important obstacle to vegetable availability identified by the National Council of Food Security in Brazil (CONSEA) [
6]. Until a couple of decades ago, a large number of families produced their own vegetables for self-consumption. According to Rocha [
7], fresh fruits and vegetables are some of the least developed markets in Brazil, with many different levels of organization, scale, and quality standards, and different prices across the national territory [
6]. Since Brazil has become highly urbanized in recent decades, with only 15% of the entire population now living in rural areas [
8], land use change can be seen as both a driver and a consequence of changes that impact food production and demand. In the competition for land, urbanization often prevails over other uses, leading to conversion of cropland systems and decreased local food production [
9]. Urban expansion and other kinds of non-agricultural development drive up land prices, which further stimulates real estate speculation, resulting in further conversion of agricultural lands to non-agricultural use [
10]. This process, which is also intensified by demographic and generational changes favoring urban rather than rural settlement [
11], can increase vegetable prices and thus reduce access, mainly in low-income populations [
12,
13].
Recent land use and land cover maps for 2000–2014 indicate that Brazil has lost 4.11% of its original forest area and 5.75% of its natural pasture. These losses have been 1.4 times faster than common tropical forest losses. Lost natural cover was replaced by planted pasture (4.60%), a mosaic of agriculture, pasture, and natural vegetation remnants (3.33%), and monoculture crops (1.94%) [
8]. The expropriation of small farming units by large-scale agriculture and ranching, and the systemic encouragement to switch from food crops to export crops also threaten food and nutritional security (FNS) in Brazil, since 70% of all food consumed is produced by small farms occupying only 30% of all agricultural land [
14].
The Brazilian strategy of strong dependence on agricultural commodity exportation as a core driver of economic growth still occurs amid environmental degradation and social inequality [
15]. Between 1990 and 2008, increased exports of commodities exceeded the production of food for domestic consumption [
16]. The externalities and social burdens of this process, such as pollutants, pesticide-contaminated products, and the incapacity of free markets to provide sufficient public goods, have been pointed to by Rocha [
7] as a “market failure”. For instance, expansion of soy and meat production in the Brazilian savannah affects ecosystem services, resulting in highly disproportional costs and benefits that are not only very unequally distributed among the population, but also a grave threat to the country’s food, water, and energy security [
17]. Some of these market failures could be counteracted by FNS public policies and alternative market chains that promote a fairer society [
7].
The 2012/2015 National Plan for Food and Nutrition Security aimed to promote FNS with integrated actions to strengthen food production, including stimuli for small crop farming, alternative food supply channels, and the promotion of healthy/adequate food consumption [
18]. Nevertheless, FNS depends on a variety of public and private institutions, largely profit-prioritizing transnational corporations [
19,
20] such as retail food chains and agrochemical industries, which promotes unequal access to fresh food. Efforts towards FNS must tackle these issues and associated systemic problems of inequality inherent in the global capitalist system [
21].
Failure to meet FNS objectives reflects institutional inability to apply efficient governance to the economic, ecological, and social dimensions of the problem at different spatial scales [
22]. The search for alternatives that consider all these dimensions across spatial scales has motivated this work, as understanding national demands for more nutritious and culturally accepted food is a first step to achieving FNS in the face of socioenvironmental changes. By using the most recent updated Household Budget Survey (HBS) from 2008–2009 and the Agricultural Census from 2006, we evaluate spatial trends in the national demand for vegetables and estimate regional shifts in the amount of vegetables required to meet national demand. To know if it is viable for per capita consumption in Brazil to grow to meet the WHO’s recommendation, we also evaluate vegetable acquisition against vegetable production.
Growing data and scientific literature show that healthier diets cost more than unhealthier ones, since food choices are driven by limited economic purchasing power [
23] and by the huge supply of low-cost and nutritionally poor food [
16]. Data from the Brazilian Institute of Geography and Statistics (IBGE) [
24] and the Health Ministry’s Surveillance of Risk Factors and Protection for Chronic Diseases Inquiry by Telephone (VIGITEL) indicate that Brazilians consume very few vegetables. In 2014, only 18.9% of the population met WHO recommendations for daily intake of at least 400 g of fruits and vegetable [
24,
25]. In metropolitan areas, access to food with poor nutritional value is greater, making healthier choices even harder for low and middle-income people. The 2008–2009 HBS sampled ~60,000 households in rural and urban areas to investigate quality of life perceptions and the nutritional profile of the Brazilian population. Statistics showed a 187% variation in acquisition of vegetables between lower and higher income classes [
24]. The census also indicated that access to nutritious food in Brazil can be significantly driven by income inequality and different cultural backgrounds that affect food choices. The data showed a rise in consumption of sugars and fat and a significant change in feeding patterns, while the consumption of food such as beans, rice, and cassava flour has lessened. A growing share of processed ready-to-eat foods such as breads, sausages, biscuits, soft drinks, and ready meals was found [
26]. In addition, VIGITEL indicated that 52.5% of Brazilians were overweight, compared to 43% in 2006, and that 17.9% of the population was obese [
27].
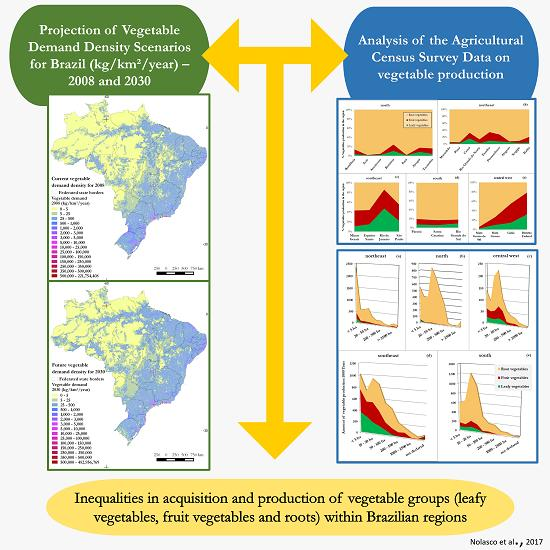
These statistics provide important information for the development of food and nutrition security and health policies. They provide useful market information to the private sector about consumer profiles and demand for goods and services, information that is also essential to strategic building of public investments. The HBS contains food acquisition data relative to amounts of food and beverages acquired for self-consumption by households from various geographical locations, income classes, and methods of acquisition. Data is given in calories per capita per year (cal/capita/year) and kilograms per capita per year (kg/capita/year) for each surveyed food item. HBS data and population per census tract in 2010, projected to 2030, were used to build maps of vegetable demand density. These maps are useful for understanding space and time demand dynamics for horticultural food, especially when considering the continental dimensions of Brazil and its immense human–environmental spatial heterogeneity. For these reasons, food density maps are powerful tools for the development and implementation of food access policies, market strategies, and land use planning when considering agricultural potentialities and vulnerabilities in food vs. commodities production.
Food acquisition or consumption data can be spatially distributed by food density maps that combine current per capita caloric needs and projected needs, estimated using current and projected population density. The maps can improve understanding of geographical variations and trends in food demand [
28]. Although caloric data can be useful in assessing food demand for a given population, relating food calories to amount produced (in tons) can generate uncertainties due to the different sampling approaches adopted by the Brazilian surveys. Since food acquisition data for Brazil is available both in cal/capita/year and kg/capita/year [
24], our food density maps represent kilograms of food acquisition per square kilometer per year (kg/km
2/year). We considered population data for comparison with WHO consumption recommendations in grams per capita per day (g/capita/day) and the amount of vegetables produced, as given by the Agricultural Census Survey (AgCS).
Matuschke [
28] warns that food density maps are not widely used due to the need for extensive and multisource projected data, which imposes a number of local uncertainties in the final maps. As an example, data on the energy content of diets is based on national averages, so assumptions delineating the projection for a population may not be entirely correct. Still, density maps of food demand are useful as they indicate trends and spatial gaps.
This study analyzes the spatial distribution of demand for vegetables in Brazil by building vegetable-demand density maps based on rural and urban census tracts. Vegetables are grouped into three groups: leafy vegetables (leaves/stems/herbs), fruit vegetables (fruits/flowers/seeds) and roots (roots/bulbs/tubers). We investigate how the demand for vegetables in 2008 was spatially distributed in Brazil and project its distribution in 2030. We identify the strengths and setbacks of our method, especially in understanding future demand for vegetables. In order to evaluate whether future demand is reasonably supplied by Brazilian production, regional averages were generated from maps of current and future vegetable demand and compared to vegetable production levels indicated by the 2006 AgrCS. We identify regions where production would meet (or not) demand levels if the WHO recommendations on vegetable consumption were met.
This work was the foundation of the Delivering Food Security on Limited Land project (DEVIL) in Brazil, supported by Belmont Forum consortium.
2. Materials and Methods
To generate the maps of the spatial distribution of vegetable demand in Brazil, the main quantitative data adopted was retrieved from the Household Budget Survey (HBS) regarding vegetable acquisition, which included both monetary and non-monetary sources; the data from the 2010 population census; and population projection data for 2030 [
24,
29,
30]. This data was assembled in a geographical information system (ArcGIS 10.3.1) and spatial analyses were performed to obtain maps of current (2008) and future (2030) scenarios for vegetable demand. In order to obtain these scenarios at the census tract level, we initially processed and analyzed surveyed census data on vegetable acquisition at the regional level, that is, within five major regions and 27 federated states in Brazil, for either rural or urban areas. Next, amounts of fresh vegetables (per group of vegetables) acquired in federated states were used to estimate amounts of vegetables acquired by each of the 5570 municipalities. This calculation adopted disaggregated population numbers from 2010, per census tract, as given by a population census [
29] and projected population for 2030 of federated states [
30]. The final scenario calculation was performed through a spatial operation in Quantum GIS 2.6.1 in order to estimate final acquisition amounts per census tract. R-project scripts were implemented to link variable sheets (CSV format) of population numbers into census tract polygons (shapefile format) from the 2010 population census and population projections provided by IBGE. The South America Albers Equal Area Conic projection was adopted in order to preserve areas rather than shapes.
We assumed that whereas both the population census and the HBS data are based on sampling at the census tract level, a step-by-step demand density map based on major regions, federated states, municipalities and finally on the rural and urban census tract level would provide a holistic point of view as well as understanding of regional and local specificities. Under this premise, we generated scenarios as spatially explicit maps at the most detailed level possible, considering data sampling limitations.
The developed data crossing strategy adopted the vegetable acquisition data (kg/capita/year) of the HBS, obtained for major regions and given for both rural and urban areas, which was then crossed to the vegetable acquisitions amount per federated state to obtain rural/urban estimates at that level. First HBS data at both levels were multiplied to each other, considering the relative proportions of rural and urban acquisition portions in each major region, allowing us to estimate portions in each federated state. Next, these maps were multiplied by tables containing data on current and projected population density (inhabitants/km
2), considering relative proportions of rural and urban acquisition in each federated state, and allowing an estimate of the corresponding proportions of food acquisition for each of the 316,574 census tracts. Georeferenced polygon files of major regions, federated states, and census tracts were adopted to perform spatial operations. The described steps allowed us to project scenarios, represented by demand density maps of vegetable acquisition for 2008 and 2030 given in kg/km
2/year, for every rural and urban census tract. Since population census numbers were from 2010 and HBS data was from 2008, we considered our current scenario as referring to 2008. Scenario calculations were done considering three groups of vegetables: leaves/stems/herbs (leafy vegetables), fruits/flowers/seeds (fruit vegetables), and roots/bulbs/tubers (roots). Further details about the data and methods used in this research can be found in Nolasco [
11].
Even though final maps were built at a detailed scale using more than 300,000 census tracts, food acquisition maps by federated states and major regions were also built to support the discussion. Finally, average vegetable demand values per major region were compared to the amounts of vegetables produced in 2006 according to the Agriculture Census Survey (AgCS) [
31].
3. Results
3.1. Demand Analysis from National to Local Levels
In this paper we used data on vegetable acquisition in the HBS, as well as vegetable production data from the AgCS, adjusting vegetable classifications of both surveys to fit into three groups: leafy vegetables, fruit vegetables and roots. This adjustment allowed comparison between produced and acquired amount of vegetables. The main difference between these two surveys is the inclusion of a larger number of specific types of leafy vegetables in AgCS than in HBS [
11]. Among the roots group, only a few are not considered by the HBS, such as ginger, turnip, and radish. Although starchy foods (potatoes, cassava, and other tubers) are not included in the WHO daily recommended intake of 400 g [
25], they are considered vegetables in the HBS and therefore were considered roots in our analysis. Many of these roots/bulbs/tubers are important items in the diets of indigenous and traditional population groups in Brazil [
32,
33,
34]. In addition to having more calories than other vegetables, they are also nutritious, representing a healthier alternative to other caloric foods [
35].
There are no specifications in the 2014 Dietary Guidelines for the Brazilian Population of the proportion of vegetables that would be recommended for the Brazilian population [
35]. The US Department of Agriculture recommends that adults consume 2.5–3 cups of vegetables per day including vegetables from all groups: dark green vegetables, red and orange vegetables, beans and peas, starchy vegetables, and other vegetables [
36]. In India, the National Nutrition Institute (NIN) [
37] recommends that the consumption of 400 g of fruits and vegetables recommended by WHO should be divided into 300 g of vegetables (3 portions of 100 g) and 100 g of fruits (1 portion of 100 g). The daily vegetables portion recommended in India includes 50 g of green leafy vegetables, 200 g of other vegetables, and 50 g of roots and tubers [
37]. Some research points out that the consumption of a greater amount of leafy vegetables has the greatest protective effect against various diseases [
38]. To guide our preliminary analysis, we considered that at least 300 g of vegetables per day, with a balance between the three groups (100 g of leafy vegetables, 100 g of fruits vegetables and 100 g of roots), would indicate a reasonable daily amount per capita.
As a first step in our demand analysis, we built preliminary maps based on crossing the acquisition data for major regions and federated states. As described before, it was possible to assess the overall picture of the acquisition of vegetables in Brazil and its regional specificities.
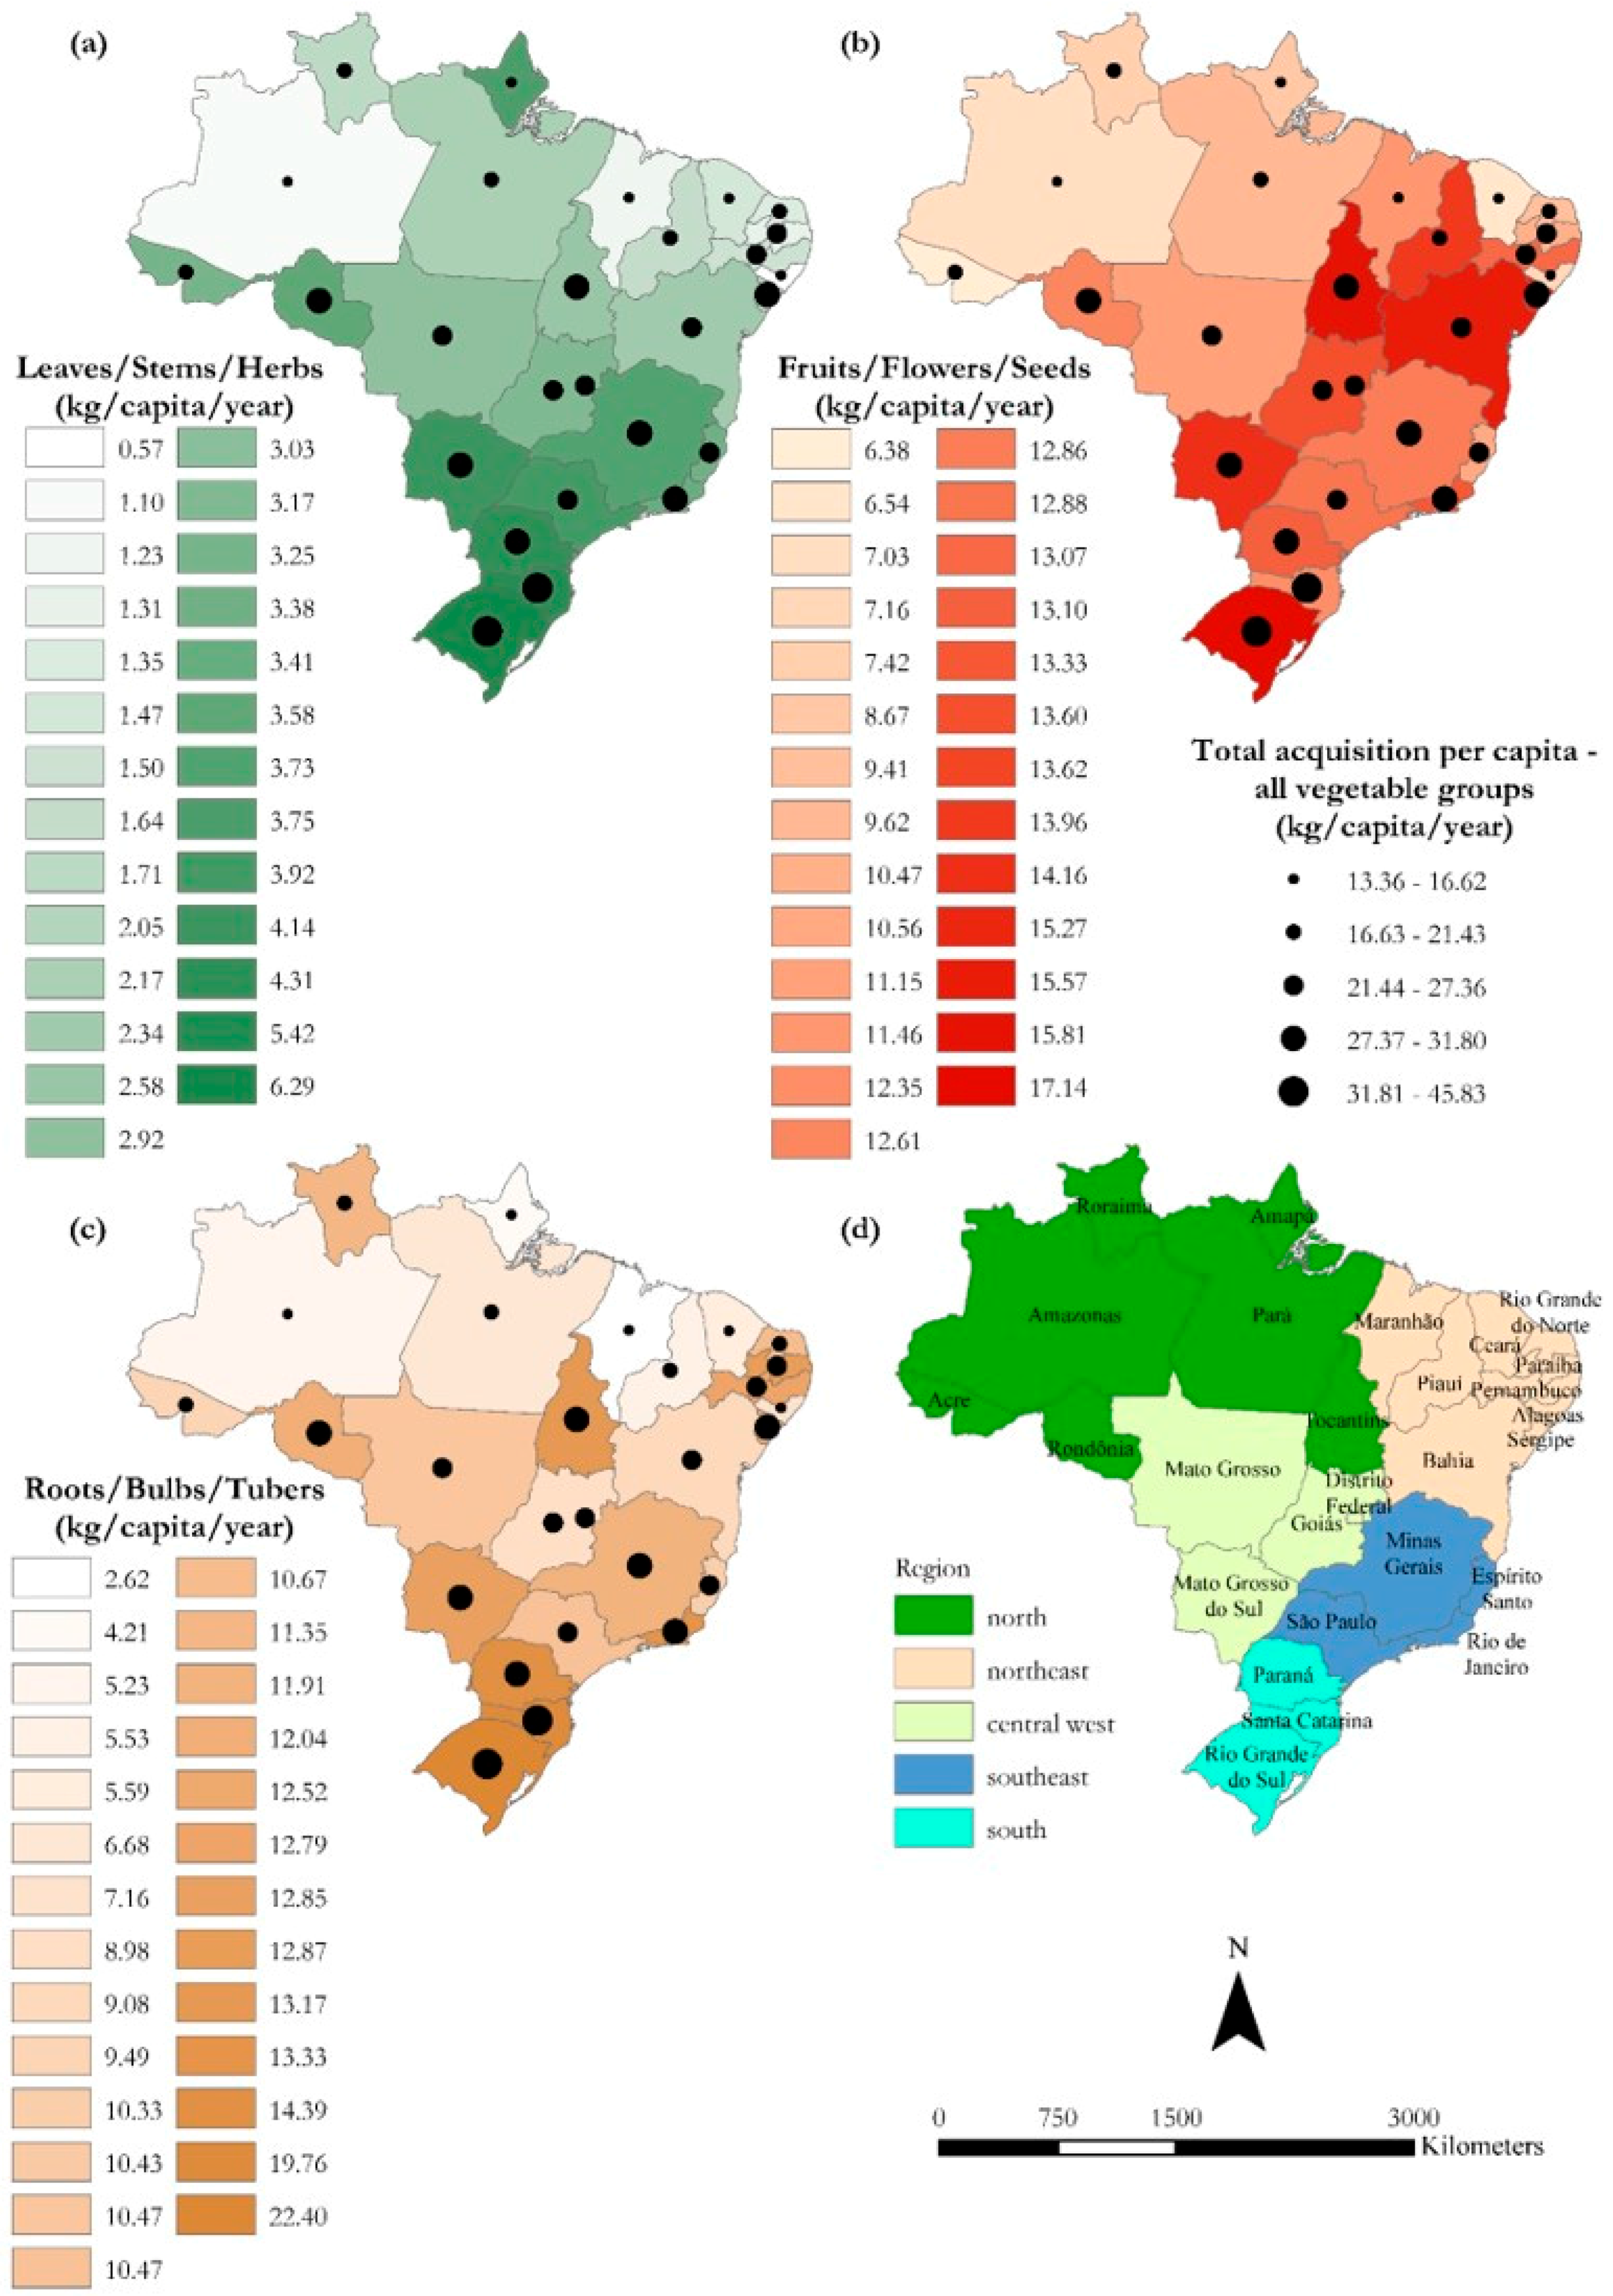
Figure 1a–d illustrate vegetable acquisition per group, graded by federated states, and total acquisition between 2008 and 2009.
In general, compared to the relatively poorer north and northeast regions, vegetable acquisition is higher in the south, southeast, and central west, in descending order. In the south, kg/capita/year acquisition in Rio Grande do Sul is 45.8, the highest among all the federated states, with daily per capita intake of 125 g divided into 61 g of leafy vegetables, 47 g of fruit vegetables and 17 g of roots. Nevertheless, even here vegetable consumption is far from the 400 g/capita/day recommended by WHO. Daily per capita consumption in São Paulo, the most populous state in Brazil, was 74 g (11 g of leafy vegetables, 35 g of fruit vegetables and 28 g roots). A common pattern across all federated states is higher acquisition of fruits or roots and less of leafy vegetables.
The federated states with lower acquisition (in descending order) were Amazonas, Ceará and Alagoas (tied), Amapá, and Maranhão. In these, total vegetable acquisition ranged from 13.3 to 16.6 kg/capita/year. In general, the figures indicate that vegetable availability is lowest in states in the northern and northeastern regions, where around 34% of households earning under the minimum wage experienced some level of food insecurity in 2013 [
39]. Along with income, other issues like climatically unfavorable conditions for leafy vegetable and fruit vegetable crops limit production with poor technology, whether in rainy tropical forest or dry savannah-like and semiarid regions.
National infrastructure logistics and market fluctuations are also limiting factors on vegetable production. As an example, a head of lettuce in Rondônia costs on average R
$1.55 [
40], while in Manaus, where lettuce production is unlikely due to the climate, it can cost R
$3.99 [
41], compelling markets to supply demand in big cities by bringing in leafy vegetables produced elsewhere. The technological factor is key in remote areas like Rondônia, where intensified local production has become possible with better technical assistance from the Brazilian Agricultural Research Corporation (EMBRAPA) and the Company of Technical Assistance and Rural Extension (EMATER). Further, Rondônia has better and more connected roads and well-defined rainfall seasonality. Conversely, Amazonas has typically humid rainforest weather throughout the year [
42,
43], very poor road connectivity, and lacks personnel to provide technical assistance in such a large territory. In rural areas of Brazil, non-cash acquisitions in 2002–2003 were 13% higher than monetary ones, while in 2008–2009 they were 40% lower than monetary acquisitions, showing that the rural population’s access to vegetables is becoming more dependent on markets [
24]. For this reason, investments in rural technology, transport networks, and logistics in those regions could improve access to vegetables.
Spatial variability of HBS data translated into food maps shows that most states located in the south, southeast, and central west regions acquired more vegetables in rural areas than in urban ones. In the south and southeast, leafy vegetables are consumed more in rural than in urban areas. Fruit acquisition is better distributed between rural and urban areas in the federated states. In the northeast, the acquisition of roots in rural areas was far below the national average, except in four states (Pernambuco, Sergipe, Paraiba, and Rio Grande do Norte), where these values are close to the national average for urban areas, where population growth was significant between 2000 and 2010.
Conversely, in the north, roots acquisition is below the national average in most urban areas; however, in rural areas in some states (Acre, Rondônia, Tocantins, and Roraima) it exceeded the national average. This could be attributed to increased production linked to the creation of small farming agricultural projects from 1995–2013, especially after 2004. These policies were concentrated in the northern and northeastern regions, where 87% of agrarian projects have taken place together with land grabbing processes in recent decades [
44,
45,
46,
47]. In these regions, although population growth rates were highest (according to the population census 2010), a large share of roots production may not reach urban centers, masking the data. For example, AgCS data for 2005–2006 suggests only 8.4% of cassava produced was sold directly to consumers, and 20.6% to intermediaries. A great part of cassava production remains in the productive areas for subsistence or local commerce, for which little consumption data exists. The acquisition of leafy vegetables is concentrated in the south and southeast, with a decline in the central west and especially in the northeast and northern regions. In states like Bahia, Tocantins, and Mato Grosso do Sul, with large fruit vegetable acquisition, there is a spatial correlation between neighboring states with higher production and states were the acquisition of fruit vegetables is higher by population (
Figure 1 and
Figure 2). These regions are known as a great producers of fruit vegetables, like tomatoes, to supply other markets.
The connection between local production and acquisition becomes clear when we compare highly productive states such as Rio Grande do Sul, Goiás, and Pernambuco, which produce and consume above the national average. Vegetable acquisition in Rio de Janeiro, Minas Gerais, Espírito Santo, São Paulo, Paraná, Santa Catarina, and Paraíba is presently close to the national average, but their high production indicates that they are major suppliers for other regions in Brazil. The acquisition of roots, discussed above, is concentrated in states of the south, southeast and central west, but some states in the north (Rondônia, Roraima and Tocantins) and northeast (Bahia, Pernambuco, Paraiba and Rio Grande do Norte) have average acquisitions above the national average. In these states, population growth and acquisition of new land in rural areas (in the case of the Amazon in particular) may influence resident populations’ consumption of these vegetables.
3.2. Acquisition vs. Production
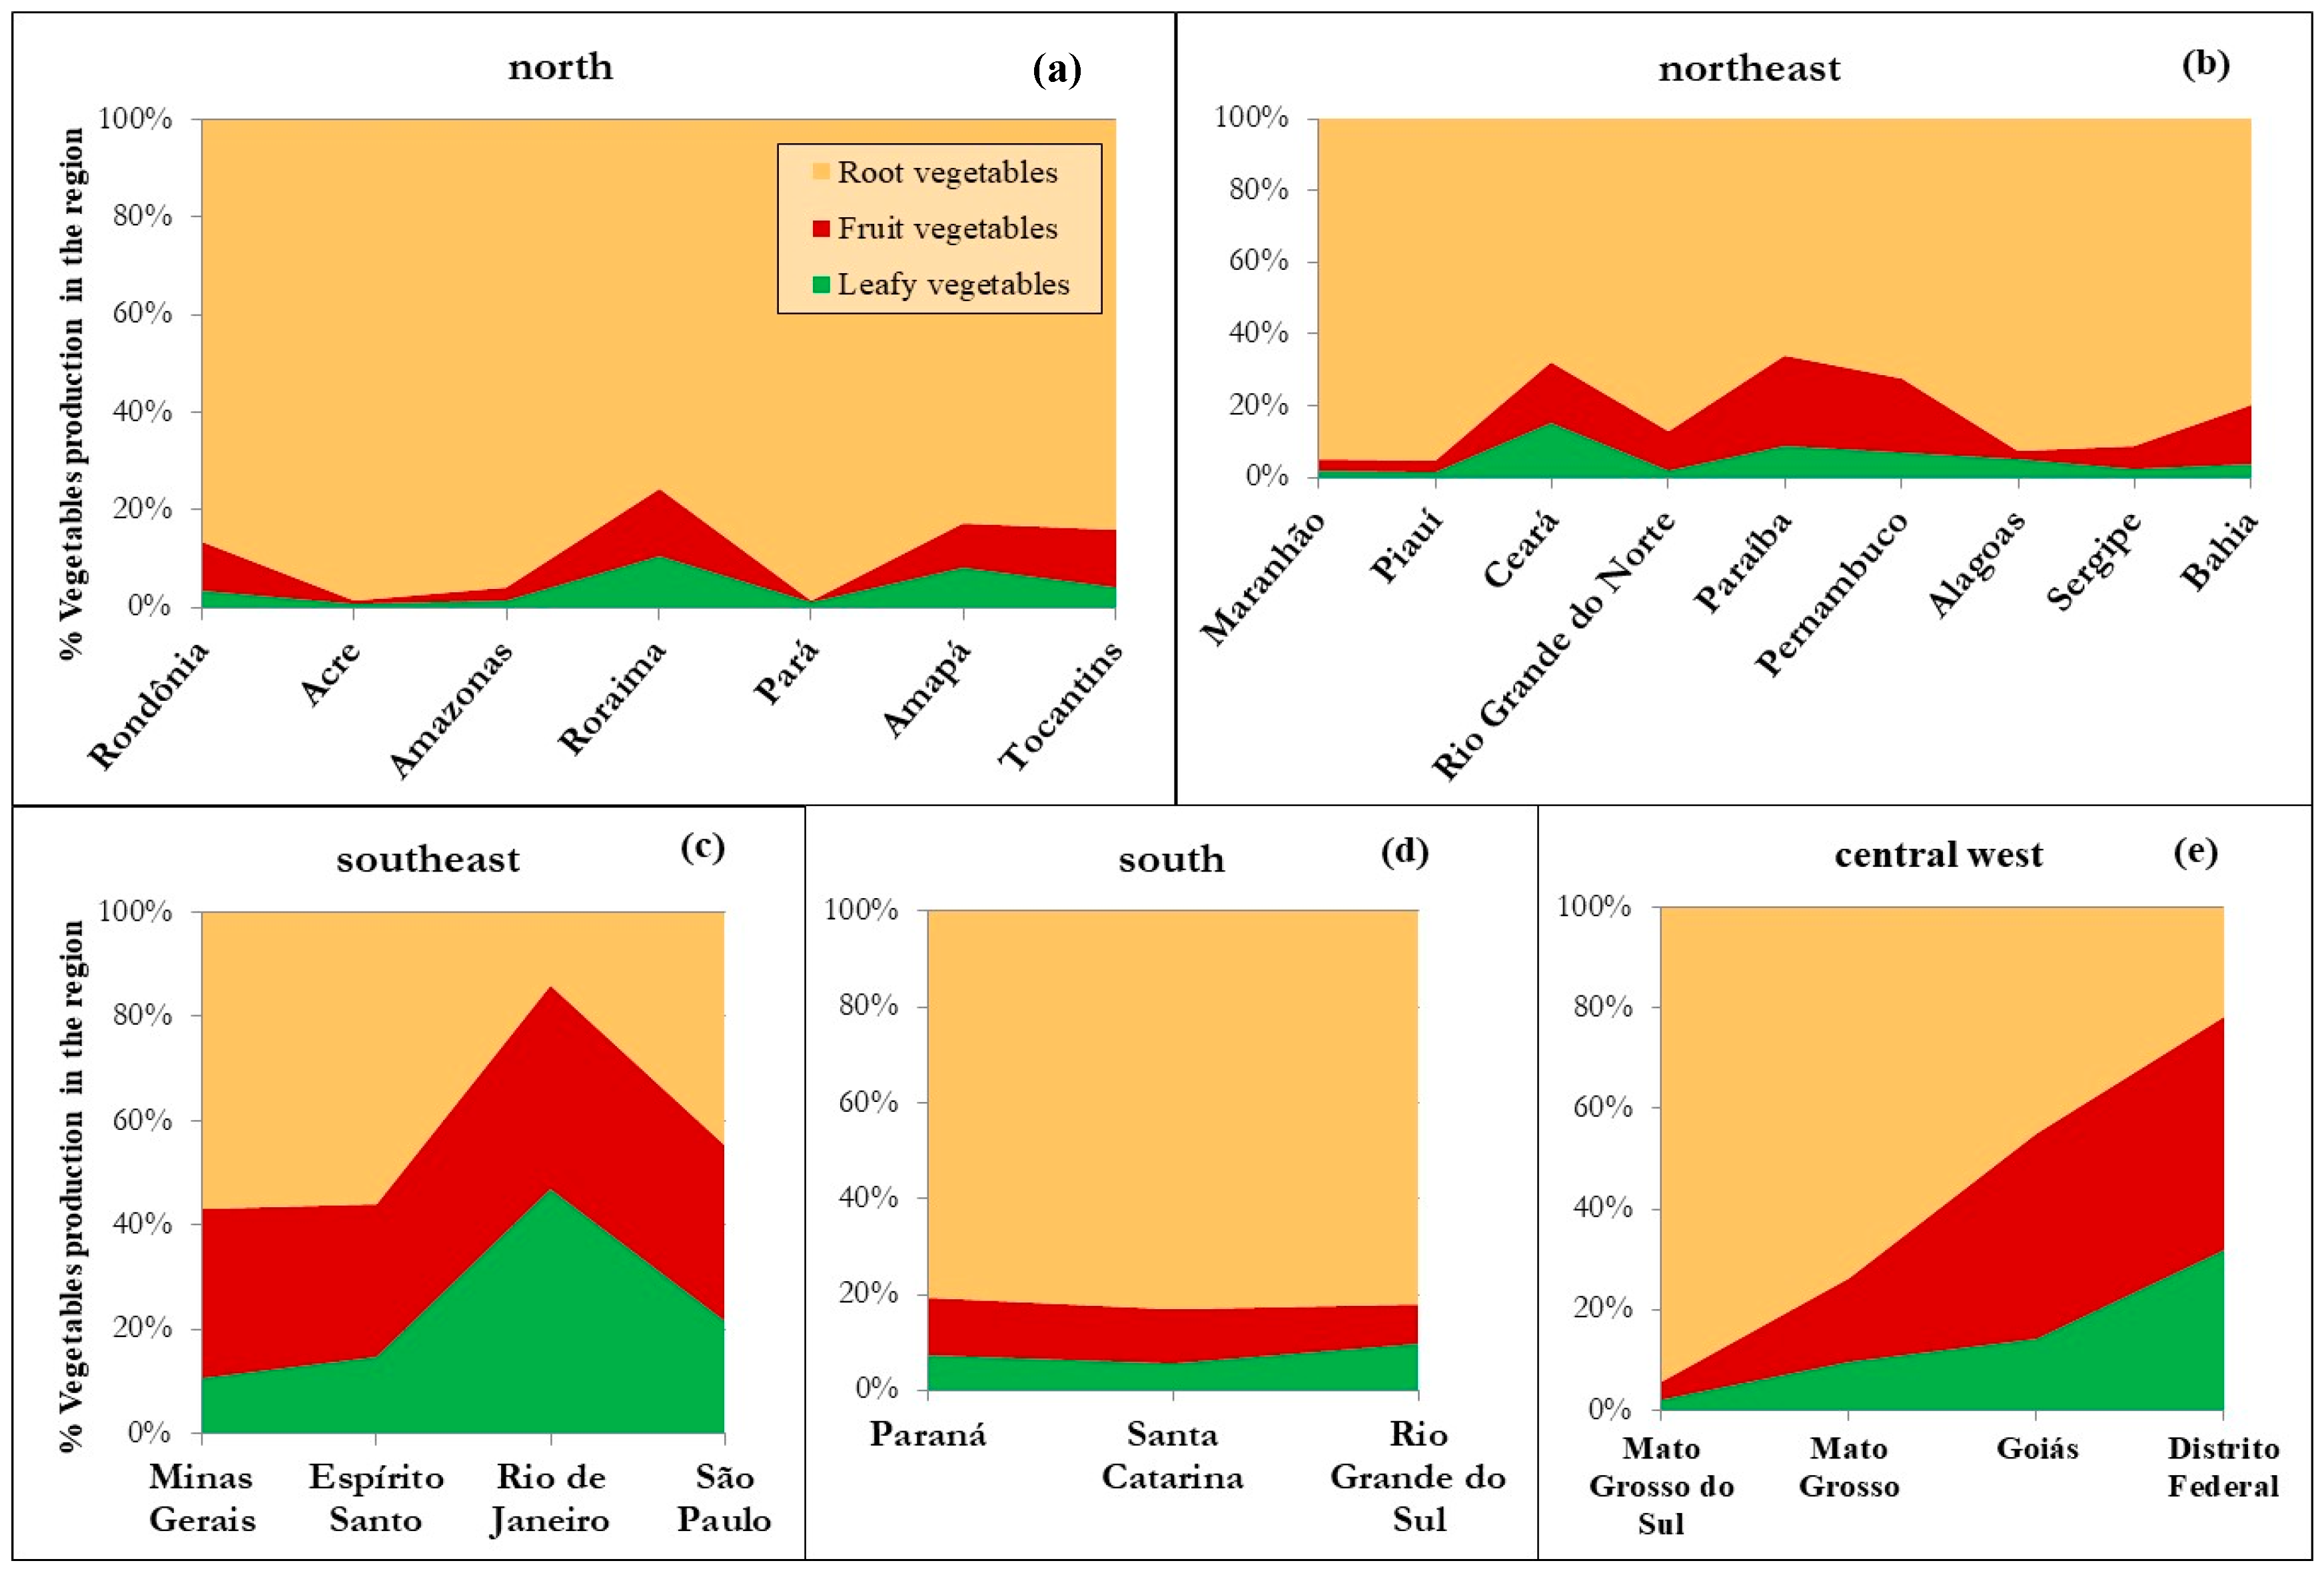
To extend this analysis, we used quantitative data from the IBGE’s 2006 AgCS (presented here in relative values) on vegetable production by subgroup in the major regions of Brazil (
Figure 2a–e) to draw parallels between the spatial diversity of vegetable acquisition and production. The numbers were calculated based on AgCS data and reflect the amount produced in a given region, not taking into account internal or external production flows. The purpose of this comparison was to understand whether current vegetable production in Brazil could meet future demand based on WHO recommendations.
The larger amount of vegetables produced belong to the roots group, which accounts for about 40% of production in almost all the federated states. For leafy vegetables, the production share exceeds 20% only in Rio de Janeiro, São Paulo, and Distrito Federal states, corroborating their high technological and commercial profiles as leafy vegetable exporters to internal markets located elsewhere. In the northern and northeastern regions, just a few states contribute more than 10% of total vegetable production. In these, demand in nearby markets with higher population densities in urban areas explains higher production. In the northern regions, higher leafy vegetable production, for instance in Amapá and Roraima where local markets are poor due to low population density, is made possible by climatic conditions that are much more favorable than those in large cities as Manaus and Belém; production is therefore likely to serve regional markets with higher income per capita.
The highest amount of leafy vegetable production and acquisition in Brazil was in Rio Grande do Sul. In the southeast, there is more balanced production between the three groups of vegetables. This balance in production is also observed in Goiás and Distrito Federal states in the central west. However, even with better vegetable availability, current acquisition levels are still far from WHO’s daily recommendations. In the north and northeast, the production of fruit vegetables is centered in a few states such as Roraima, Amapá, Tocantins, Ceará, Paraíba, and Pernambuco; like the trends in leafy vegetable production, this can be linked to their proximity to local or regional markets located in urban areas.
The average per capita amount of vegetables produced in major regions in 2006 is presented in
Table 1. The southern region, which presented the highest acquisition, had a total production of 432 g/capita/day in 2006. The northern region, considered less privileged in terms of access to vegetables, presented a total production availability of 673 g/capita/day, of which more than 97% was cassava production. The southeastern region is the top producer of leafy vegetables and fruit vegetables, presenting the highest amount of leafy vegetables production (38 g/capita/day), and a total vegetable production of 177 g/capita/day for the studied period, though still less than the 400 g recommended by WHO.
If we assume that the supply systems are able to evenly distribute the production indicated in the AgCS, Brazil would have an average availability of 348 g/capita/day, which is more than the amount of vegetable recommendation (keeping in mind that in this study fruits were not included in our calculations, only fruit vegetables—that is, the fruits/flowers/seeds of plants classified as vegetables). However, average production for each vegetable group is still disproportionate, and affects mostly leaf and fruit vegetable acquisition per capita, indicating a need to promote consumption and intensify production.
3.3. Vegetable Demand Density Maps for 2008 and 2030
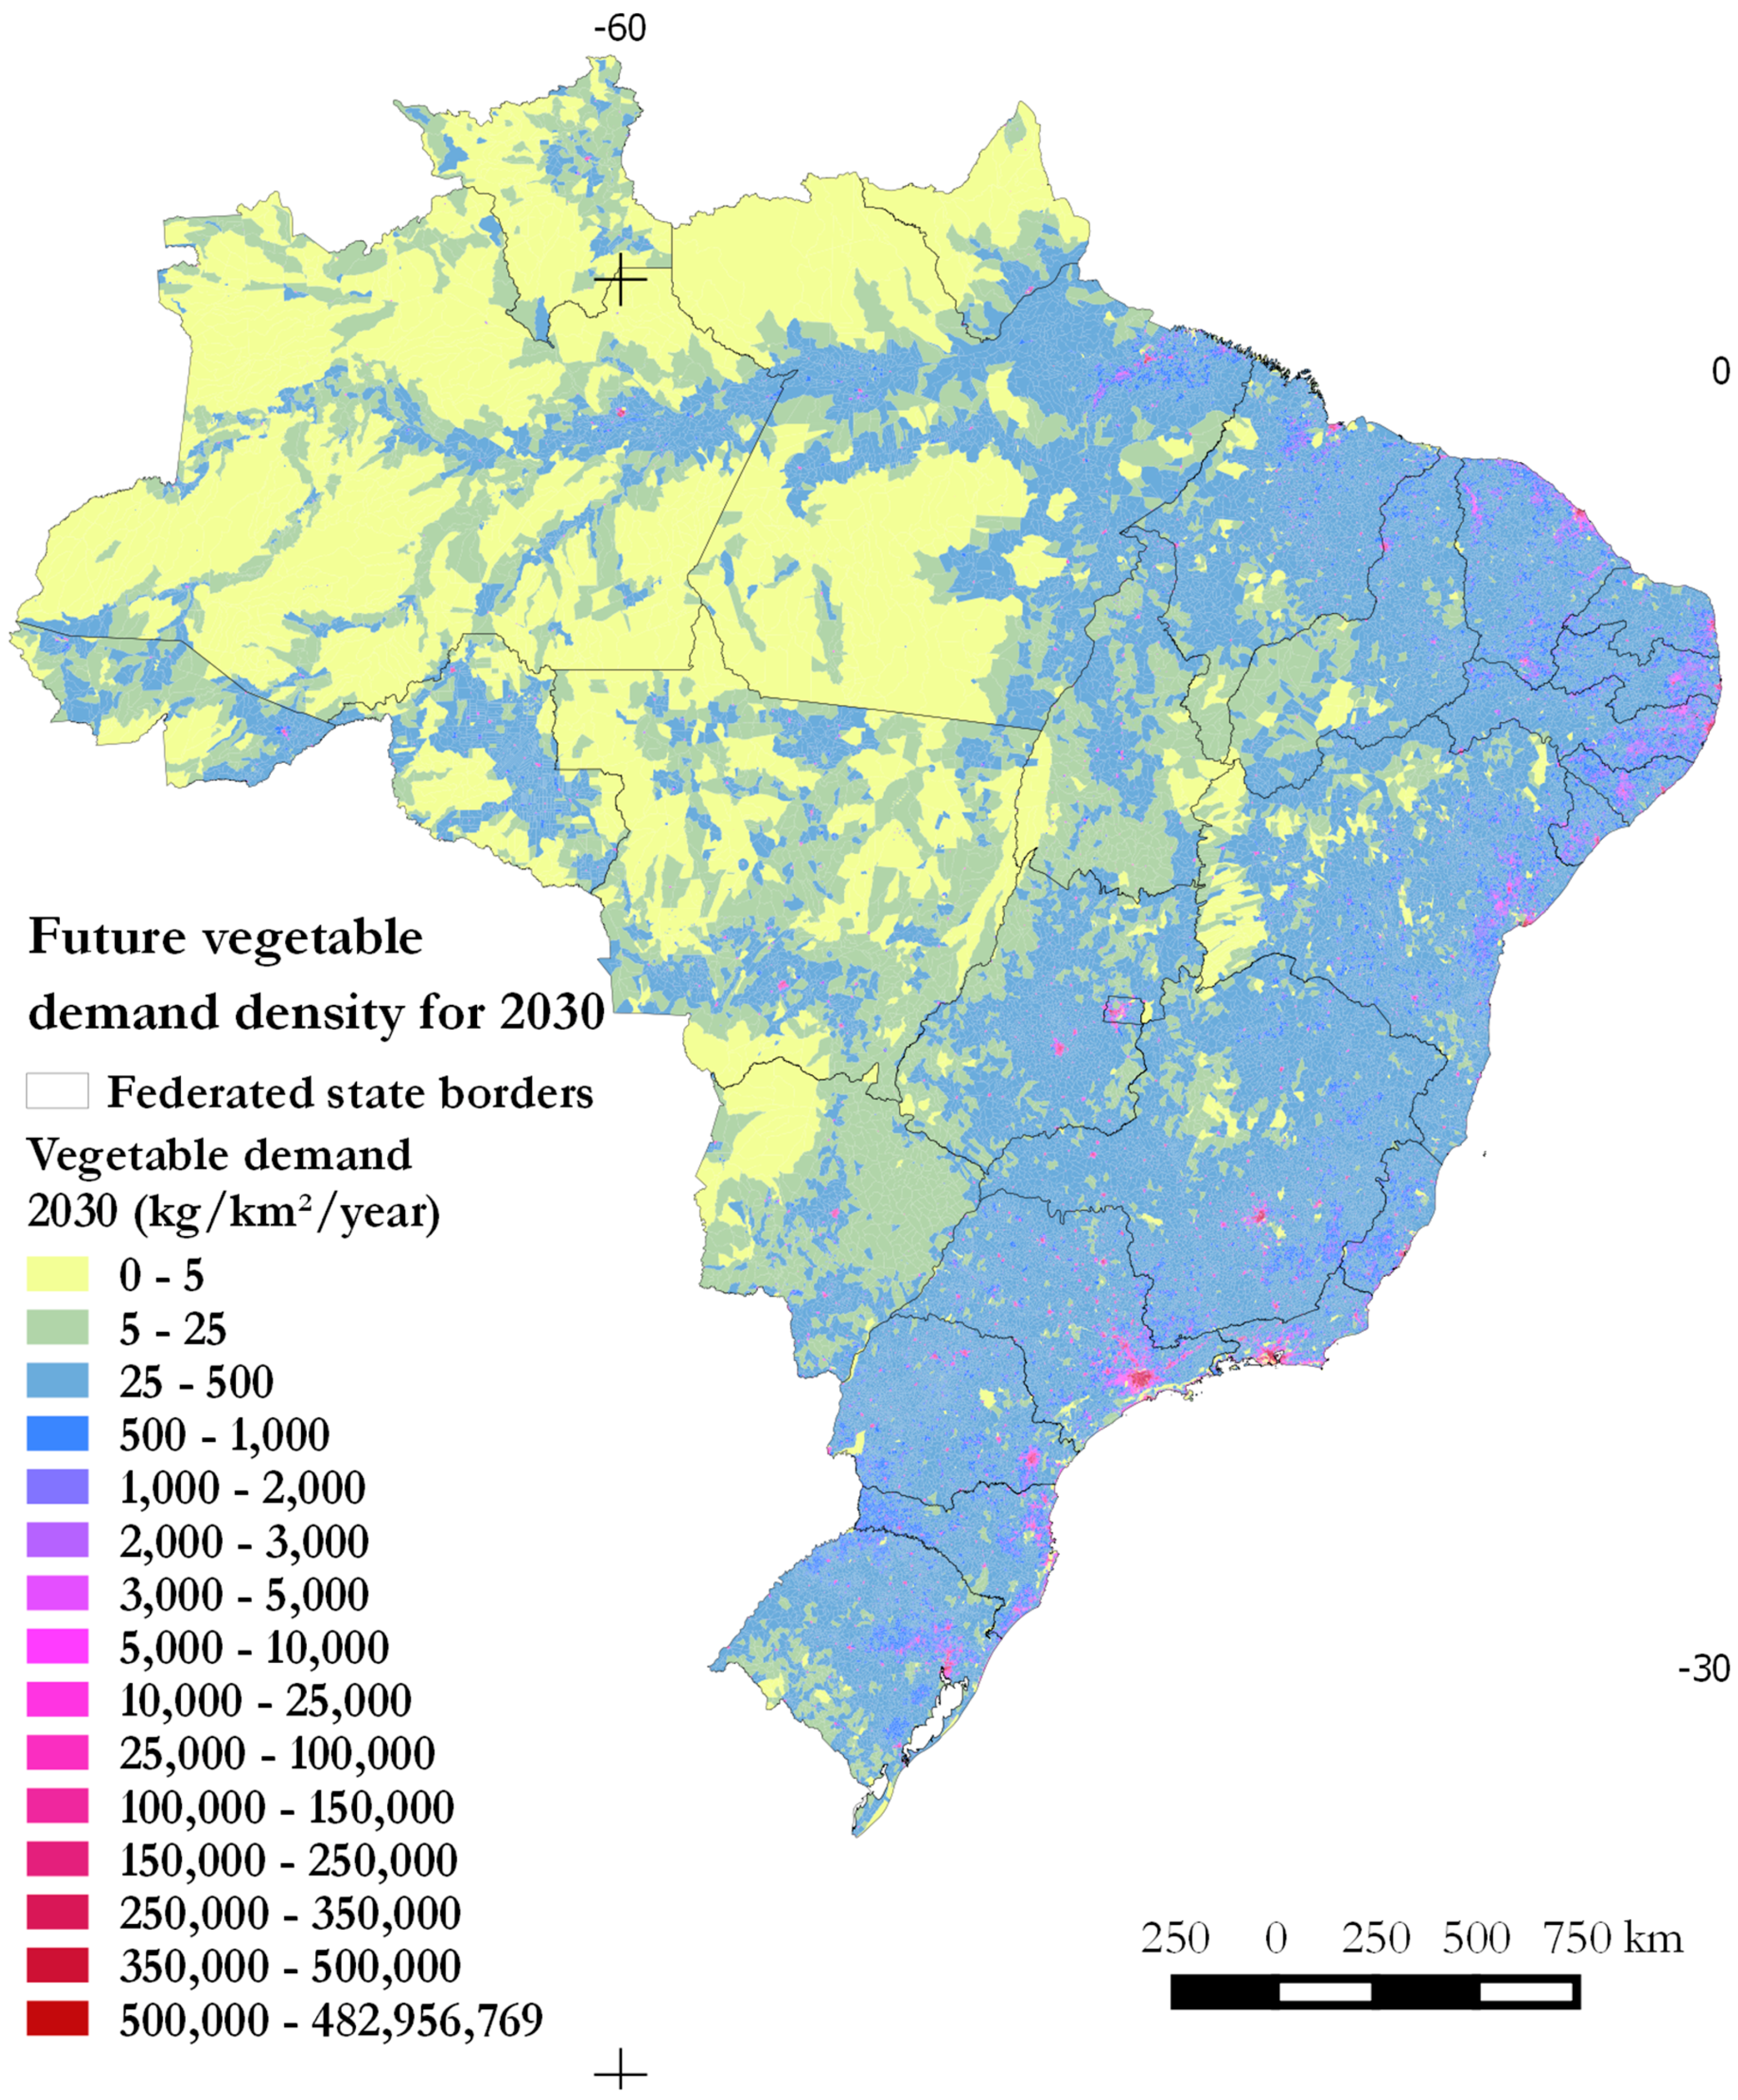
The vegetable demand density maps generated for 2008 and 2030 are shown in
Figure 3 and
Figure 4; they provide the values of vegetable acquisition within the census tracts by km
2/year. Their comparison shows significantly increased demand within northern and northeastern states, particularly in urban areas in the northeast, and along rivers and major transport routes in the north. An increase in demand is also observed in the central west region, but significant changes in spatial pattern between 2008 and 2030 are more concentrated in the central part of Mato Grosso do Sul and central north of Mato Grosso, where monoculture has taken over pasture and forest land in the last 15 years. Intensified overall demand in urban centers and metropolitan areas for 2030 is projected mainly in the southeast, though the states of Espírito Santo and Goiás also show significantly increased demand for vegetables in rural areas. In the south, demand increases occur mostly in urban areas, but a clear pattern in that region is decreased demand in the extreme south of Rio Grande do Sul and the western states of Santa Catarina and Paraná.
Increased demand for fruit vegetables is more spatially homogeneous in urban centers and surrounding areas in almost all regions, with a localized expansion along the main rivers and roads in Amazonas, Acre, Roraima, and Mato Grosso and the coastal areas of Ceará, Rio Grande do Norte, Pernambuco, and Paraiba. Decreased demand is observed in the Brazilian semiarid region, but without a discernible pattern. In the south, like demand for leafy vegetables, significant decreases in demand for fruits are observed, especially in Rio Grande do Sul.
The demand for roots has increased in the northern and northeastern regions, especially in rural areas alongside the major routes of human occupation. Demand increases especially in the northeastern rural areas and in the semiarid portions of Bahia, Piauí, Maranhão, Pernambuco, Paraiba, Rio Grande do Norte, and Ceará. In the southeast, demand increases significantly in the north and southeast of Minas Gerais and west of São Paulo. In the central west, demand increases in rural areas and small towns surrounding Goiás, near the capital Goiania. The decreased demand for roots in southern Rio Grande do Sul, western Santa Catarina, and Paraná determined the changing pattern of total demand for vegetables in those states.
Although the 2008 demand density map indicates differences between Brazil’s major regions, the future demand density map tends to standardize the acquisitions of the different vegetables. This can be considered a limitation of our method, as it considers the variation of acquisitions only based on population projection. Analysis of demand variation would be more complete, although more complex and uncertain, if other aspects of spatial dynamics were considered, such as increasing agricultural projects, improvement of roads and access roads, growth of ecotourism, etc. Nevertheless, since our approach takes into account geopolitics and is spatially coherent, the demand density map obtained for 2030 can be used in the evaluation and policy planning for future scenarios of vegetable production and consumption in Brazil.
The results in
Table 1 indicate that there is a great difference between vegetable production specified in the 2006 AgrCS, the population’s acquisition of these foods, and the results of our vegetable demand density maps calculated based on HBS and population census data. Simply put,
Table 1 indicates that production is much higher than consumption. The surplus could be due to exports (not analyzed in this work), but some part may also be accounted for by non-home consumption (restaurants, industrial kitchens, school meals, etc.), food distributed among other production allocations (processed food industry or animal consumption), loss due to transportation, logistics, or poor storage, or even consumer rejection in the market because of price or food preferences. For leafy vegetables, 2006 AgCS data indicate a production of 22.75 g/capita/day, while demand stood at 9.18 g/capita/day. Because leafy vegetables are highly perishable and hardly exported, the difference between these values may actually indicate losses in the marketing process. However, one must also consider the limitations of HBS data in capturing the food choices of the inhabitants of remote areas away from large urban centers. These limitations cannot be circumvented easily, but if better known, can facilitate better interpretation of results.
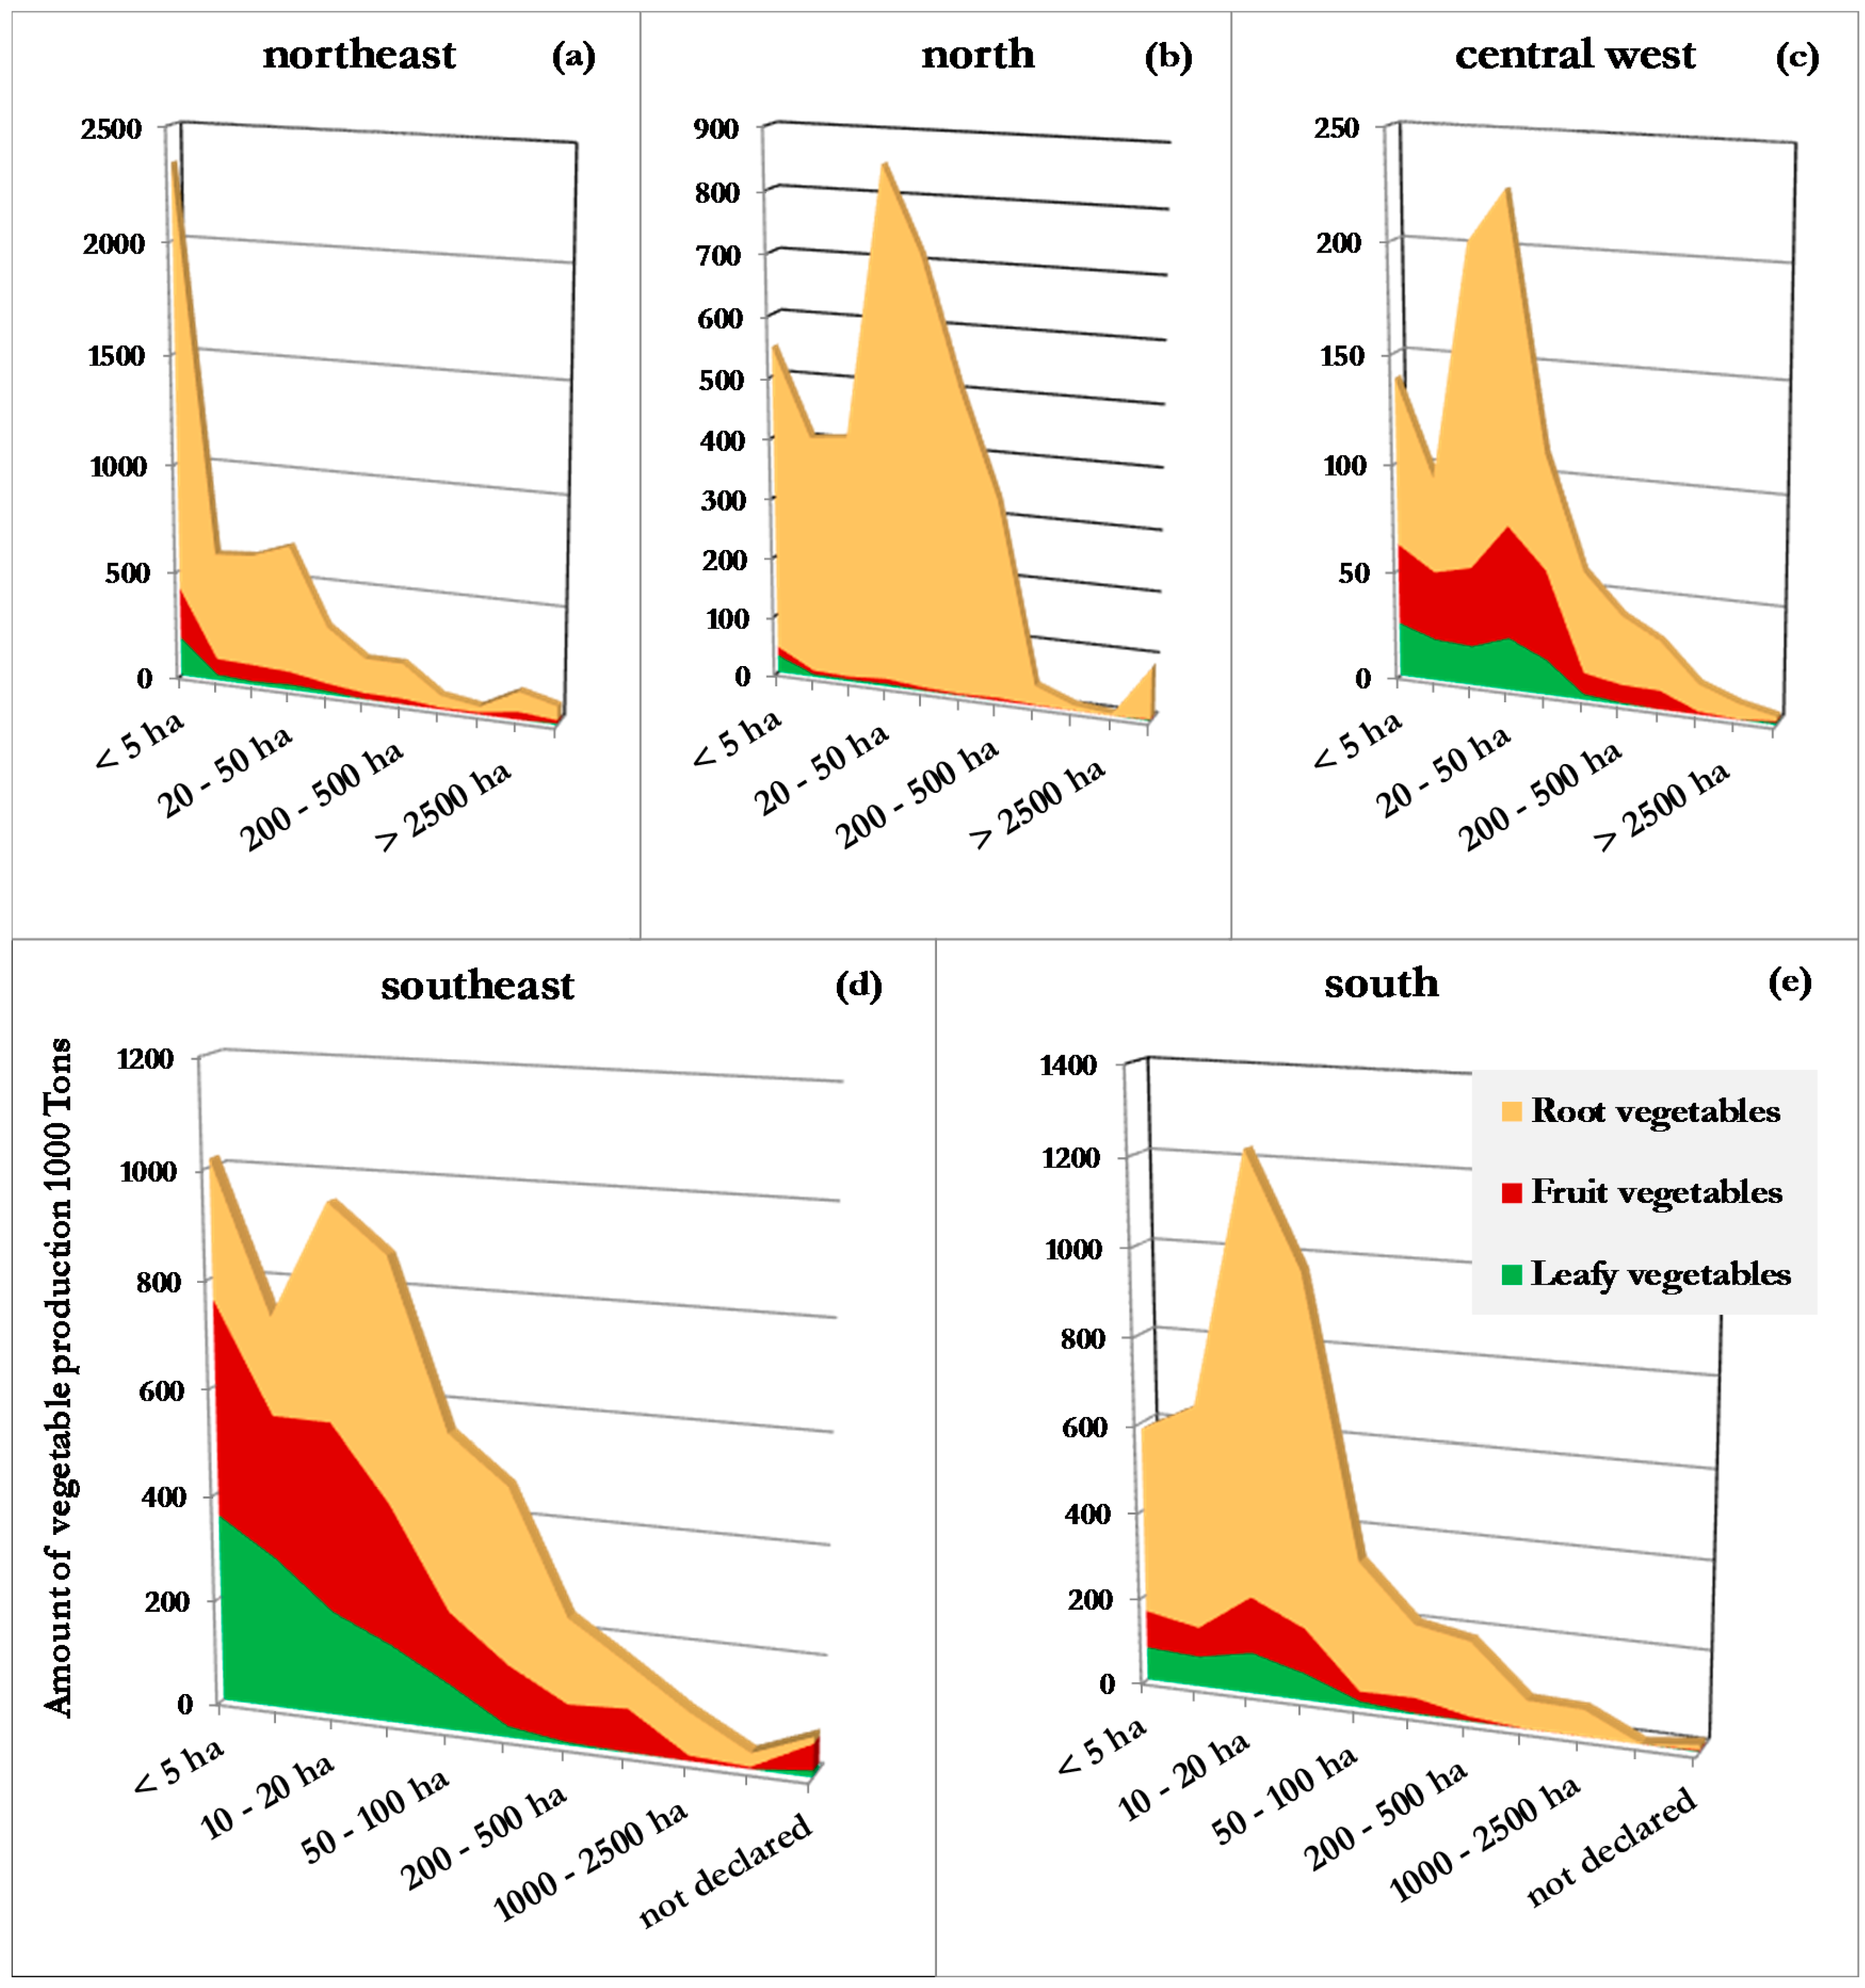
3.4. The Role of Small Farming in Vegetable Production
Evaluating the need to increase or intensify national vegetable production requires consideration of the profile of producers currently responsible for domestic food provision. It is estimated that smallholders and family farmers are responsible for about 70% of the food consumed in the country [
48,
49,
50]. Analyzing 2006 AgCS data on the distribution of vegetable-producing properties and the amount of vegetables typically produced, according to the producer's land tenure status, we found that even producers who are classified as landless farmers contribute significantly to vegetable production, especially cassava, despite their lower stability, security, and access to financial resources.
Figure 5a–e shows that the vast majority of vegetables in all three categories were produced in properties with size ranges smaller than 100 hectares. This applies to all major regions of Brazil. In the current commodities-oriented economic model, price volatility exposes the fragility of national food systems. That smallholders are responsible for most fresh food availability is both worrisome and challenging, as their fragility reveals the need to reinforce successful policies of food security and land reform that have lost pace under political crisis. The economic and climatic fragilities of food production, added to the remaining 5% prevalence of the undernourished, sets the perfect scenario for future accentuated risk of hunger and high levels of food insecurity, since the lack of technical assistance or financial support to the majority of small farmers after their first years of establishment is a long lasting policy shortcoming. Changes in the market structure could benefit small farmers, but market regulations are needed to avoid price manipulation by larger producers, and the end of informal selling at the farm gate to intermediaries who end up holding most of profits notwithstanding the labor input [
51,
52,
53].
Alternatively, changes in market structure could be an opportunity to invest in sustainable participative policies, such as participative agroforest and permaculture initiatives under community supported agriculture projects, which would represent win–win interactions between farmers and consumers with little required intervention from the state.
4. Discussion
According to the 2006 AgrCS data, average production reaches the WHO recommended 400 g/capita/day in the south and north. We recognize the limitations of using census data for building scenarios and performing such comparisons, since HBS values for the northern region were smaller due to current consumption population density patterns. The lack of available data on vegetable production flows limited our adoption of IBGE data on cropped area, crop revenues, and the amounts produced. Sales destination within and outside the country are not systematically surveyed at the national scale. Also, only broad estimates can be found on how much agricultural production is due to the food industry, sold in natura, or minimally processed by the population, hindering a more precise analysis. Nonetheless, the results do show that current and future demand for vegetable acquisition can be sufficient to achieve WHO’s recommendation of 400 g/day—fruits were not included which, when added, could exceed the recommended amounts; the amounts from the three groups of vegetable was not sufficient. Yet as the distribution of production among the three groups of vegetables is unbalanced, and so is demand, the message is clear: there is a need for specialized policies for both production and consumption, especially of leafy vegetables, to prioritize a more balanced and healthy diet.
Considering the pattern of decreasing demand and food acquisition in the countryside, together with the spatial concentration of demand in cities, one can make an obvious link to the methodology adopted population dynamics at the census tract level were the basis for determining variation in the demand for vegetable acquisition. However, there is an observed demographic pattern of decreasing population growth that has been occurring since the 1990s, especially in rural areas, as a consequence of structural changes in rural labor relationships and limited land availability. The historical factors of southern migration, together with the out-migration of landless itinerant farmers from the semiarid region towards agricultural frontiers like Cerrado and Amazon, are the bases to understanding the links among land cover changes for either food or commodity production. Even though large commodities like soybean and sugarcane are connected to large land availability for cheap, climatic, and logistically favorable conditions, vegetable production could be as land-consuming as soybean production—but it would require much better transportation logistics and the use of high technological production systems to adapt to different climate conditions that could affect the quality of crops and the path taken from farm to table. Therefore, large-scale land use conversion for less nutritious food (for example corn or wheat) or animal feeding/energy (soybean, sugarcane) commodities in Brazil differs from the land dynamics for vegetable production not only with regard to the amount of land required, but also in terms of the latter’s relative location, usually nearby cities.
Areas where vegetable production is much higher than consumption clearly indicate potential exporters, and are closely linked to commodity exports of fruits and vegetables. In these areas land speculation and technological improvement are more pronounced, and land cover changes tend to occur more intensively and more quickly. This is because the scenarios hint at where urban intensification has been high, not only in population numbers, but also in the buying power and cultural changing patterns favoring healthier food consumption.
Many issues linking land use and cover changes with food security were not possible to analyze in a spatially explicit way due to data and scale limitations. One example is the northeastern part of Pará, where the expansion of palm oil production has led to conversions of areas of family farming into cropped areas for oil production and bioenergy. Due to palm tree morphology and management, farmers were prevented from producing other crops, including subsistence crops, resulting in the loss of local biodiversity and leading farmers to change not only crops, but also food habits, increasing local food insecurity [
54]. Another example is western Bahia, where conflicts over land and the expansion of large-scale agriculture have hindered healthy eating through the loss of the biodiverse production typical of small-scale family farming [
55]. A necessary step forward for this research is the carrying out of analyses at the level of municipalities, in order to generate a more in-depth understanding of the dynamics of land use, the composition of local food systems, and the evolution of local consumption of vegetable and fruits.
5. Conclusions
The produced demand density maps indicate regional differences in vegetable demand by 2030 within Brazil’s major regions and reveal the regional capacities of land systems to reach the minimum amount needed to meet recommended dietary standards. Increased demand for more nutritious vegetables occurs both in urban and rural areas, especially in the northeast and northern regions of the country. In the central west, southern, and southeast regions there is an increase in urban centers and signs of reduction in inland areas close to urban centers. The results confirm that Brazilians do not consume enough vegetables for a nutritious and healthy diet. Preferences play a part, but so does lack of access for socioeconomic or logistical reasons, which can be influenced by land change processes.
Culture strongly influences food choices. Concern about healthy habits, including physical exercise and balanced diet, is recent and mainly driven by worries about diseases resulting from unbalanced diets and sedentary lifestyles. Vegetable consumption, especially a greater variety of leafy vegetables consumed in raw form, is a habit that is only in the process of developing in Brazil, where tradition still favors cooked vegetables. Lettuce, tomato, and onion are now common on Brazilians’ plates in urban areas, but the incorporation of new varieties, colors, and flavors is recent and weaker, influenced by the globalization of food habits and increased consumption away from home. These changes have not been incorporated into the daily habits of all strata of the population. Brazilians’ diets are gradually losing their traditional regional diversity, in step with internal migration towards cities and a corresponding rural exodus, increasing the consumption of processed foods with higher calories but low nutritional value and resulting in nutritional deficits and associated diseases.
Efforts to increase vegetable consumption in Brazil would benefit from further research and data on the production, distribution, and acquisition of food, including reasons for (a lack of) acquisition. Internationally, recommendations by scholars and governmental entities focus on encouraging local production to increase access to healthy foods. Yet production volumes and acquisition at the national or regional levels are insufficient considerations in themselves; environmental, cultural, political, and market factors must also be examined at multiple scales, from national to micro-regional levels. A paradigmatic national policy shift is urgent to better encourage production of a variety of vegetables rather than commodities for export; facilitate the adoption of sustainable practices and technologies that meet population needs without destroying the ecosystem services on which humans depend, including fertile soils, fresh water and stable climates; and ensure cultural changes that help rescue consumption of food forgotten by urban consumers, such as unconventional food plants (PANCs) naturally adapted to their areas of occurrence and not counted in the census surveys conducted in the country.
Stronger urban–rural links can benefit sustainable food production and decrease income inequality, as small farming becomes socially valuable and economically profitable. Strengthening rural policies and the social valuation of more nutritious food production is the right path to land conservation and fair food access near flourishing cities, where cultural changes are gradually being driven by smart market strategies able to identify consumers demanding better quality food, and therefore creating space for more vegetable production.


