What’s (Not) on the Map: Landscape Features from Participatory Sketch Mapping Differ from Local Categories Used in Language

Abstract
:1. Introduction
- What landscape categories do individuals choose to represent on sketch maps and how do they go about doing so?
- To what extent do the categories captured by sketch mapping differ from landscape categories used in language?
2. Background
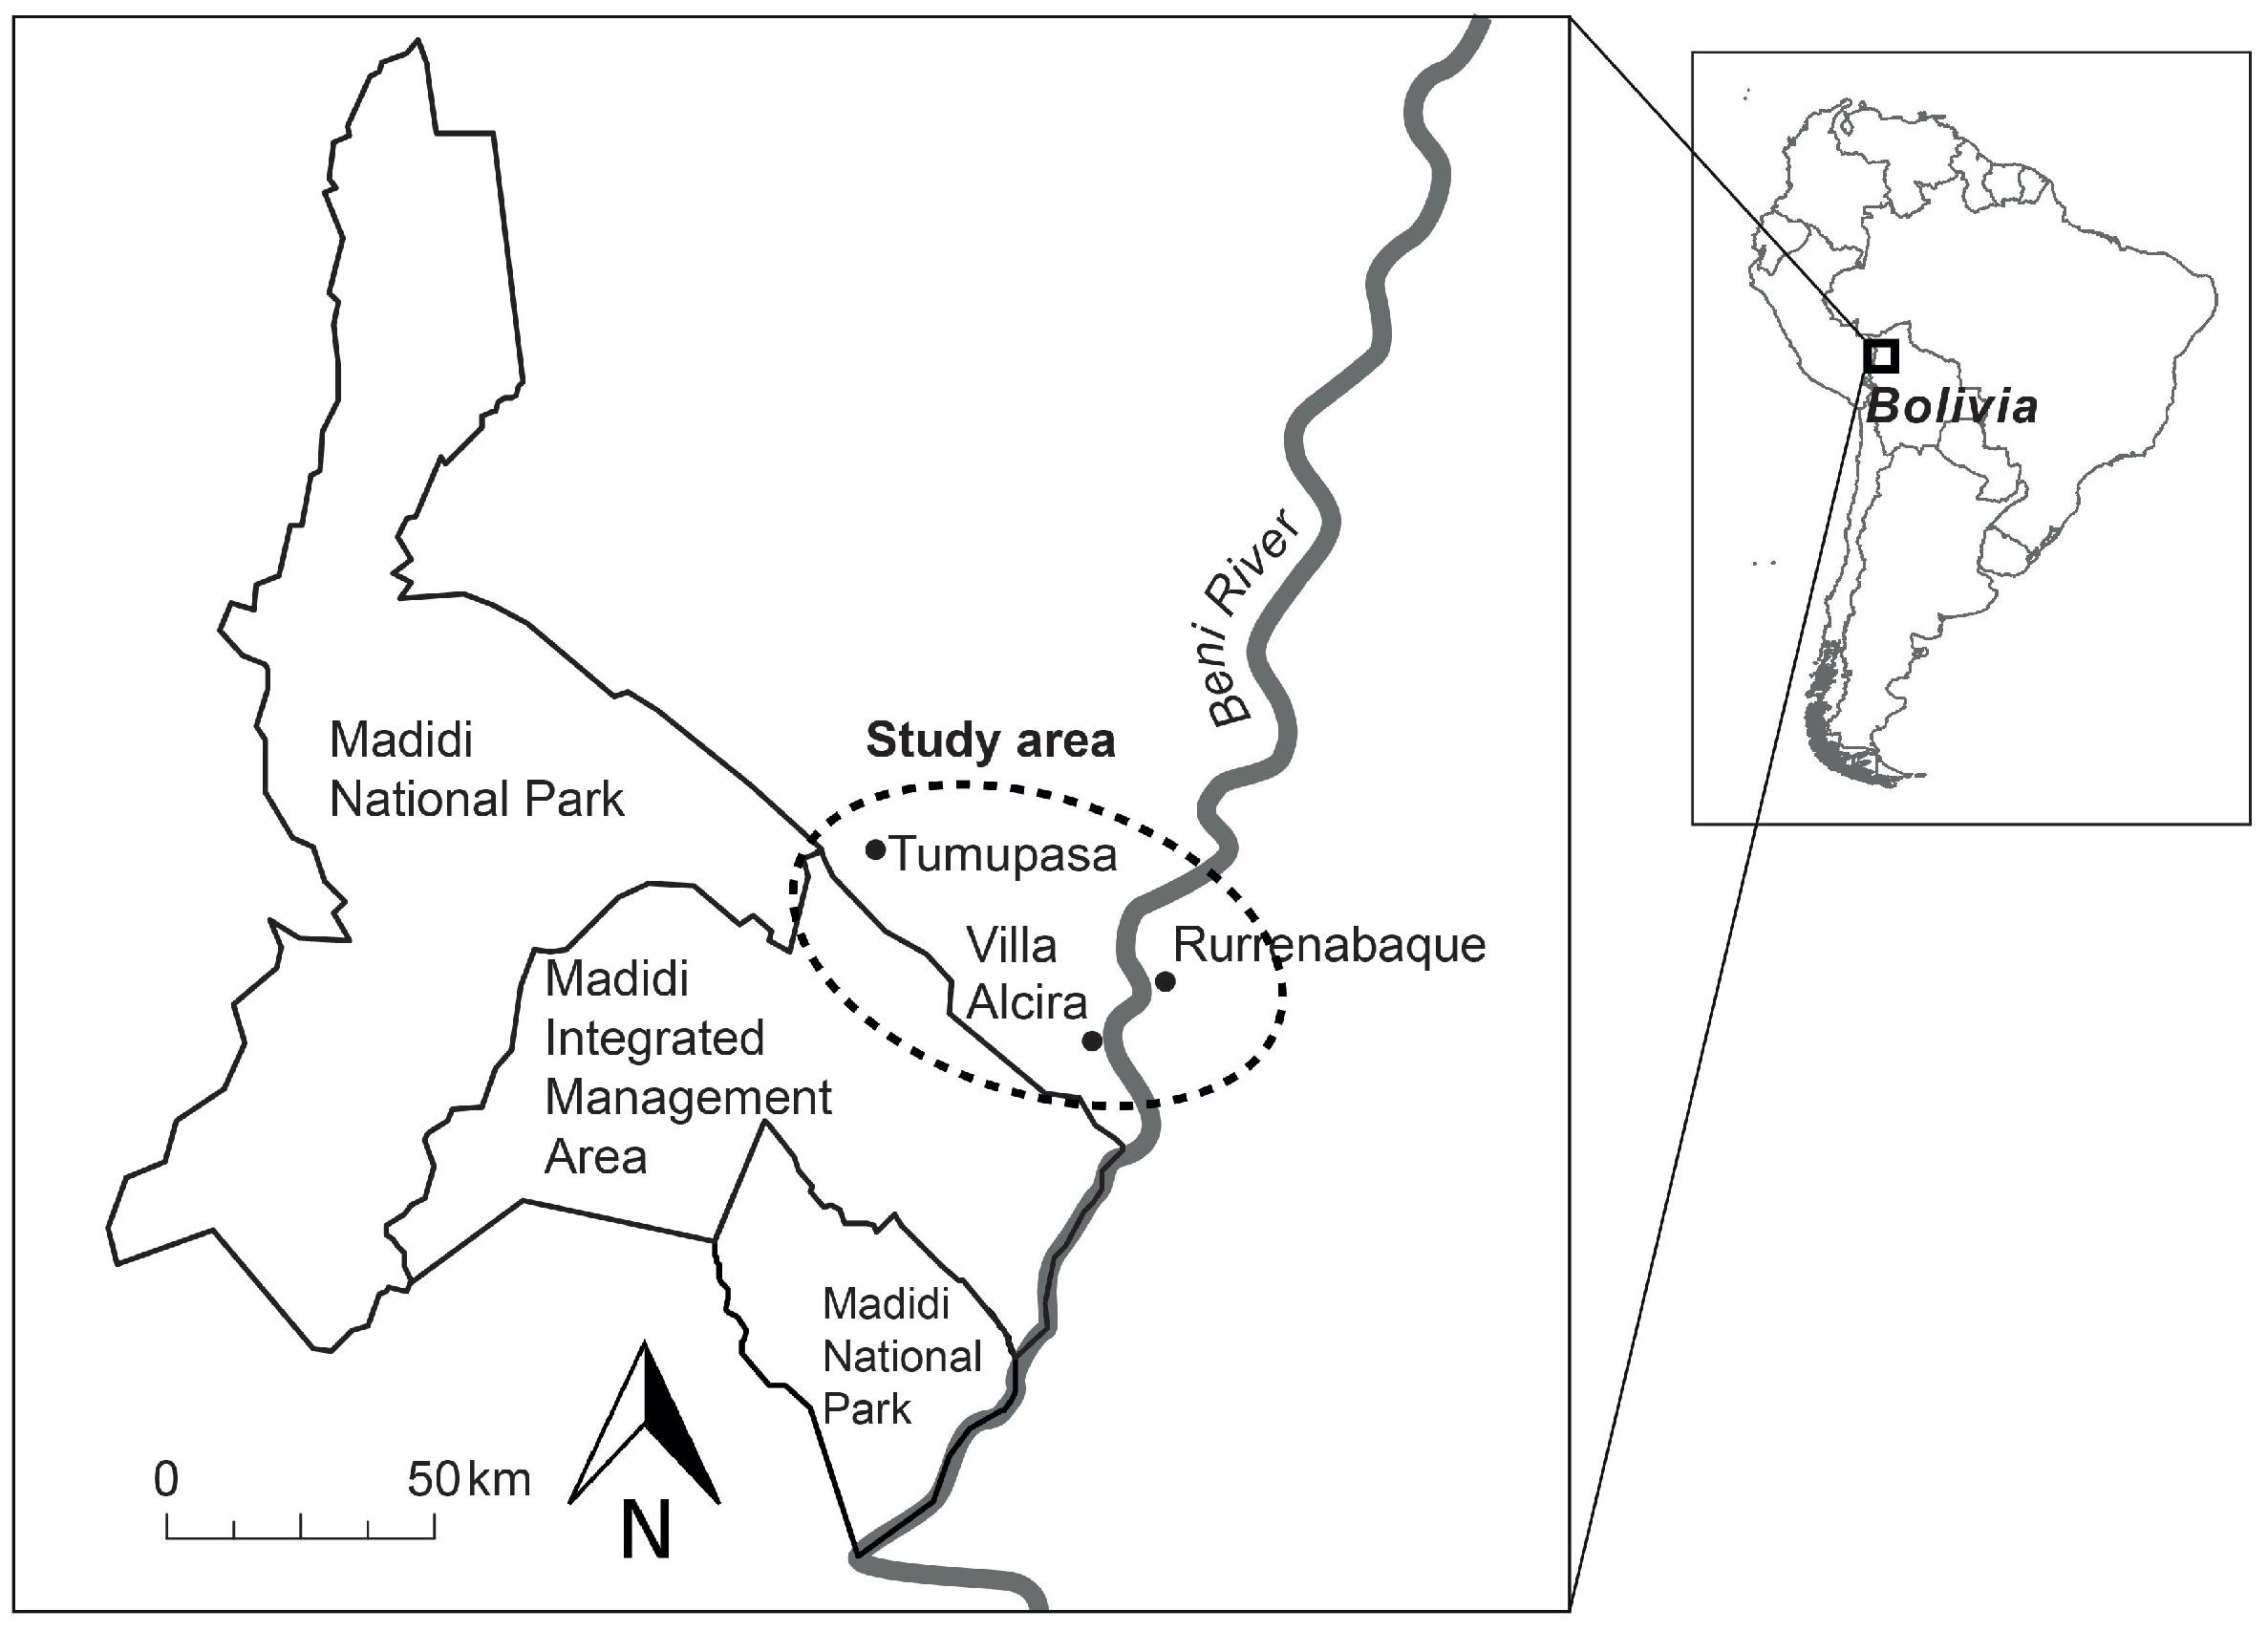
3. Study Area
4. Methodology
4.1. Sketch Mapping with Local Participants
4.2. Eliciting Ethnoecological Landscape Categories through Field Walks and Interviews
5. Results
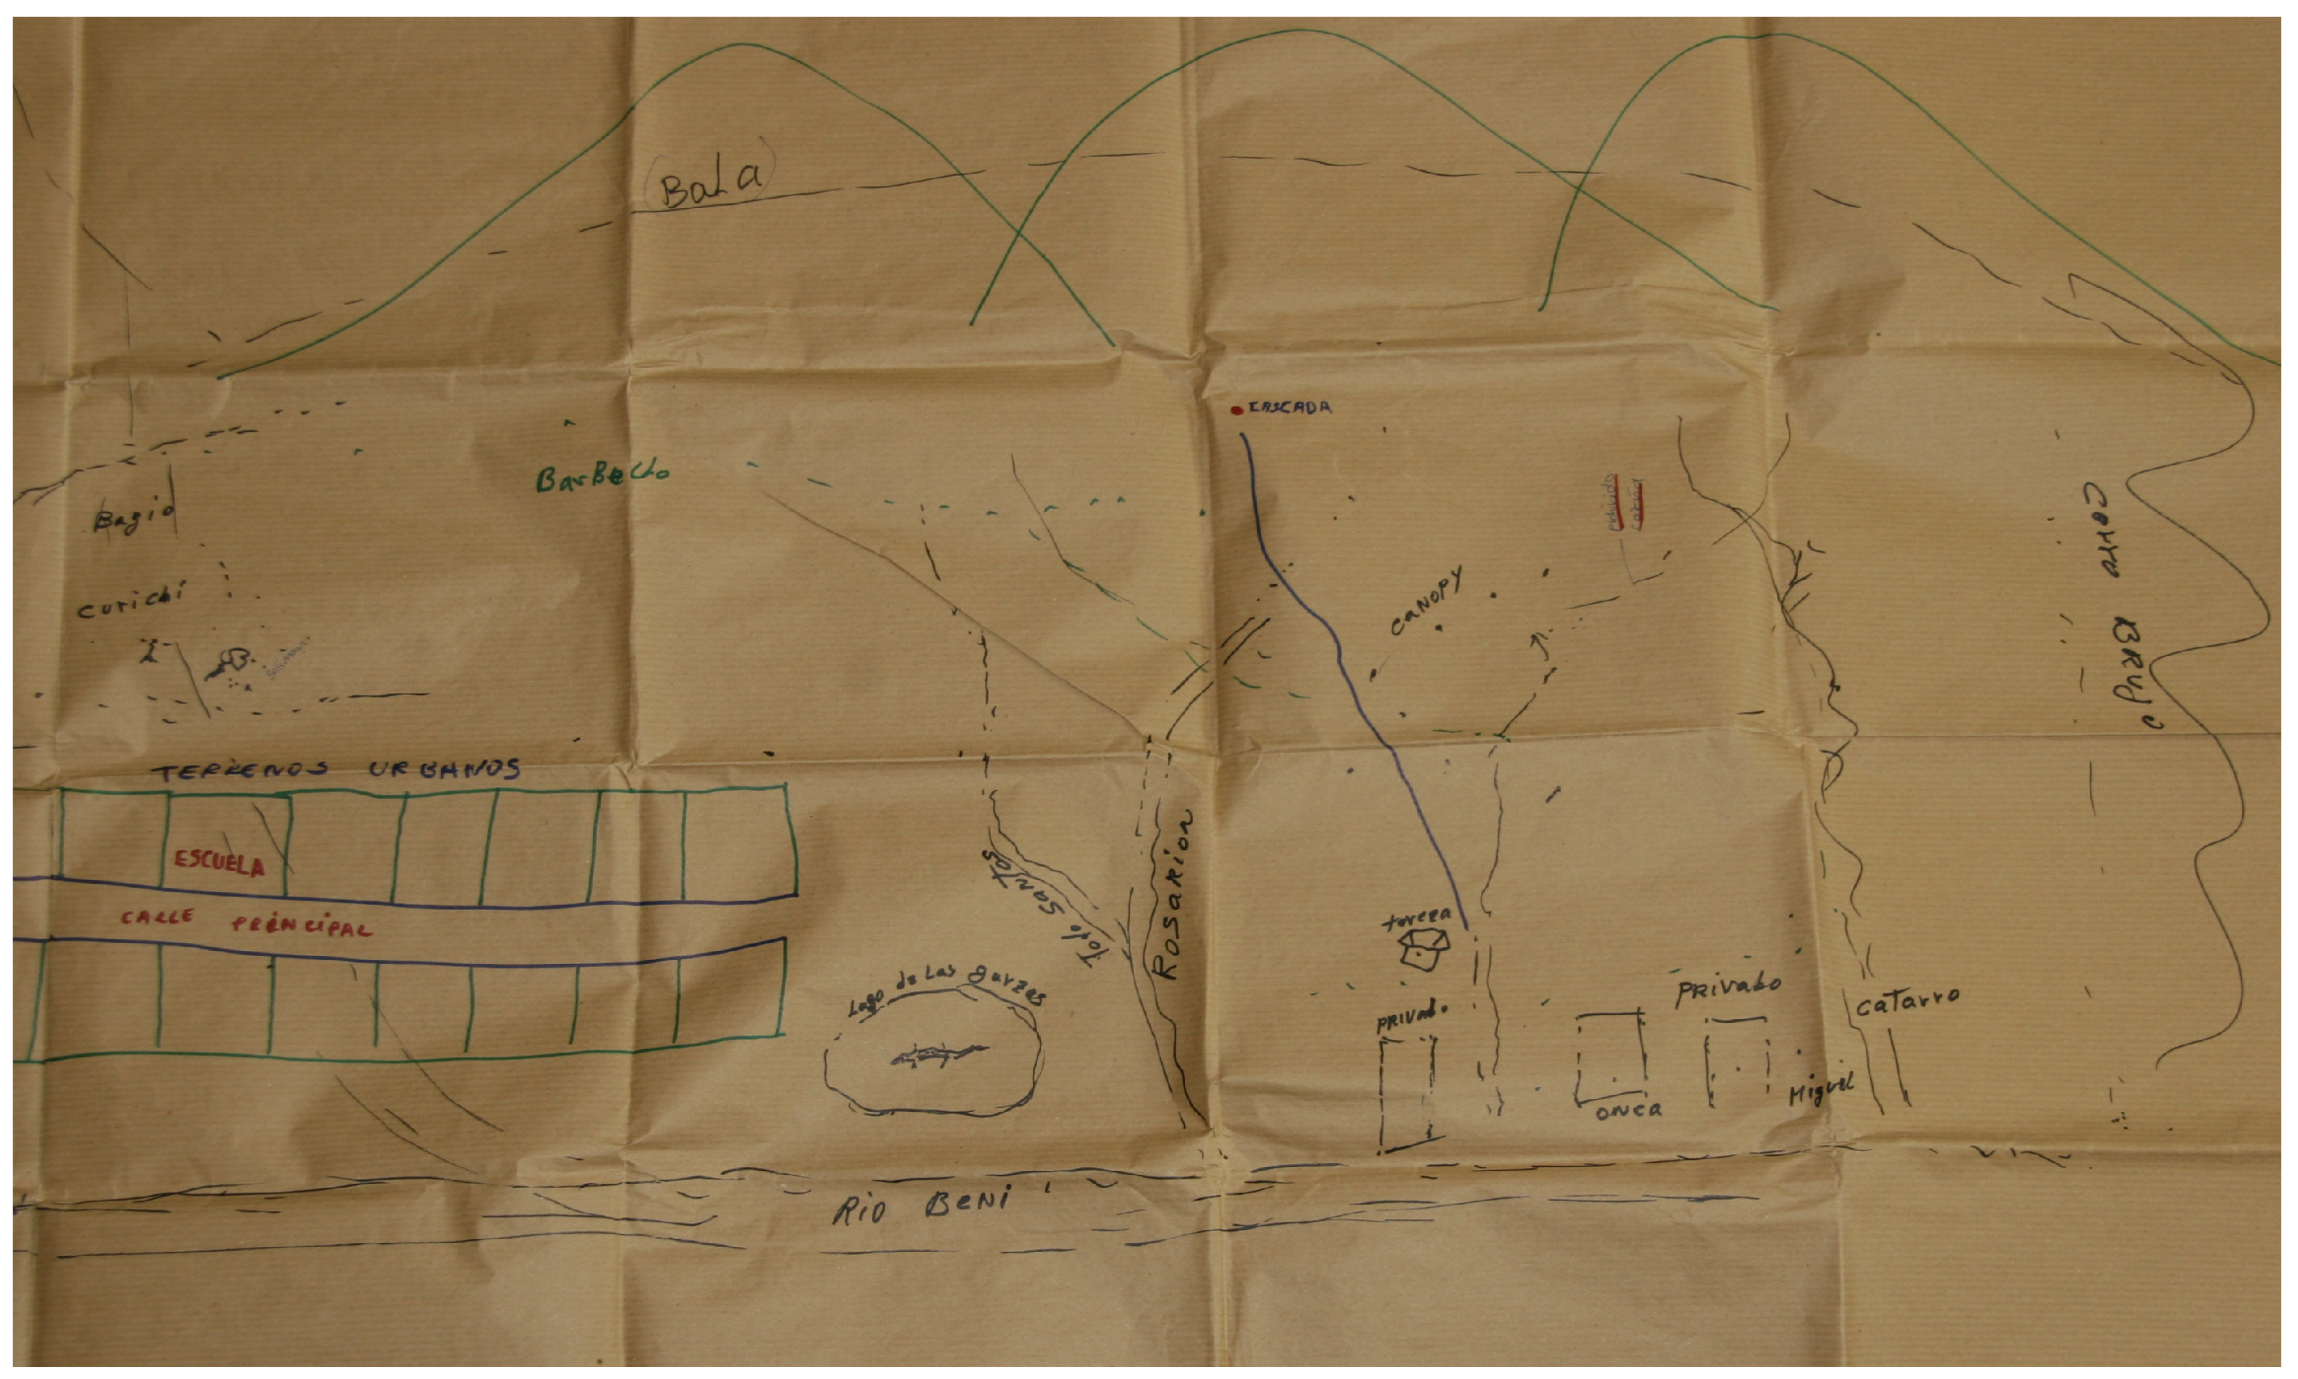
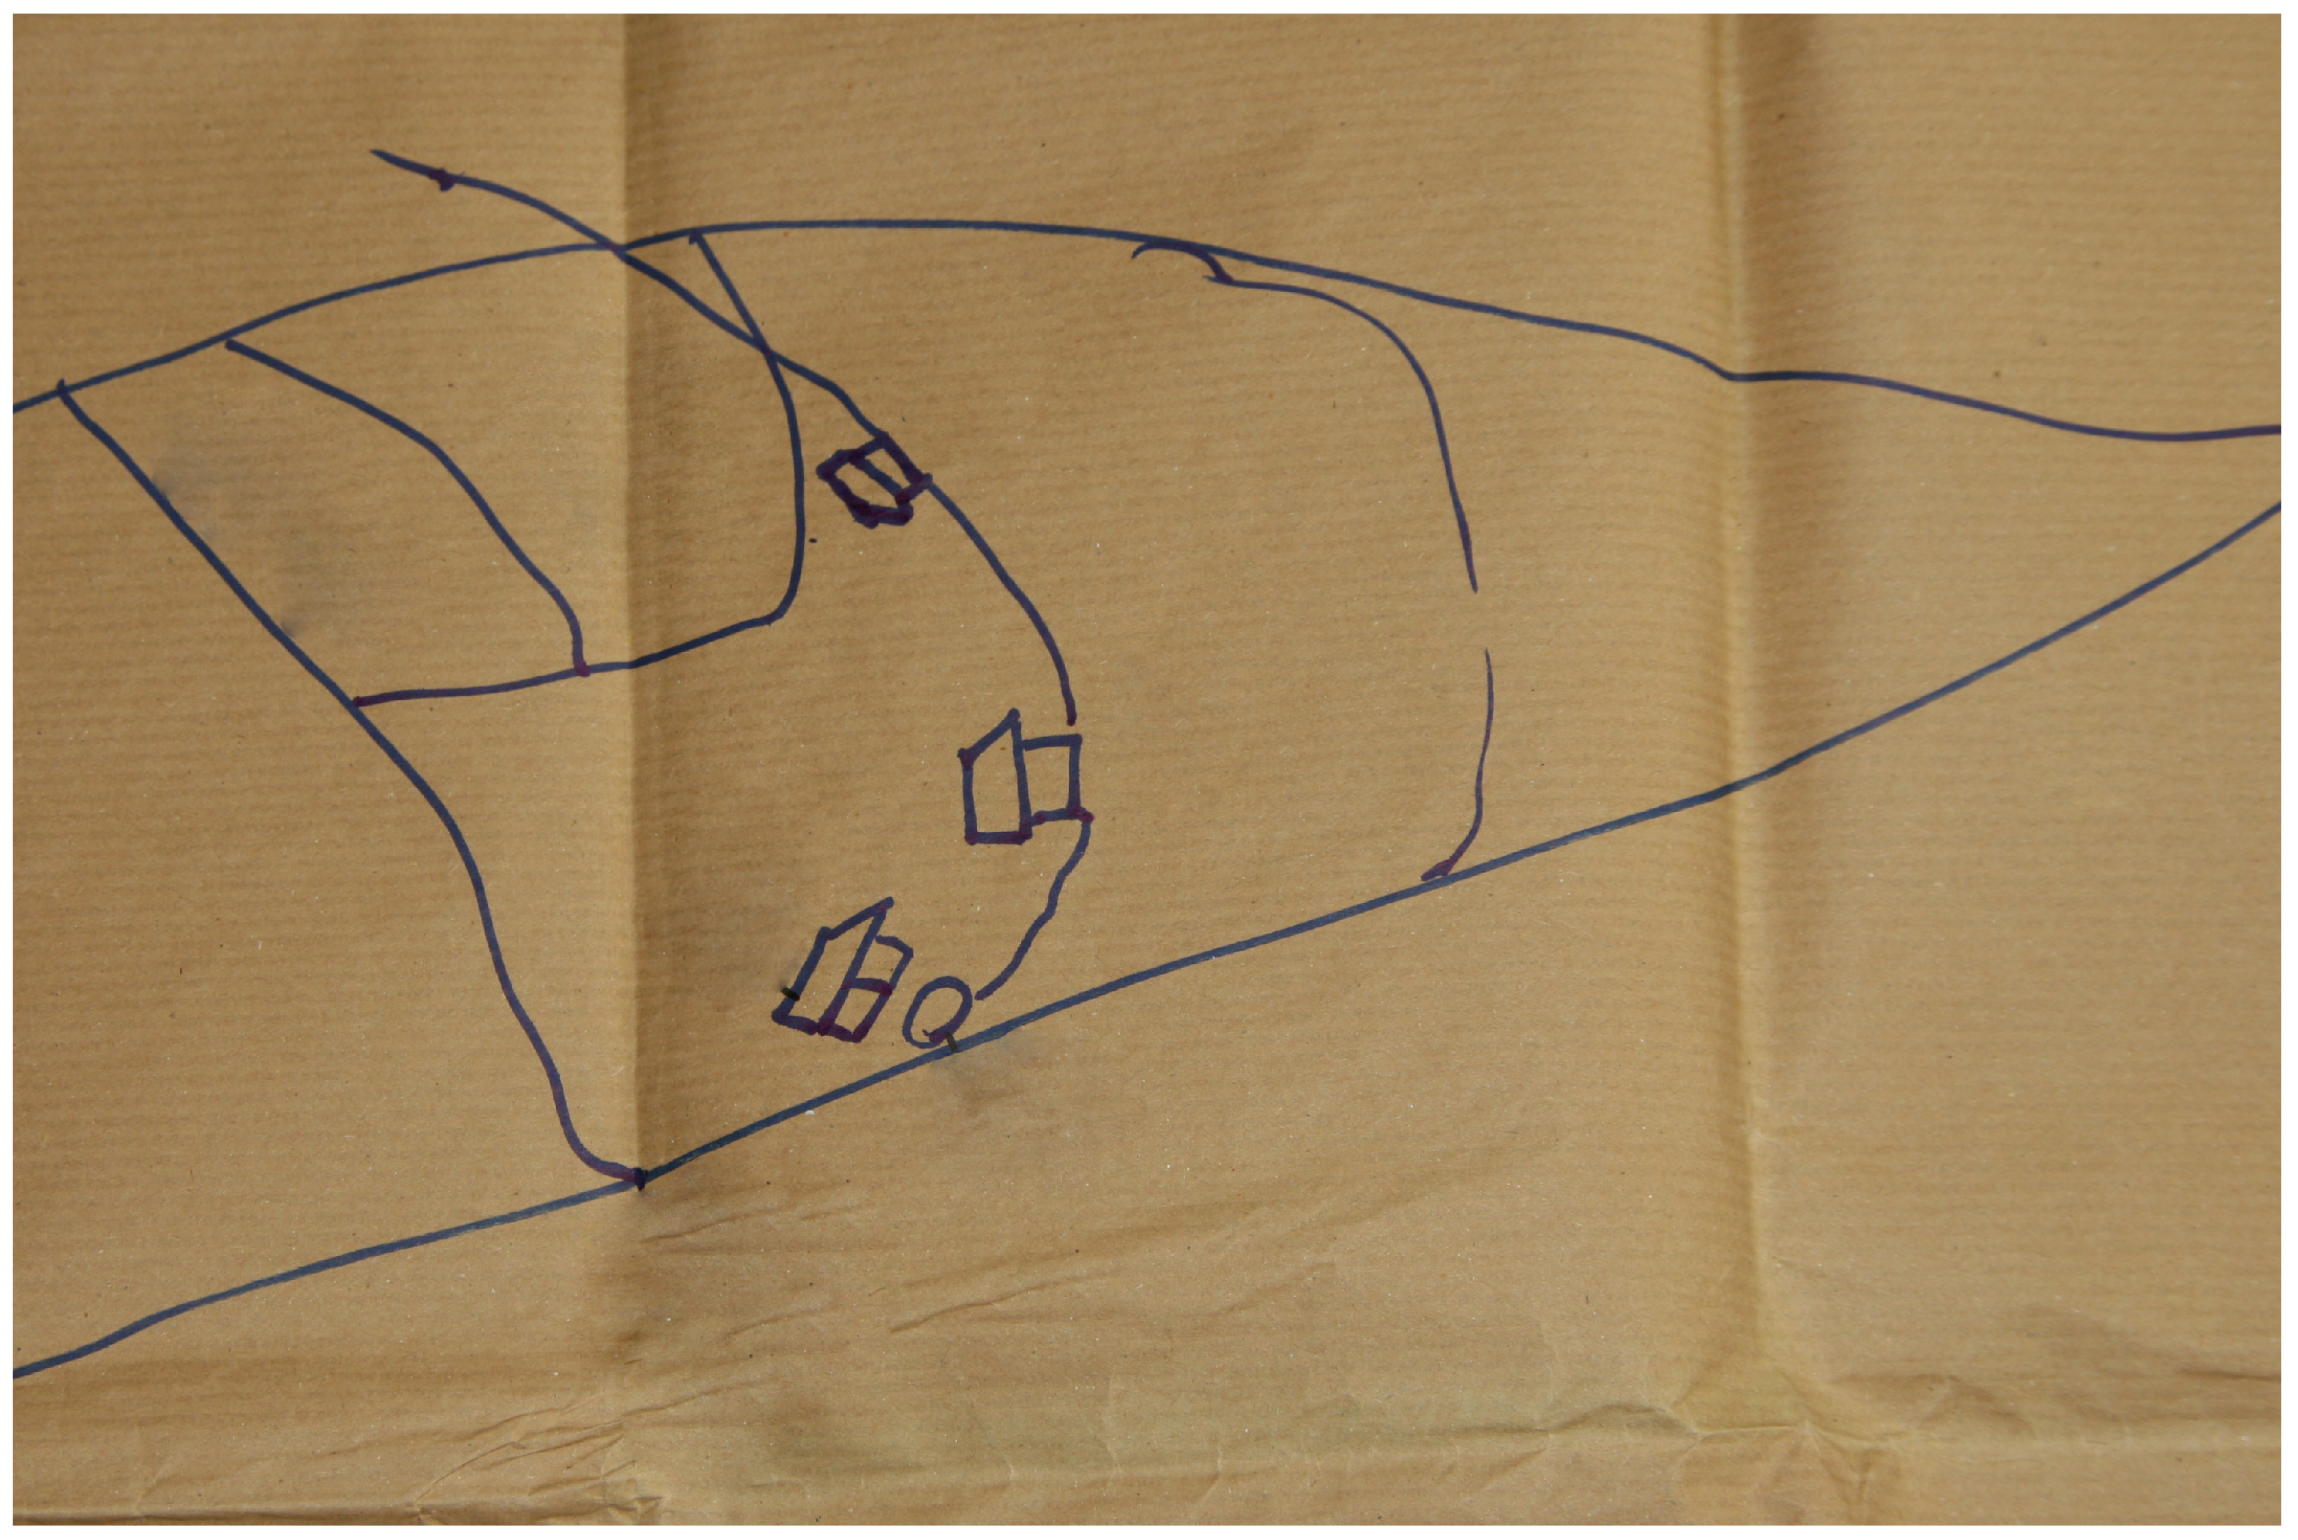
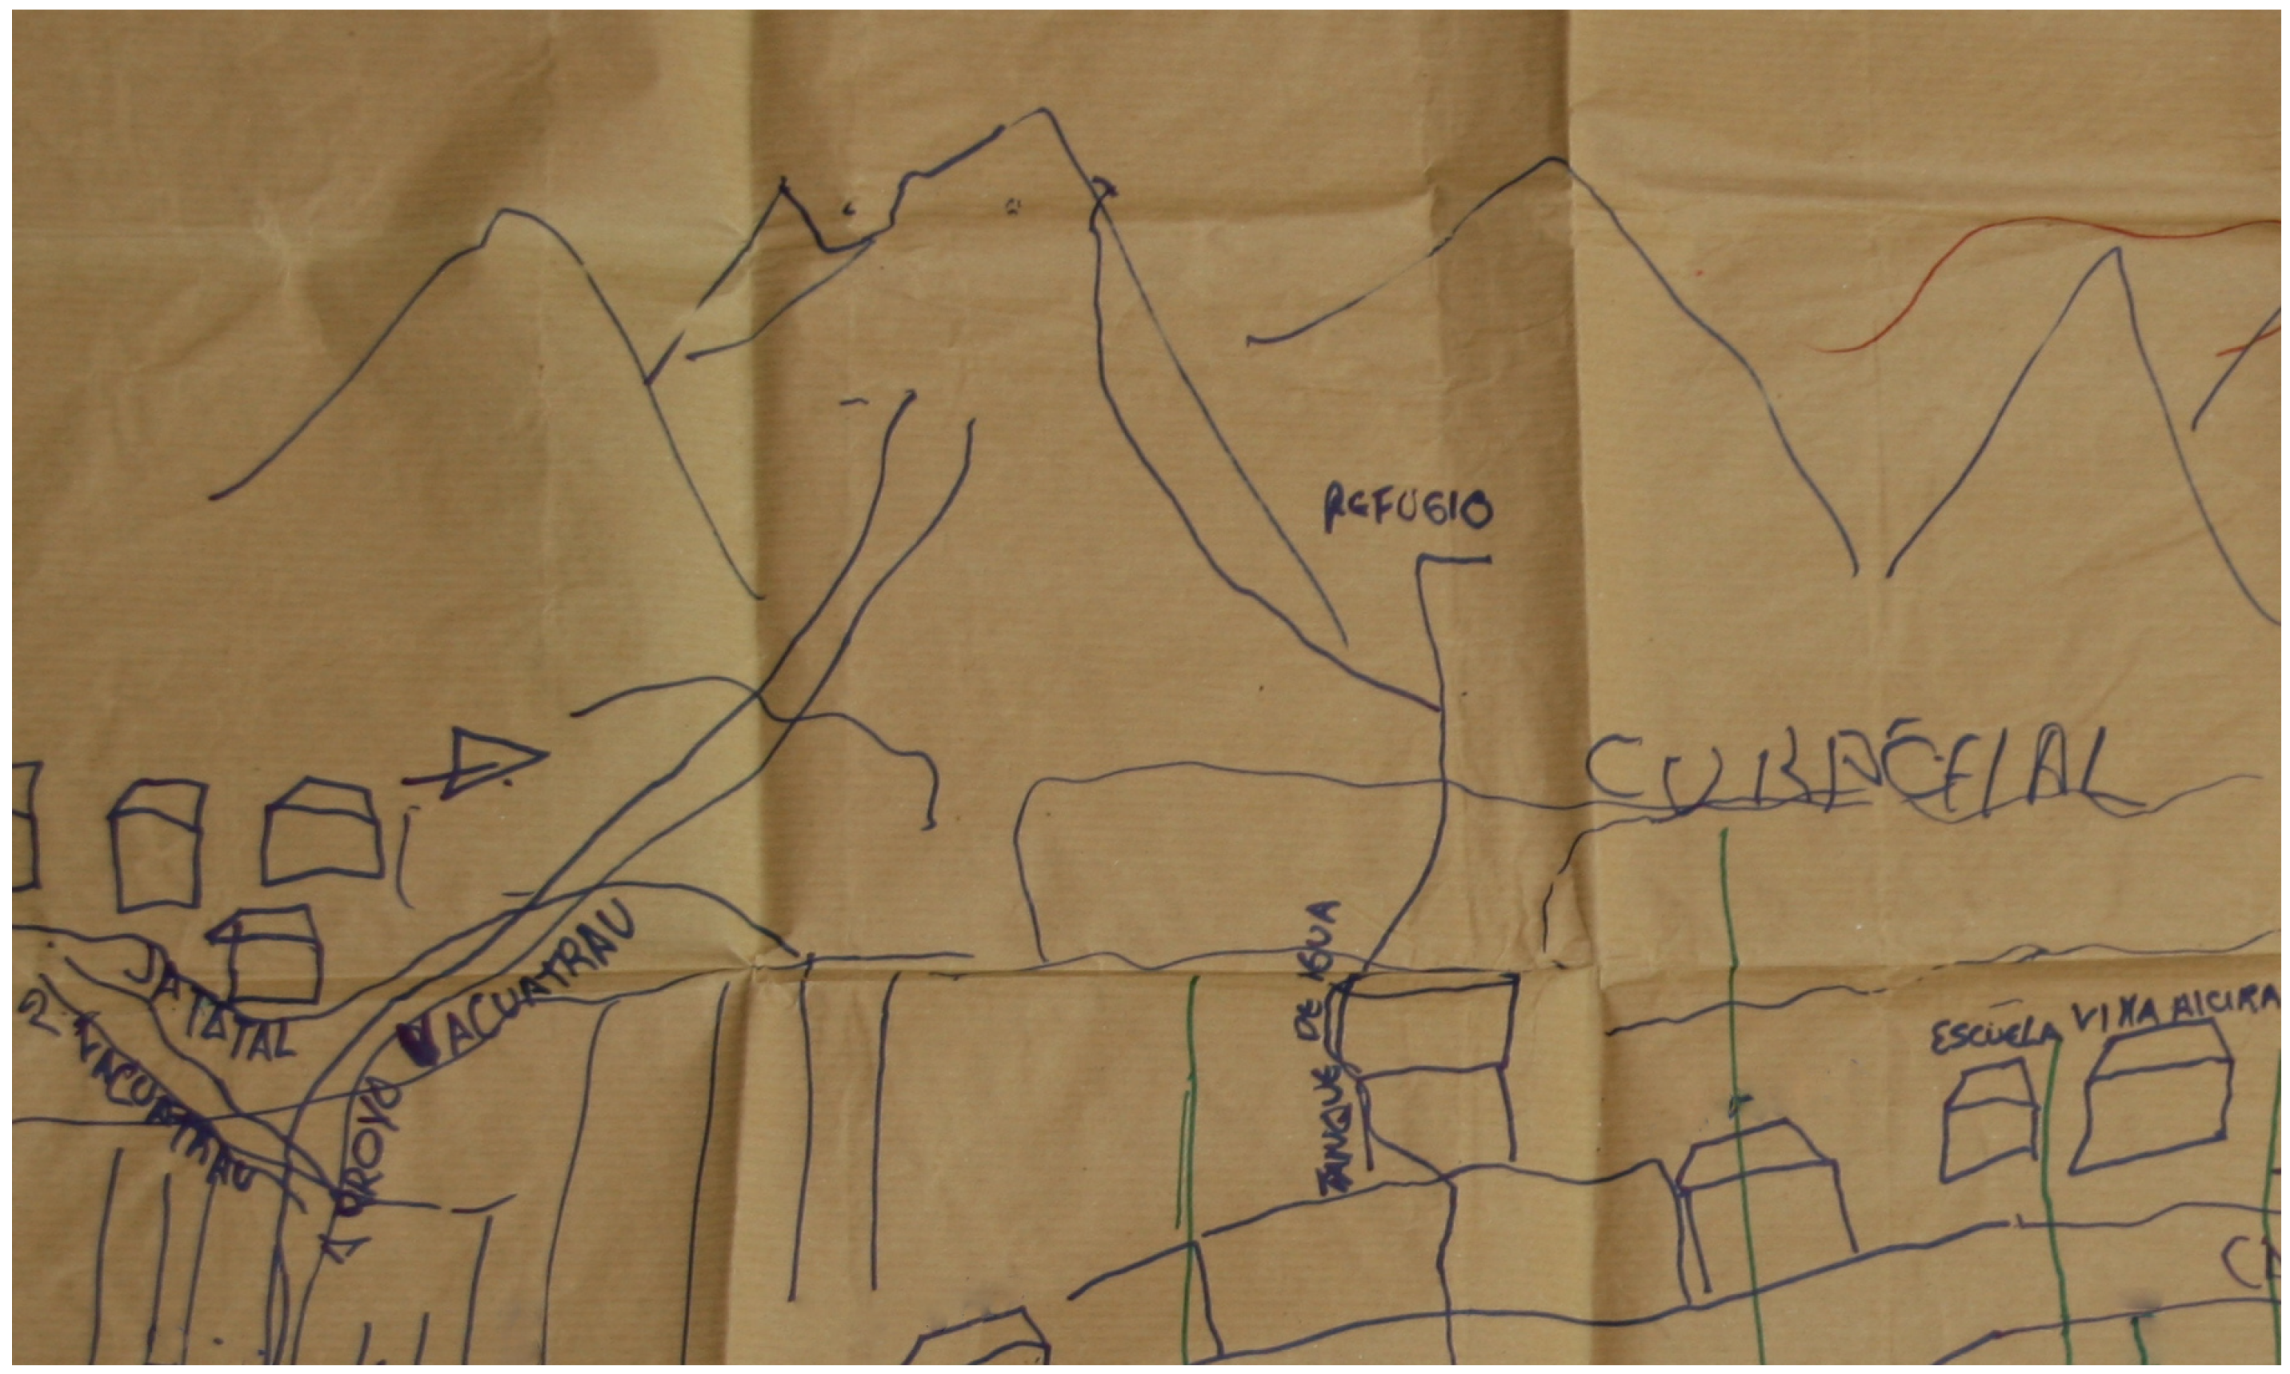
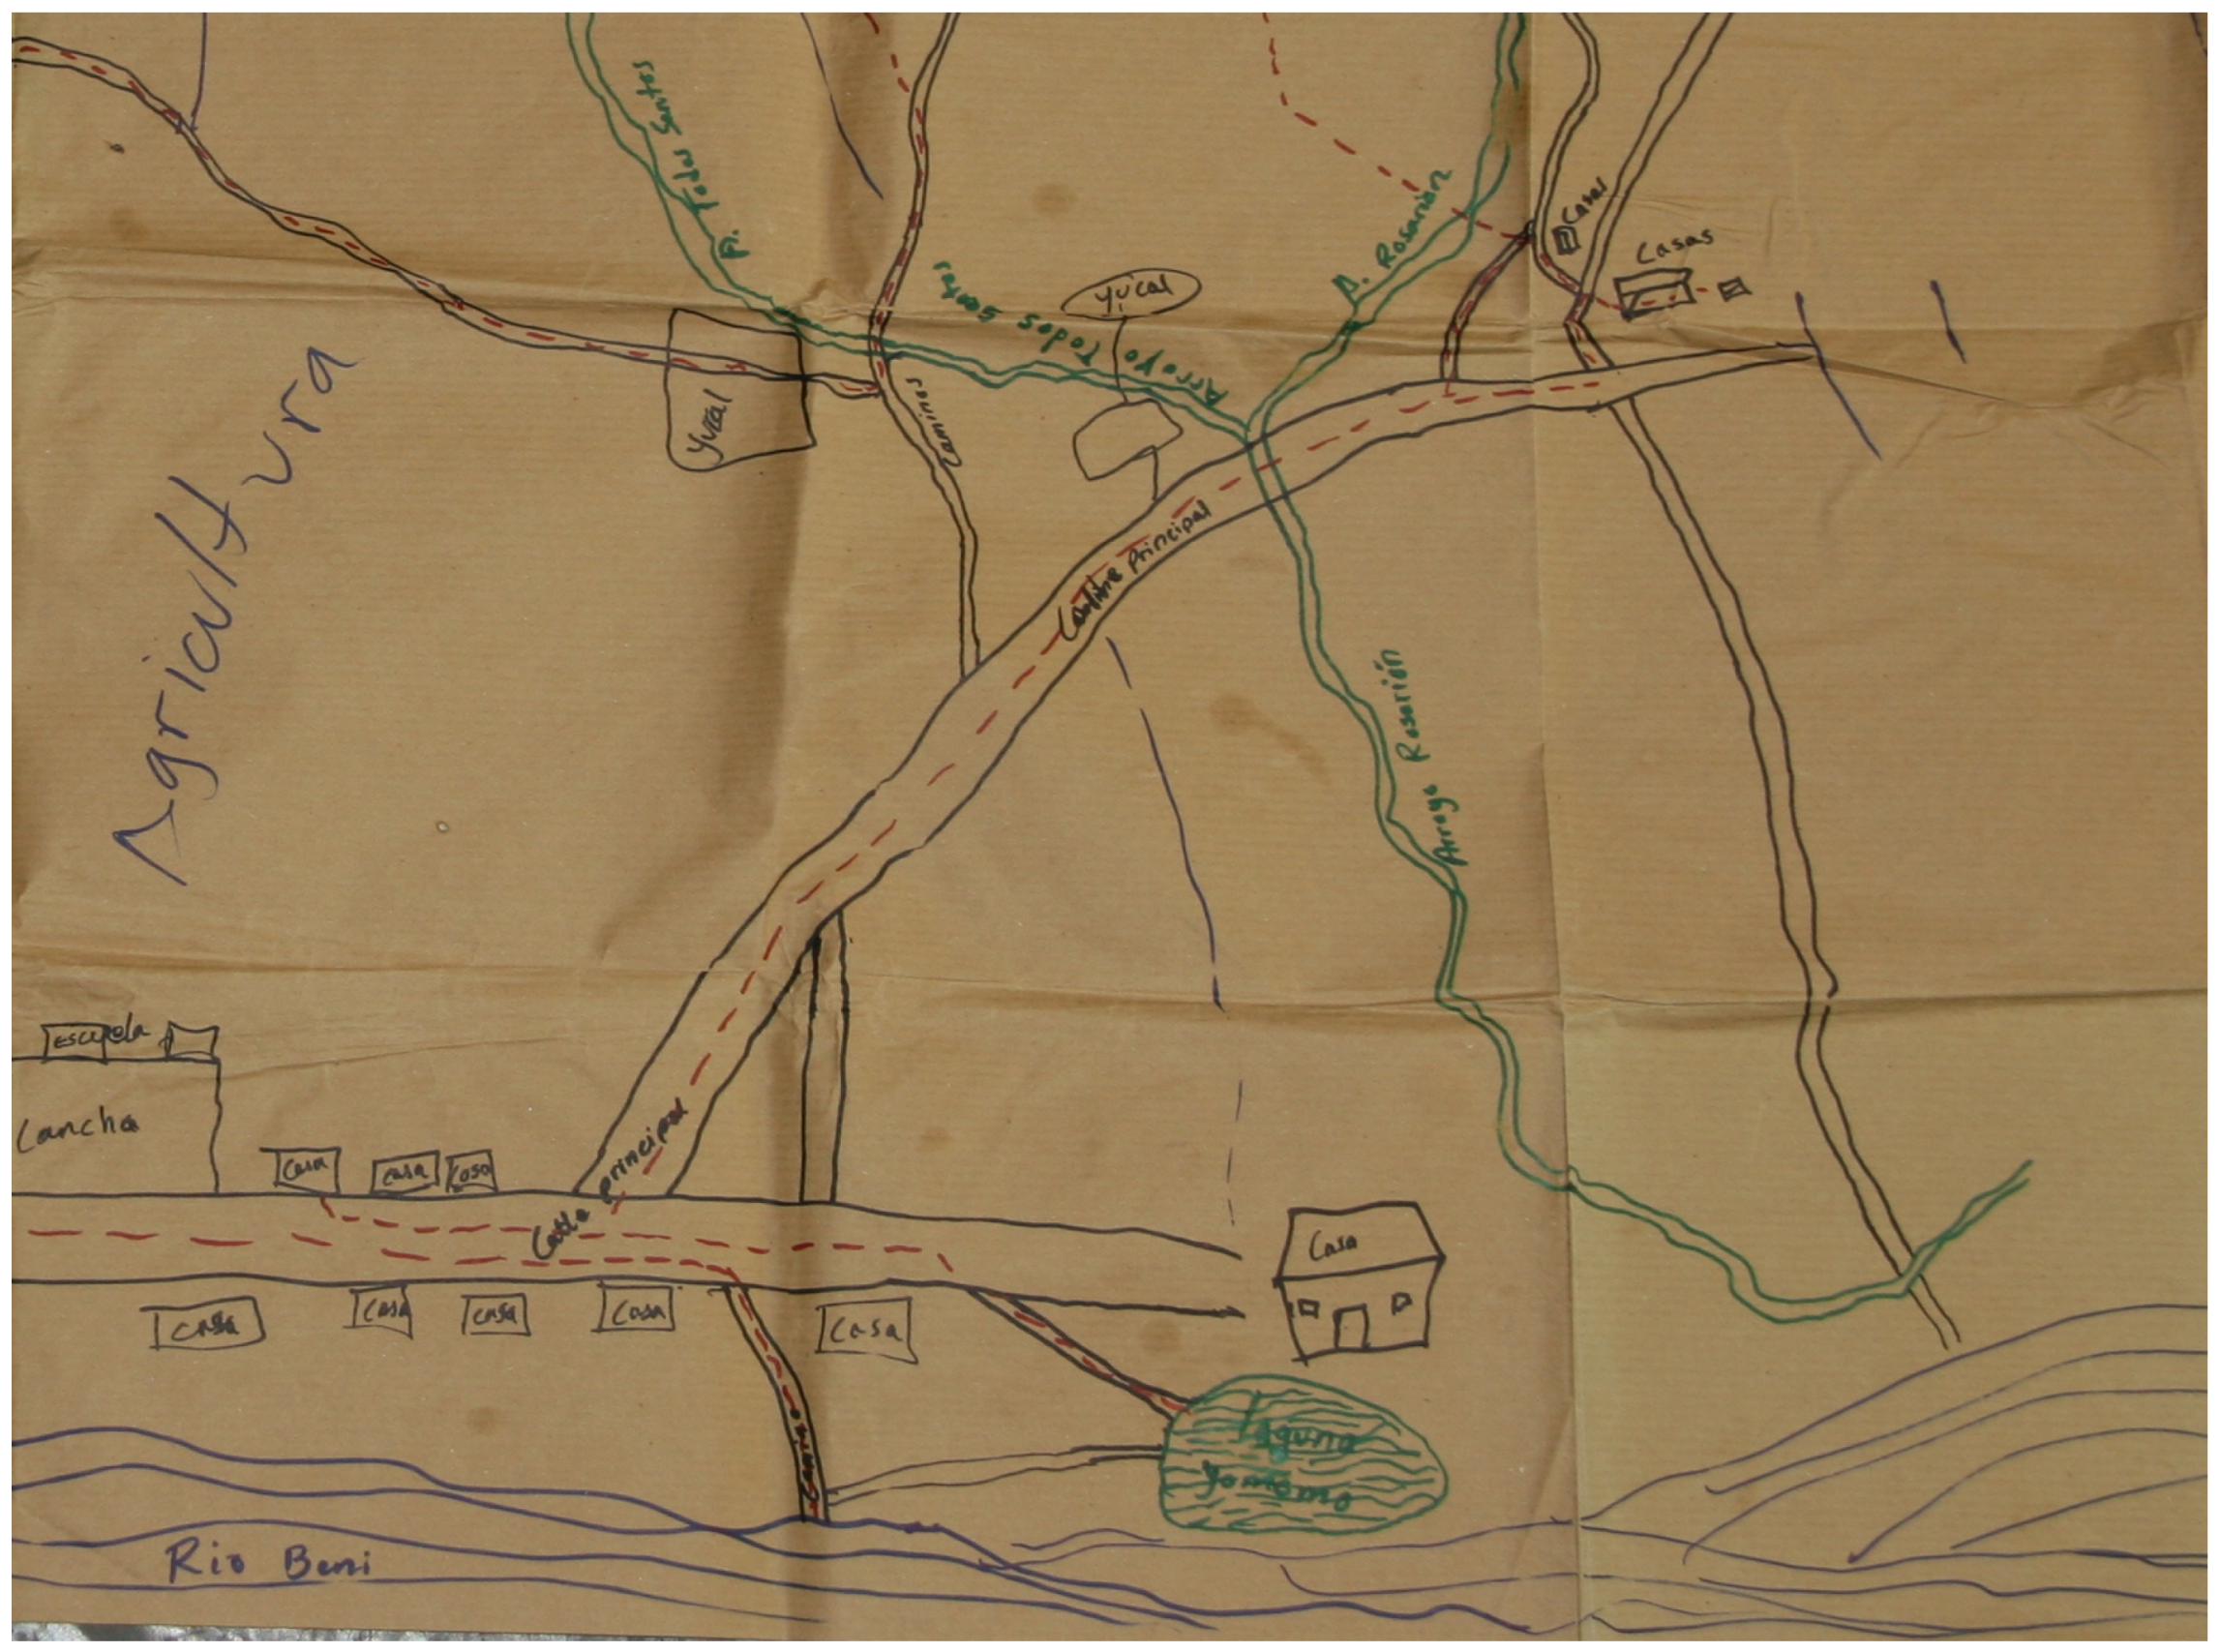
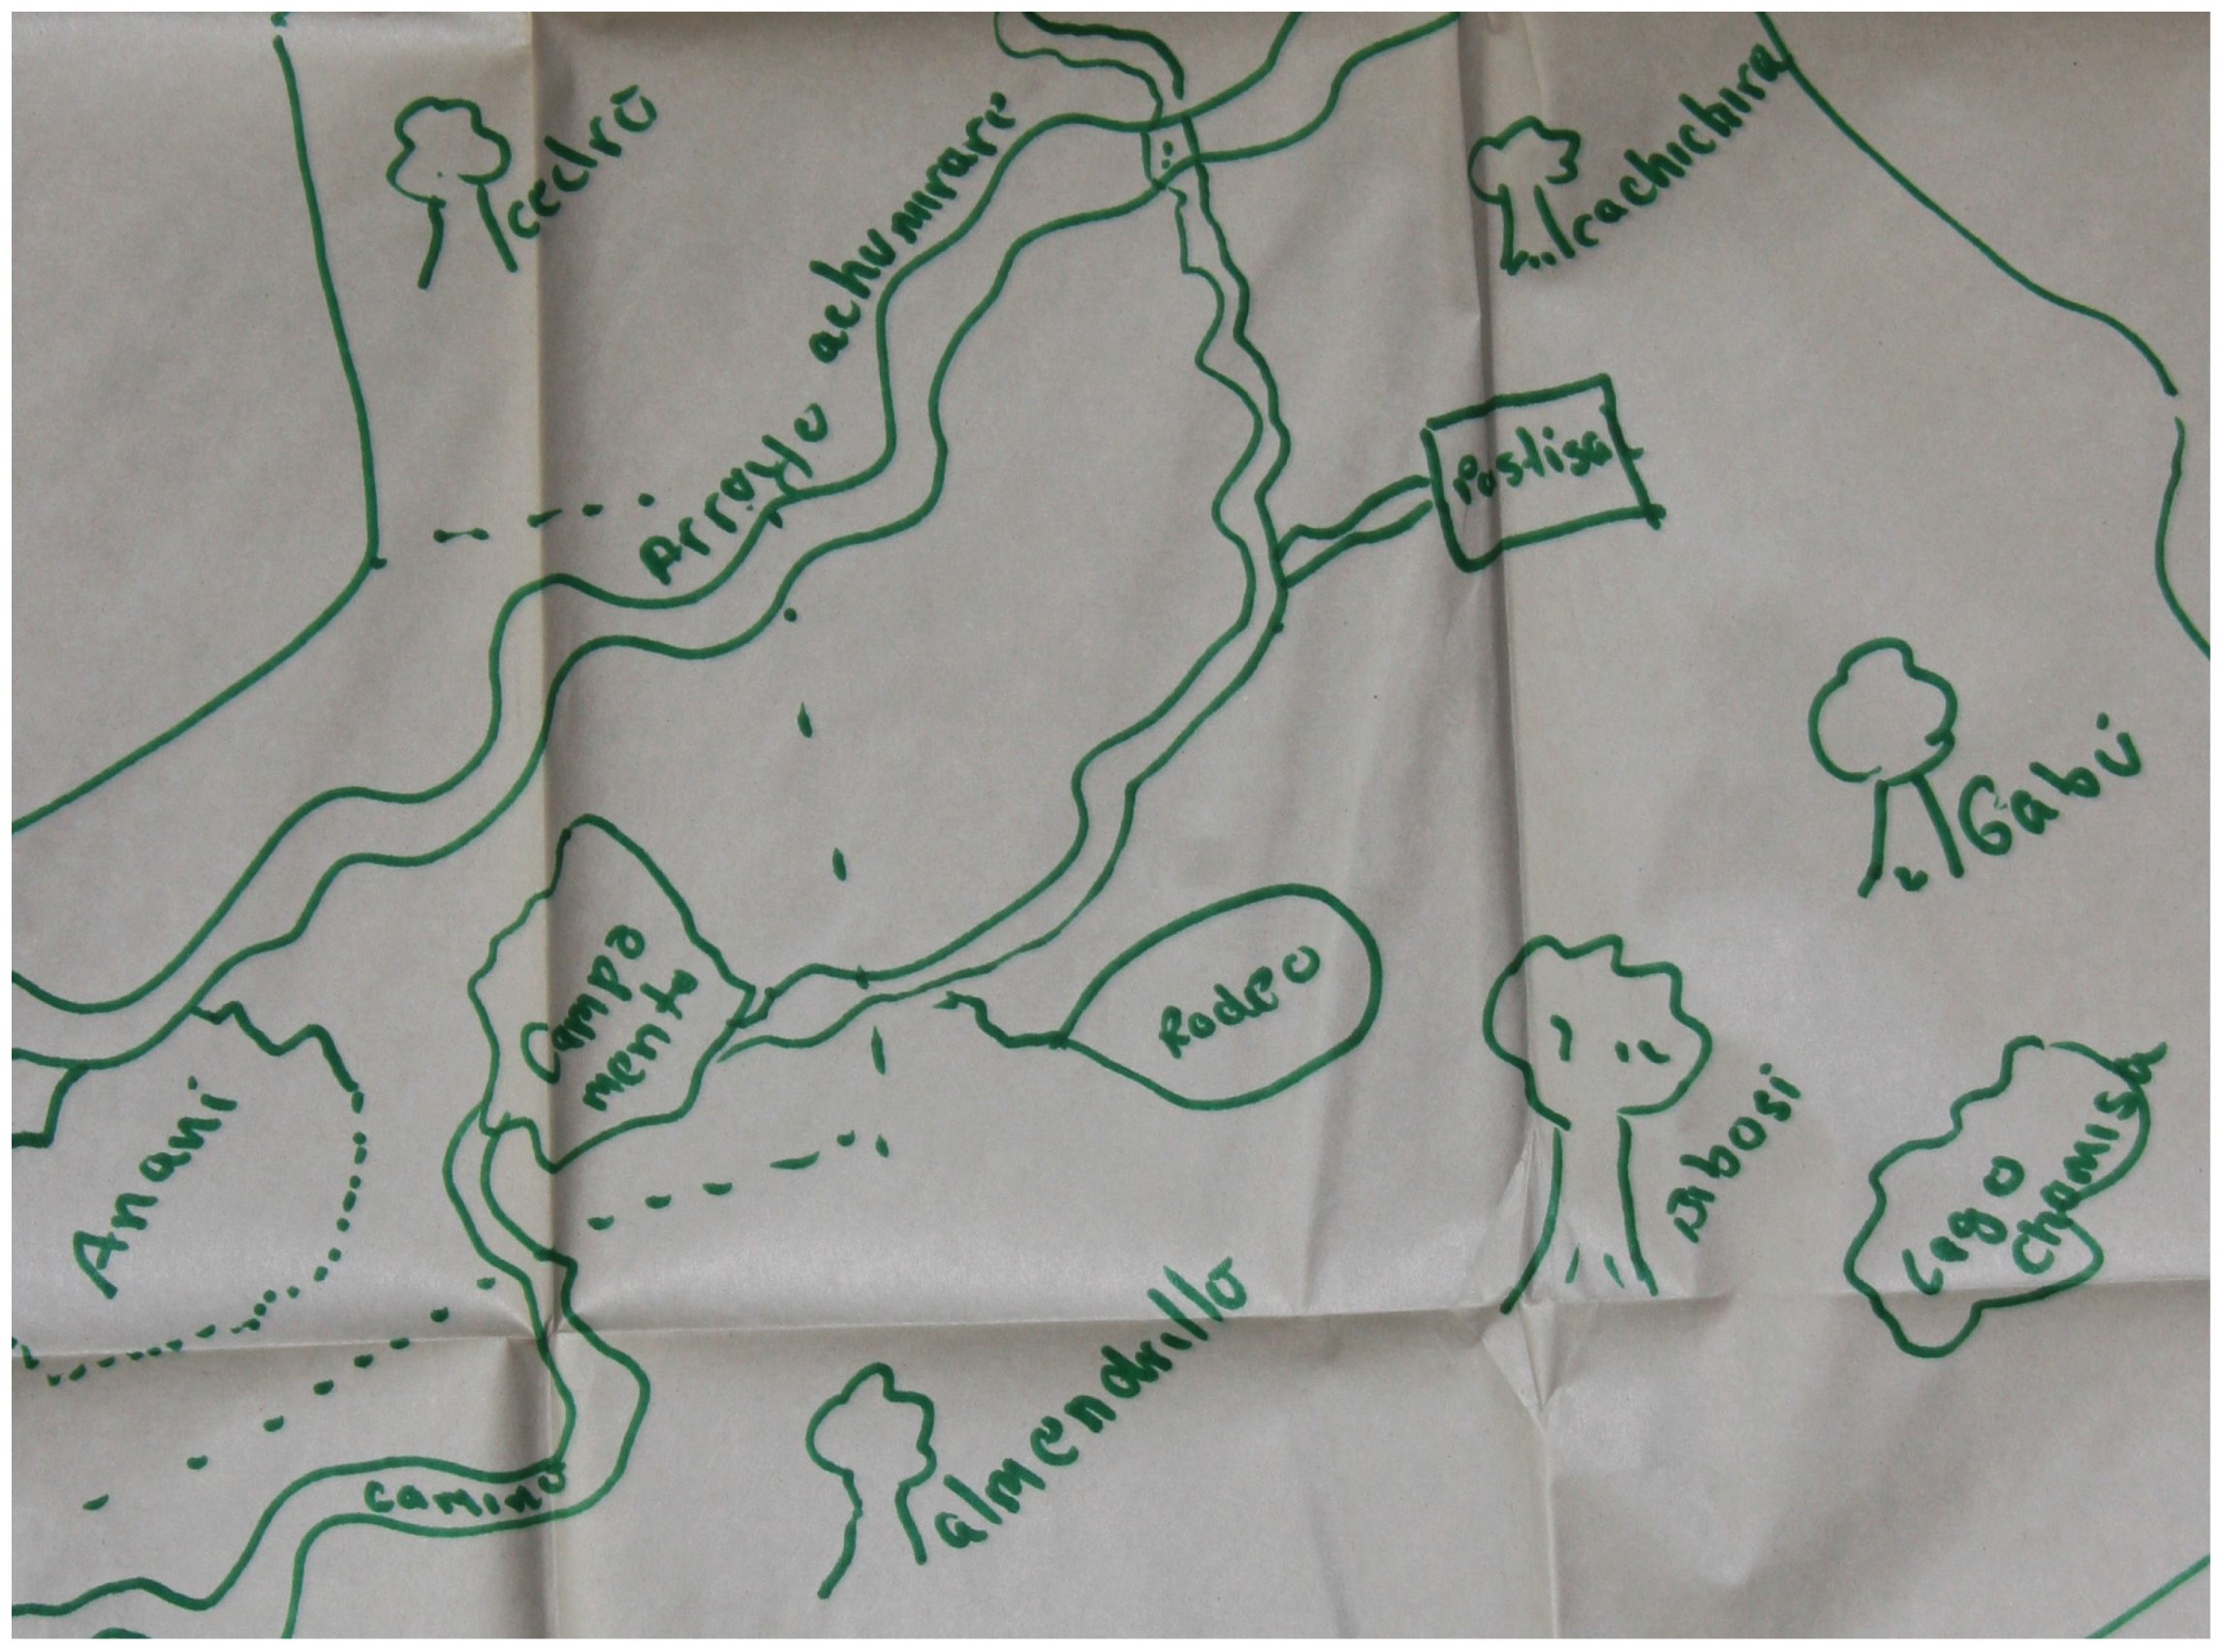
5.1. Perspective, Scale and Abstraction in Sketch Maps
5.2. Features Represented on Sketch Maps
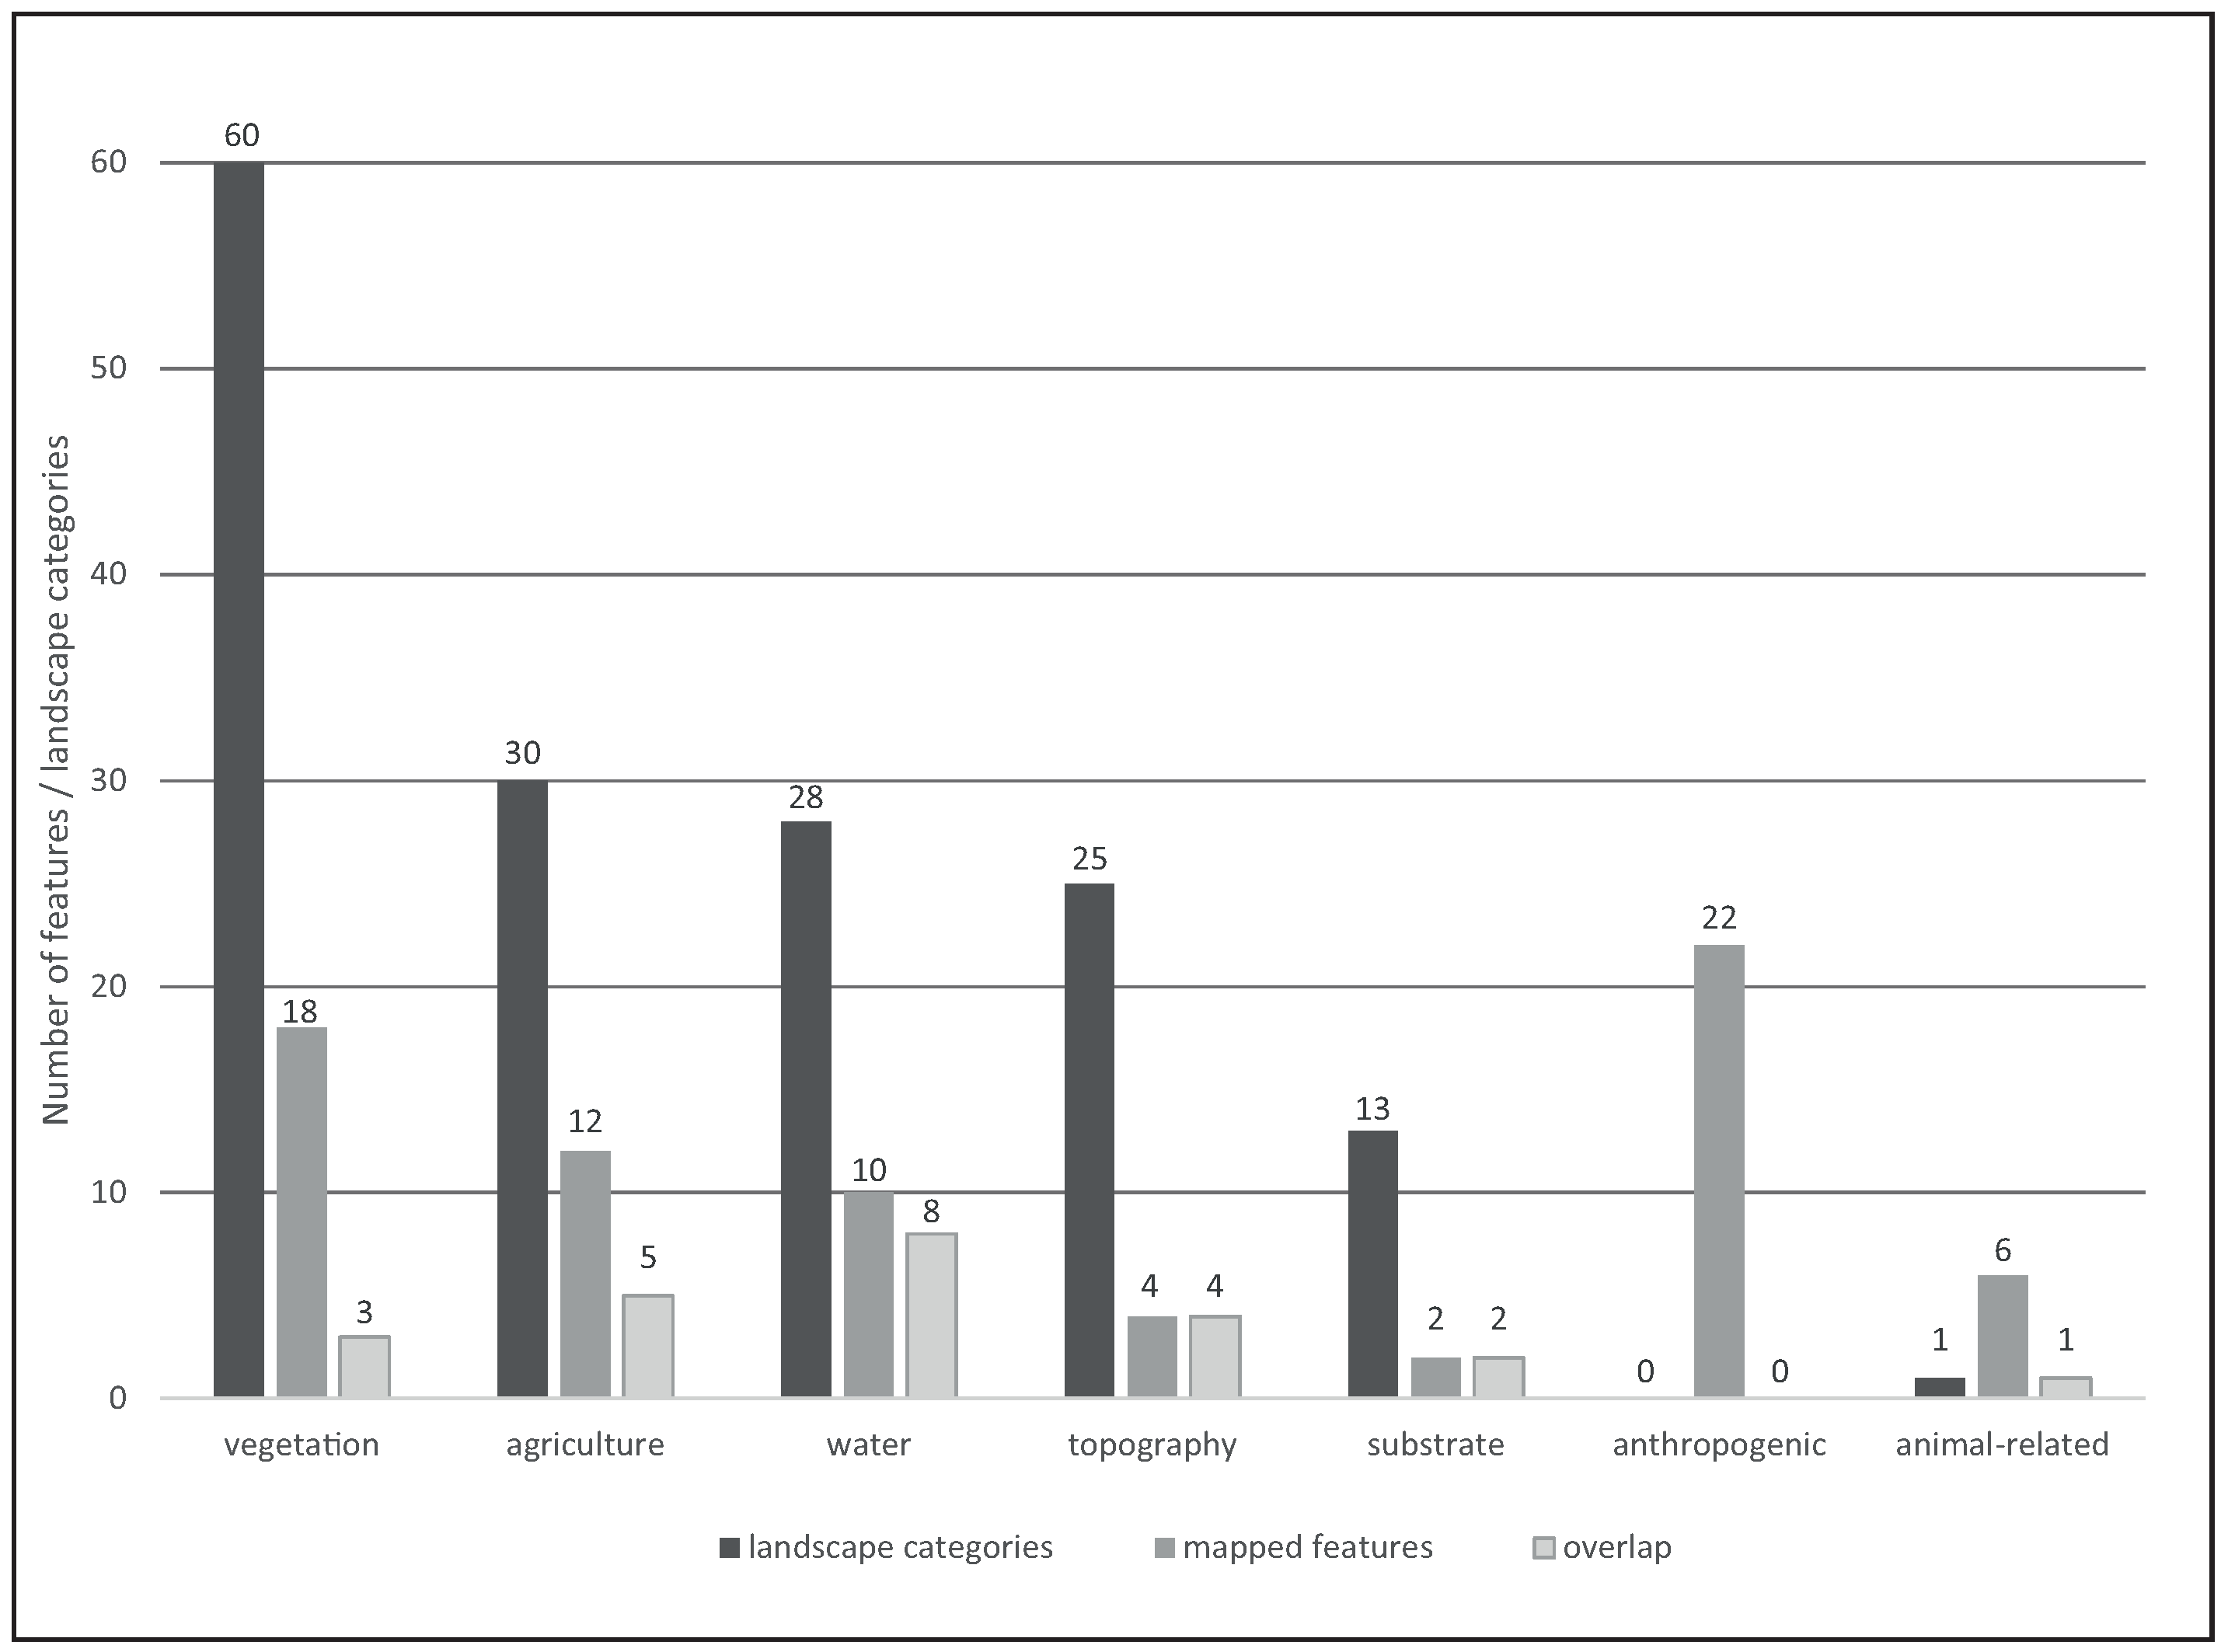
5.3. Comparing Features on Sketch Maps with Ethnoecological Landscape Categories
6. Discussion
6.1. Use of Perspective, Scale and Abstraction on Sketch Maps
6.2. Comparing Features on Sketch Maps with Ethnoecological Landscape Categories Used in Language
6.3. Implications for Using Sketch Maps in Decision-Making
7. Conclusions
Acknowledgments
Author Contributions
Conflicts of Interest
Abbreviations
| CIPTA | Consejo Indígena del Pueblo Takana (Takana indigenous council) |
| GIS | Geographic Information System |
| TCO | Tierra Comunitaria de Origen (indigenous territory) |
| PGIS | Participatory Geographic Information System |
References
- Bruggeman, D.; Meyfroidt, P.; Lambin, E.F. Production forests as a conservation tool: Effectiveness of Cameroon’s land use zoning policy. Land Use Policy 2015, 42, 151–164. [Google Scholar] [CrossRef]
- Foley, J.A. Global Consequences of Land Use. Science 2005, 309, 570–574. [Google Scholar] [CrossRef] [PubMed]
- Pielke, R.A.; Pitman, A.; Niyogi, D.; Mahmood, R.; McAlpine, C.; Hossain, F.; Goldewijk, K.K.; Nair, U.; Betts, R.; Fall, S.; et al. Land use/land cover changes and climate: Modeling analysis and observational evidence. Wiley Interdiscip. Rev. Clim. Chang. 2011, 2, 828–850. [Google Scholar] [CrossRef]
- Comber, A.J.; Fisher, P.F.; Wadsworth, R.A. What is land cover? Environ. Plann. B Plan. Des. 2005, 32, 199–209. [Google Scholar] [CrossRef]
- Crampton, J.W. Maps as social constructions: Power, communication and visualization. Prog. Hum. Geogr. 2001, 25, 235–252. [Google Scholar] [CrossRef]
- Harvey, F.; Chrisman, N. Boundary objects and the social construction of GIS technology. Environ. Plan. A 1998, 30, 1683–1694. [Google Scholar] [CrossRef]
- Wood, D. The Power of Maps; Guilford Press: New York, NY, USA, 1992. [Google Scholar]
- Robbins, P. Fixed categories in a portable landscape: The causes and consequences of land-cover categorization. Environ. Plan. A 2001, 33, 161–179. [Google Scholar] [CrossRef]
- Hoeschele, W. Geographic information engineering and social ground truth in Attappadi, Kerala State, India. Ann. Assoc. Am. Geogr. 2000, 90, 293–321. [Google Scholar] [CrossRef]
- Abbot, J.; Chambers, R.; Dunn, C.; Harris, T.; Merode, E.; Porter, G.; Townsend, J.; Weiner, D. Participatory GIS: Opportunity or oxymoron? PLA Notes 1998, 33, 27–33. [Google Scholar]
- Chambers, R. The Origins and Practice of Participatory Rural Appraisal. World Dev. 1994, 22, 953–969. [Google Scholar] [CrossRef]
- Bernard, E.; Barbosa, L.; Carvalho, R. Participatory GIS in a sustainable use reserve in Brazilian Amazonia: Implications for management and conservation. Appl. Geogr. 2011, 31, 564–572. [Google Scholar] [CrossRef]
- Cronkleton, P.; Albornoz, M.A.; Barnes, G.; Evans, K.; Jong, W. Social geomatics: Participatory forest mapping to mediate resource conflict in the Bolivian Amazon. Hum. Ecol. 2010, 38, 65–76. [Google Scholar] [CrossRef]
- Fraser, E.D.G.; Dougill, A.J.; Mabee, W.E.; Reed, M.; McAlpine, P. Bottom up and top down: Analysis of participatory processes for sustainability indicator identification as a pathway to community empowerment and sustainable environmental management. J. Environ. Manag. 2006, 78, 114–127. [Google Scholar] [CrossRef] [PubMed]
- Jankowski, P. Towards participatory geographic information systems for community-based environmental decision making. J. Environ. Manag. 2009, 90, 1966–1971. [Google Scholar] [CrossRef] [PubMed]
- Mapedza, E.; Wright, J.; Fawcett, R. An investigation of land cover change in Mafungautsi Forest, Zimbabwe, using GIS and participatory mapping. Appl. Geogr. 2003, 23, 1–21. [Google Scholar] [CrossRef]
- Amelot, X. Cartographie participative pour le développement local et la gestion de l’environnement à Madagascar: Empowerment, impérialisme numérique ou illusion participative? L’Information Géographique 2013, 77, 47. [Google Scholar] [CrossRef]
- Brown, G.; Kyttä, M. Key issues and research priorities for public participation GIS (PPGIS): A synthesis based on empirical research. Appl. Geogr. 2014, 46, 122–136. [Google Scholar] [CrossRef]
- Dunn, C.E. Participatory GIS a people’s GIS? Prog. Hum. Geogr. 2007, 31, 616–637. [Google Scholar] [CrossRef]
- Duvail, S. Cartographies participatives et conflits territoriaux. Revue d’ethnoécologie 2017. [Google Scholar] [CrossRef]
- Newing, H.; Eagle, C.; Puri, R.; Watson, C.W. Conducting Research in Conservation: A Social Science Perspective; Routledge: London, UK; New York, NY, USA, 2011. [Google Scholar]
- Peluso, N.L. Whose woods are these? Counter-mapping Forest Territories in Kalimantan, Indonesia. Antipode 1995, 27, 383–406. [Google Scholar] [CrossRef]
- Weiner, D.; Harris, T.M.; Craig, W.J. Community participation and geographic information systems. In Community Participation and Geographic Information Systems; Craig, W.J., Harris, T.M., Weiner, D., Eds.; Taylor & Francis: London, UK; New York, NY, USA, 2002; pp. 3–17. [Google Scholar]
- Wellen, C.C.; Sieber, R.E. Toward an inclusive semantic interoperability: The case of Cree hydrographic features. Int. J. Geogr. Inf. Sci. 2013, 27, 168–191. [Google Scholar] [CrossRef]
- Schuurman, N. Formalization matters: Critical GIS and ontology research. Ann. Assoc. Am. Geogr. 2006, 96, 726–739. [Google Scholar] [CrossRef]
- Burenhult, N.; Levinson, S.C. Language and landscape: A cross-linguistic perspective. Lang. Sci. 2008, 30, 135–150. [Google Scholar] [CrossRef]
- Mark, D.M.; Turk, A.G.; Burenhult, N.; Stea, D. Landscape in Language; John Benjamins Publishing: Amsterdam, The Netherlands; Philadelphia, PA, USA, 2011. [Google Scholar]
- Johnson, L.; Hunn, E. Landscape Ethnoecology; Berghahn Books: New York, NY, USA, 2010. [Google Scholar]
- Wartmann, F.M.; Haller, T.; Backhaus, N. ‘Institutional Shopping’ for Natural Resource Management in a Protected Area and Indigenous Territory in the Bolivian Amazon. Hum. Organ. 2016, 75, 218–229. [Google Scholar] [CrossRef]
- Wang, J.; Worboys, M. Ontologies and representation spaces for sketch map interpretation. Int. J. Geogr. Inf. Sci. 2017, 31, 1697–1721. [Google Scholar] [CrossRef]
- Smith, D.A. Participatory mapping of community lands and hunting yields among the Buglé of western Panama. Hum. Organ. 2003, 62, 332–343. [Google Scholar] [CrossRef]
- Boschmann, E.E.; Cubbon, E. Sketch maps and qualitative GIS: Using cartographies of individual spatial narratives in geographic research. Prof. Geogr. 2014, 66, 236–248. [Google Scholar] [CrossRef]
- Downs, R.M.; Stea, D. Maps in Minds: Reflections on Cognitive Mapping; Harper and Row: New York, NY, USA, 1977. [Google Scholar]
- Kitchin, R.M. Cognitive maps: What are they and why study them? J. Environ. Psychol. 1994, 14, 1–19. [Google Scholar] [CrossRef]
- Lynch, K. The Image of the City; MIT Press: Cambridge, MA, USA, 1960. [Google Scholar]
- Tversky, B. Cognitive maps, cognitive collages, and spatial mental models. In Spatial Information Theory a Theoretical Basis for GIS; Frank, A.U., Campari, I., Eds.; Springer: Berlin/Heidelberg, Germany, 1993; pp. 14–24. [Google Scholar]
- Byrne, R.W. Memory for urban geography. Q. J. Exp. Psychol. 1979, 31, 147–154. [Google Scholar] [CrossRef]
- Tversky, B. Distortions in memory for maps. Cogn. Psychol. 1981, 13, 407–433. [Google Scholar] [CrossRef]
- Feinberg, R.; Dymon, U.J.; Paiaki, P.; Rangituteki, P.; Nukuriaki, P.; Rollins, M. ’Drawing the Coral Heads’: Mental Mapping and its Physical Representation in a Polynesian Community. Cartogr. J. 2003, 40, 243–253. [Google Scholar] [CrossRef]
- Kelly, J. Maori maps. Cartogr. Int. J. Geogr. Inf. Geovisualization 1999, 36, 1–30. [Google Scholar] [CrossRef]
- Sletto, B.I. “We Drew What We Imagined”. Participatory Mapping, Performance, and the Arts of Landscape Making. Curr. Anthropol. 2009, 50, 443–476. [Google Scholar] [CrossRef]
- Gieseking, J.J. Where We Go From Here: The Mental Sketch Mapping Method and Its Analytic Components. Qual. Inq. 2013, 19, 712–724. [Google Scholar] [CrossRef]
- Burenhult, N. Streams of words: Hydrological lexicon in Jahai. Lang. Sci. 2008, 30, 182–199. [Google Scholar] [CrossRef]
- Bromhead, H. Ethnogeographical categories in English and Pitjantjatjara/Yankunytjatjara. Lang. Sci. 2011, 33, 58–75. [Google Scholar] [CrossRef]
- Fuentes, A. Una introducción a la vegetación de la región de Madidi. Ecol. Boliv. 2005, 40, 1–31. [Google Scholar]
- Ferrié, F. El Tuichi o el deslizamiento de una frontera. In Las Tierras Bajas de Bolivia: Miradas Históricas y Antropológicas; Villar, D., Combès, I., Eds.; El País: Santa Cruz de la Sierra, Bolivia, 2012; pp. 107–119. [Google Scholar]
- Lehm, Z. Los Takanas. In Las tierras bajas de Bolivia.Miradas históricas y antropológicas; Villar, D., Combès, I., Eds.; El País: Santa Cruz de la Sierra, Bolivia, 2012; pp. 177–197. [Google Scholar]
- CIPTA. Aibawekuana etse Pamapa Aibawekuana Takana; Estado Plurinacional de Bolivia, Ministerio de Educación: La Paz, Bolivia, 2010. [Google Scholar]
- Pinto Mosqueira, G. Lenguaje y Habla Popular en el Pueblo Cruceño-Camba. Available online: https://issuu.com/richardosinagamunoz/docs/cuaderno_de_trabajo_no._6_-.lenguaj (accessed on 2 Novemer 2017).
- Tejada, R.; Chao, E.; Gómez, H.; Painter, L.R.E.; Wallace, R.B. Evaluación sobre el uso de la fauna silvestre en la Tierra Comunitaria de Origen Tacana, Bolivia. Ecol. Boliv. 2006, 41, 138–148. [Google Scholar]
- Bourdy, G.; DeWalt, S.J.; Chávez Michel, L.R.; Roca, A.; Deharo, E.; Muñoz, V.; Balderrama, L.; Quenevo, C.; Gimenez, A. Medicinal plants uses of the Tacana, an Amazonian Bolivian ethnic group. J. Ethnopharmacol. 2000, 70, 87–109. [Google Scholar] [CrossRef]
- DeWalt, S.J.; Bourdy, G.; Michel, L.R.C.; Quenevo, C. Ethnobotany of the Tacana: Quantitative inventories of two permanent plots of northwestern Bolivia. Econ. Bot. 1999, 53, 237–260. [Google Scholar] [CrossRef]
- Tobias, T.N. Living Proof. The Essential Data-Collection Guide for Indigenous Use-and-Occupancy Map Surveys; Ecotrust Canada: Vancouver, BC, Canada, 2009. [Google Scholar]
- Rundstrom, R.A. GIS, Indigenous Peoples, and Epistemological Diversity. Cartogr. Geogr. Inf. Syst. 1995, 22, 45–57. [Google Scholar] [CrossRef]
- Wartmann, F.M.; Purves, R.S. ‘This is not the jungle, this is my barbecho’: Semantics of ethnoecological landscape categories in the Bolivian Amazon. Landsc. Res. 2017, 1–18. [Google Scholar] [CrossRef]
- Bohnemeyer, J.; Burenhult, N.; Enfield, N.J.; Levinson, S.C. Landscape terms and place names elicitation guide. In Field Manual; Asifa, M., Ed.; Max Planck Institute for Psycholinguistics: Nijmegen, The Netherlands, 2004; pp. 75–79. [Google Scholar]
- Mark, D.M.; Turk, A.G. Landscape categories in Yindjibarndi: Ontology, environment and language. In Spatial Information Theory. Foundations of Geographic Information Science; Kuhn, W., Worboys, M., Timpf, S., Eds.; Springer: Berlin, Germany; New York, NY, USA, 2003; pp. 28–45. [Google Scholar]
- Association of Social Anthropologists of the UK and the Commonwealth (ASA). Ethical Guidelines for Good Research Practice; Association of Social Anthropologists of the UK and the Commonwealth (ASA): London, UK, 2011. [Google Scholar]
- Davies, C.; Uttal, D.H. Map use and the development of spatial cognition. In The Emerging Spatial Mind; Plumert, J.M., Spencer, J.P., Eds.; Oxford University Press: New York, NY, USA, 2007; pp. 219–247. [Google Scholar]
- Downs, R.M.; Stea, D. (Eds.) Image and Environment: Cognitive Mapping and Spatial Behavior; Transaction Publishers: New Brunswick, NJ, USA; London, UK, 1973. [Google Scholar]
- Tobler, W.R. The geometry of mental maps. In Spatial Choice and Spatial Behavior; Golledge, R.G., Rushton, G., Eds.; Ohio State University Press: Columbus, OH, USA, 1976; pp. 69–81. [Google Scholar]
- Kitchin, R.; Freundschuh, S. (Eds.) Cognitive Mapping: Past, Present, and Future; Routledge: London, UK; New York, NY, USA, 2000. [Google Scholar]
- Murray, D.; Spencer, C. Individual differences in the drawing of cognitive maps: The effects of geographical mobility, strength of mental imagery and basic graphic ability. Trans. Inst. Br. Geogr. 1979, 4, 385–391. [Google Scholar] [CrossRef]
- Smith, B.; Mark, D.M. Geographical categories: An ontological investigation. Int. J. Geogr. Inf. Sci. 2001, 15, 591–612. [Google Scholar] [CrossRef]
- Hodgson, D.L.; Schroeder, R.A. Dilemmas of Counter-Mapping Community Resources in Tanzania. Dev. Chang. 2002, 33, 79–100. [Google Scholar] [CrossRef]
- Klippel, A.; Mark, D.; Wallgrün, J.O.; Stea, D. Conceptualizing Landscape. A Comparative Study of Landscape Categories with Navajo and English-Speaking Participants. In Spatial Information Theory; Fabrikant, S., Raubal, M., Bertolotto, M., Davies, C., Freundschuh, S., Bell, S., Eds.; Springer: Cham, Switzerland, 2015; pp. 268–288. [Google Scholar]
- Atzmanstorfer, K.; Resl, R.; Eitzinger, A.; Izurieta, X. The GeoCitizen-approach: Community-based spatial planning—An Ecuadorian case study. Cartogr. Geogr. Inf. Sci. 2014, 41, 248–259. [Google Scholar] [CrossRef] [PubMed]
- Camponovo, M.E.; Freundschuh, S.M. Assessing uncertainty in VGI for emergency response. Cartogr. Geogr. Inf. Sci. 2014, 41, 440–455. [Google Scholar] [CrossRef]
- Connors, J.P.; Lei, S.; Kelly, M. Citizen science in the age of neogeography: Utilizing volunteered geographic information for environmental monitoring. Ann. Assoc. Am. Geogr. 2012, 102, 1267–1289. [Google Scholar] [CrossRef]
- Dodge, M.; Kitchin, R. Crowdsourced cartography: Mapping experience and knowledge. Environ. Plan. A 2013, 45, 19–36. [Google Scholar] [CrossRef]
- Klippel, A.; Weaver, C.; Robinson, A.C. Analyzing cognitive conceptualizations using interactive visual environments. Cartogr. Geogr. Inf. Sci. 2011, 38, 52–68. [Google Scholar] [CrossRef]


| Feature (in Local Spanish Dialect) | Approximate English Translation | Number of Participants |
|---|---|---|
| casa | house | 19 |
| río | river | 19 |
| arroyo | stream | 16 |
| carretera | road | 11 |
| camino | path | 8 |
| jatatal | stand of Geonoma deversa | 8 |
| sendero | trail, path | 8 |
| cerro | hill, mountain | 6 |
| chaco | agricultural plot | 5 |
| comunidad | village, community | 5 |
| barbecho | fallow plot | 4 |
| cancha | soccer field | 4 |
| lago | lake | 4 |
| almendrillo | Dipteryx odorata | 3 |
| arboles | trees | 3 |
| canopy zip line | canopy zip line | 3 |
| puente | bridge | 3 |
| yucal | plot of Manihot esculenta | 3 |
| bibosi * | Fig tree | 2 |
| campamento | camp site | 2 |
| chiquero | pig pen | 2 |
| curichal | area of oxbow lakes | 2 |
| escuela | school | 2 |
| marfil * | ivory-nut palm (Pytelphas macrocarpa) | 2 |
| pastizal | pasture | 2 |
| personas | people | 2 |
| piedra tallada | carved stone | 2 |
| platanal | school | 2 |
| puerto | port | 2 |
| salitral | salt lick | 2 |
| serranía | mountain range | 2 |
| arbol de coco | coconut tree | 1 |
| arbol de soliman | soliman tree | 1 |
| área de cultivos | farming area | 1 |
| área de plantas medicinales | medicinal plant area | 1 |
| área forestal | lumbering area | 1 |
| asaí * | Euterpe precatoria | 1 |
| bajío | lowland | 1 |
| barrero | area of mud | 1 |
| cabaña | hut | 1 |
| cachichira * | Sloanea obtusifolia | 1 |
| calle | street | 1 |
| cascada | waterfall | 1 |
| cedro * | Cedrela odorata | 1 |
| cerdo | pig | 1 |
| chancho | pig, collared peccary (Peccari tajacu) | 1 |
| chaquillal | stand of Physocalymma scaberrimum | 1 |
| colina | hill | 1 |
| refugio | shelter | 1 |
| gabú | Otoba parvifolia | 1 |
| isla | island | 1 |
| laguna | lagoon | 1 |
| límites de comunidades | borders of communities | 1 |
| maíz * | maize | 1 |
| majal | stand of Oenocarpus bataua | 1 |
| mango * | mango tree | 1 |
| motacú * | Attalea phalerata | 1 |
| nacientes de agua | watersheds | 1 |
| naranja * | orange (tree) | 1 |
| parabal | nesting area of macaws | 1 |
| pato | duck | 1 |
| peces | fish | 1 |
| plantas | plants | 1 |
| plátanos * | plantains | 1 |
| poblaciones grandes | large settlements | 1 |
| pueblo | town, village | 1 |
| riachuelo | stream | 1 |
| tanque de agua | water tank | 1 |
| toronja * | grapefruit | 1 |
| troncos de arboles | tree trunks | 1 |
| vaca | cow | 1 |
| villa | village, small town | 1 |
| zona de cultivos | farming area | 1 |
| zona de casería | hunting area | 1 |
| Feature Types on Sketch Maps | Perspective on Sketch Map | Number of Landscape Terms from Interviews |
|---|---|---|
| 15 | mixed | 46 |
| 9 | mixed | 67 |
| 7 | aerial | 46 |
| 7 | aerial | 40 |
© 2017 by the authors. Licensee MDPI, Basel, Switzerland. This article is an open access article distributed under the terms and conditions of the Creative Commons Attribution (CC BY) license (http://creativecommons.org/licenses/by/4.0/).
Share and Cite
Wartmann, F.M.; Purves, R.S. What’s (Not) on the Map: Landscape Features from Participatory Sketch Mapping Differ from Local Categories Used in Language. Land 2017, 6, 79. https://doi.org/10.3390/land6040079
Wartmann FM, Purves RS. What’s (Not) on the Map: Landscape Features from Participatory Sketch Mapping Differ from Local Categories Used in Language. Land. 2017; 6(4):79. https://doi.org/10.3390/land6040079
Chicago/Turabian StyleWartmann, Flurina M., and Ross S. Purves. 2017. "What’s (Not) on the Map: Landscape Features from Participatory Sketch Mapping Differ from Local Categories Used in Language" Land 6, no. 4: 79. https://doi.org/10.3390/land6040079
APA StyleWartmann, F. M., & Purves, R. S. (2017). What’s (Not) on the Map: Landscape Features from Participatory Sketch Mapping Differ from Local Categories Used in Language. Land, 6(4), 79. https://doi.org/10.3390/land6040079