Article

Identifying Hot Spots of Critical Forage Supply in Dryland Nomadic Pastoralist Areas: A Case Study for the Afar Region, Ethiopia

1
Amsterdam Centre for World Food Studies, Vrije Universiteit Amsterdam, 1081 HV Amsterdam, The Netherlands
2
College of Agriculture and Environmental Sciences, Haramaya University, P.O. Box 138, Dire Dawa, Ethiopia
3
GEOSAS Consultancies, P.O. Box 787, Addis Ababa, Ethiopia
4
Sustainable Resources, Food Security Unit, Joint Research Centre, European Commission, Via Fermi 2749, 21027 Ispra, Italy
5
Water Resource and Irrigation Engineering department. Haramaya Institute of Technology, Haramaya University, P.O. Box 138, Dire Dawa, Ethiopia
6
Afar Pastoral and Agro-pastoral Research Institute, P.O. Box 16, Semara, Ethiopia
*
Author to whom correspondence should be addressed.
Submission received: 26 October 2017 / Revised: 10 November 2017 / Accepted: 13 November 2017 / Published: 18 November 2017
(This article belongs to the Special Issue Arid Land Systems: Sciences and Societies)

Abstract

:
This study develops a methodology to identify hot spots of critical forage supply in nomadic pastoralist areas, using the Afar Region, Ethiopia, as a special case. It addresses two main problems. First, it makes a spatially explicit assessment of fodder supply and demand extracted from a data poor environment. Fodder supply is assessed by combining rainfall-based production functions and rule-based assessment for prevailing land use. Fodder demand is based on a data consistency check of livestock statistics concerning herd size, composition and geographical distribution. Second, individual herd movements have to be evaluated jointly in concurrent migration patterns to assess local pressures on fodder resources. We, therefore, apply a transition model that relates stock levels to seasonal migration routings for all Afar sub-clans jointly so as to localize the hot spots where feed demand exceeds forage supply. Critical areas come to the fore, especially, near fringes of Highlands and in the southern part of the Afar. A sensitivity test shows that ‘Baseline’ scenario is close to the ‘Best’ but under ‘Worst’, the Afar region would fall into despair. We conclude that the model is a useful tool to inform policy makers on critical areas in the Afar region.

1. Introduction

Drylands cover 40 percent of the world’s land area and host around two billion people, 90 per cent of which lives in developing countries [1]. In these drylands some 30–40 million people practice nomadic pastoralism, an extensive grazing system that uses flexible migration patterns to follow rainy seasons in arid regimes. For a long time nomadic pastoralism was synonymous for overgrazing [2,3,4] and archaic production systems [5,6], that echoed the ‘Tragedy of the Commons’ [7]. Yet, the stance that nomadic pastoral systems are unsustainable came under serious criticism [8,9,10,11,12,13]) and was categorically rejected in 2009 when Elinor Ostrom was awarded the Nobel Prize in Economics for her lifetime scholarly work on the management of common pool resources. Ostrom’s studies show that communities devise ways to govern the commons through organizing collective action to assure its survival for their needs and future generations. Many studies on nomadic pastoralism [14,15,16] refer to her paradigm on successful sharing of communal rangelands to spread risk. Indeed, nomadic1 pastoralism is nowadays considered an epitome of sustainability [17,18,19] that unrelentingly depends on traditional institutions that have proven to be instrumental in the management of the shared natural resource base. Yet, the question is if these institutions are sufficiently resilient to cope with new challenges that are often influenced by external stress factors that go beyond their control. For example, population growth and appropriation of land for irrigation [20] has caused pressure to mount in the nomadic pastoralist societies, with increasing incidences of overgrazing and violent conflicts as most visible symptoms [21]. Moreover, development plans for massive expansion of biofuel plantations [22] on marginal drylands can be expected to further restrict land’s accessibility to pastoralists [23]. This creates an enormous challenge for policy makers to come up with appropriate policy decision if poverty alleviation is to be achieved.
There are also good economic and environmental reasons for investing in pastoral development. First, pastoralism is an efficient land use system that can cope with the extreme prevailing climatic variations in arid environments [24,25]. Studies show that livestock grazing has a positive effect on development and sustainment of plant biodiversity [26,27]. Second, new opportunities for livestock production arise as global markets are rapidly expanding due to a growing and more affluent population in the urban areas, demanding more meat products [28]. Indeed, in the next two decades the livestock sector is projected to become the world's most important agricultural subsector in terms of added value and land use whereby the developing world is projected to be the major supplier of this growing market [29]. Hence, the urgent calls for more research to support the pastoral communities and explore the potential of livestock production under climate change conditions in dryland areas seem justified.

1.1. The Study Area

Afar Regional State2 in North East Ethiopia in the horn of Africa (Figure 1) is a typical case in point. This semi-arid to arid region of 94,436 km2, hosts 1.4 million people, divided over 112 sub-clans3, 78 percent of which are involved in nomadic pastoralism, with herds that mainly consists of cattle, camels, sheep and goats [30]. Yet, accessibility to rangelands and watering points is increasingly hampered by expansion of sedentary agricultural settlements along the Awash River, implementation of large scale agricultural projects like the state-owned Tenaha sugar plantation and the increasing incidence of contested territorial claims by different ethnic groups from outside the region [31,32,33]. Tensions are sharpened further by regulatory legislation and taxation discouraging traditional trans-boundary movements to Djibouti and Eritrea [34]. Current plans for expansion of biofuel plantations of sugarcane and Jatropha shrubs, while opening new economic prospects for the Afar region, will also encroach further on the land available to pastoralists [35]. Indeed, with further restrictions on rangeland accessibility, the threats of land degradation, negative climate change effects and violent conflicts over scarce remaining land and water resources will wreak havoc on the pastoral societies in the Afar. Yet, there are also development opportunities for the Afar region. Studies show that potential meat production of the lowlands remain largely untapped [36], while meat and hides demand from neighboring countries is increasing rapidly [37,38,39]. These prospects for pastoralists should, however, be studied in relation to a sustainable development of the natural resources base with a strong geographical component to account for spatial and temporal variability of natural endowments and land uses. Yet, studies in Ethiopia concentrated basically on sedentary agriculture in the Highlands [40]. In recent years also national planning strategies for the rangeland areas came to the fore [41,42,43].
The policy document for land use and administration of the Afar Regional State (Land Administration and Use Proclamation No. 49, enacted in 2009) emphasizes sedentarization of pastoralists and the establishment of formal institutions to manage land use and administration. Meanwhile, the intention is to retain customary systems that do not contradict the formal land administration. Its effectiveness has been questioned by a recent study [44] carried out on the feasibility of land use policy in the region where environmental factors largely affect land resource uses while customary systems were efficient in enabling pastoralists to manage risks. In the policy document, the communal system has been viewed as dysfunctional and destructive. However, it acknowledges the contribution of the customary institutions only towards conflict management rather than land resource management [45]. The pastoral development policy of the country does not recognize pastoralists’ environment that is uniquely different from the sedentary farming systems. The policy narrates voluntary settlement while it imposes it in practice. Sedentarization as a policy choice has been perceived as exposing pastoralists to greater ecological risk and vulnerability [46]. However, such a choice provides the government an option to provide potential pastoral land to large-scale foreign direct investment—a practice that has created hostile relationship between pastoralists and investors since the strategy hinders pastoral mobility and response to environmental risk [47].

1.2. This Study

This complex whole of threats and opportunities motivates the current study that conducts a spatially explicit analysis to identify hot spots where the hazard of overgrazing looms. For this, the study addresses two issues. First, the generally data poor environments of the drylands requires elaborate evaluations and careful assessments of sources on livestock distribution and fodder supply. Various estimates of livestock distribution from different sources are compared and evaluated for consistency in reporting. Concerning the spatial assessment of fodder supply we combine the Afar land use map indicating percentage of grass land by land use type with rainfall production functions that estimate palatable fodder production. Second, sites under risk can only be identified when movements of clans are followed simultaneously in their geographical and temporal dependence. In absence of information on migration routes, Sonneveld et al. [48] reported on stylized results by releasing boundary restrictions from woreda to zonal and state level. Yet, these attempts are far from realistic. Therefore, during the Period October-November 2015, key figures related to the 112 sub-clans were interviewed about migration routes and the share of migrating herd during the four prevailing seasons in the year. The survey was conducted under the auspices of the Afar Pastoral and Agro-pastoral Research Institute by an experienced rangeland management expert. Data on migration were harmonized for further analysis during a two-week workshop held in December 2015 in Amsterdam. A sub-clan map was produced that reflects the boundaries of the sub-clan territories. The model that we present follows over time and space migration routes of all clans and evaluates locally the pressure of livestock presence on the produced fodder. Hot spots are identified when demand exceeds supply.
This article is organized as follows. Section 2 presents the data and methodology that have been used in this study. Section 3 presents the results of the migration model for the four seasons. Section 4 performs a sensitivity analysis for assumed uncertainty of parameters. Section 5 concludes.

2. Material and Methods
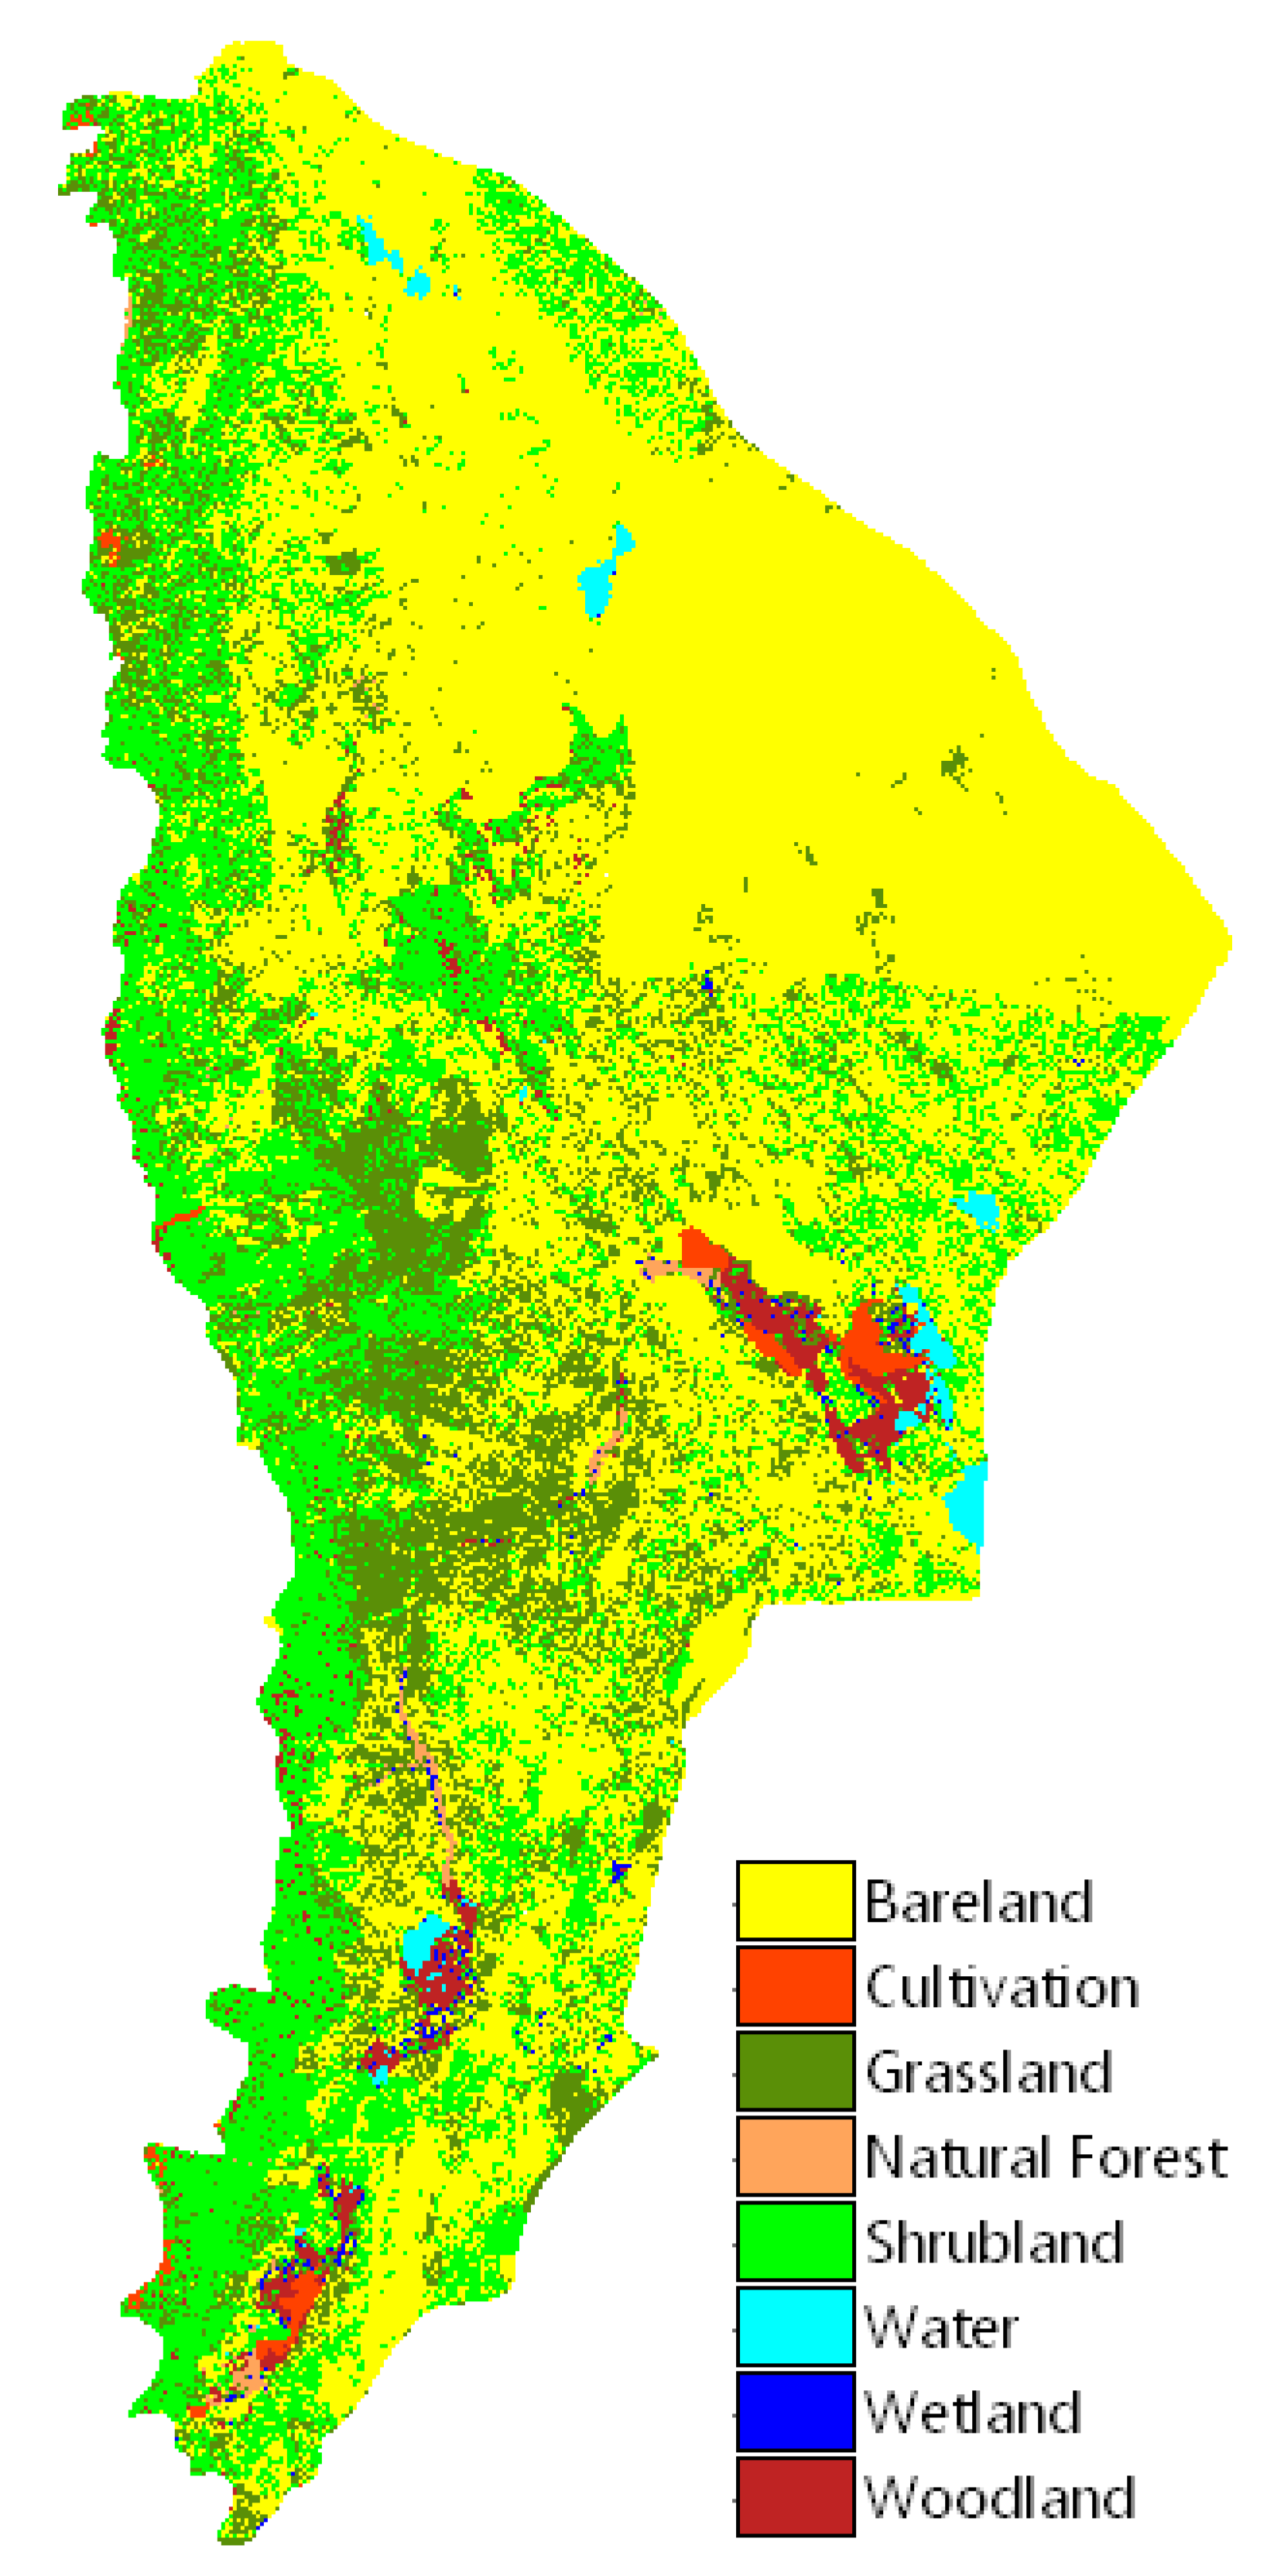
This section presents the sub-clan map of the Afar (Section 2.1), the methodologies for spatial assessment of forage supply (Section 2.2) and spatial distribution of livestock in the Afar region (Section 2.3) and, finally, the migration model that is used for identification of sites at risk (Section 2.4).

2.1. The Base Map

Figure 2 presents the map of sub-clan areas. In total there are 112 sub-clans with areas varying from 20 to 4333 square kilometers. Larger areas are found in the dryer North Eastern part bordering Eritrea and Djibouti. To our knowledge this is the first sub-clan map that is operationalized for migration modelling.
The sub-clan map was compiled using interviews with clan leaders, local authorities of Woredas and key figures from the Afar Pastoral and Agro-Pastoral Research Institute. When indicated by the interviewees sub-clan areas were delineated by one or more Kebele boundaries or by using clear landmarks. Experts of the Afar Pastoral and Agro-Pastoral Research Institute confirmed that the map was a fair assessment of sub-clan areas [49].

2.2. Fodder Supply

Estimation of spatial and temporal production of palatable biomass in the Afar is seriously hampered by lack of data as few direct observations on forage yields are available. Therefore, we decided to take the Woody Biomass land use map [50], depicting land use categories and percentage grassland (Figure 3), as baseline information for our assessment in the following step-wise approach. First, a set of rainfall dependent forage production functions designed for arid and semi-arid regimes in Africa (Table 1) is used to calculate the annual forage production for grassland cover. The spatial fodder estimates used annual rainfall maps derived from the Global Agro-Ecological Zones data set [51] covering the period 1991–2000. The 5 minute resolution of the rainfall maps is resampled using a bi-cubic filter to match the 200 × 200 m2 grid of the land use map. The reported fodder estimates derived from the production functions are the average over the 10-year period. Second, forage production data by land use type (Table 2), provided by the Regional Werer Station of the Ethiopian Institute for Agricultural Research (EIAR) are applied to the remaining land use/cover categories (Table 3). Results of the assessments are presented in Table 4, with the first column referring to source of production function, second and third columns to total and per ha forage production, respectively, based on rain dependent production functions and the fourth column presenting the maximum number of Tropical Livestock Unit (TLU)4 that could be fed by the corresponding forage assessment, assuming an annual intake of 2.3 ton per TLU; column five to seven give similar information as column two to four but with forage production adjusted for land use characteristics. Our estimations are within the bounds of forage production estimates in arid regions (Table 5) using reference data found in [52].

2.3. Total Livestock Herds in the Afar Region

Like the fodder supply, estimating feed demand of livestock population in the Afar region is a challenging exercise due to prevailing data paucity. Especially in nomadic systems livestock numbers are inherently difficult to obtain due to herd mobility and limited resources for enumeration. Hence, assessments are often based on rough estimates of scaled surveys and different sources are bound to give conflicting results. Hence, data selection requires a careful evaluation of available sources and a wider range of possibilities should be part of the assessment. We, therefore, compare various sources listed in Table 6 to come to an informed assessment on prevailing number of livestock.
Specifically, we check for consistency of number of TLU at regional level, by Woreda and for the herd composition. For reporting on livestock assessments, we concentrate first on total number of TLU for the entire Afar. Figure 4 presents total TLU by source5. The [64] livestock data for cattle, camel, goats, sheep and equine presented for zone 1 and 3 were used to create scaling factors to bring the CSA_03 data [48] the year 2011 level for the entire Afar Region. This data set is presented in Figure 4 as TLU_CSA03_scale We observe that the scaled CSA03 data (TLU_CSA03_scale) has the highest number of TLU followed by four more or less equal numbers (TLU_CSA03, TLU_regA13, TLU_LDMPS, TLU_ESGPIP). TLU_bofed is somewhat lower with respect to the previous numbers, TLU_rega08 is very low. TLU_CSA03, TLU_rega08, TLU_regA13 are based on inventories at Woreda level for which an inventory is available; other assessments are by Zone or region-wide.
For an assessment that accounts for livestock distribution by Zone we analyse Figure 5, where total TLU is depicted by Zone and data source. Data indicate a more or less similar pattern for number of TLU by Zone. Zone 1 in most of the cases the highest followed by Zone 3 and 4 while zone 2 and 5 report lowest numbers. The TLU_rega08 data set clearly deviates from this pattern.
Finally, we look at the distribution of livestock species for the three Woreda based inventories CSA03, REGA08 and REGA13. For comparison of the herd composition we correct for differences in total number of livestock by using relative numbers by Woreda. The scatterplots in Appendix show in CSA03 data against REGA08 (Figure A1, Figure A2, Figure A3, Figure A4 and Figure A5, panels A1, B1, C1, D1 and E1), CSA03 against REGA13 (Figure A1, Figure A2, Figure A3, Figure A4 and Figure A5, panels A2, B2, C2, D2 and E2) and REGA08 against REGA13 (Figure A1, Figure A2, Figure A3, Figure A4 and Figure A5, panels A3, B3, C3, D3 and E3). Figure A1, panels A1–A3 show the relative number of camels, Figure A2, panels B1–B3 for cattle, Figure A3, panels C1–C3 for equine, Figure A4, panels D1–D3 sheep for goats jointly and, finally Figure A5, panels E1–E3 for the TLU at the fifth row. We note a deviation from the expected 1:1 line in Figure A1, Figure A2, Figure A3, Figure A4 and Figure A5, panels A1, A3, B1, B3, C1, C3, D1, D3 and E1, E3, REGA08 data are involved. In Figure A1, Figure A2, Figure A3, Figure A4 and Figure A5, panels A2, B2, C2, D2 and E2the REGA13 and CSA03 data show a nice correlation indicating that livestock species composition is more or less the same over corresponding Woredas.
We conclude that REGA13 and CSA03 data confirm the distribution of livestock species and are in accordance with totals of TLU numbers of TLU_regA13, TLU_LDMPS, TLU_ESGPIP and TLU_bofed. Hence we decide to use the mean of TLU-regA13 and CSA03 data set which covers an average over a time period that is also used for the forage demand. CSA03 data were used earlier in a land degradation assessment [47]. Finally, using a constrained downscaling procedure the TLU by Woreda were distributed over corresponding6 sub-clan areas, proportionally to the fodder availability (see Section 2.2) by sub-clan in that Woreda.

2.4. Following Herds: Seasonal Migration in the Afar Region
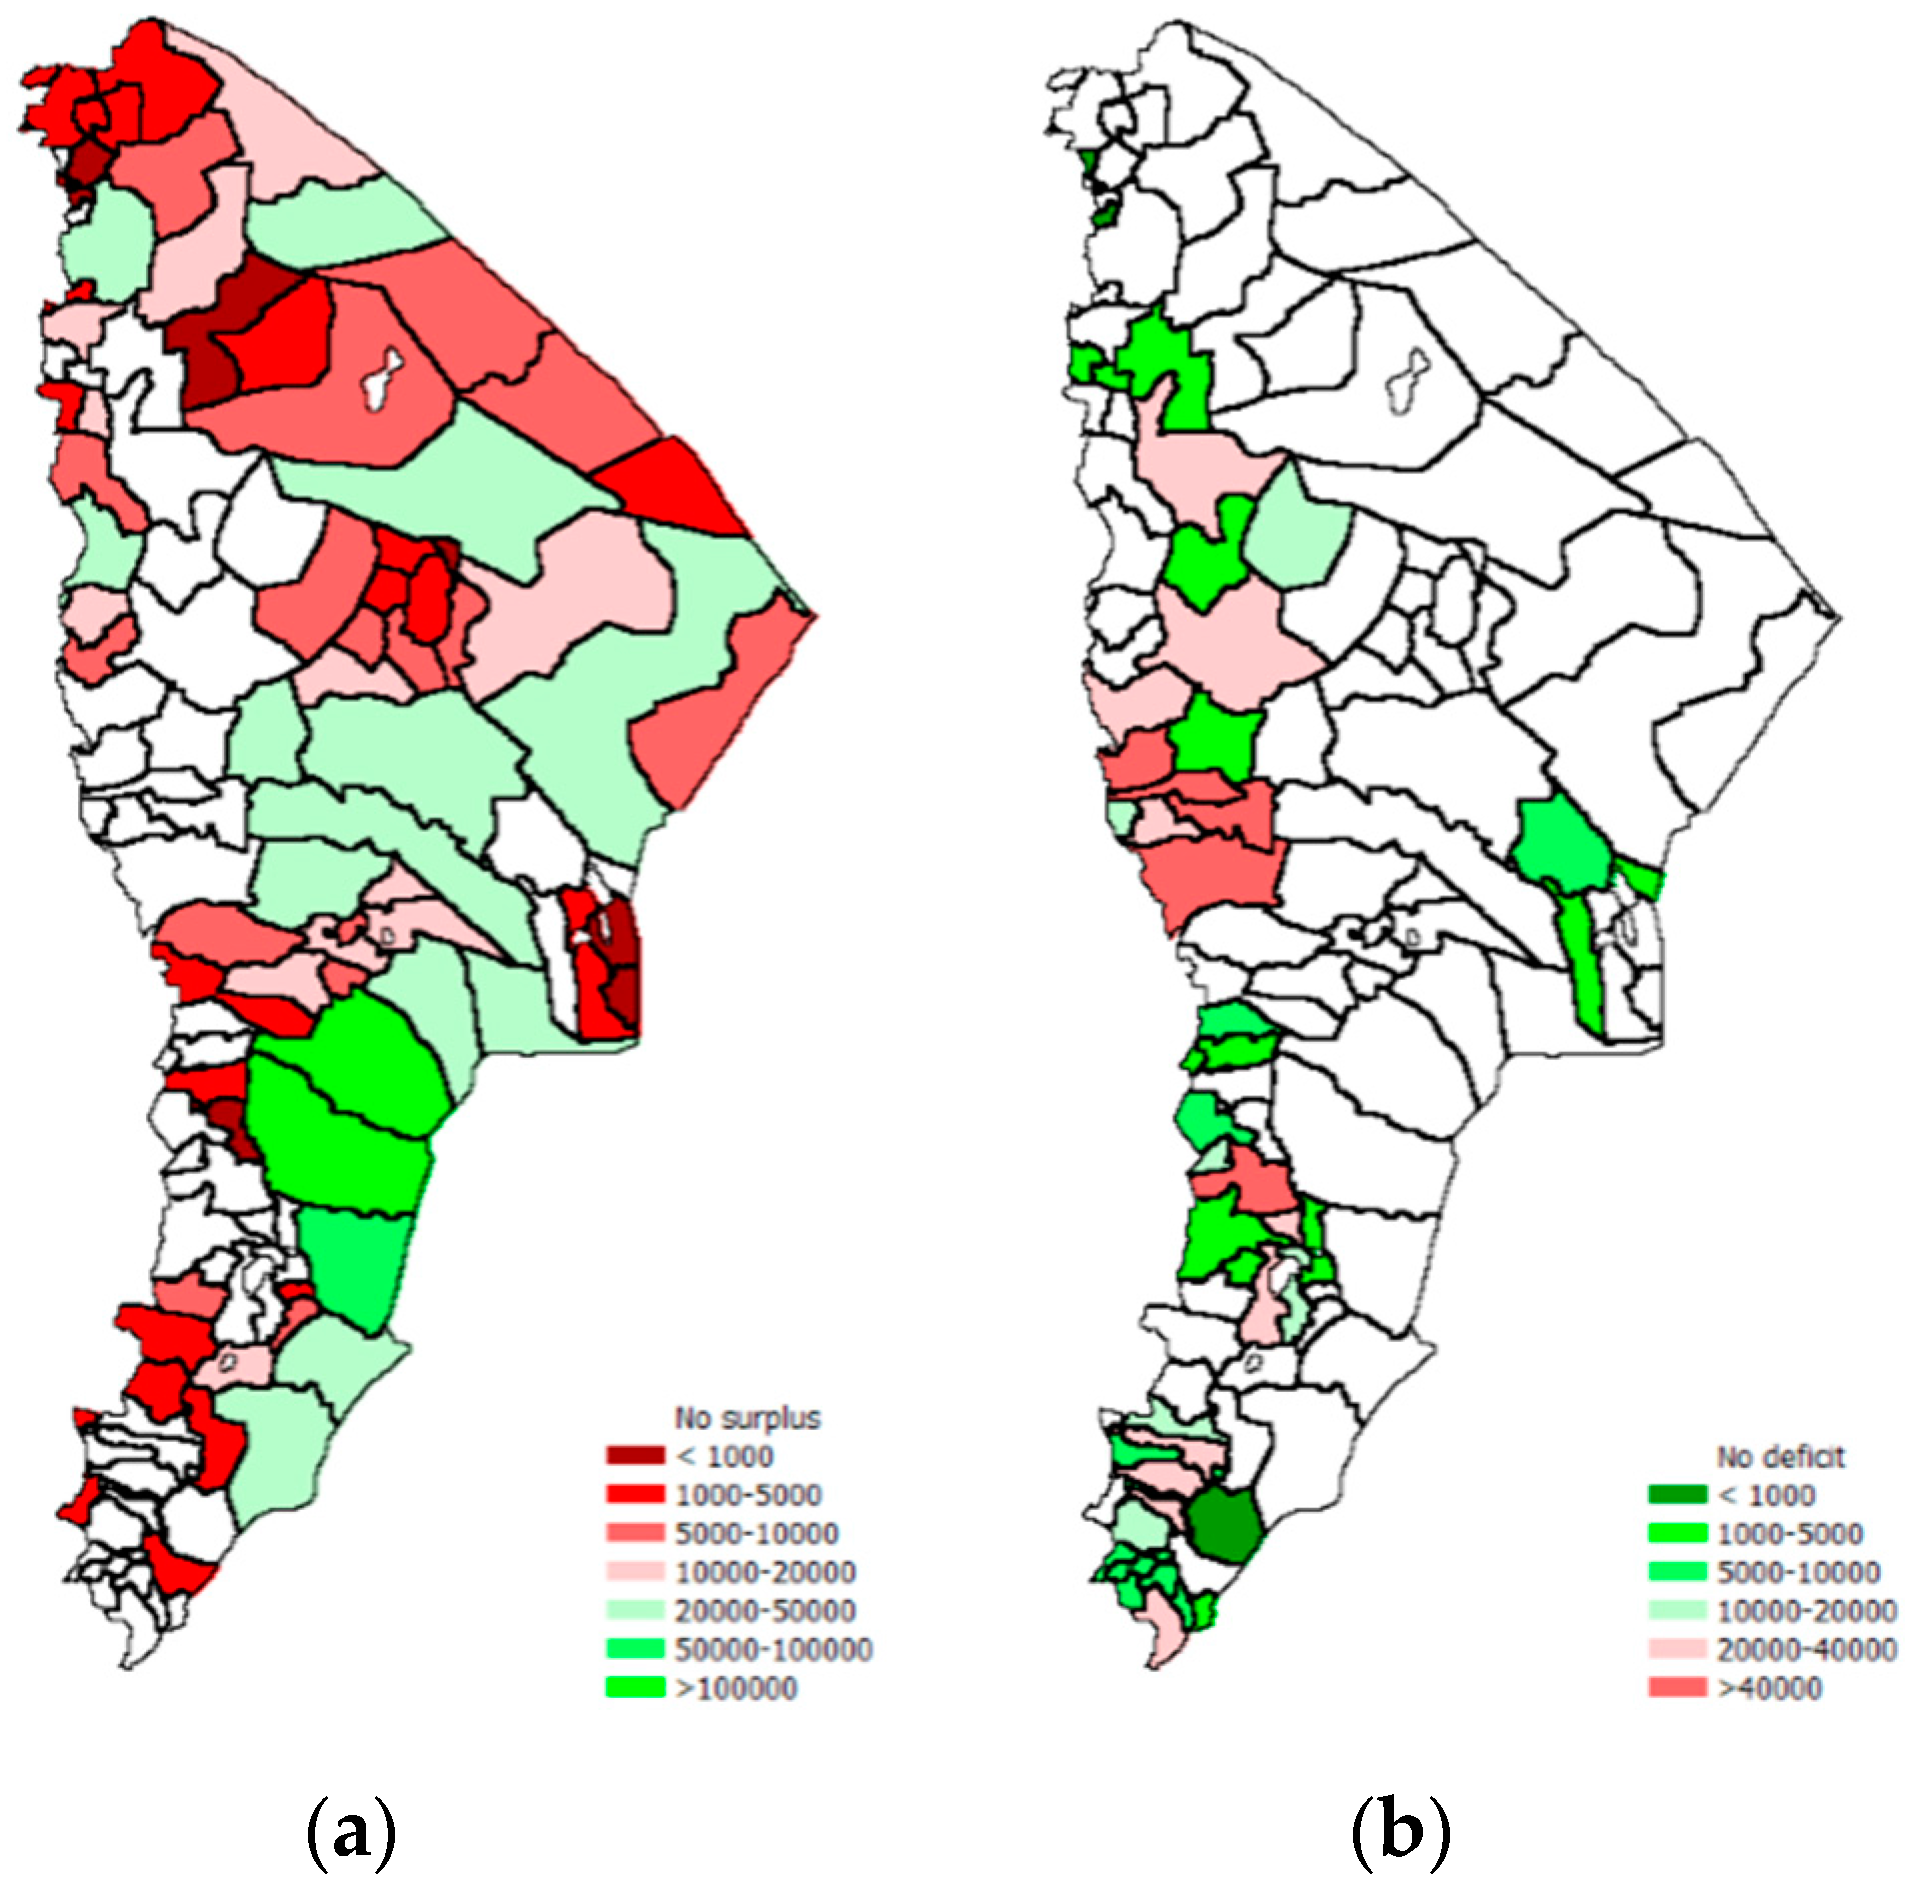
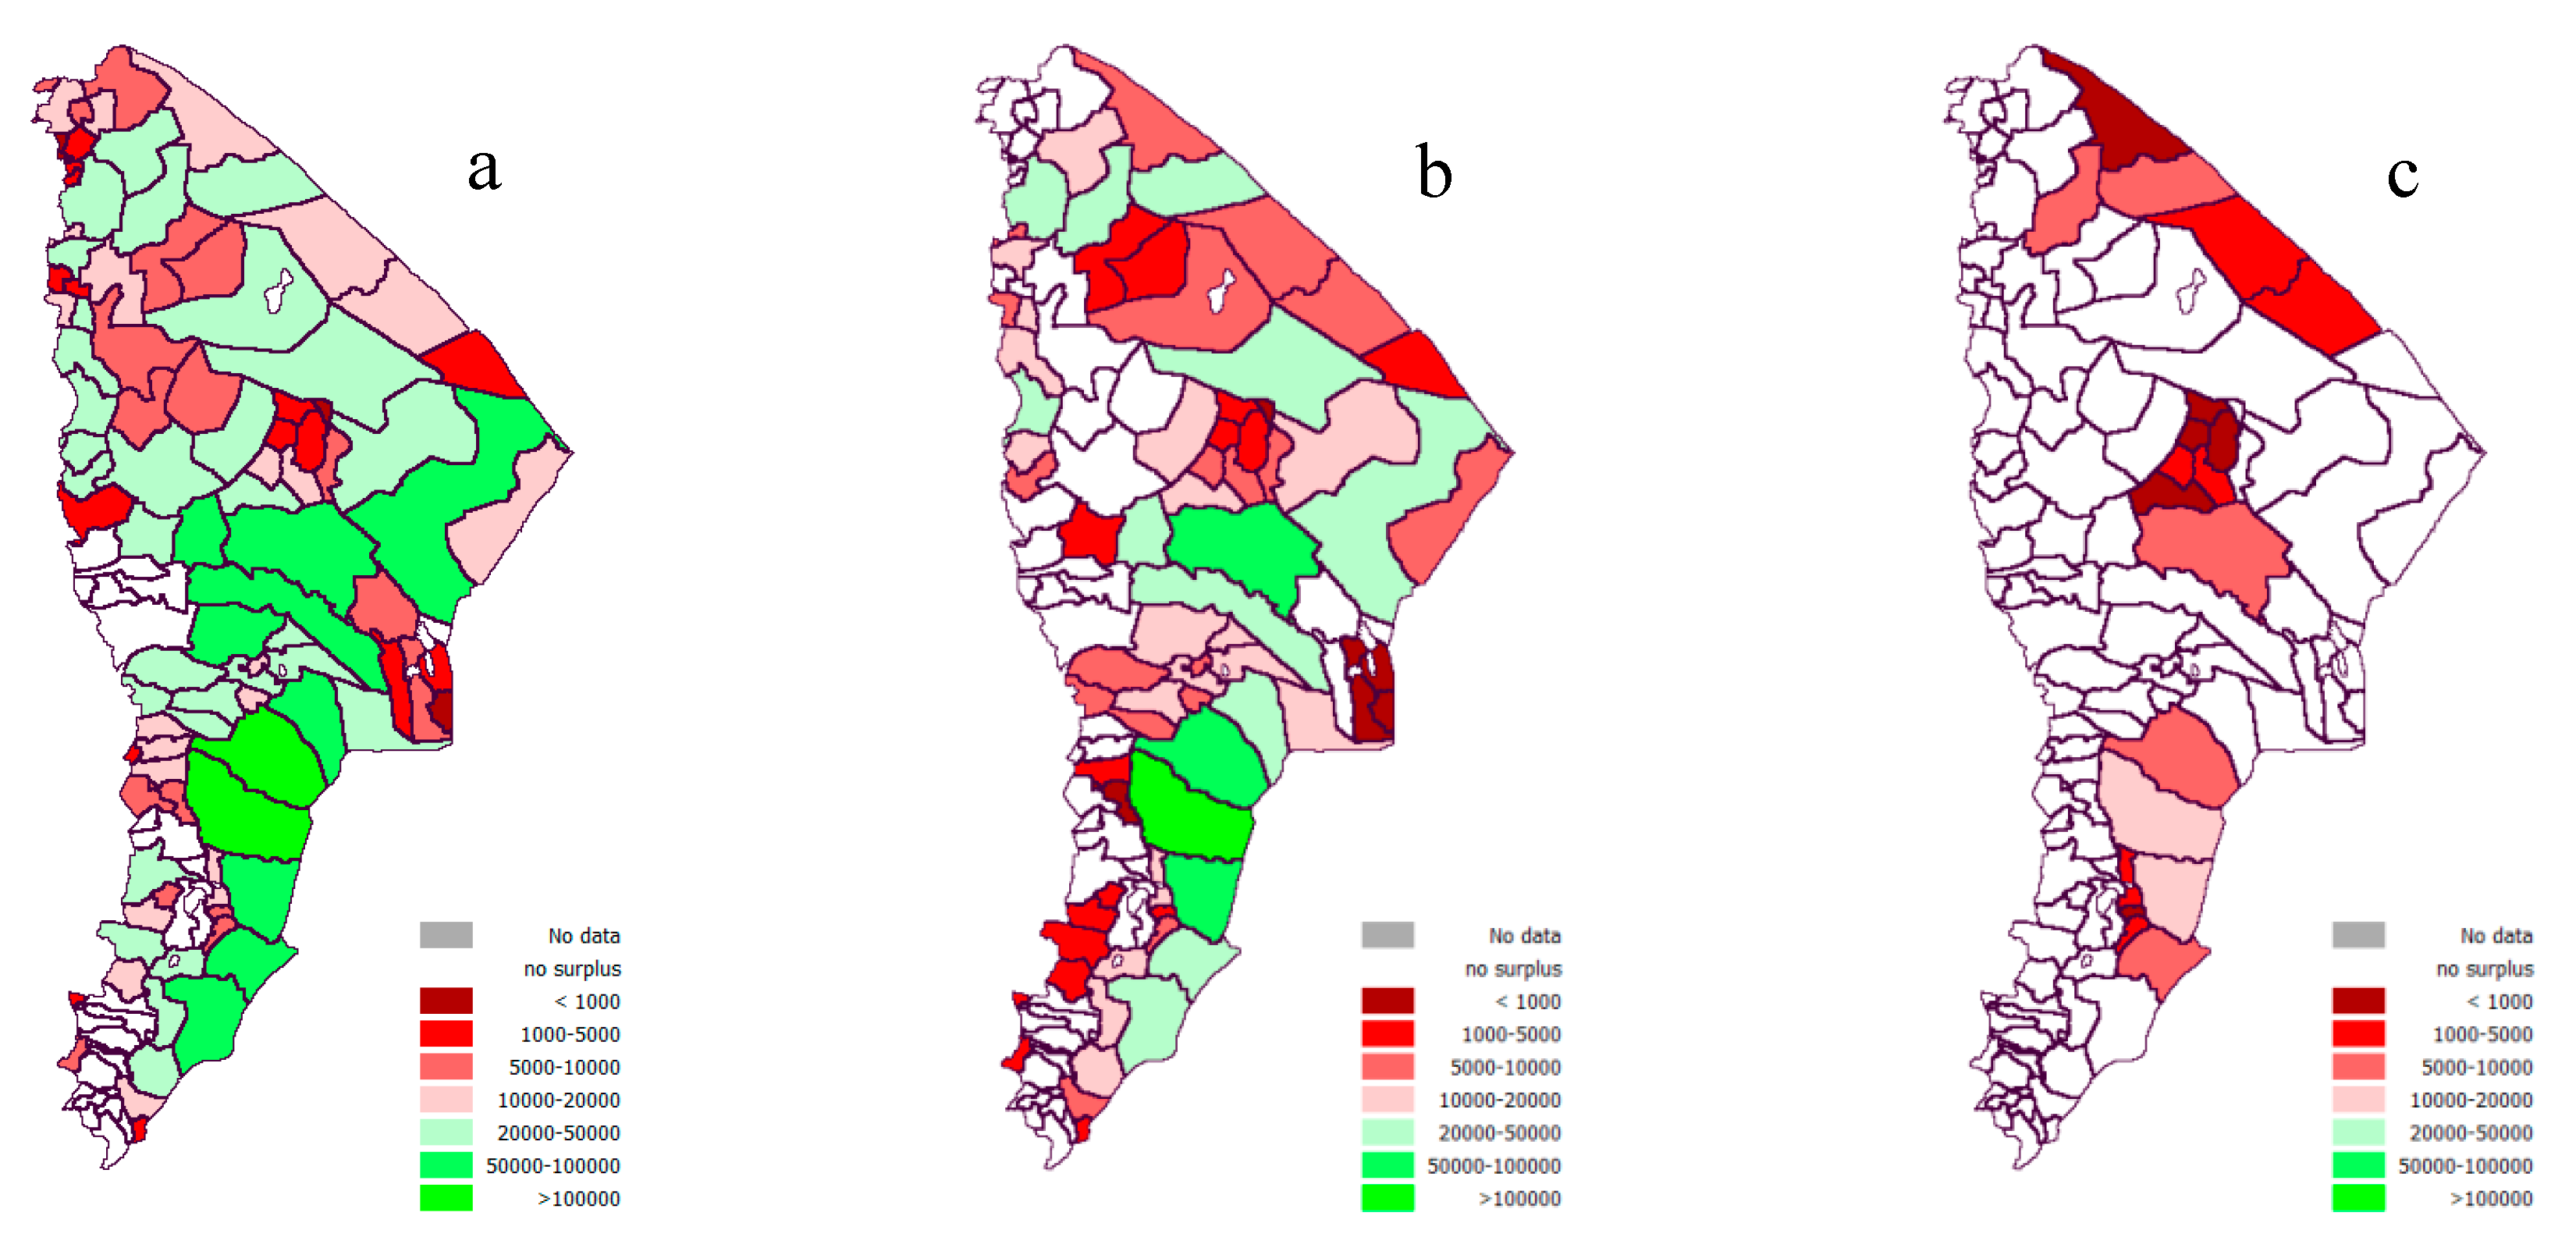
The migration model follows, simultaneously, movements of migrating herds of Afar sub-clans while accounting for the share of the herd that remains behind. The model’s geographical dimension constitute of sub-clan territories while weekly times steps over four prevailing seasons cover the temporal dimension. In this study the model highlights the pressure on natural resources by aggregating herds’ presence over the year that is confronted with estimated biomass available for grazing. This provides stakeholders with information on where local institutional constraints seem not able to regulate the use of natural resources sufficiently to prevent overuse. Below we give a formal introduction to the model.
Specification requirements of the migration model imposed on the geographical and temporal representation of migratory movements are: (1) discreteness, movements follow adjacent sub-clan map units and weekly time steps; (2) contiguity, movements cannot skip neighbors in space and time (no jumps); (3) time follows logical sequence, no movements to the past.
The model implements these requirements as follows. For an annual cycle of months indexed t = 1, ..., T, let subscripts i = 1, ..., I and r = 1, ..., R denote home and destination areas of sub-clans, respectively and variable xit the stock of animals at it (home front; the area claimed by the sub-clan). For one year we describe livestock distribution and migratory movements as:
xr’t’ = Mr’t’,itxit
where M is a square transition matrix of dimension IT × RT with elements mr’t’,it representing fraction of total herd size (xit) expressed in TLU that moves to r’t’ with diagonal elements 1 i t m r t , i t , one minus column sum of non-diagonal elements, accounting for remaining herd share at sub-clan area. Information on mr’t’,it, the share, location and timing of migrating herd of a sub-clan is derived from interviews with key persons at sub-clan level and expert knowledge from research stations and local authorities. Sub-clans stay a number of weeks in a specific sub-clan territory and then move to the next, where they again reside for a number of weeks. Stress on the resource base is quantified by confronting the fodder demand with supply. As we do not avail of a comprehensive data base on water resources we assume that water is available at the moment that herds visit the sites.
Ideally, the model would have a time-space dimension that accommodates sequential movements in time over space that follow the herd in a real-time mode. However, this is unrealistic for several reasons. First, there is no detailed information available that would allow us to follow the individual herds. Second, as argued above, fodder supply assessments are hard to obtain and are available only at the annual level. Yet, given the scope of the model—to identify where seasonal hotspots appear, we are also confident that aggregations in time and space are at a sufficient fine resolution to reveal vital patterns in herd management. In terms of assumptions made, aggregation over time implies that contiguity requirements might be violated when herds migrate across multiple sub clan territories within one week.

3. Results

In this section we start with an annual supply-demand balance expressed in TLU for each sub-clan territory, under static conditions, that is, all herds stay at their place without migration (Section 3.1). Next, for illustrative purposes we show the temporal and spatial movements for individual clans (Section 3.2). Finally, we present the results of the full model for the supply-demand balance at annual scale and analyse the seasonal variation of herd movements (Section 3.3).

3.1. Supply-Demand Balance under Static Conditions

Livestock distribution expressed in TLU on sub-clan territory without migration is shown at the left side of Figure 6 (panel a). The highest concentrations are found on the western fringes of the Afar bordering the highlands. Following the west-east line we observe a more or less uniform density with some near empty pockets in the Centre while lowest densities are reported for the North East bordering Eritrea, at least partly explained by the ongoing hostilities between the countries. The right side of Figure 6 (panel b) shows annual food supply also expressed in number of TLU that can be fed. We observe that fodder supply mirrors livestock distribution to a certain extent. The Western areas report high fodder supply while low TLU densities in the Centre correspond to lower fodder supply. Figure 7, finally, shows fodder surplus (panel a) and fodder deficits (panel b) in case of no migration. Deficits are mainly found in the western areas of the Afar where high TLU densities are found, which makes migration for these areas prominent.

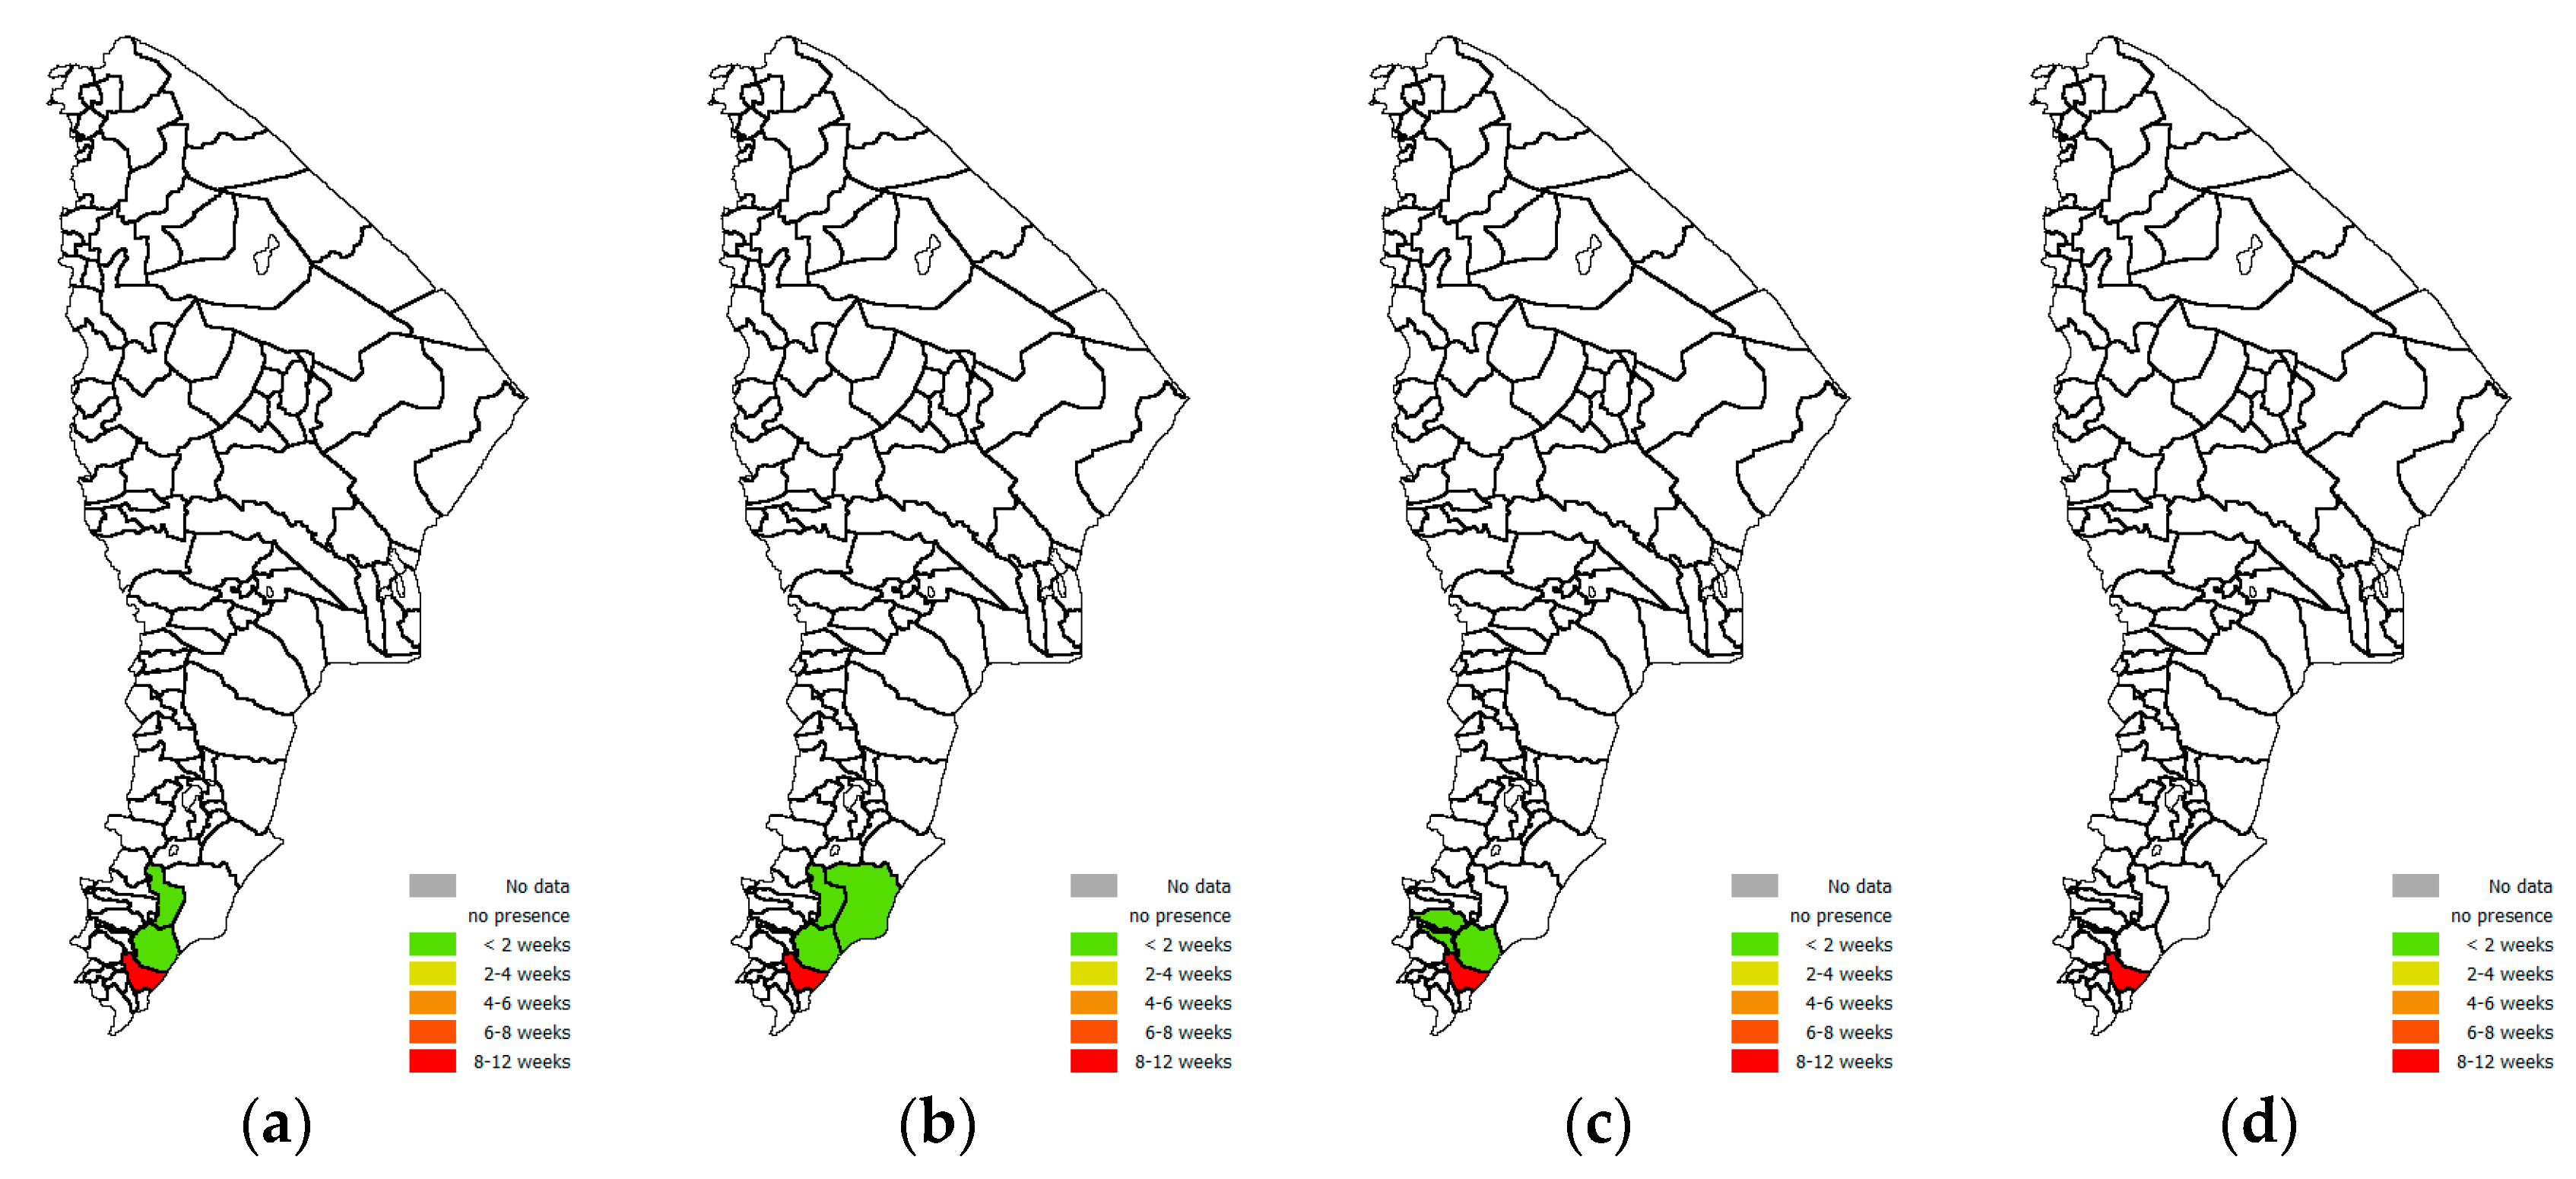
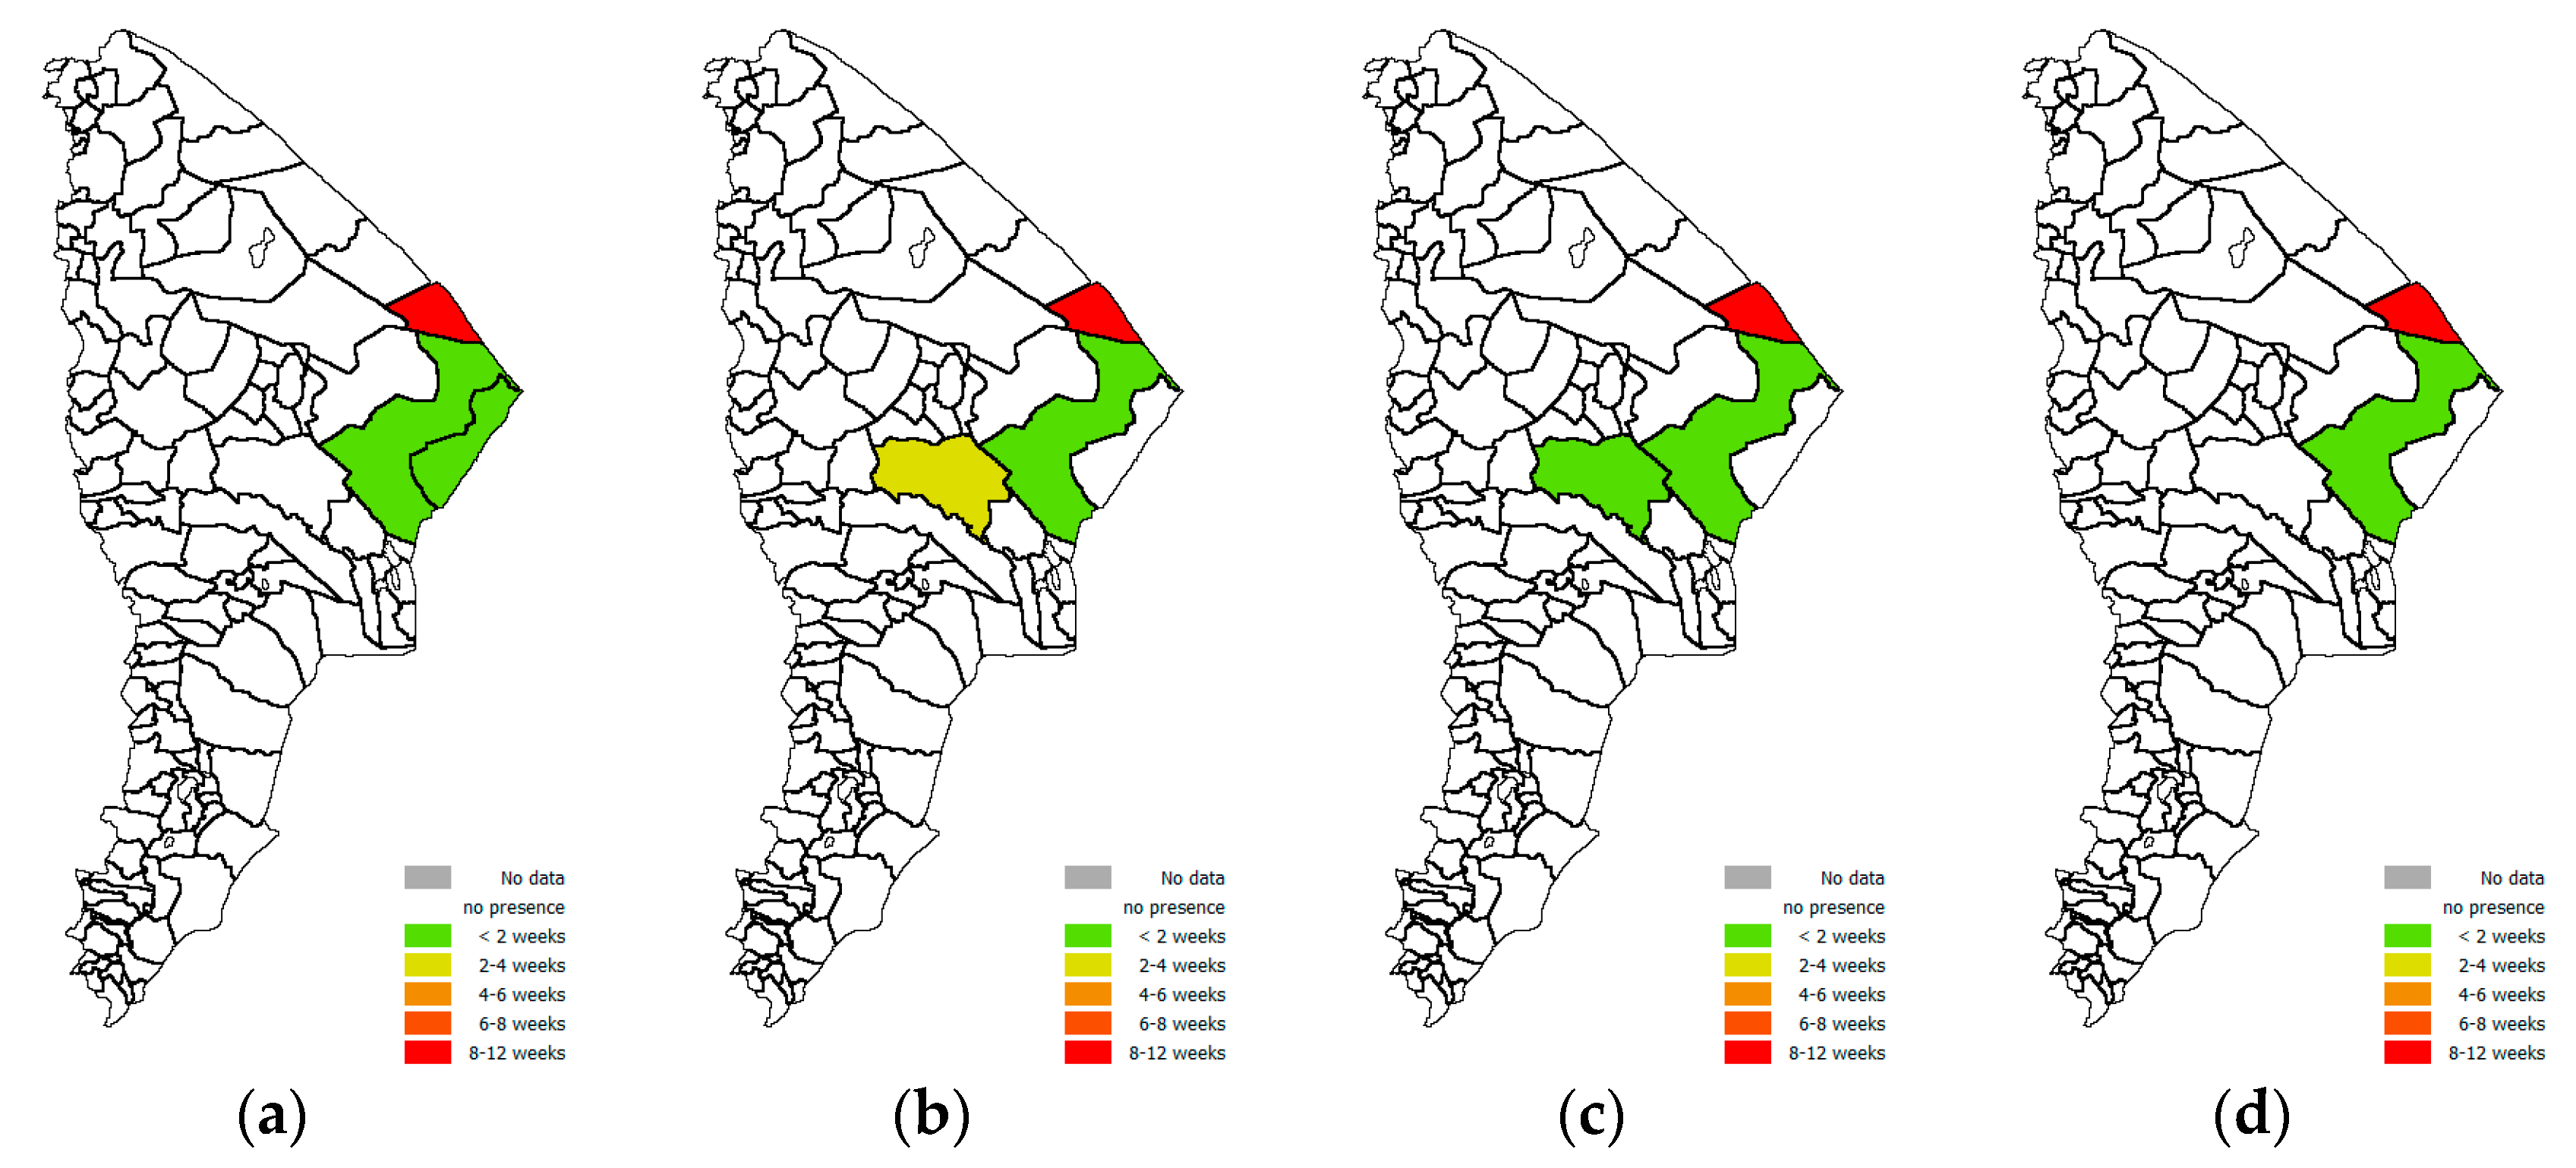
3.2. Mapping the Migratory Routes by Sub-Clan and Season

For each of the 112 sub-clans, the routes followed by their herds have been modelled by season. The four seasons in the Afar are based on rainfall activity. During the Bega dry weather prevailed, Belig is the short rainy season, Keremt the main rainy season and Tsedaye the dry spell. There are important differences between sub-clans and seasons in the number of destinations visited and duration of stay within each sub-clan territory. Figure 8 depicts migratory routes for the Harkemella sub-clan in the four seasons, while Figure 9 concentrates on the Wadijma sub-clan. In the supplementary material, migratory routes for all 112 subclans are provided.

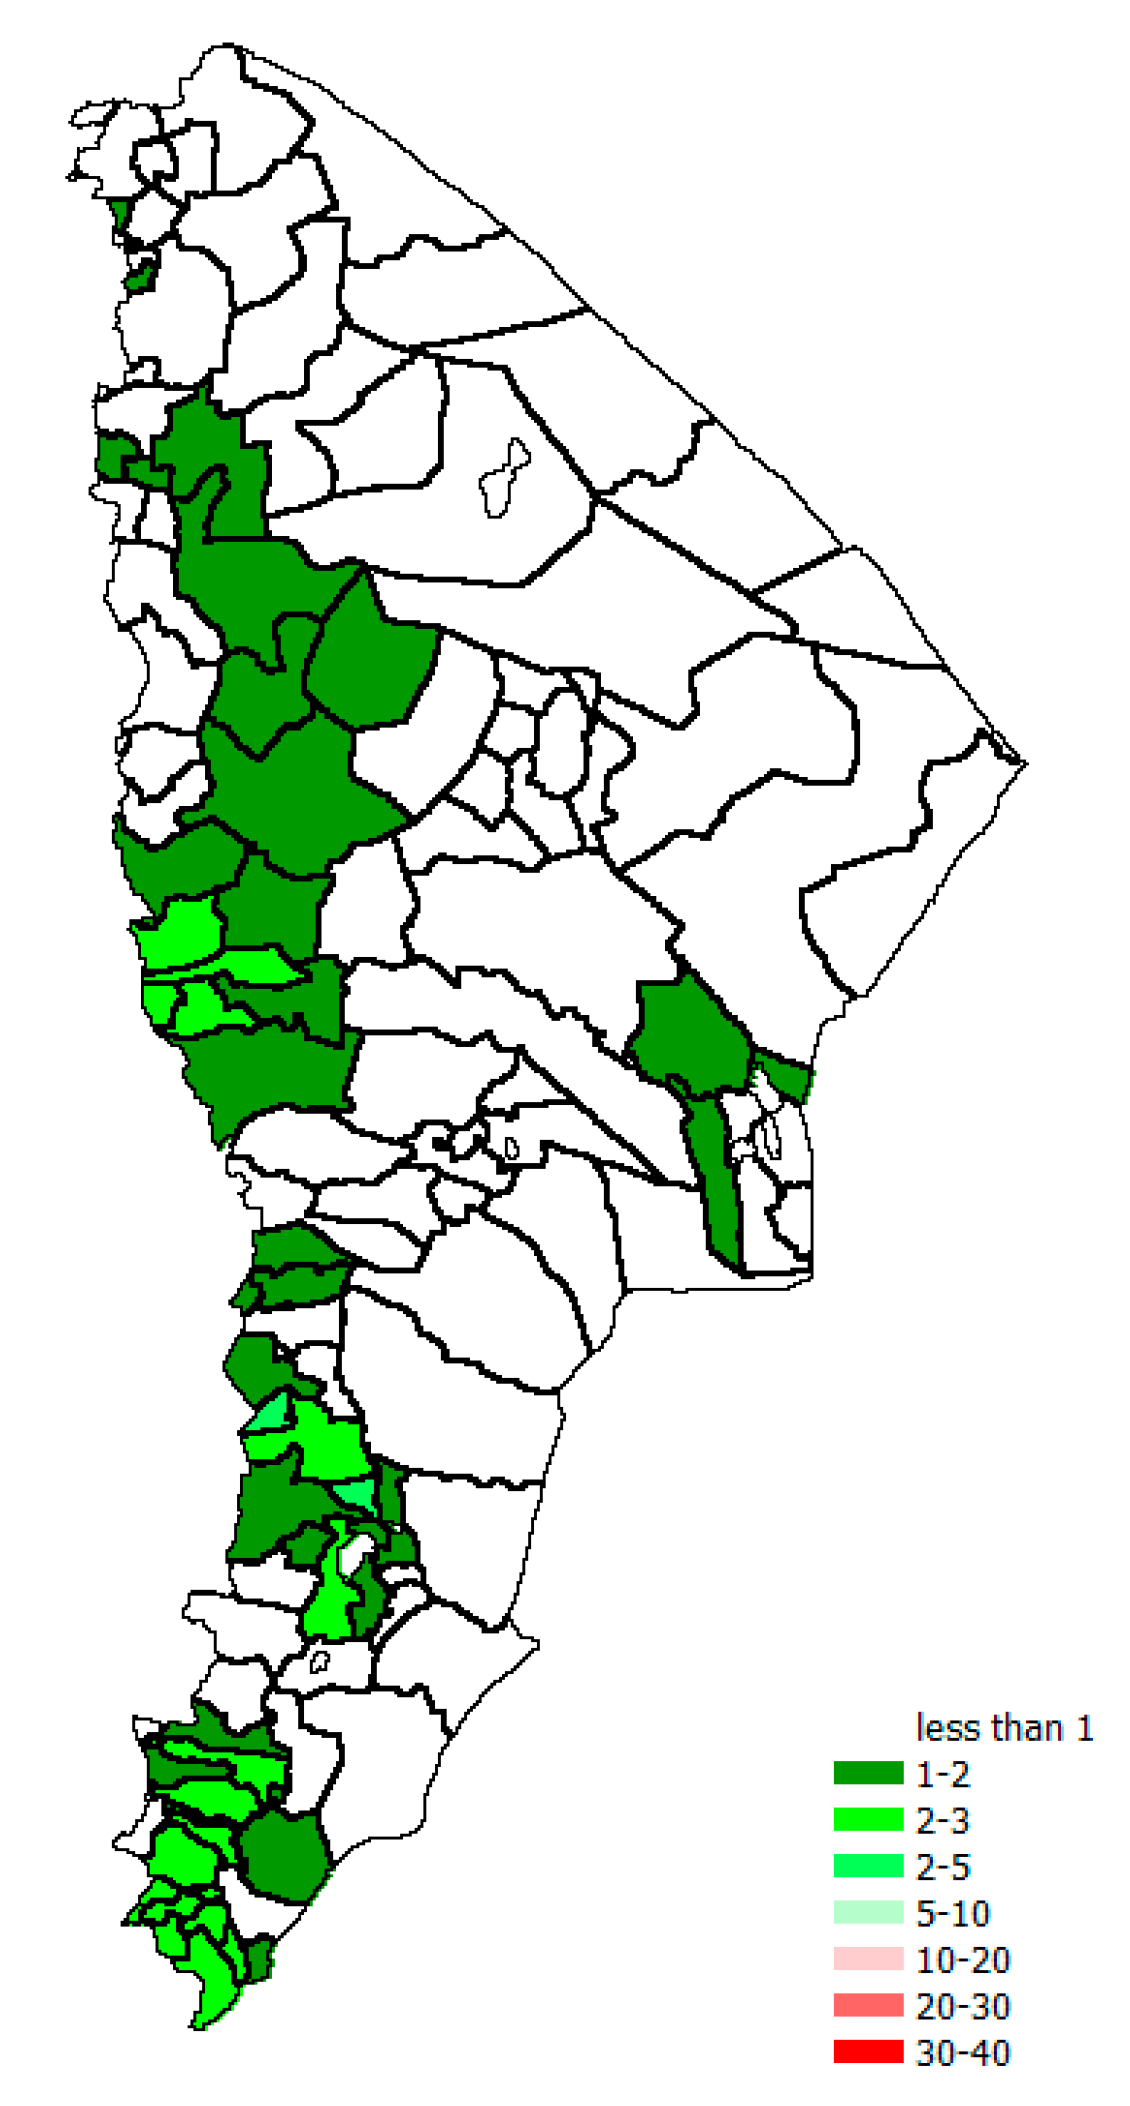
3.3. The Full Migration Model

This section presents the results of the full migration model when all herds simultaneously migrate. Compared to the static situation (left side of Figure 6; panel a) we observe that at annual level the number of livestock after migration (left side of Figure 10; panel a) follows a more or less similar pattern. When zooming in on surpluses and deficits (left (panel a) and right (panel b) side of Figure 11), some special effects come to the fore. After migration, the deficits in the Northern Part are dissolved, the Central part, though, shows higher deficits. Going to the South we see a general decrease in deficits in areas and magnitude after migration.
Figure 12 shows the ratio of livestock demand over fodder supply which confirms the earlier detected patterns of fodder deficits in the Western part. We define ‘hot spots’ areas where demand is two to three times larger than supply.
As our estimates on fodder supply are at the annual level we have to forgo a comparison of seasonal fodder demand-supply ratios. Yet, to obtain a seasonal assessment of hot spots it is interesting to compare the herd movements per season where it can be analysed which areas are visited most and which places are avoided. Figure 13 shows herd presence in case of no migration with seasonal movements during the Belig (a), Keremet (b), Bega (c) and Tsedaye (d) season. Remarkable movements are seen in the blue circle, where during the Belig and Keremet a concentration of herd presence is observed which drastically is reduced during the Bega and Tseday. The red circle also shows much activity, during the Belig high concentrations are found in the upper part while decreasing in the Keremet and Bega season, and then again increasing in the upper part during the Tsedaye. This is related to the substantial differences between the part of the herd that remains behind and the migrating share (Table 7).
Table 7 illustrates that there are also substantial seasonal differences between the part of the herd that remains behind and the migrating share. In the Keremet season, half of all herds are included in migratory movements, while in the Tsedaye season, over 90% of herds remain in their sub-clan territory. Anecdotal evidence suggests that the part of the herd that remains behind is made up of animals that are not yet able to join the migrating herd. The very low percentage of migrating herds in the Tsedaye (spring) season would be consistent with the assumption that new-born animals and their mothers stay behind.

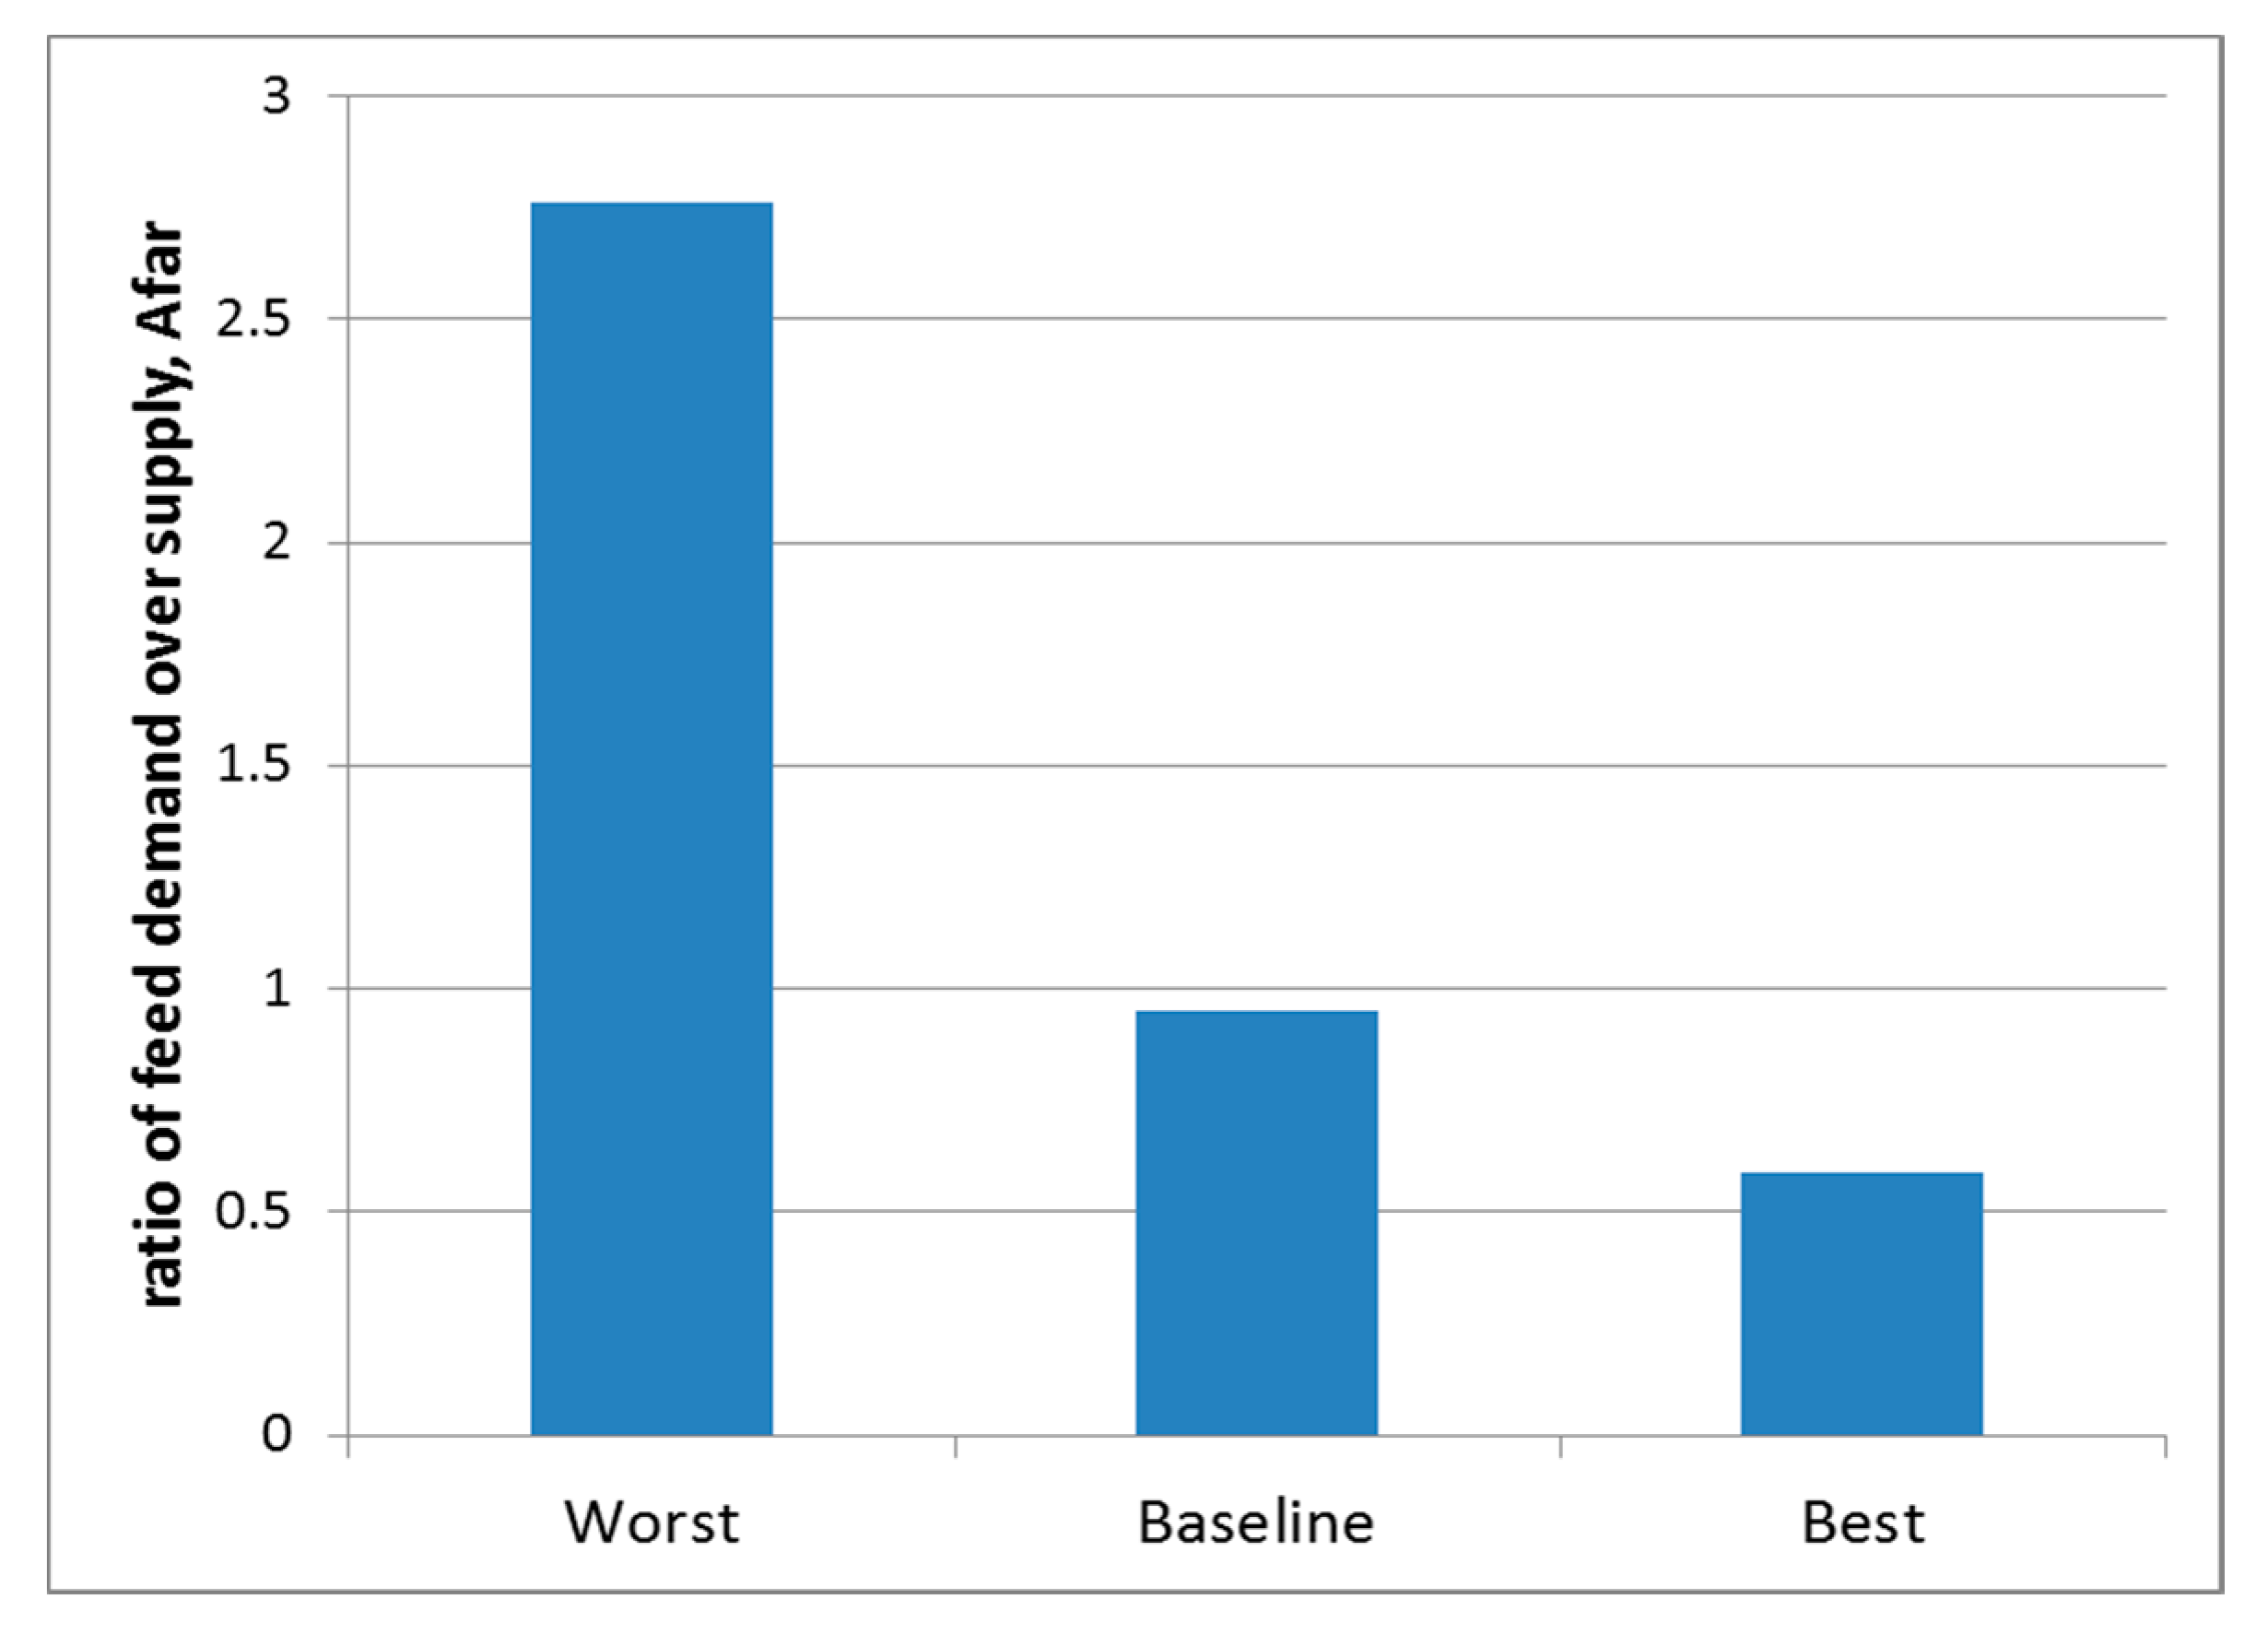
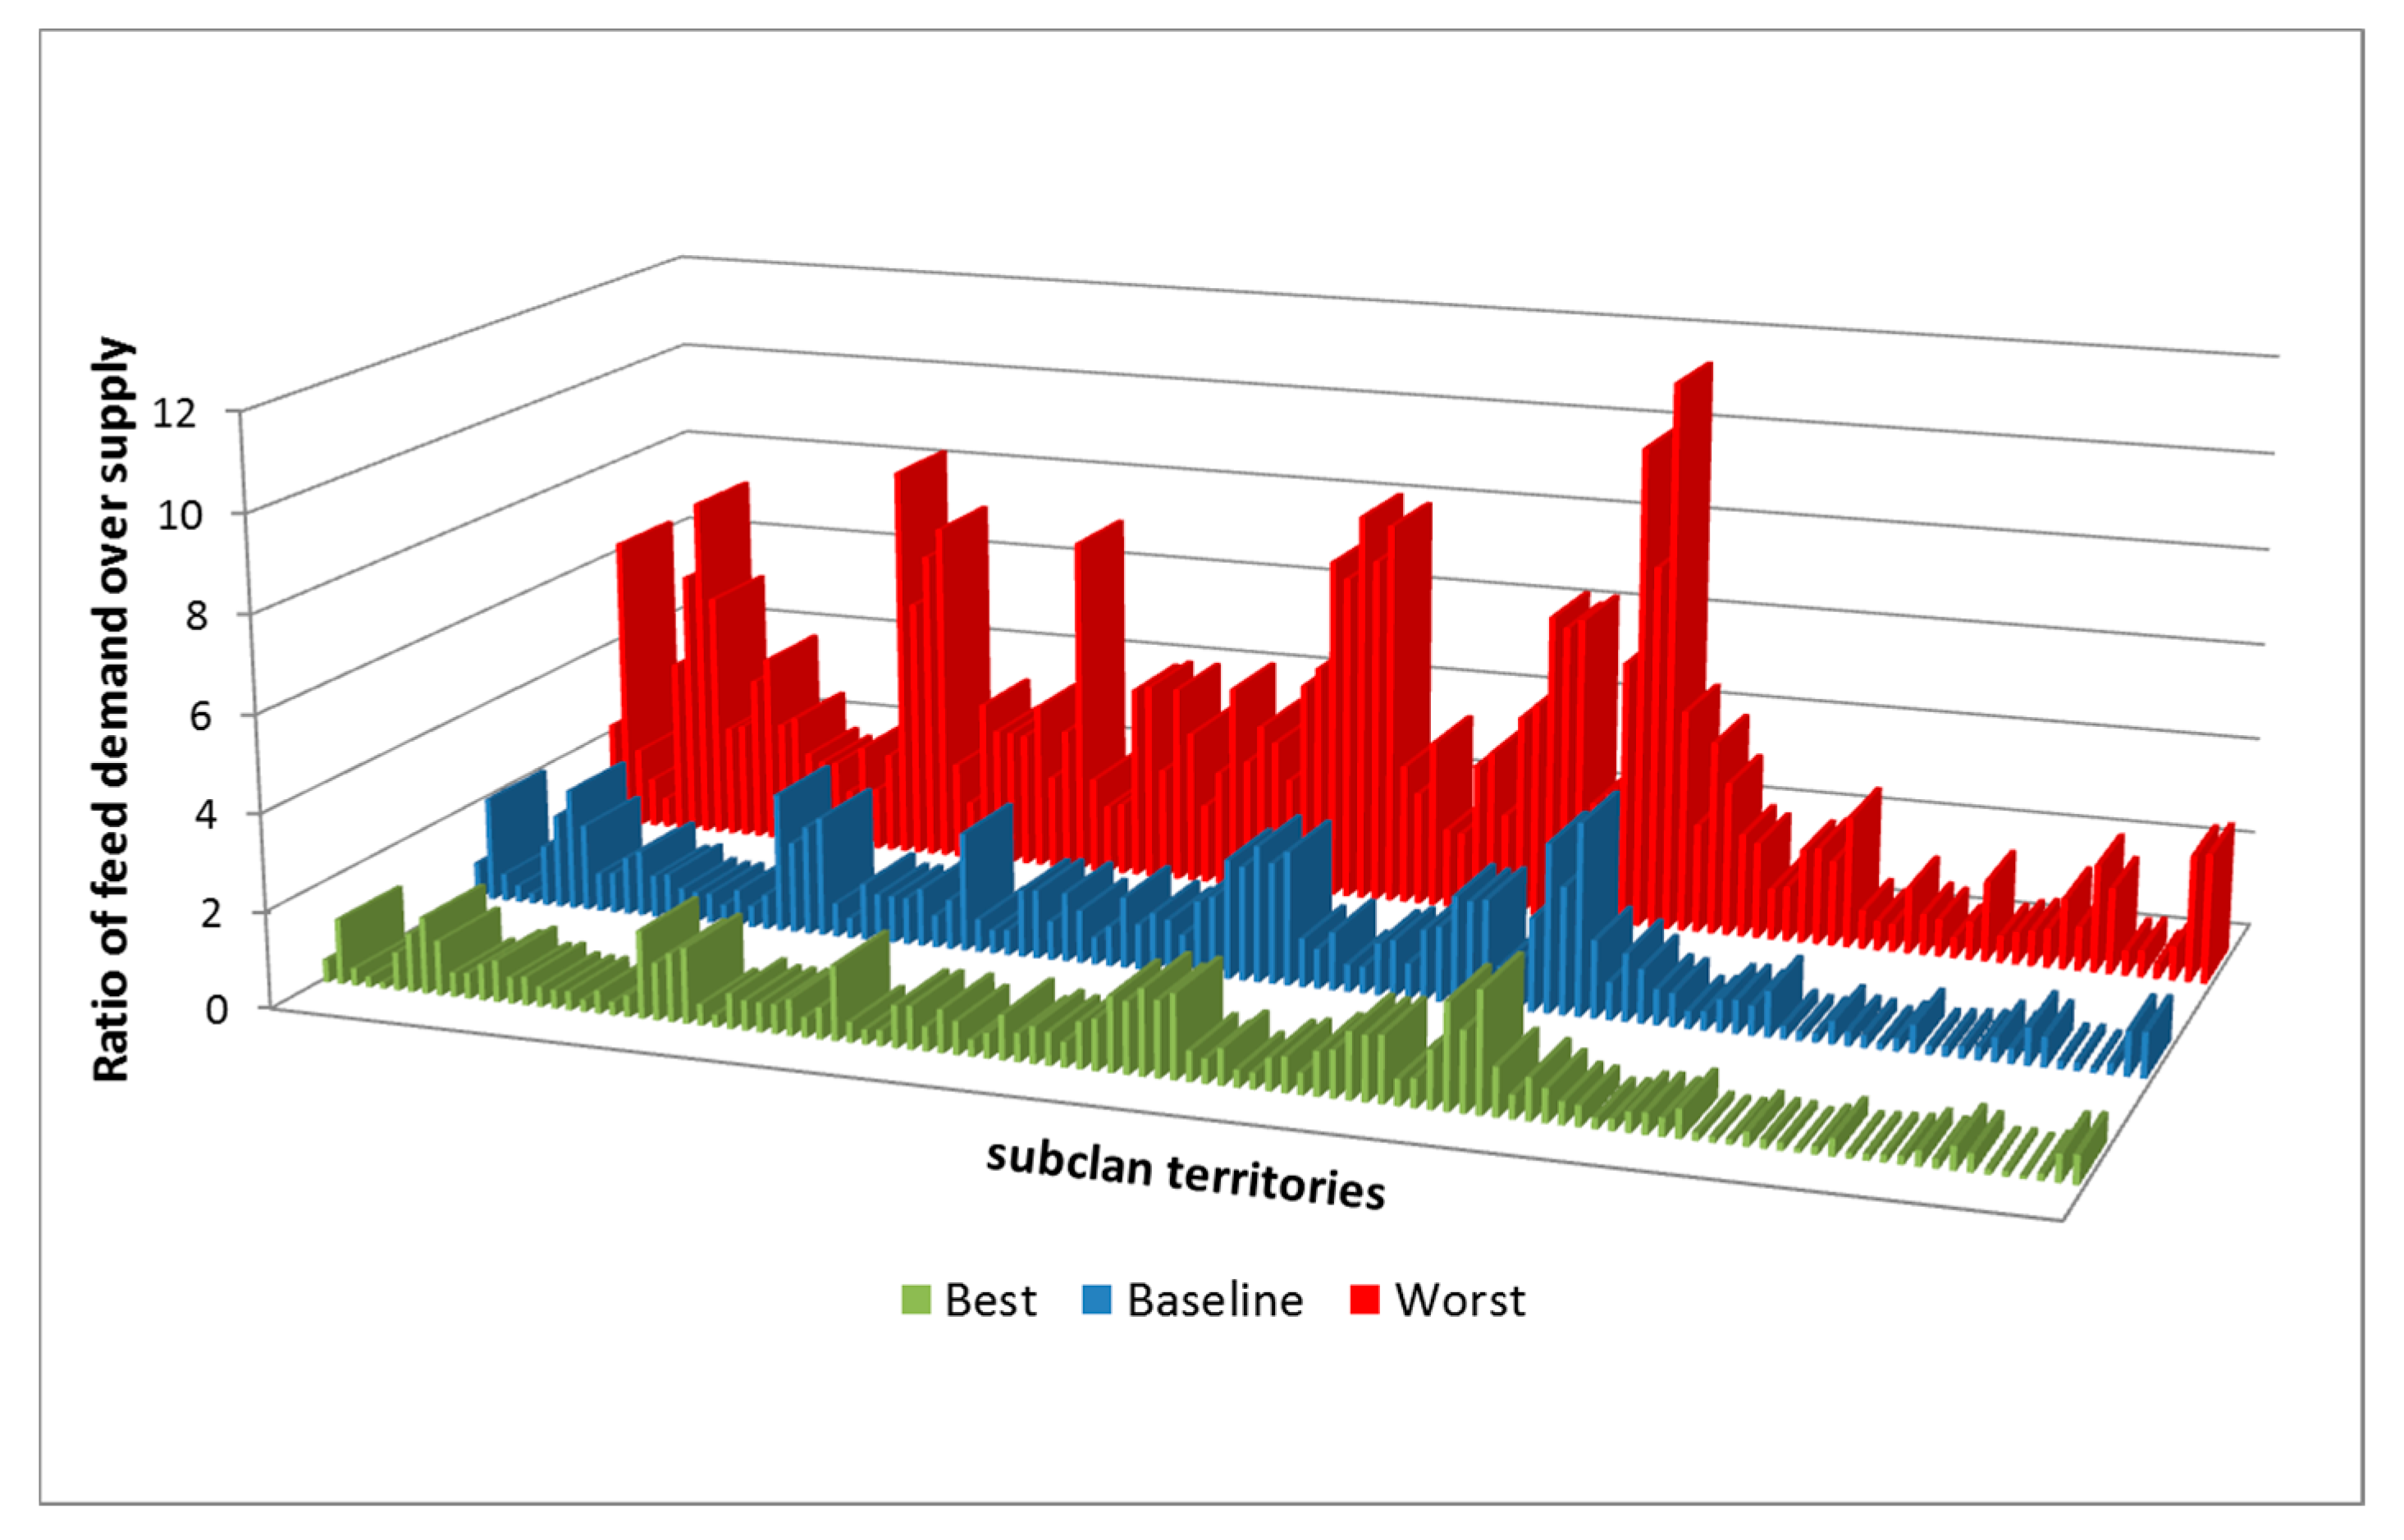
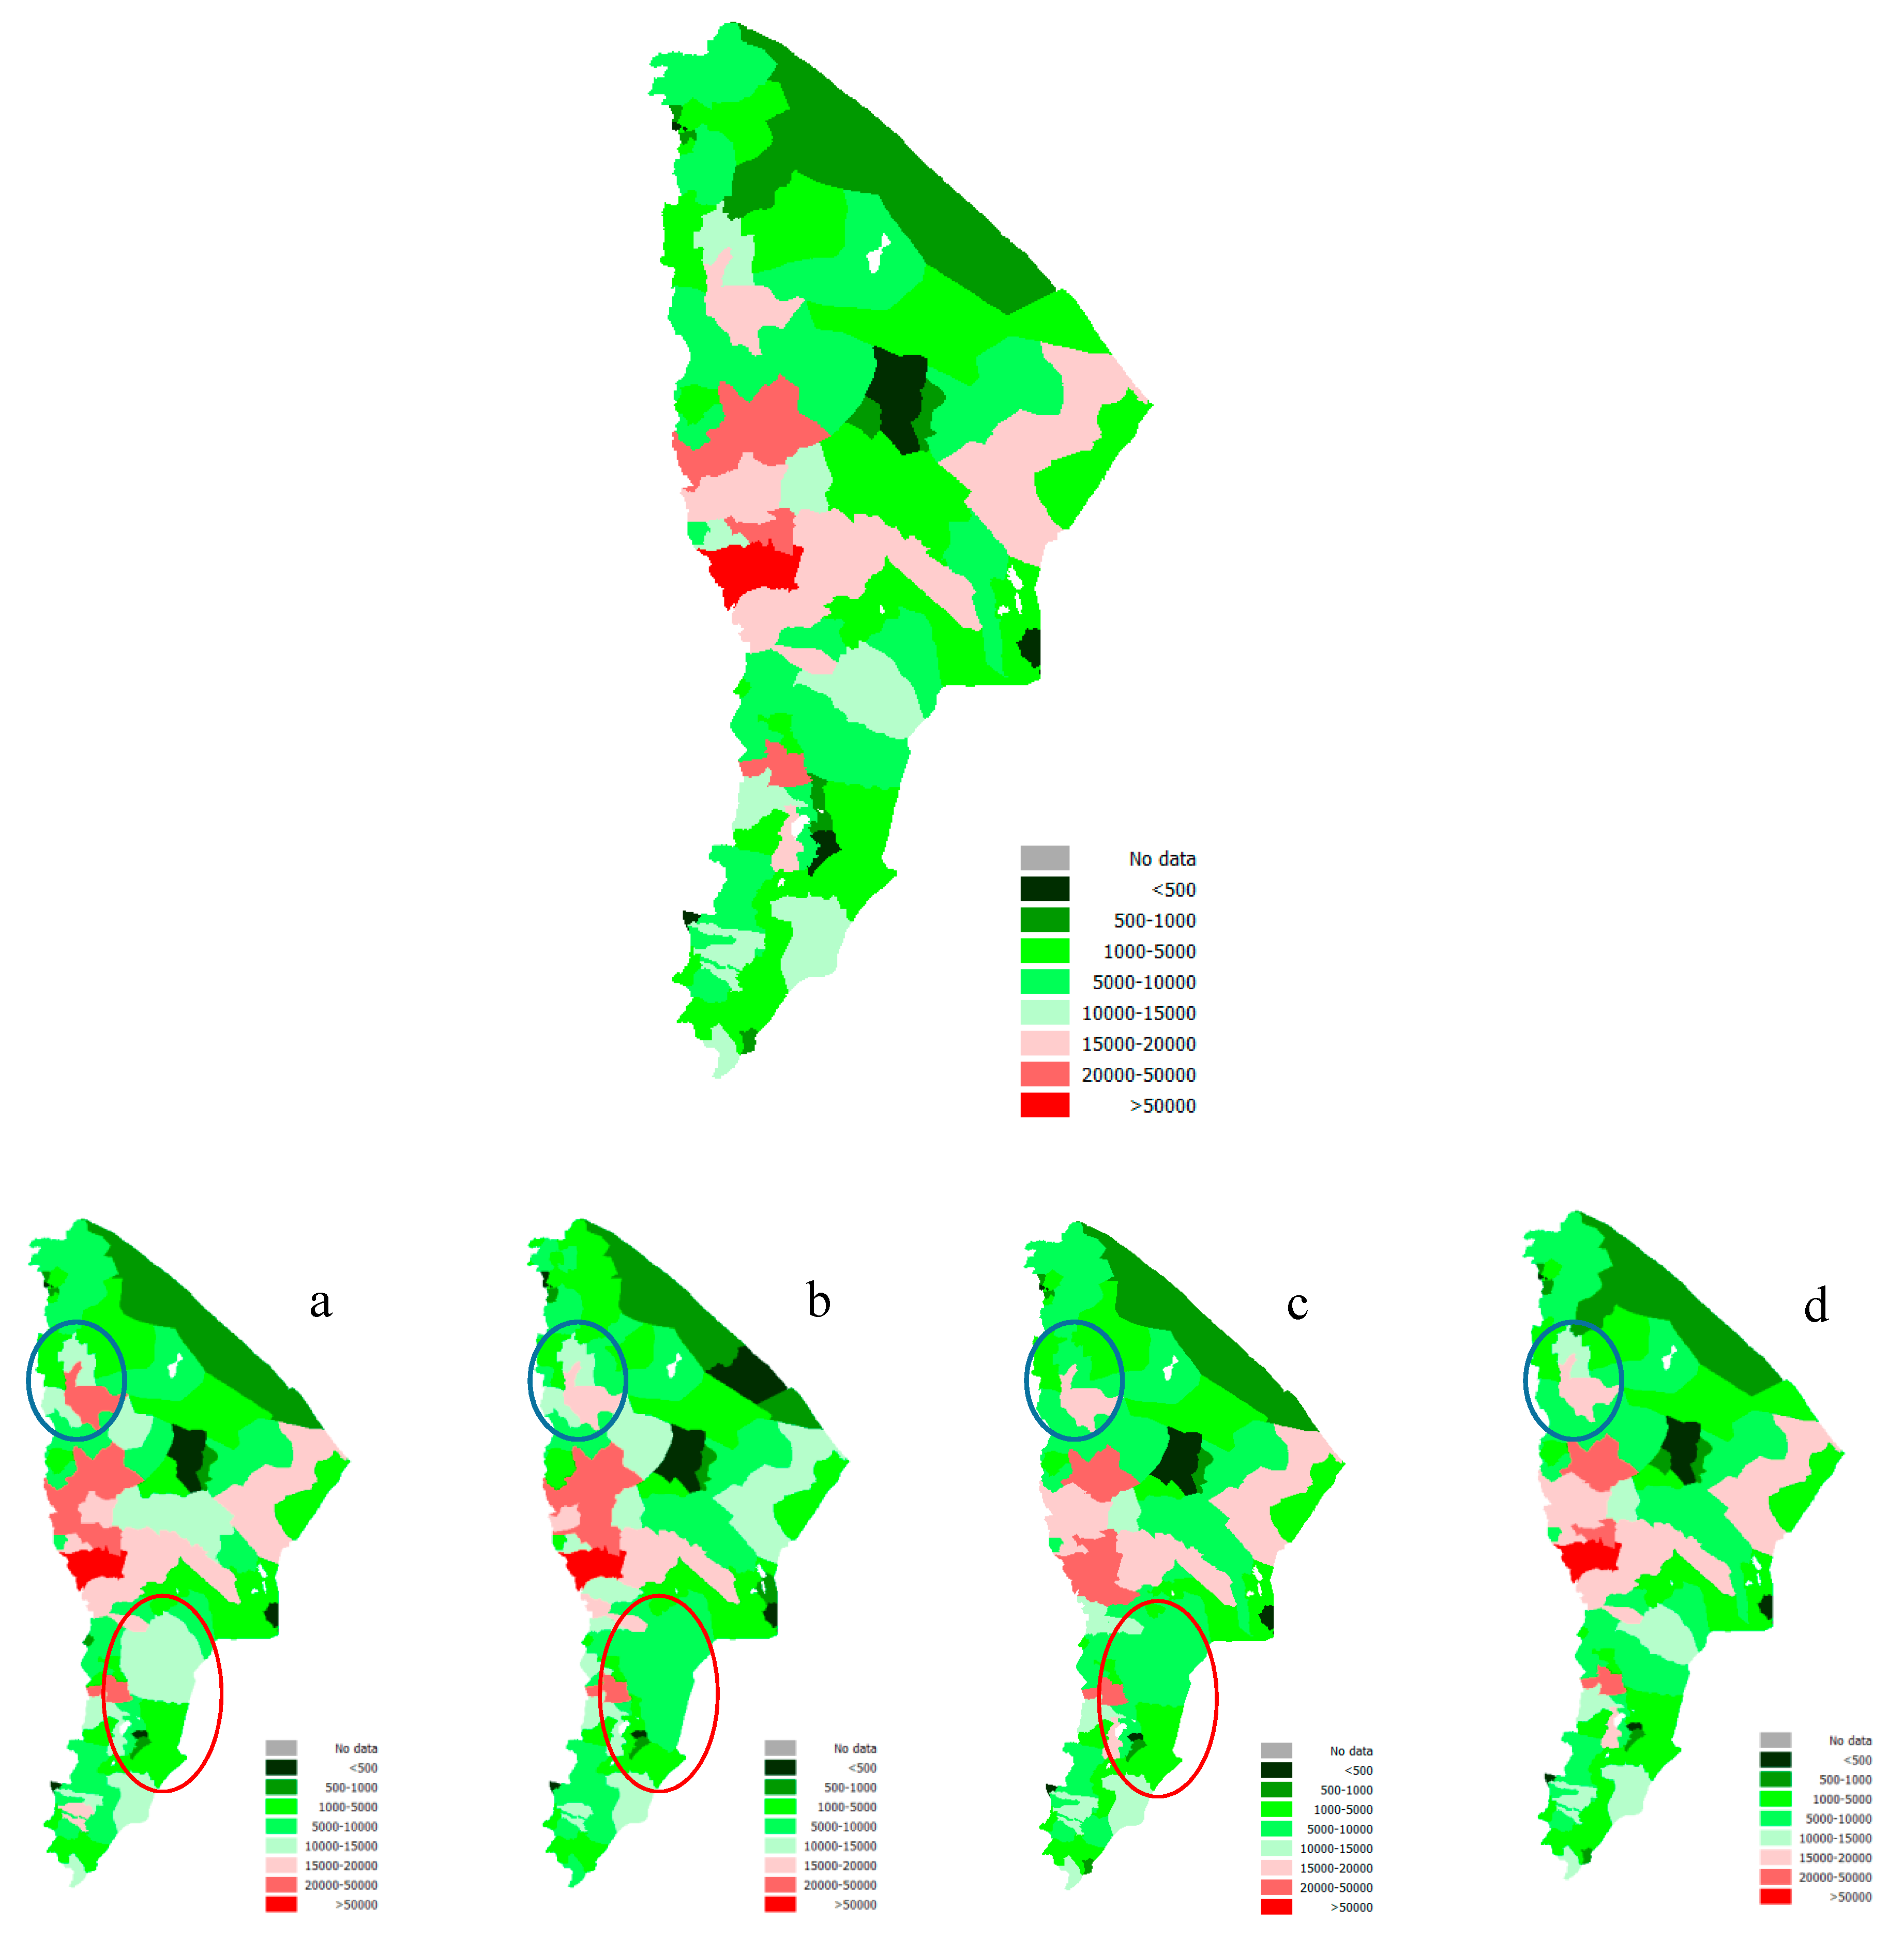
4. Sensitivity Analysis

In this section we analyze the sensitivity of our assumed parameters on the identification accuracy of hot spots. We analyze the sensitivity for production assessment, livestock distribution, and forage consumption per TLU and relate these to the ratio feed demand over supply. Specifically, we use the highest and lowest estimates for total herd size (in TLU) from the different data sources, dry matter availability (in ton) using the highest and lowest production function estimates, and conversion rates from dry matter to TLU. Combined with the assumed values used in the baseline, this leads to 27 scenarios (one of which is the baseline itself), described in Table 8. Here, the ‘low’ estimate for total herd size is 2,491,037 TLU [67]; ‘high’ estimate is 3,662,078 TLU [64]. For total dry matter availability, the ‘low’ estimate is 3714 thousand ton [52] while ‘high’ equals 9652 thousand ton [55]. For TLU conversion the ‘low’ estimate equals 2.2 MT dry matter per year [71], while the ‘high’ equals 2.7 MT dry matter per year [52]. Base values are as described in Section 2 above.
Results of all scenarios are available on request. Here we present the results on the ‘Best’ scenario where TLU assessments are low, fodder estimates high and fodder consumption by TLU low, the ‘Baseline’ scenario, referring to results reported in Section 3, while the ‘Worst’ Scenario has highest TLU, lowest fodder assessment and high fodder consumption by TLU.
Concerning the results of the corresponding feed demand over supply ration for the Afar at provincial level we depict the outcome in Figure 14. We observe that, especially, the ‘Worst’ scenario is very sensitive for negative outliers and results in serious deficits, state wide.
Outcomes of the scenarios by sub-clan territory are presented in Figure 15, where the baseline, the worst case outcome and the optimal outcome are depicted for each of the 112 sub-clan territories. We observe that the ‘Best’ and ’Baseline ’ scenarios are more or less the same with absolute differences oscillating between 0.04 and 1.51 with average difference 0.42. Differences between ’Baseline’ and ‘Worst’ scenarios are much larger, varying from 0.02 to 7.5 with an average of 2.09. Magnitude of feed surpluses and deficits for the three scenarios are illustrated in Figure 16 and Figure 17, respectively. In the ‘Best’ scenario, surpluses are found in all sub-clan territories except for some areas in the Centre bordering the Highlands, where feed deficits all fall in the first class. The ‘Worst’ scenario shows some surpluses in the areas in the North East, bordering Eritrea, in the South-East near Somali Province and near the capital Semera. Yet, the amount of areas with deficits is alarming especially for the Central part of the Afar where deficits classes fall into the highest categories.

5. Conclusions

Using a migration model to represent herd movements over time and space, we found in most of Afar State a reasonable balance between annual fodder supply and demand. Most areas show a small surplus, except for the Western part of the Afar bordering the foot of the Highland slopes where in ‘hot spots’ demand exceeds supply by a factor two or three. The results may support the argument that by and large institutions that regulate the time and duration of visits of Afar pastoralists to other sub-clan territories favor the development of arid areas by maintaining a balance between demand and supply of fodder and water resources. All of the sub-clans practice migration mechanism though we found considerable differences in share of the herd that migrates and the distances that were covered by the various sub-clans. By itself the results of this study-dispatch an important message to local and regional authorities in that migration is needed for sustainable development of the Ethiopian dryland and that negative effects of land developments that interfere with traditional patterns should be minimized. For example authorities could guarantee safe corridors for pastoralists through planned biofuel plantations and the large sugar cane farm near the Tenaha dam.
Our research is a clear step forward in the impact analysis of migration patterns on the sustainable land development. The simultaneous evaluation of the presence of livestock in its spatial and temporal dimension gives an accurate representation of reality and allows policy makers to target their intervention geographically to support drought coping strategies of the pastoralists such as the design of the best spatial configuration of a system of groundwater pumps and forage storage points. When such “enclaves” are well regulated they could help pastoralists through dire periods and avoid overgrazing and land degradation of the few areas that are not yet affected by drought.
Yet, this study also showed that still large data gaps exist and much ground truthing need to be done to complete a sound empirical basis. A consolidated data base with detailed information on trekking routes, biophysical resources, land uses, market prices, conflict zones, household/pastoralist surveys, and narratives on coping strategies in appropriate spatial and temporal dimensions. The collection of these data at the appropriate level and its organization in a dynamic modelling environment is a big scientific challenge in the coming years.
Several improvements of the migration model are envisaged. First, using satellite information on start and end of season allows assessing seasonal variation of feed demand and representing fodder supply at a higher spatial and temporal resolution. A follow up study is planned to refine the Second, adding availability and access to water resources, a vital element will improve the explanation of migrating routes. Third, introducing prices and bringing the model under an optimization framework maximizes herders’ income under various scenarios like alternative routings, climate change effects and improved rangeland management. Fourth, and finally, combining the model outcomes with results of a survey held among 180 pastoralists will deepen the understanding of regulations and agreements between sub-clans on sharing of common resources and indicate where institutional support can strengthen the resilience of Afar pastoralists to cope with the new challenges.

Acknowledgments

Authors gratefully acknowledge the financial support for this study from the OPEC Fund for Development under the grant R279 ‘Improving Pastoral System’s Drought Resilience in Afar State, Ethiopia’.

Author Contributions

B.G.J.S. Sonneveld, project coordinator, involved in modelling and final editing, C.F.A. van Wesenbeeck involved in editing and modelling of migration scenarios. M.A. Keyzer, project leader, involved in editing and modelling of migration scenarios. K. Georgis, involved in editing, project design and supervision of field work. F. Beyene involved in project design, editing and supervised field work. F. Urbano, M. Meroni and O. Leo, were involved in biomass assessments and editing. M.K. Yimer prepared the sub-clan map, was involved in identifying migration routes and editing. M. Abdullatif was involved in preparation of sub-clan map, prepared information on migration routes and was involved in editing.

Conflicts of Interest

The authors declare no conflict of interest.

Appendix

Scatter plots of relative number of heads for camels (panels A1–A3) (Figure A1), cattle (panels B1–B3) (Figure A2), sheep and goats (panels C1–C3) (Figure A3), equine (panels D1–D3) (Figure A4) and TLU (panels E1–E3) (Figure A5) for CSA03 against REGA08 (panels A1, B1, C1, D1 and E1), CSA03 against REGA13 (panels A2, B2, C2, D2 and E2) and REGA08 against REGA13 (panels A3, B3, C3, D3 and E3).
Figure A1. Scatter plots of relative number of heads for camels (A1–A3).
Land 06 00082 g0a1aLand 06 00082 g0a1b
Figure A2. Scatter plots of relative number of heads for cattle (B1–B3).
Land 06 00082 g0a2aLand 06 00082 g0a2b
Figure A3. Scatter plots of relative number of heads for equine (C1–C3).
Land 06 00082 g0a3aLand 06 00082 g0a3b
Figure A4. Scatter plots of relative number of heads for goats and sheep (D1–D3).
Land 06 00082 g0a4aLand 06 00082 g0a4b
Figure A5. Scatter plots of relative number of heads for TLU (E1–E3).
Land 06 00082 g0a5aLand 06 00082 g0a5b

References

  1. UN. Global Drylands: A UN system-wide response Environment Management Group. 2011. Available online: http://www.unccd.int/Lists/SiteDocumentLibrary/Publications/Global_Drylands_Full_Report.pdf (accessed on 15 May 2017).
  2. Dodd, J.L. Desertification and degradation in sub-Saharan Africa—The role of livestock. BioScience 1994, 44, 28–34. [Google Scholar] [CrossRef]
  3. Homewood, K.; Rodgers, W.A. Pastoralism, conservation and the overgrazing controversy. In Conservation in Africa: People, Policies and Practice; Anderson, D., Grove, R., Eds.; Cambridge University Press: Cambridge, UK, 1987; 355p. [Google Scholar]
  4. Mearns, R. The Lie of the Land: Challenging Received Wisdom on the African Environment; Leach, M., Ed.; James Currey Ltd.: Oxford, UK, 1996; 240p. [Google Scholar]
  5. Lamprey, H.F. Pastoralism yesterday and today: The overgrazing controversy. In Tropical Savannas. Ecosystems of the World; Bourliere, F., Ed.; Elsevier: Amsterdam, The Netherlands, 1983; Volume 13, pp. 643–666. [Google Scholar]
  6. Sinclair, A.R.E.; Fryxell, J.M. The Sahel of Africa: Ecology of a disaster. Can. J. Zool. 1985, 63, 987–994. [Google Scholar] [CrossRef]
  7. Hardin, G. The tragedy of the commons. Science 1968, 163, 1243–1248. [Google Scholar] [CrossRef]
  8. Behnke, R.H.; Abel, N.O.J. Revisited: The overstocking controversy in semiarid Africa. World Anim. Rev. 1996, 87, 3–27. [Google Scholar]
  9. Ellis, J.E.; Swift, D.M. Stability of African pastoral ecosystems: Alternate paradigms and implications for development. J. Range Manag. 1988, 41, 450–459. [Google Scholar] [CrossRef]
  10. Sandford, S. Management of Pastoral Development in the Third World; John Wiley and Sons: New York, NY, USA, 1983; 316p. [Google Scholar]
  11. Sullivan, S. Towards a non-equilibrium ecology: Perspectives from an arid land. J. Biogeogr. 1996, 23, 1–5. [Google Scholar]
  12. Sullivan, S.; Rohde, R. On non-equilibrium in arid and semi-arid grazing systems. J. Biogeogr. 2002, 29, 1595–1618. [Google Scholar] [CrossRef]
  13. NIM. Nomads, the facts. New Internationalist Magazine. Available online: http://newint.org/features/1995/04/05/facts/ (accessed on 10 September 2016).
  14. Fernandez-Gimenez, M.E. The role of mongolian nomadic pastoralists ecological knowledge in rangeland management. Ecol. Appl. 2000, 10, 1318–1326. [Google Scholar] [CrossRef]
  15. Warioa, H.T.; Robab, H.G.; Kaufmann, B. Responding to mobility constraints: Recent shifts in resource use practices and herding strategies in the Borana pastoral system, southern Ethiopia. J. Arid Environ. 2016, 127, 222–234. [Google Scholar] [CrossRef]
  16. Warren, A. Changing Understandings of African Pastoralism and the Nature of Environmental Paradigms. Trans. Inst. Br. Geogr. 1995, 20, 193–203. [Google Scholar] [CrossRef]
  17. Desta, S.; Coppock, D.L. Pastoralism under Pressure: Tracking System Change in Southern Ethiopia. Hum. Ecol. 2004, 32, 465–486. [Google Scholar] [CrossRef]
  18. Butt, B. Ecology, mobility and labour: Dynamic pastoral herd management in an uncertain world. Rev. Sci. Tech. 2016, 35, 461–472. [Google Scholar] [CrossRef] [PubMed]
  19. Salpeteur, M.; Madella, M.; Patel, H.R.; Reyes-García, V. Adaptation, Access to Resources and Mobility: From Contemporary Pastoral Systems to Ancient Societies. Nomadic Peoples; The White Horse Press: Winwick, Cambridgeshire, UK, 2017; Volume 21, pp. 191–213. [Google Scholar]
  20. Hundie, B. Property Rights among Afar Pastoralists of Northeastern Ethiopia: Forms, Changes and Conflicts. In Proceedings of the Survival of the Commons: Mounting Challenges and New Realities. Eleventh Conference of the International Association for the Study of Common Property, Bali, Indonesia, 19–23 June 2006. [Google Scholar]
  21. Rass, N. Policies and Strategies to Address the Vulnerability of Pastoralists in Sub-Saharan Africa; PPLPI Working Paper No. 37; Pro-Poor Livestock Policy Initiative; Food and Agriculture Organization of the United Nations: Rome, Italy, 2006. [Google Scholar]
  22. Biopact. ICRISAT launches pro-poor biofuels initiative in drylands. 2007. Available online: http://biopact.com/2007/03/icrisat-launches-pro-poor-biofuels.html (accessed on 15 May 2015).
  23. Cotula, L.; Vermeulen, S.; Leonard, R.; Keeley, J. Land Grab or Development Opportunity? Agricultural Investment and International Land Deals in Africa; IIED/FAO/IFAD: London, UK/Rome, Italy, 2009; ISBN 978-1-84369-741-1. [Google Scholar]
  24. Scoones, I. New Directions in Pastoral Development in Africa. In Living with Uncertainty. New Directions in Pastoral Development in Africa; Scoones, I., Ed.; Intermediate Technology Publications Ltd.: London, UK, 1994; pp. 1–36. [Google Scholar]
  25. Deressa, T. Measuring the Economic Impact of Climate Change on Ethiopian Agriculture: Ricardian Approach; CEEPA Discussion Paper No. 25; Centre for Environmental Economics and Policy in Africa, University of Pretoria: Pretoria, South Africa, 2006. [Google Scholar]
  26. Kohyani, P.T.; Bossuyt, B.; Bonte, D.; Hoffmann, M. Grazing as a management tool in dune grasslands: Evidence of soil and scale dependence of the effect of large herbivores on plant diversity. Biol. Conserv. 2008, 141, 1687–1694. [Google Scholar] [CrossRef]
  27. Ebrahimi, A.; Milotic, T.; Hoffmann, M. A herbivore specific grazing capacity model accounting for spatio-temporal environmental variation: A tool for a more sustainable nature conservation and rangeland management. Ecol. Model. 2010, 221, 900–910. [Google Scholar] [CrossRef]
  28. Keyzer, M.A.; Merbis, M.D.; Pavel, I.F.P.W.; Van Wesenbeeck, C.F.A. Diet shifts towards meat and the effects on cereal use: Can we feed the animals in 2030? Ecol. Econ. 2005, 55, 187–202. [Google Scholar] [CrossRef]
  29. De Han, C. Livestock Development: Implications for Rural Poverty, the Environment, and Global Food Security; The World Bank: Washington, DC, USA, 2001. [Google Scholar]
  30. CSA. Central Statistical Agency; Federal Democratic Republic of Ethiopia. 2016. Available online: http://www.csa.gov.et/images/documents/pdf_files/regional/Afar.pdf (accessed on 15 October 2016).
  31. Rettberg, S. Der Umgang mit Risiken im Spannungsfeld zwischen Konflikten und Nahrungskrisen. Eine politisch-geographische Untersuchung in der Afar Region Ethiopien. Ph.D. Thesis, Bayreuth University, Bavaria, Germany, 2008. [Google Scholar]
  32. Hundie, B. Pastoralism, Institutions and Social Interaction: Explaining the Coexistence of Conflict and Cooperation in Pastoral Afar, Ethiopia; Shaker Verlag GmbH: Aachen, Germany, 2008. [Google Scholar]
  33. Hundie, B. Conflicts between Afar pastoralists and their neighbors: Triggers and motivations. Int. J. Confl. Violence 2010, 4, 135–148. [Google Scholar]
  34. Ame, A. Cross-border livestock trade and small arms and conflict in pastoral areas of the horn of Africa: Case study from southern Ethiopia and northern Kenya. In Proceedings of the Survival of the Commons: Mounting Challenges and New Realities, the Eleventh Conference of the International Association for the Study of Common Property, Bali, Indonesia, 19–23 June 2006; Available online: http://dlc.dlib.indiana.edu/archive/00001823/00/Ame_Abdurahman.pdf (accessed on 1 April 2015).
  35. Bekele, K. Ethiopia: Promoting Bio-Fuel. The Reporter (Addis Ababa). 2007. Available online: http://allafrica.com/stories/200711050688.html (accessed on 12 May 2015).
  36. Eshetu, J. Overview of the potentials and constraints on export of meat and livestock. In Proceedings of the national workshop on managing animal health constraints to export marketing of meat and livestock, MoARD–FAO, Addis Ababa, Ethiopia, 27–28 April 2004. [Google Scholar]
  37. LMA. Meat Exports Market Study, MoARD; Livestock Marketing Authority: Addis Ababa, Ethiopia, 2004. [Google Scholar]
  38. Shapiro, B.I.; Gebru, G.; Desta, S.; Negassa, A.; Negussie, K.; Aboset, G.; Mechal, H. Ethiopia Livestock Master Plan Roadmaps for Growth and Transformation A Contribution to the Growth and Transformation Plan II (2015–2020); Ministry of Agriculture Livestock Resources Development: Addis Ababa, Ethiopia, 2015. [Google Scholar]
  39. The Ethiopian Herald. Ethiopia Eyeing 12 Million USD from Ramadan Meat Export: Institute. 2017. Available online: https://www.alleastafrica.com/2017/06/08/ethiopia-eyeing-12-million-usd-from-ramadan-meat-export-institute/ (accessed on 8 November 2017).
  40. Thornton, P.K.; Jones, P.G.; Owiyo, T.; Kruska, R.L.; Herrero, M.; Kristjanson, P.; Notenbaert, A.; Bekele, N.; Omolo, A. Mapping Climate Vulnerability and Poverty in Africa; Report to the Department for International Development; ILRI: Nairobi, Kenya, 2006. [Google Scholar]
  41. Hundie, B.; Padmanabhan, M. The Transformation of the Commons: Coercive and Non-Coercive Ways. In Collective and Property Rights for Poverty Reduction: Lessonsfrom a Global Research Project; IFPRI: Washington, DC, USA, 2012. [Google Scholar]
  42. Beyene, F. Institutional arrangements in mutually beneficial grazing systems: An example from herding communities in Ethiopia. J. Land Use Sci. 2014, 9, 438–452. [Google Scholar] [CrossRef]
  43. Beyene, F. Incentives and Challenges in Community-Based Rangeland Management: Evidence from Eastern Ethiopia. Land Degrad. Dev. 2015, 26, 502–509. [Google Scholar] [CrossRef]
  44. Mulatu, A.; Bekure, S. The Need to Strengthen Land Laws in Ethiopia to Protect Pastoral Rights. In Pastoralism and Development in Africa: Dynamic Change at the Margins; Andy, C., Jeremy, L., Ian, S., Eds.; Routledge: Abingdon, UK; New York, NY, USA, 2013; pp. 186–194. [Google Scholar]
  45. USAID. Ethiopia—Strengthening Land Administration Program (ELAP). 2012. Available online: http://www.moa.gov.et/.../Pastoral...pastoral+Land.../eba08eee6d8c-a8f (accessed on 12 December 2016).
  46. Little, P.D.; Behnke, R.; McPeak, J.; Gebru, G. Policy Options for Pastoral Development in Ethiopia. 2010. Available online: http://www.researchgate.net/publication/257993033 (accessed on 2 April 2015).
  47. Abbink, J. Land to the Foreigners: Economic, legal, and socio-cultural aspects of new land acquisition schemes in Ethiopia. J. Contemp. Afr. Stud. 2011, 29, 513–535. [Google Scholar] [CrossRef]
  48. Sonneveld, B.G.J.S.; Pande, S.; Keyzer, M.A.; Georgis, K.; Seid Ali, A.; Takele, A. Land degradation and overgrazing in the Afar Region, Ethiopia: A spatial analysis using Rainfall Use Efficiency. In Land Degradation and Desertification: Assessment, Mitigation and Remediation; Zdruli, P., Pagliai, M., Cano, S.K.A.F., Eds.; Springer: Dordrecht, The Netherlands, 2010; pp. 97–110. [Google Scholar]
  49. Abdulatife, M. Training Report on Spatial Data Management; Afar Pastoral and Agro-pastoral Research Institute (APARI): Semera, Ethiopia, 2016. [Google Scholar]
  50. Sutcliffe, P. The Woody Biomass Project. reCOMMEND 2006, 3, 1–4. [Google Scholar]
  51. GAEZ v3.0 Global Agro-Ecological Zones. Available online: http://www.gaez.iiasa.ac.at (accessed on 8 January 2015).
  52. De Leeuw, P.N.; Tothill, J.C. The concept of carrying capacity in sub-Saharan Africa: Myth or reality? In Range Ecology at Disequilibrium: New Models of Natural Variability and Pastoral Adaptation in African Savannas; Behnke, R.H., Scoones, I., Kerven, C., Eds.; Overseas Development Institute: London, UK, 1993; pp. 77–88. [Google Scholar]
  53. Western, D.; Grimsdell, J.J.R. Measuring the Distribution of Animals in Relation to the Environment; Handbook No. 2; African Wildlife Leadership Foundation: Nairobi, Kenya, 1979. [Google Scholar]
  54. Too, D.K. Effects of Defoliation Frequency and Intensity on Production of Four Burned and Unburned Bushed Grassland Communities in South-Central Kenya. Master’s Thesis, Texas A & M University, College Station, TX, USA, 1985. [Google Scholar]
  55. Braun, H.M.H. Primary production in the Serengeti: Purpose, methods and some results of research. Ann. Univ. d'Abidjan (E) 1973, 6, 171–188. [Google Scholar]
  56. Van Wijngaarden, W. Elephants-Trees-Grass-Grazers: Relationships between Climate, Soil, Vegetation and Large Herbivores in a Semi-Arid Savanna Ecosystem; No. 4; ITC Publ.: Enschede, The Netherlands, 1985. [Google Scholar]
  57. Sinclair, A.R.E. The eruption of the ruminants. In Serengeti, Dynamics of an Ecosystem; Sinclair, A.R.E., Norton-Griffiths, M., Eds.; University of Chicago Press: Chicago, IL, USA, 1979; pp. 82–103. [Google Scholar]
  58. Potter, H.L. Aspects of Climate, Herbage Growth and Animal Production in a Semi-Arid Area of Kenya. Ph.D. Thesis, University of Nairobi, Nairobi, Kenya, 1985. [Google Scholar]
  59. Deshmuk, I.K. A common relationship between precipitation and grassland peak biomass for East and southern Africa. Afr. J. Ecol. 1984, 22, 181–186. [Google Scholar] [CrossRef]
  60. Gebremeskel, K. Rangeland Production and Carrying Capacity of Afar Regional State; Consultancy Report; Werer Agricultural Research Center of the Ethiopian Institute for Agricultural Research: Werer, Ethiopia, 2012. [Google Scholar]
  61. Le Houérou, H.N.; Hoste, C.H. Rangeland production and annual rainfall relations in the Mediterranean Basin and in the African Sahelo-Sudanian zone. J. Rangel. Manag. 1977, 30, 183–189. [Google Scholar] [CrossRef]
  62. Dye, P.J.; Spear, P.T. The effects of bush clearing and rainfall variability on grass yield and composition in southwest Zimbabwe. J. Agric. Res. 1982, 20, 103–118. [Google Scholar]
  63. De Leeuw, P.N.; Nyambaka, R. The prediction of rangeland primary 18 production from rainfall data in arid and semi-arid Eastern Africa. In Proceedings of the Third PANESA Workshop: 260–268 ILCA; Dzowela, B.H., Ed.; International Livestock Centre for Africa: Addis Ababa, Ethiopia, 1988. [Google Scholar]
  64. CSA. Agricultural Sample Survey 2010/11 [2003 e.c.] Volume ii. Report on Livestock and Livestock Characteristics (Private Peasant Holdings); Federal Democratic Republic of Ethiopia, Central Statistical Agency: Addis Ababa, Ethiopia, 2011. [Google Scholar]
  65. CSA. Pastoral Areas Livestock Enumeration, Results for Afar Region; The Central Agricultural Census Commission; Central Statistical Authority: Addis Ababa, Ethiopia, 2003. [Google Scholar]
  66. Behnke, R. The Contribution of Livestock to the Economies of IGAD Member States. Study Findings, Application of the Methodology in Ethiopia and Recommendations for Further Work; IGAD Livestock Policy Initiative Odessa Centre: Great Wolford, UK, 2010. [Google Scholar]
  67. ESGPIP. Afar Region. The Ethiopia Sheep and Goat Productivity Improvement Program. Available online: http://www.esgpip.org/Afar.html (accessed on 15 June 2015).
  68. LDMPS. Livestock Development Master Plan Study for 2006 (Phase I, Volume B); Ministry of Agriculture, Government of Ethiopia: Addis Ababa, Ethiopia, 2007.
  69. BoFED. Regional Atlas 2: Afar National Regional State; Finance and Economic Development Bureau: Semera, Ethiopia, 2009.
  70. Abdullatif, M.; Semera, Ethiopia. Afar Livestock statistics from the Afar Pastoral & Agricultural Development Bureau. Personal communication, 30 January 2016. [Google Scholar]
  71. Amsalu, T.; Addisu, S. Assessment of Grazing Land and Livestock Feed Balance in Gummara-Rib Watershed, Ethiopia. Curr. Agric. Res. J. 2014. [Google Scholar] [CrossRef]
1
According to the type of trekking patterns pastoralists are called nomadic (irregular movements) or transhumant (regular movements between fixed locations).
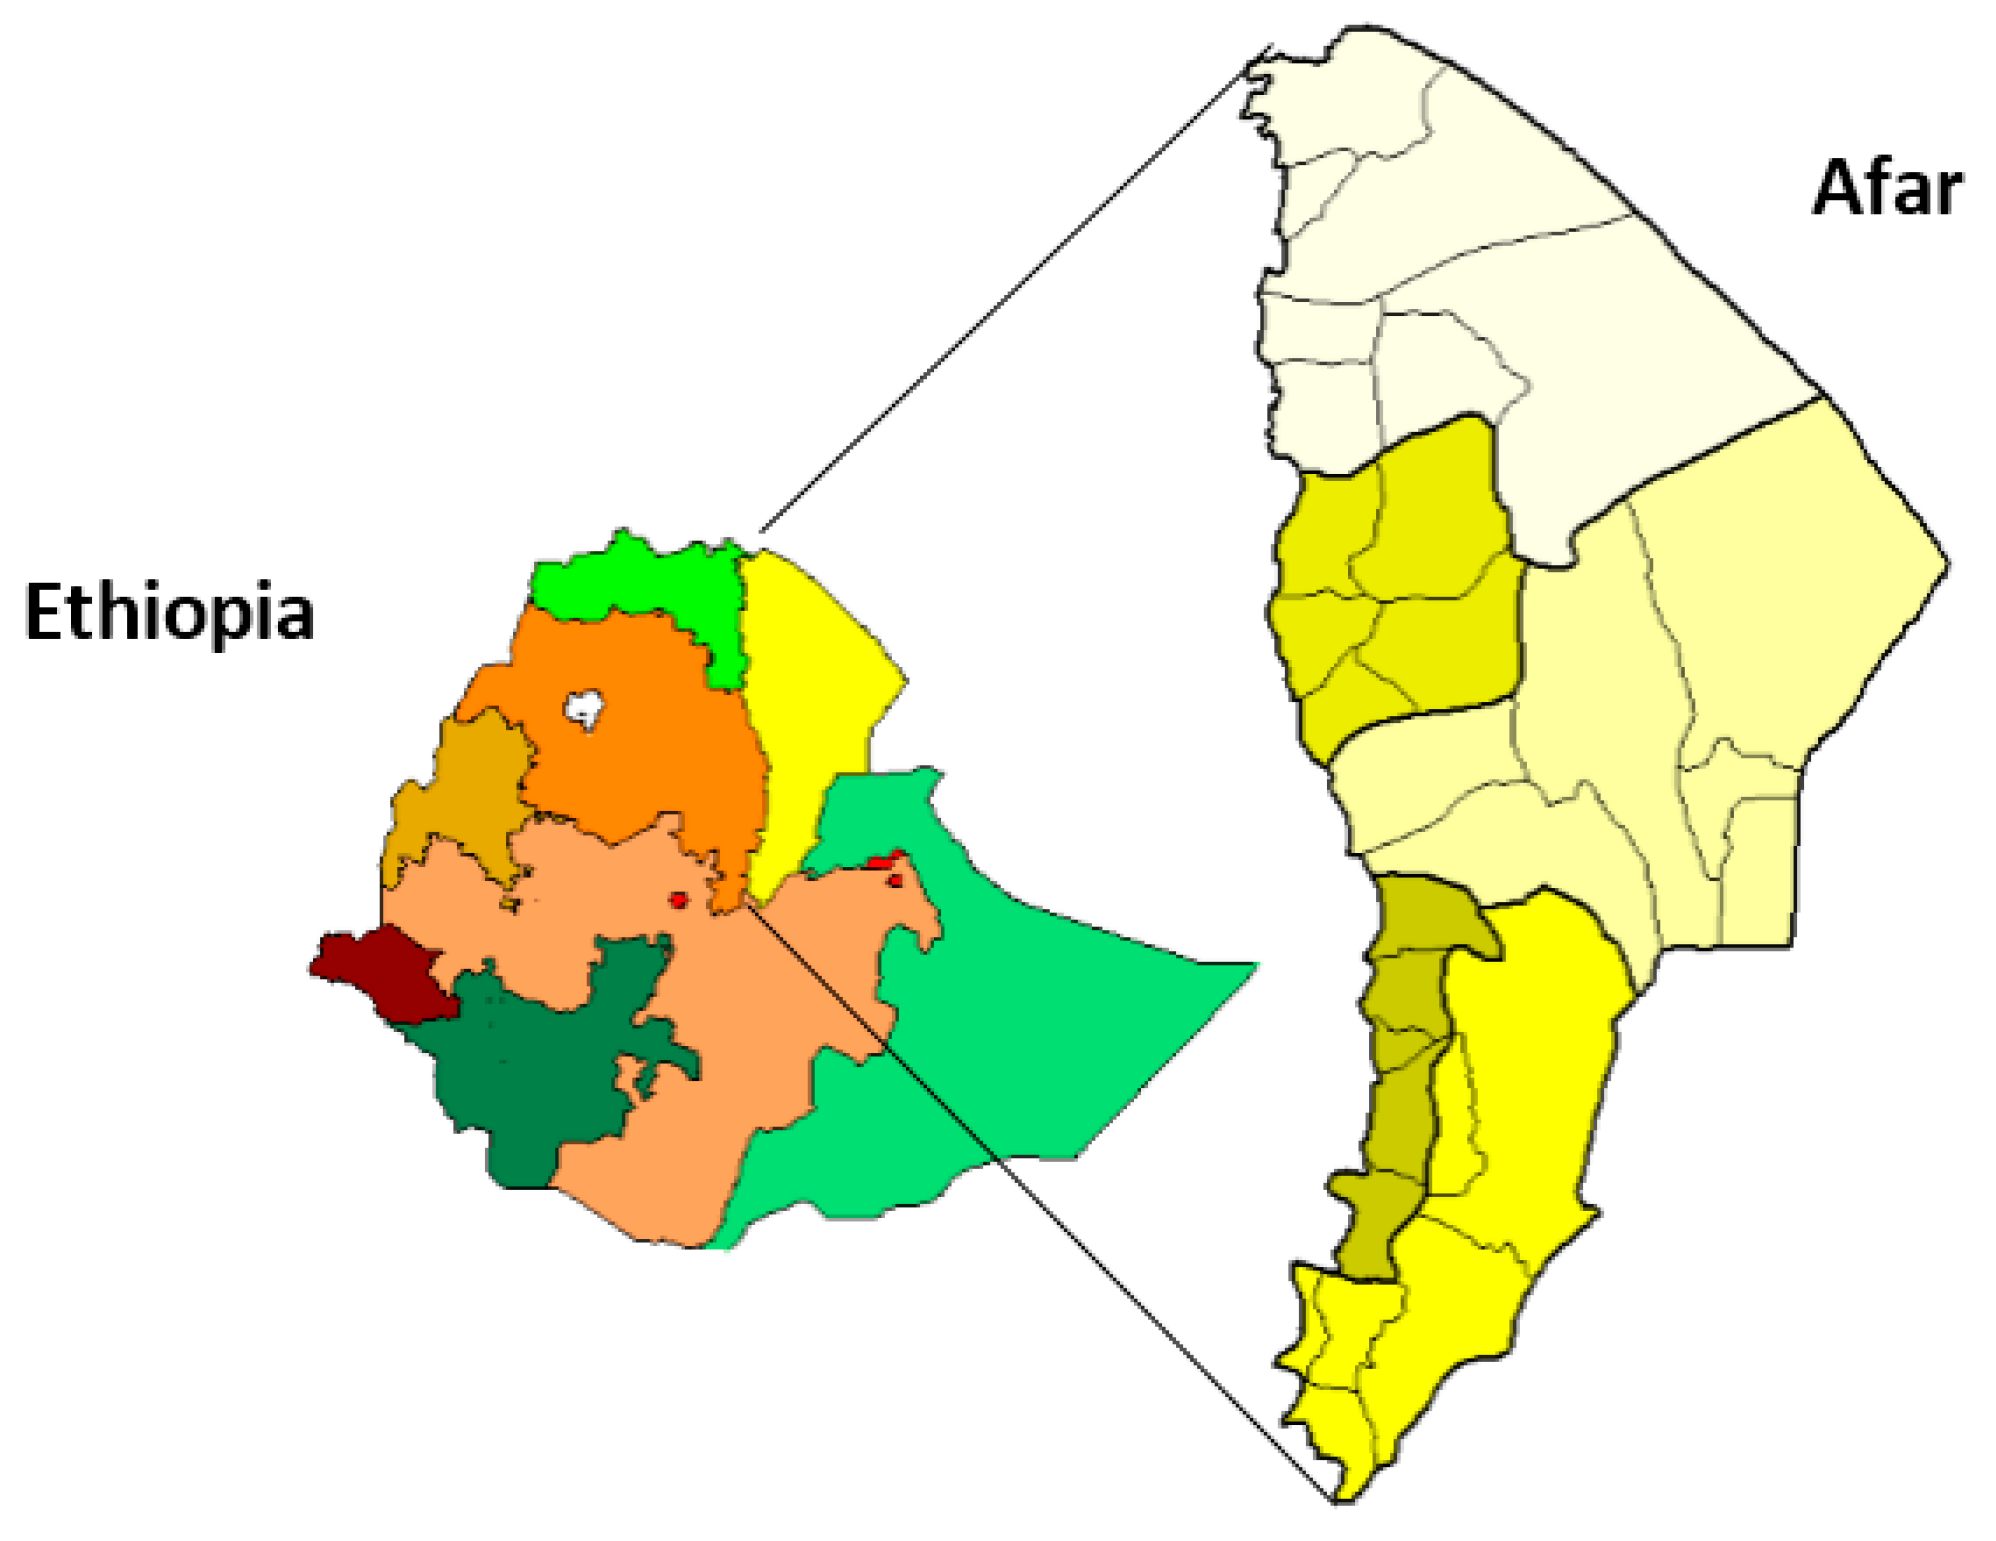
2
Ethiopia is administratively divided into regional states and chartered cities, zones, woredas (districts) and kebeles (wards).
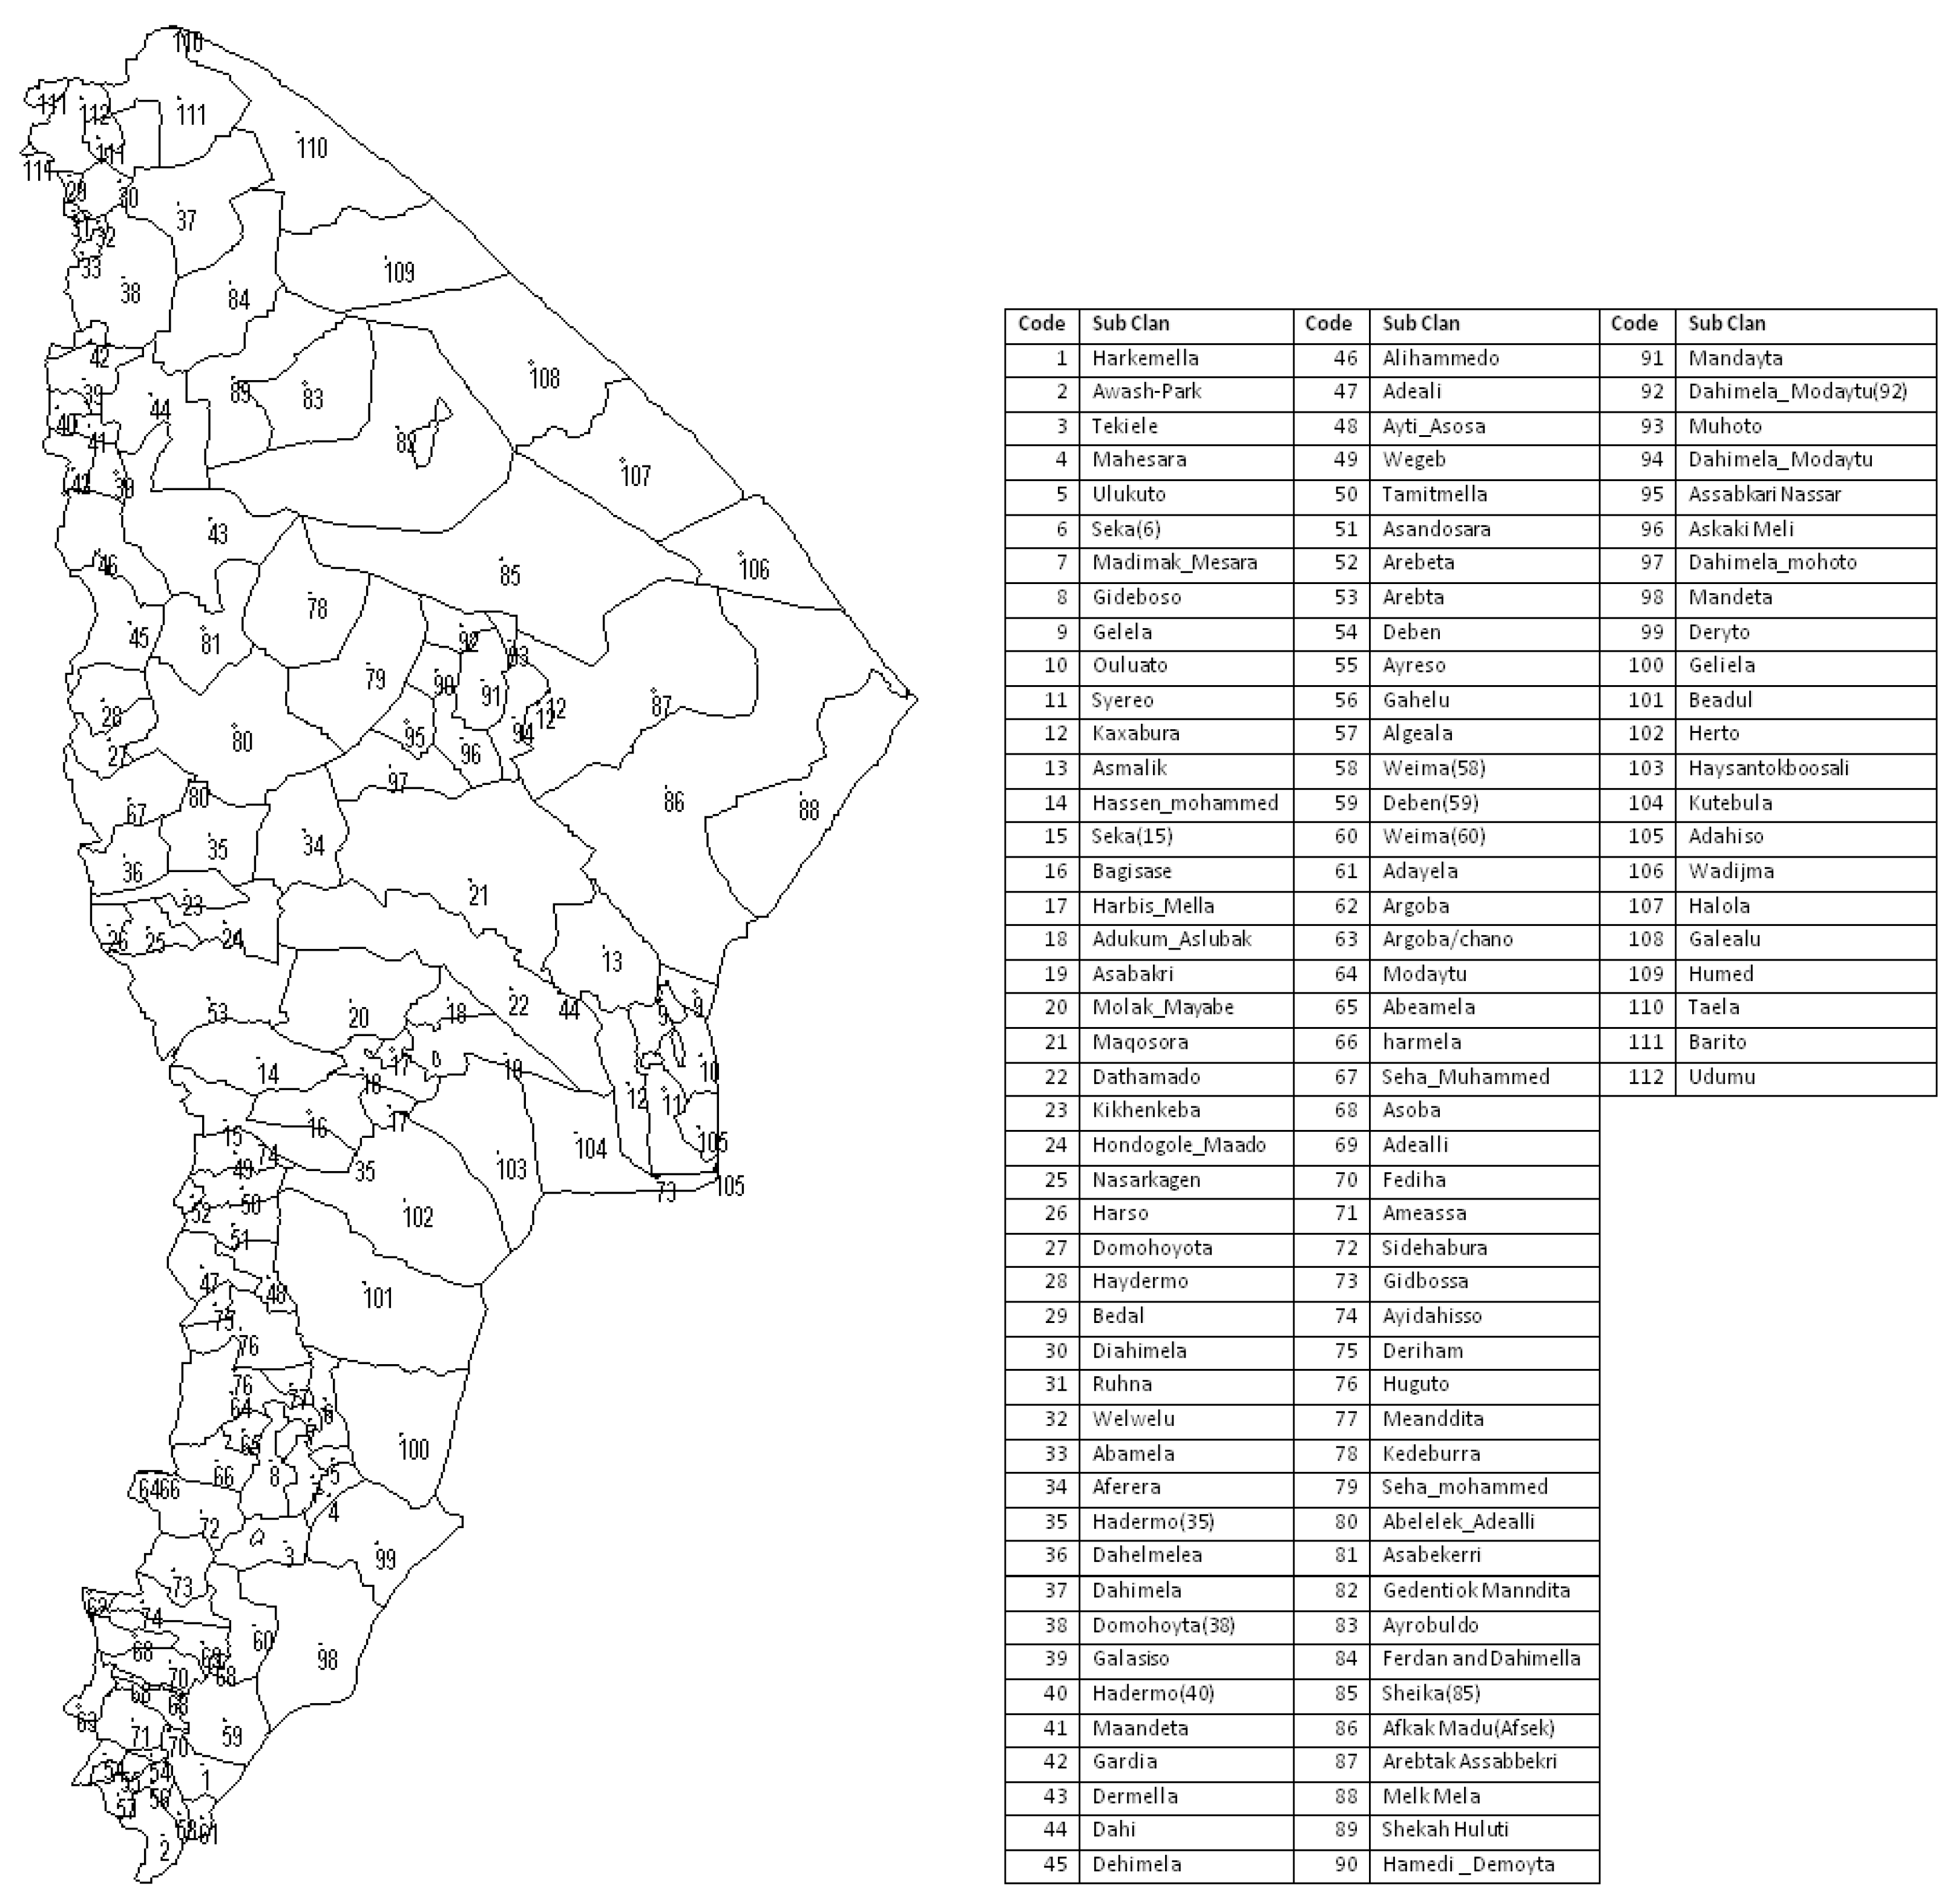
3
The Afar as ethnic group occupy a territory that comprises the Afar Region of Ethiopia, northern Djibouti and southern point of Eritrea. The territorial and political unit in the Afar Region is the sub-clan which retains a relatively high degree of political, social, and economic independence.
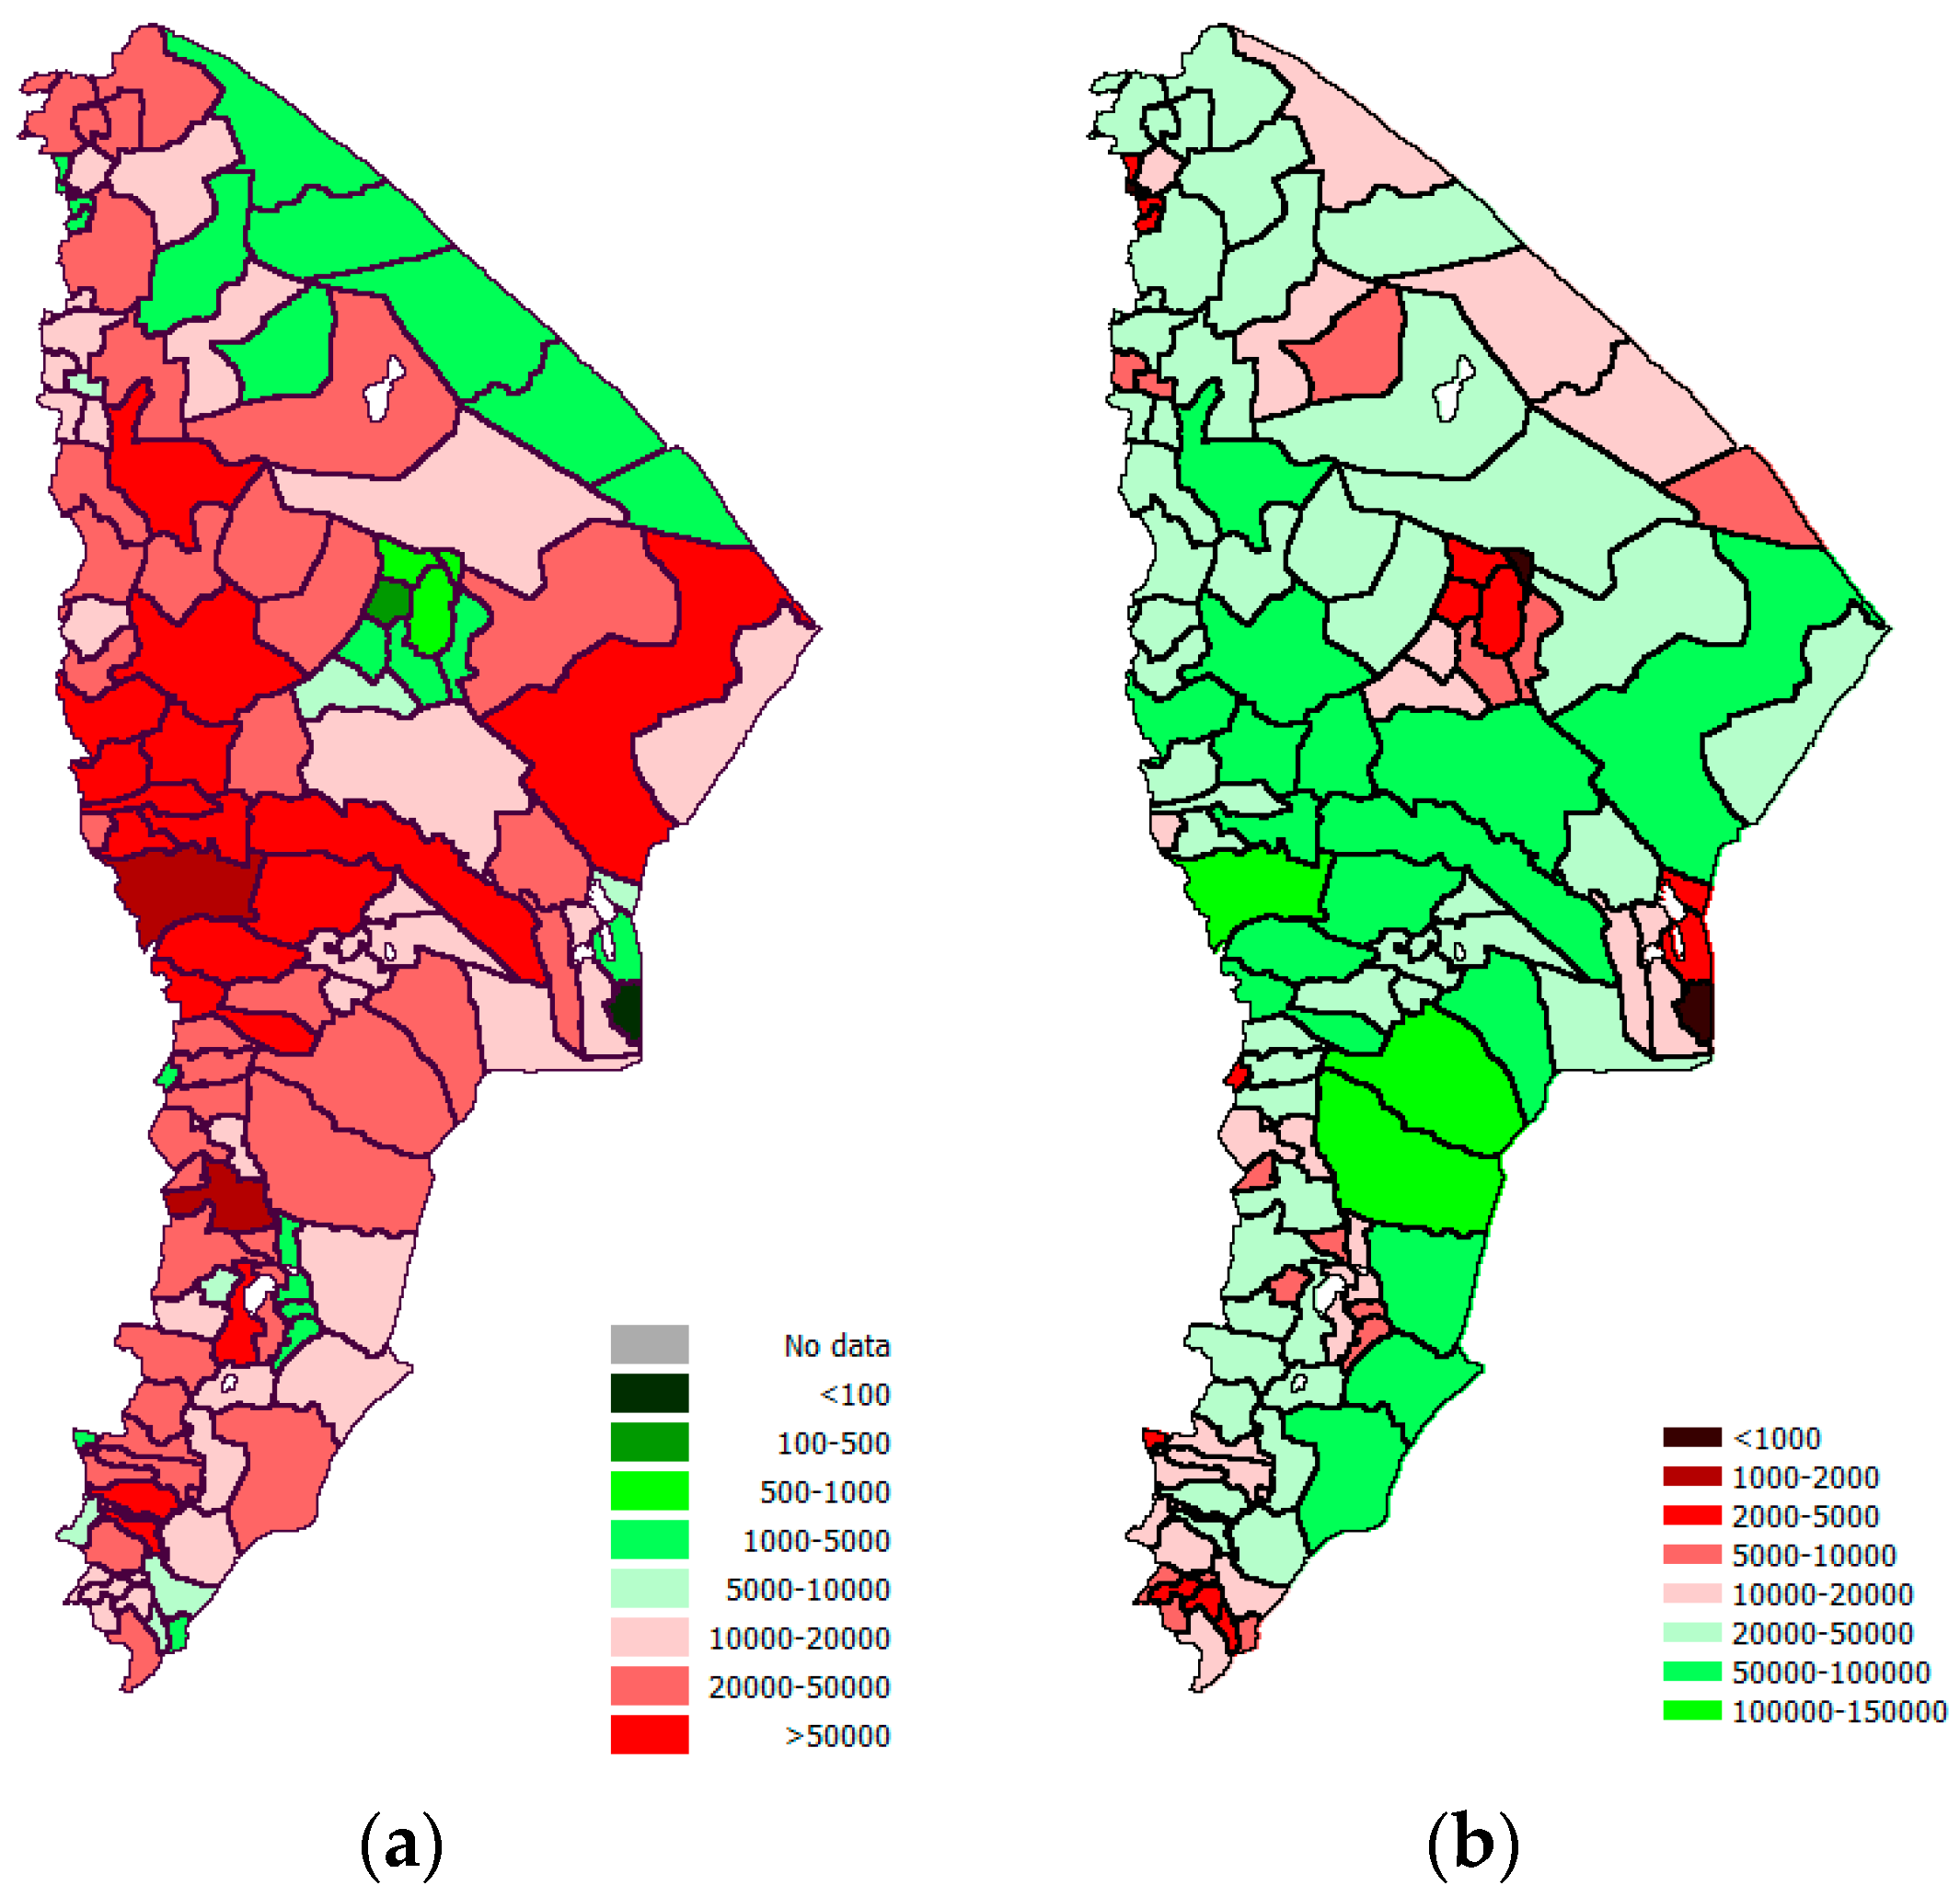
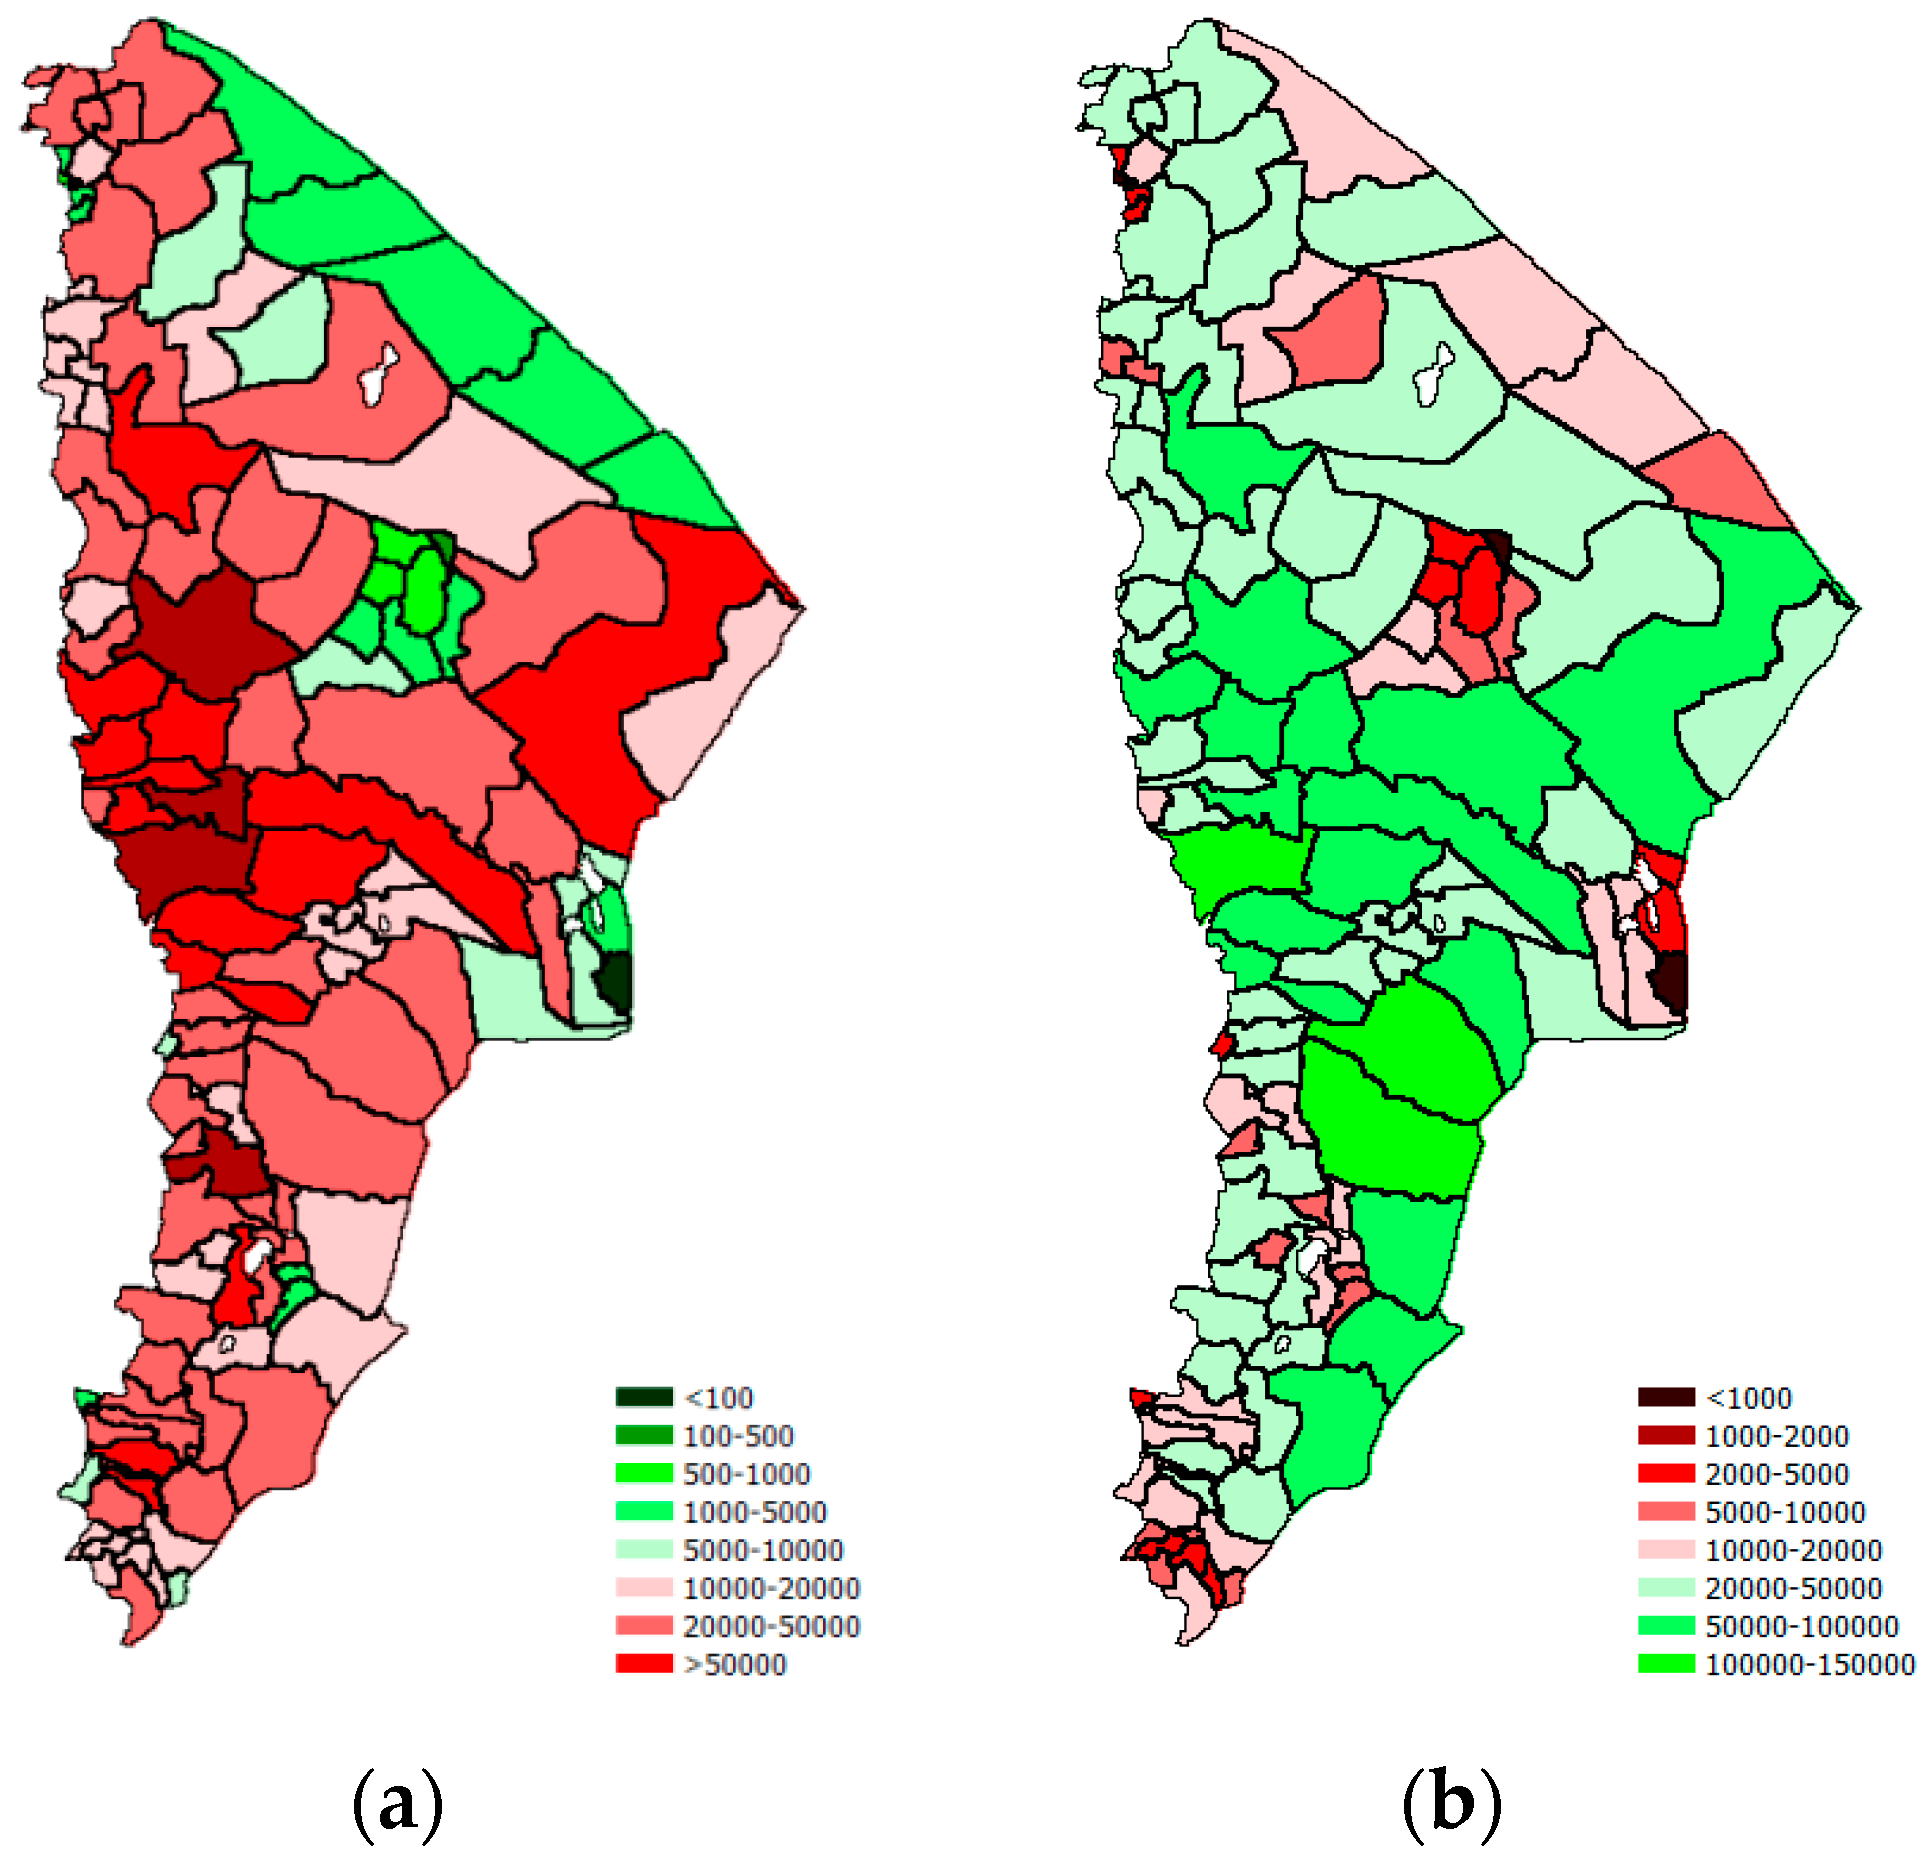
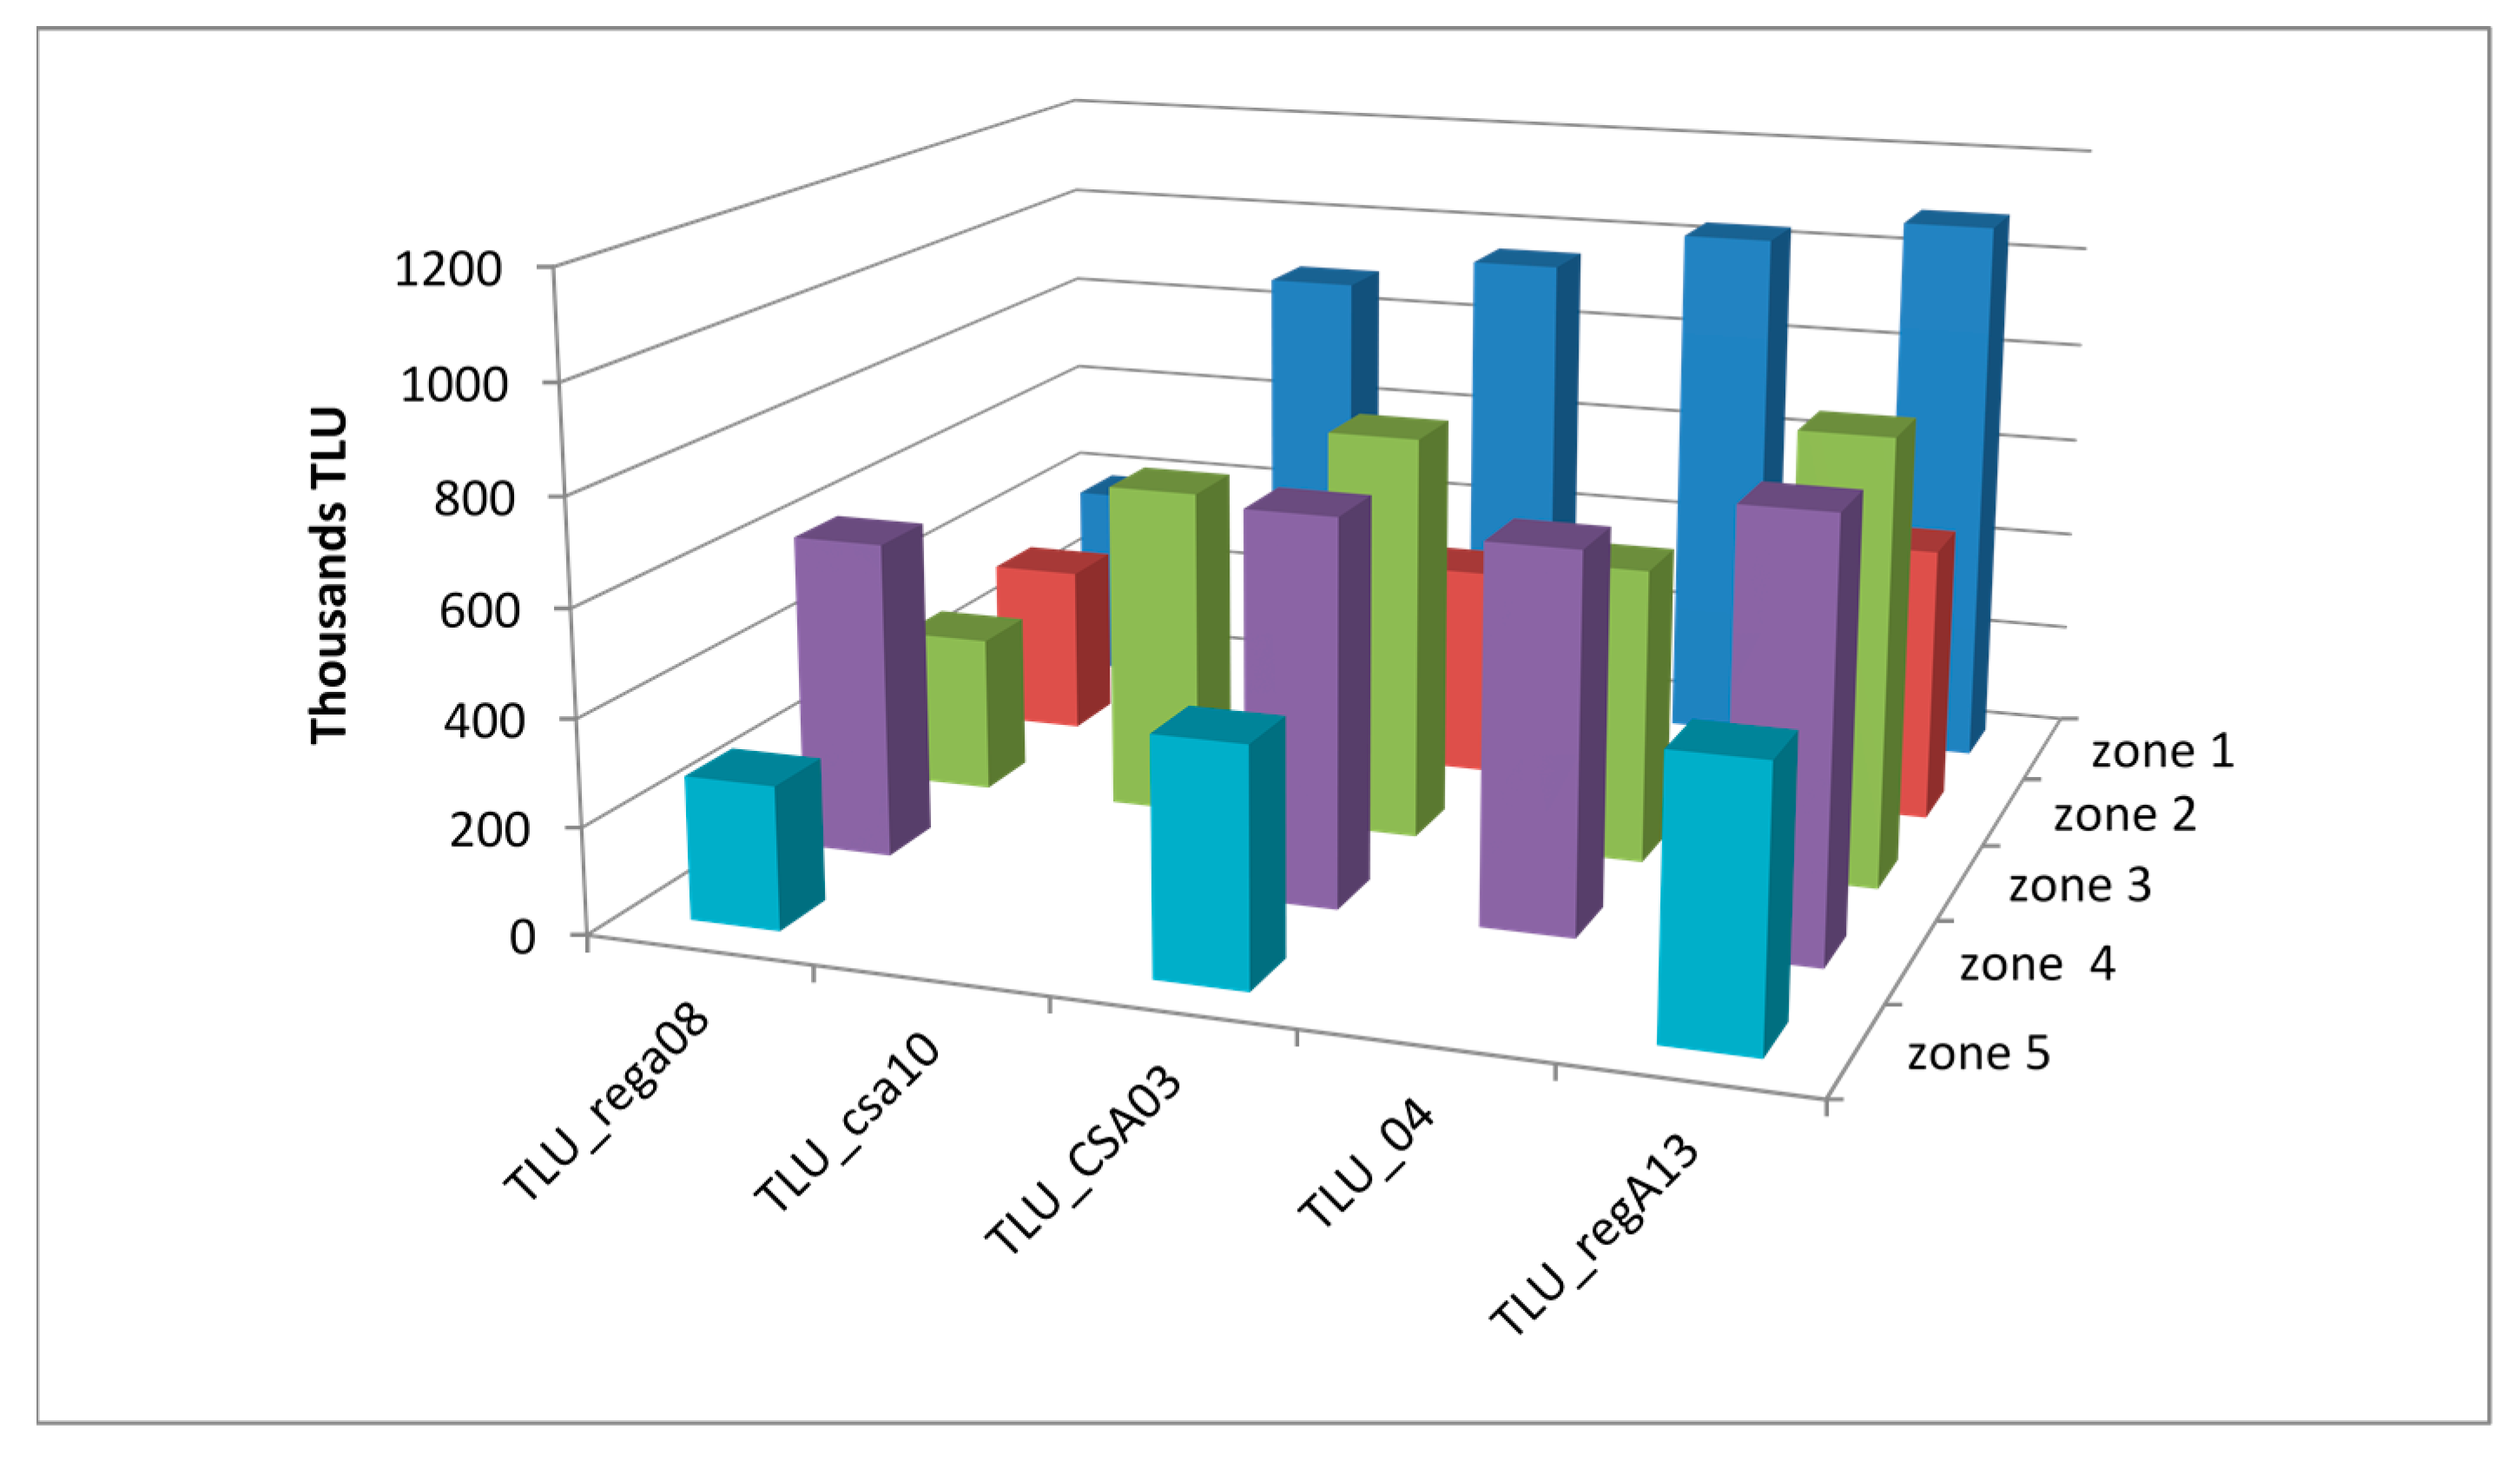
4
Tropical livestock units allow to compare grazing demand of different species in common units.
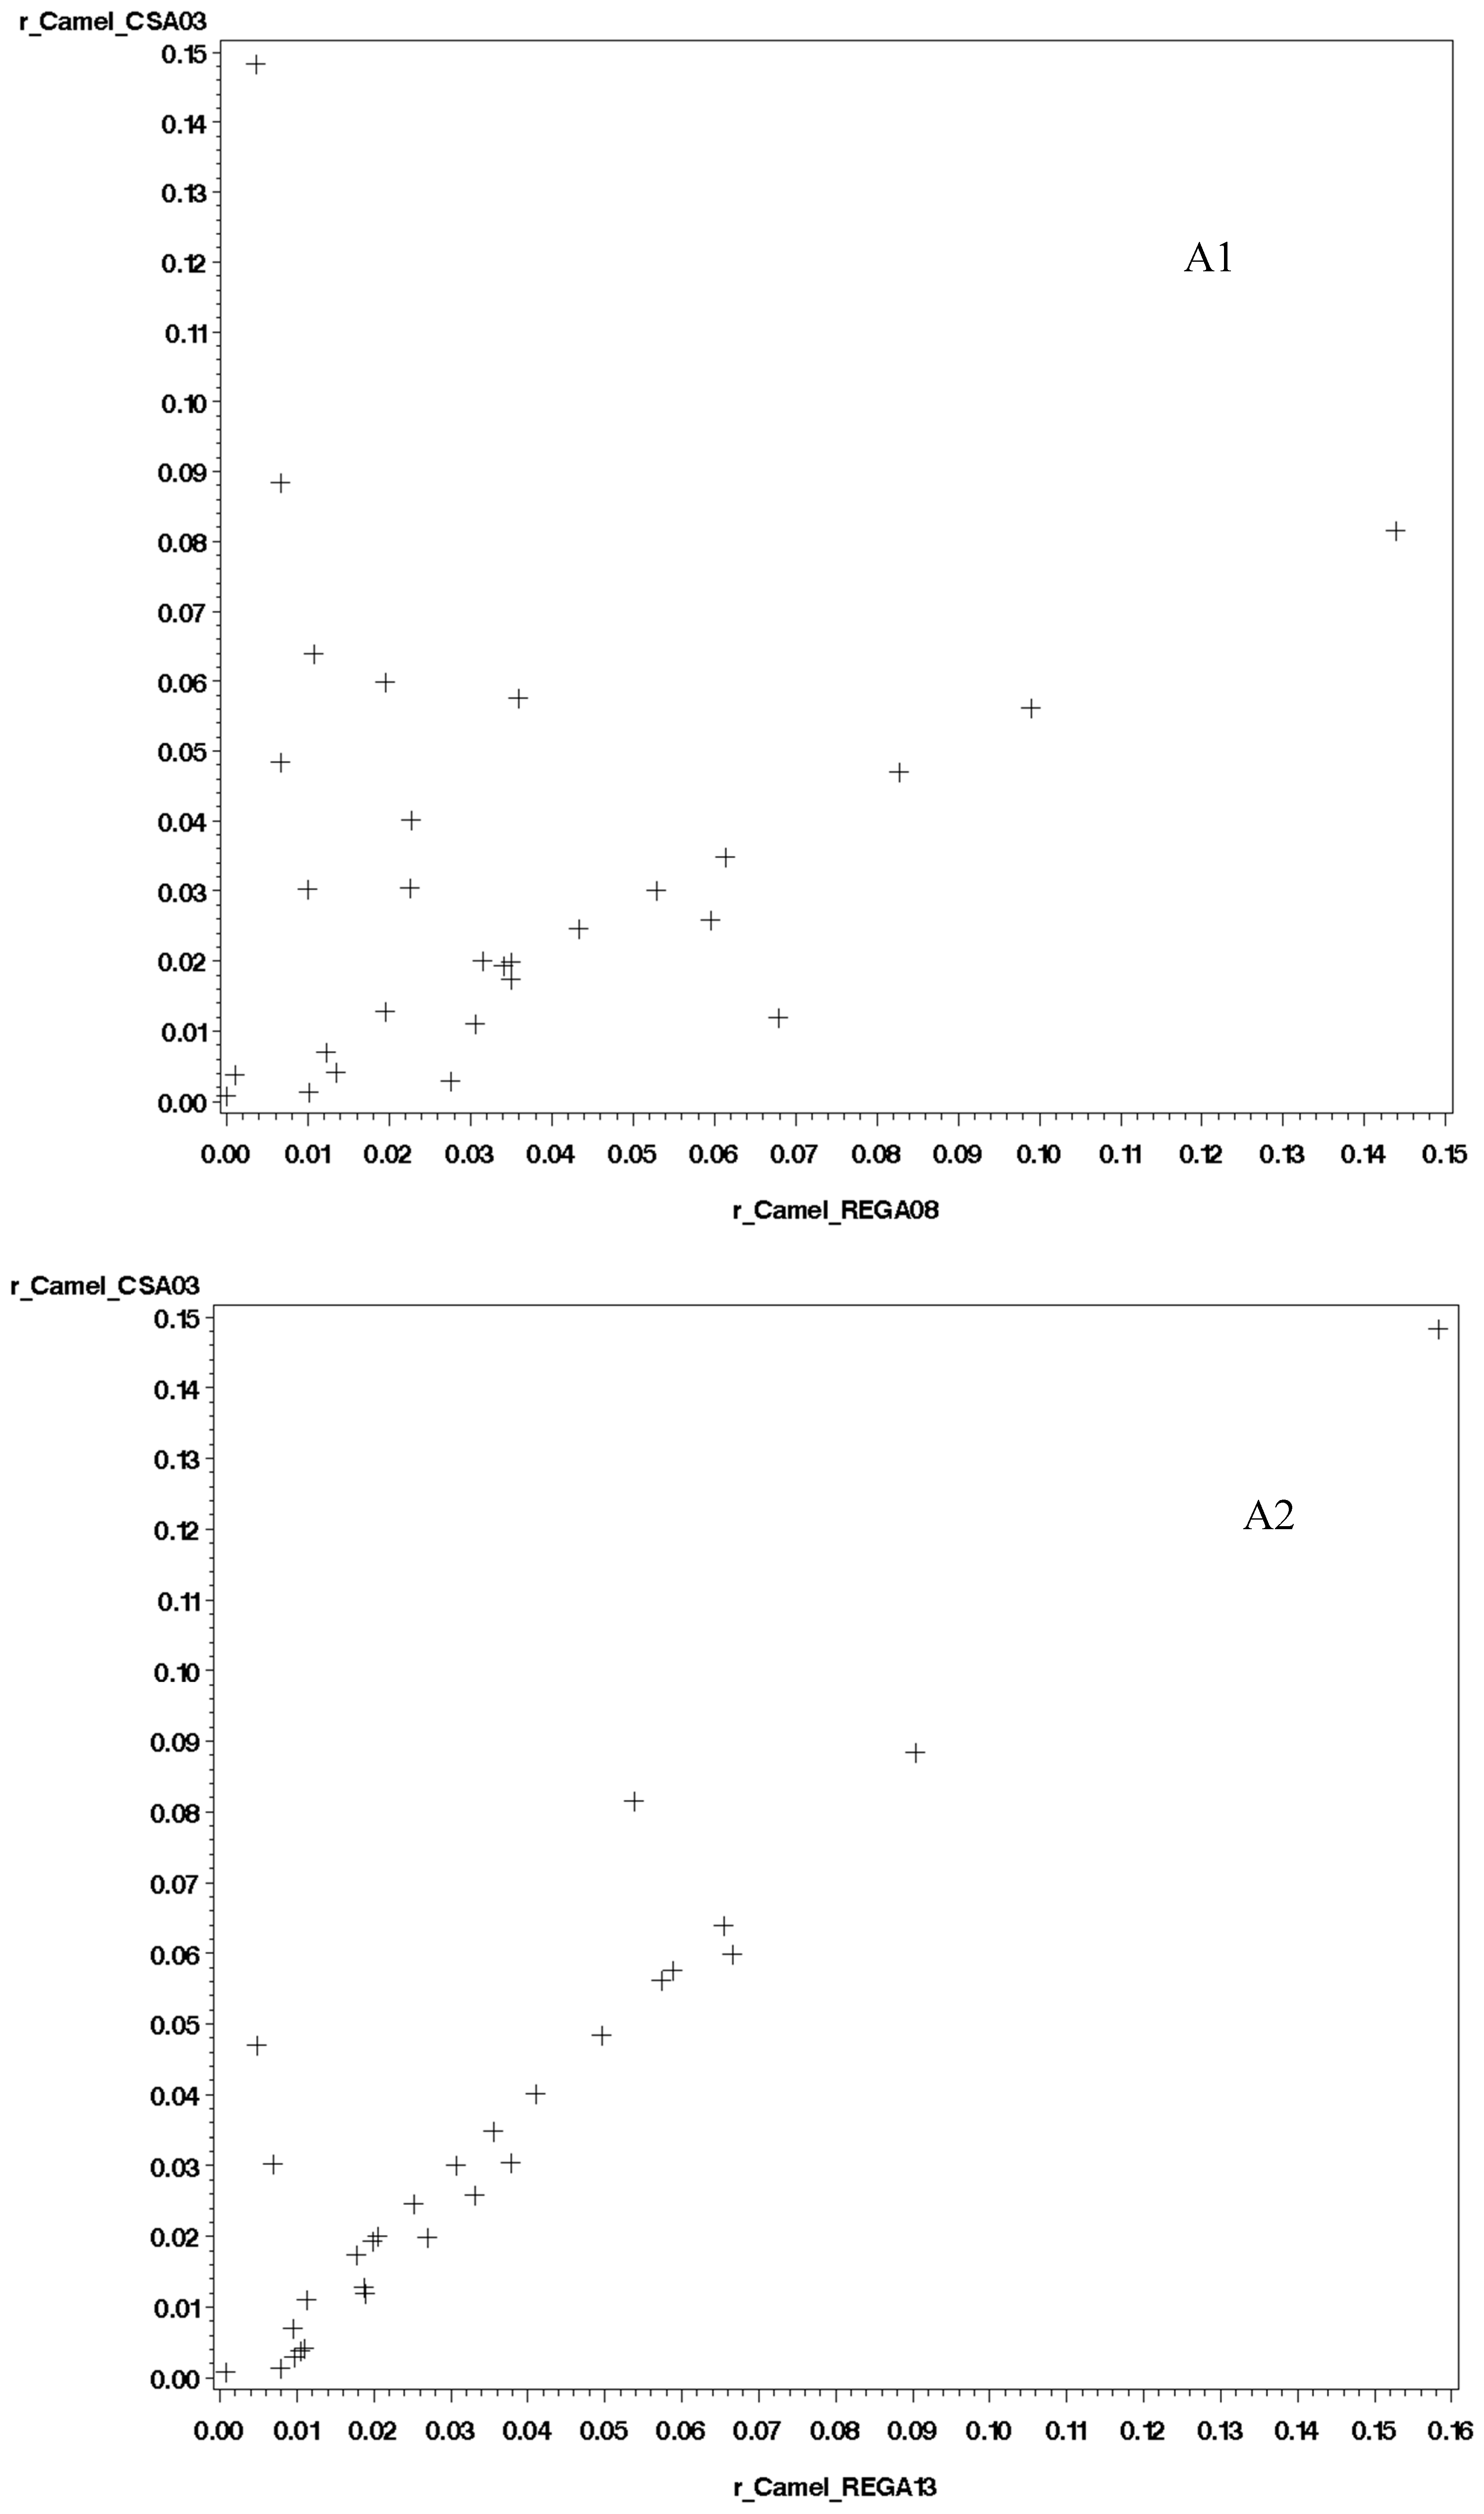
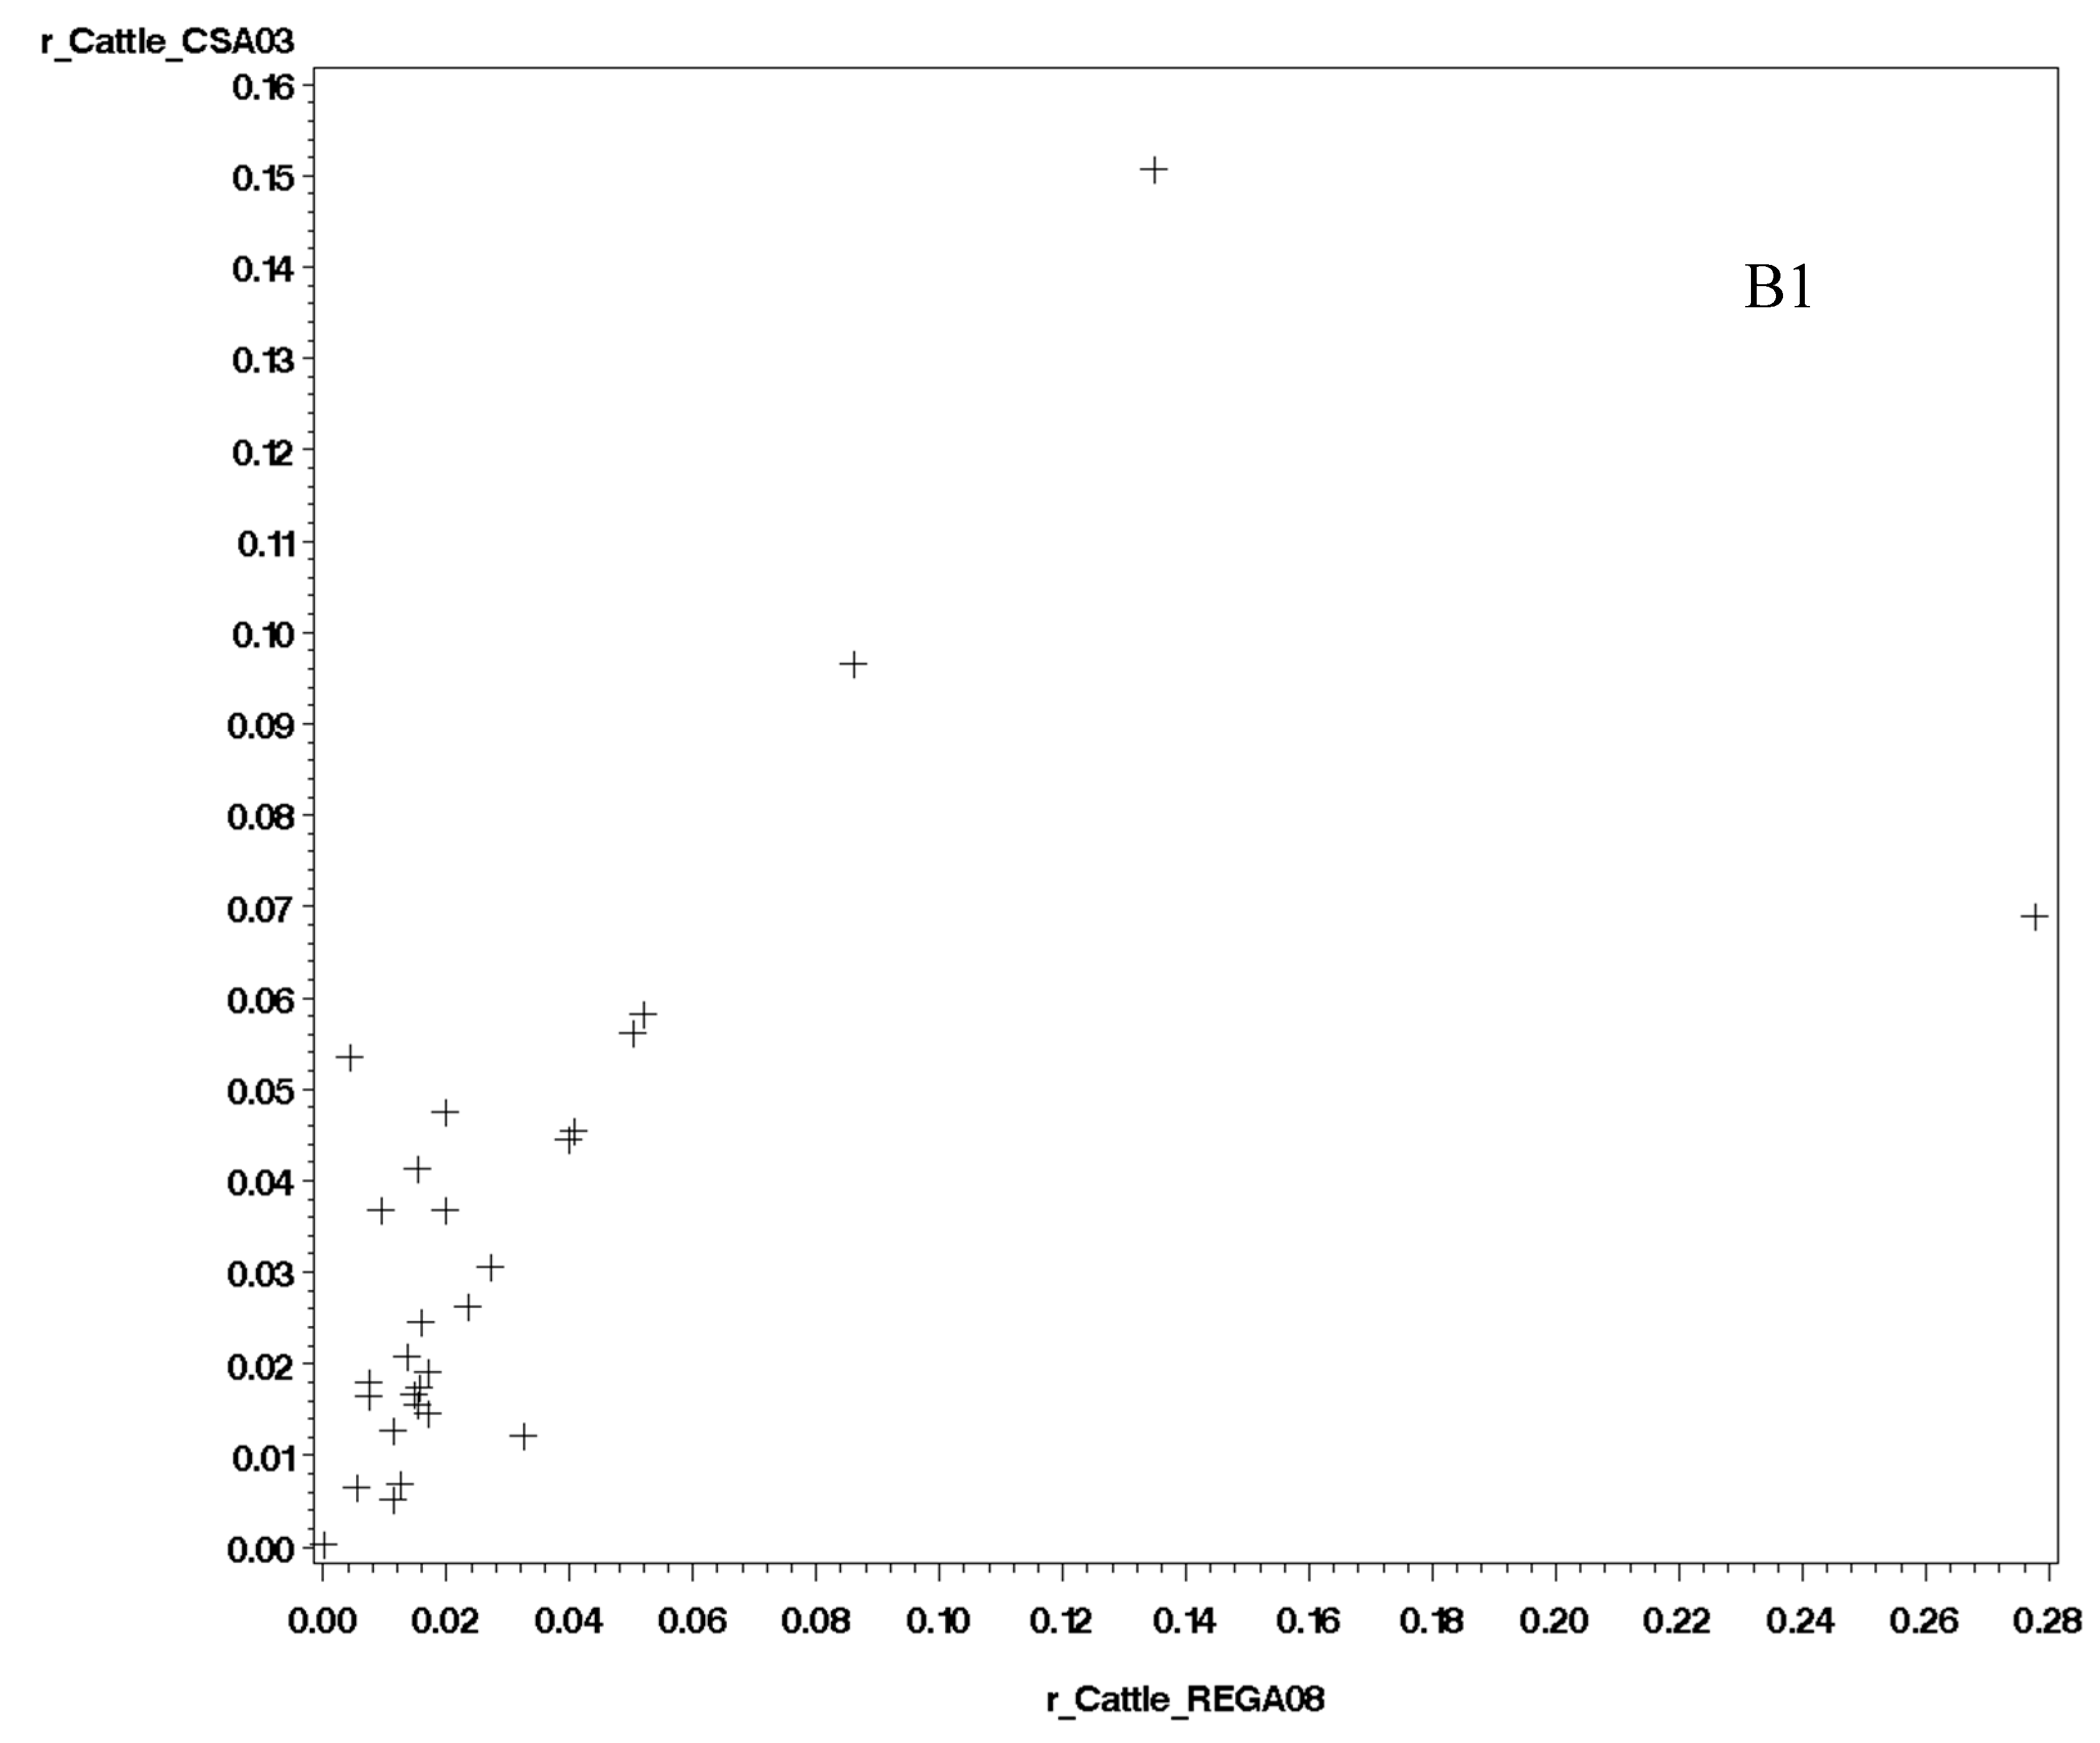
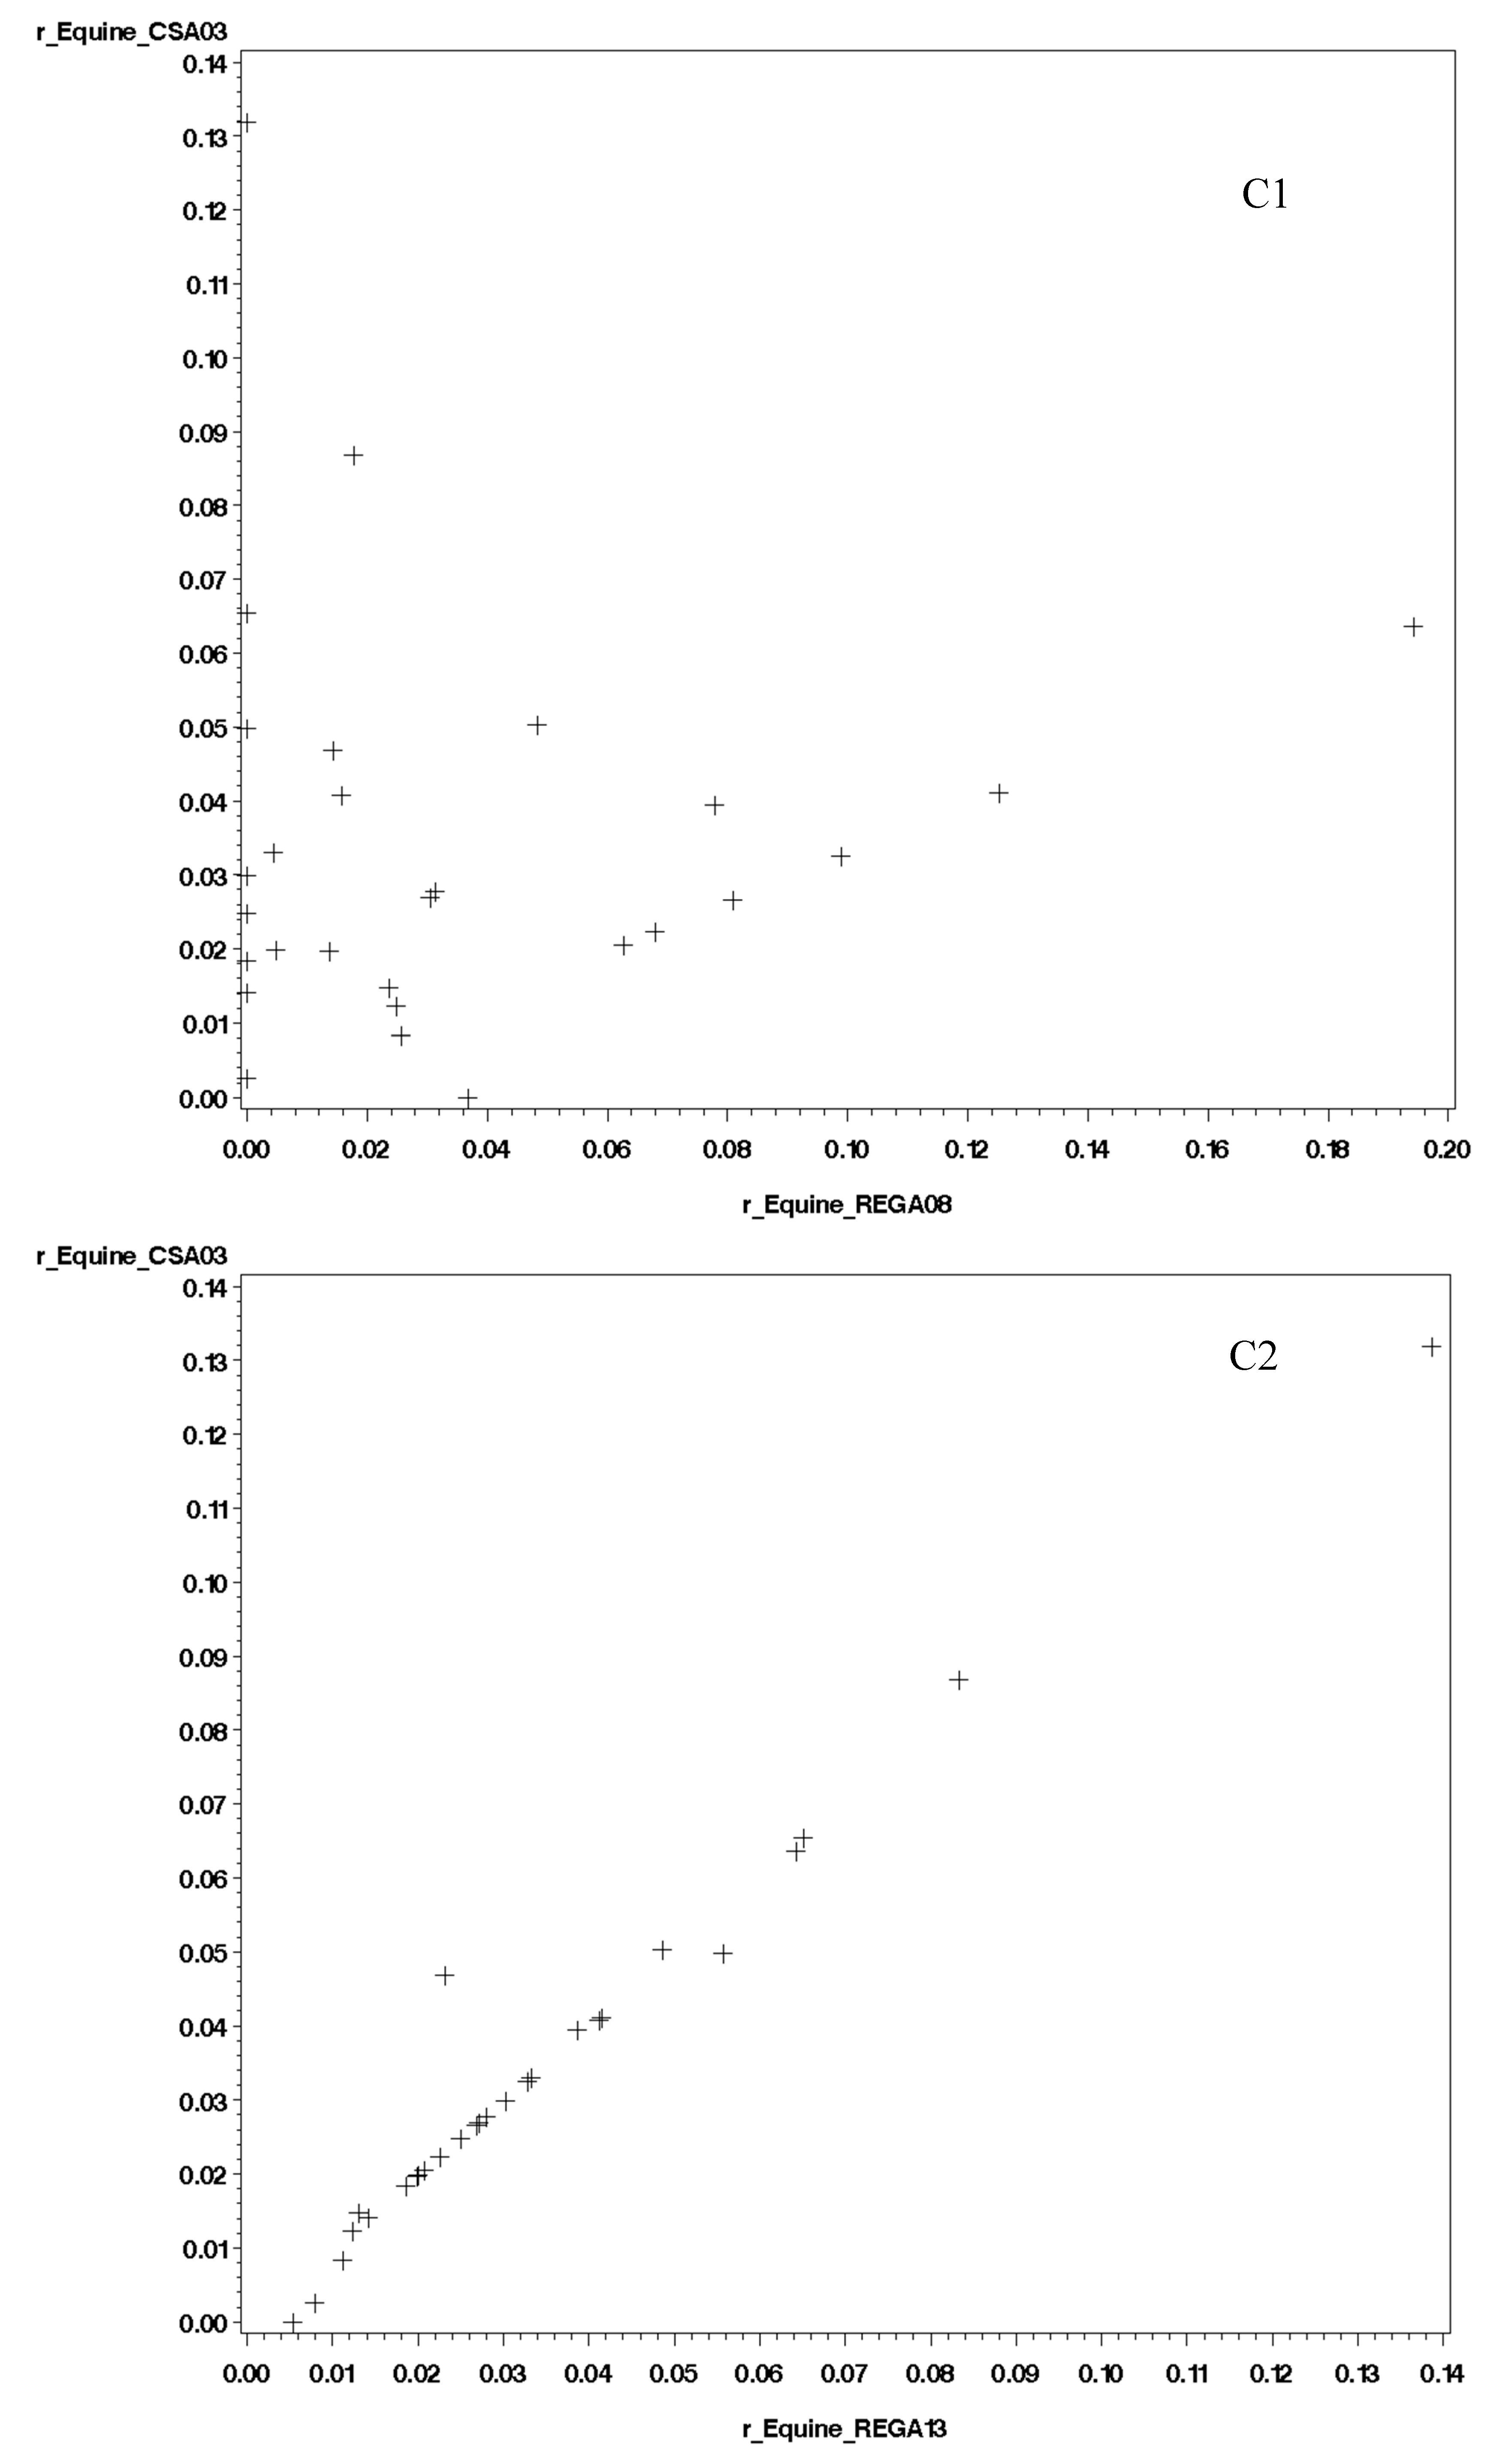
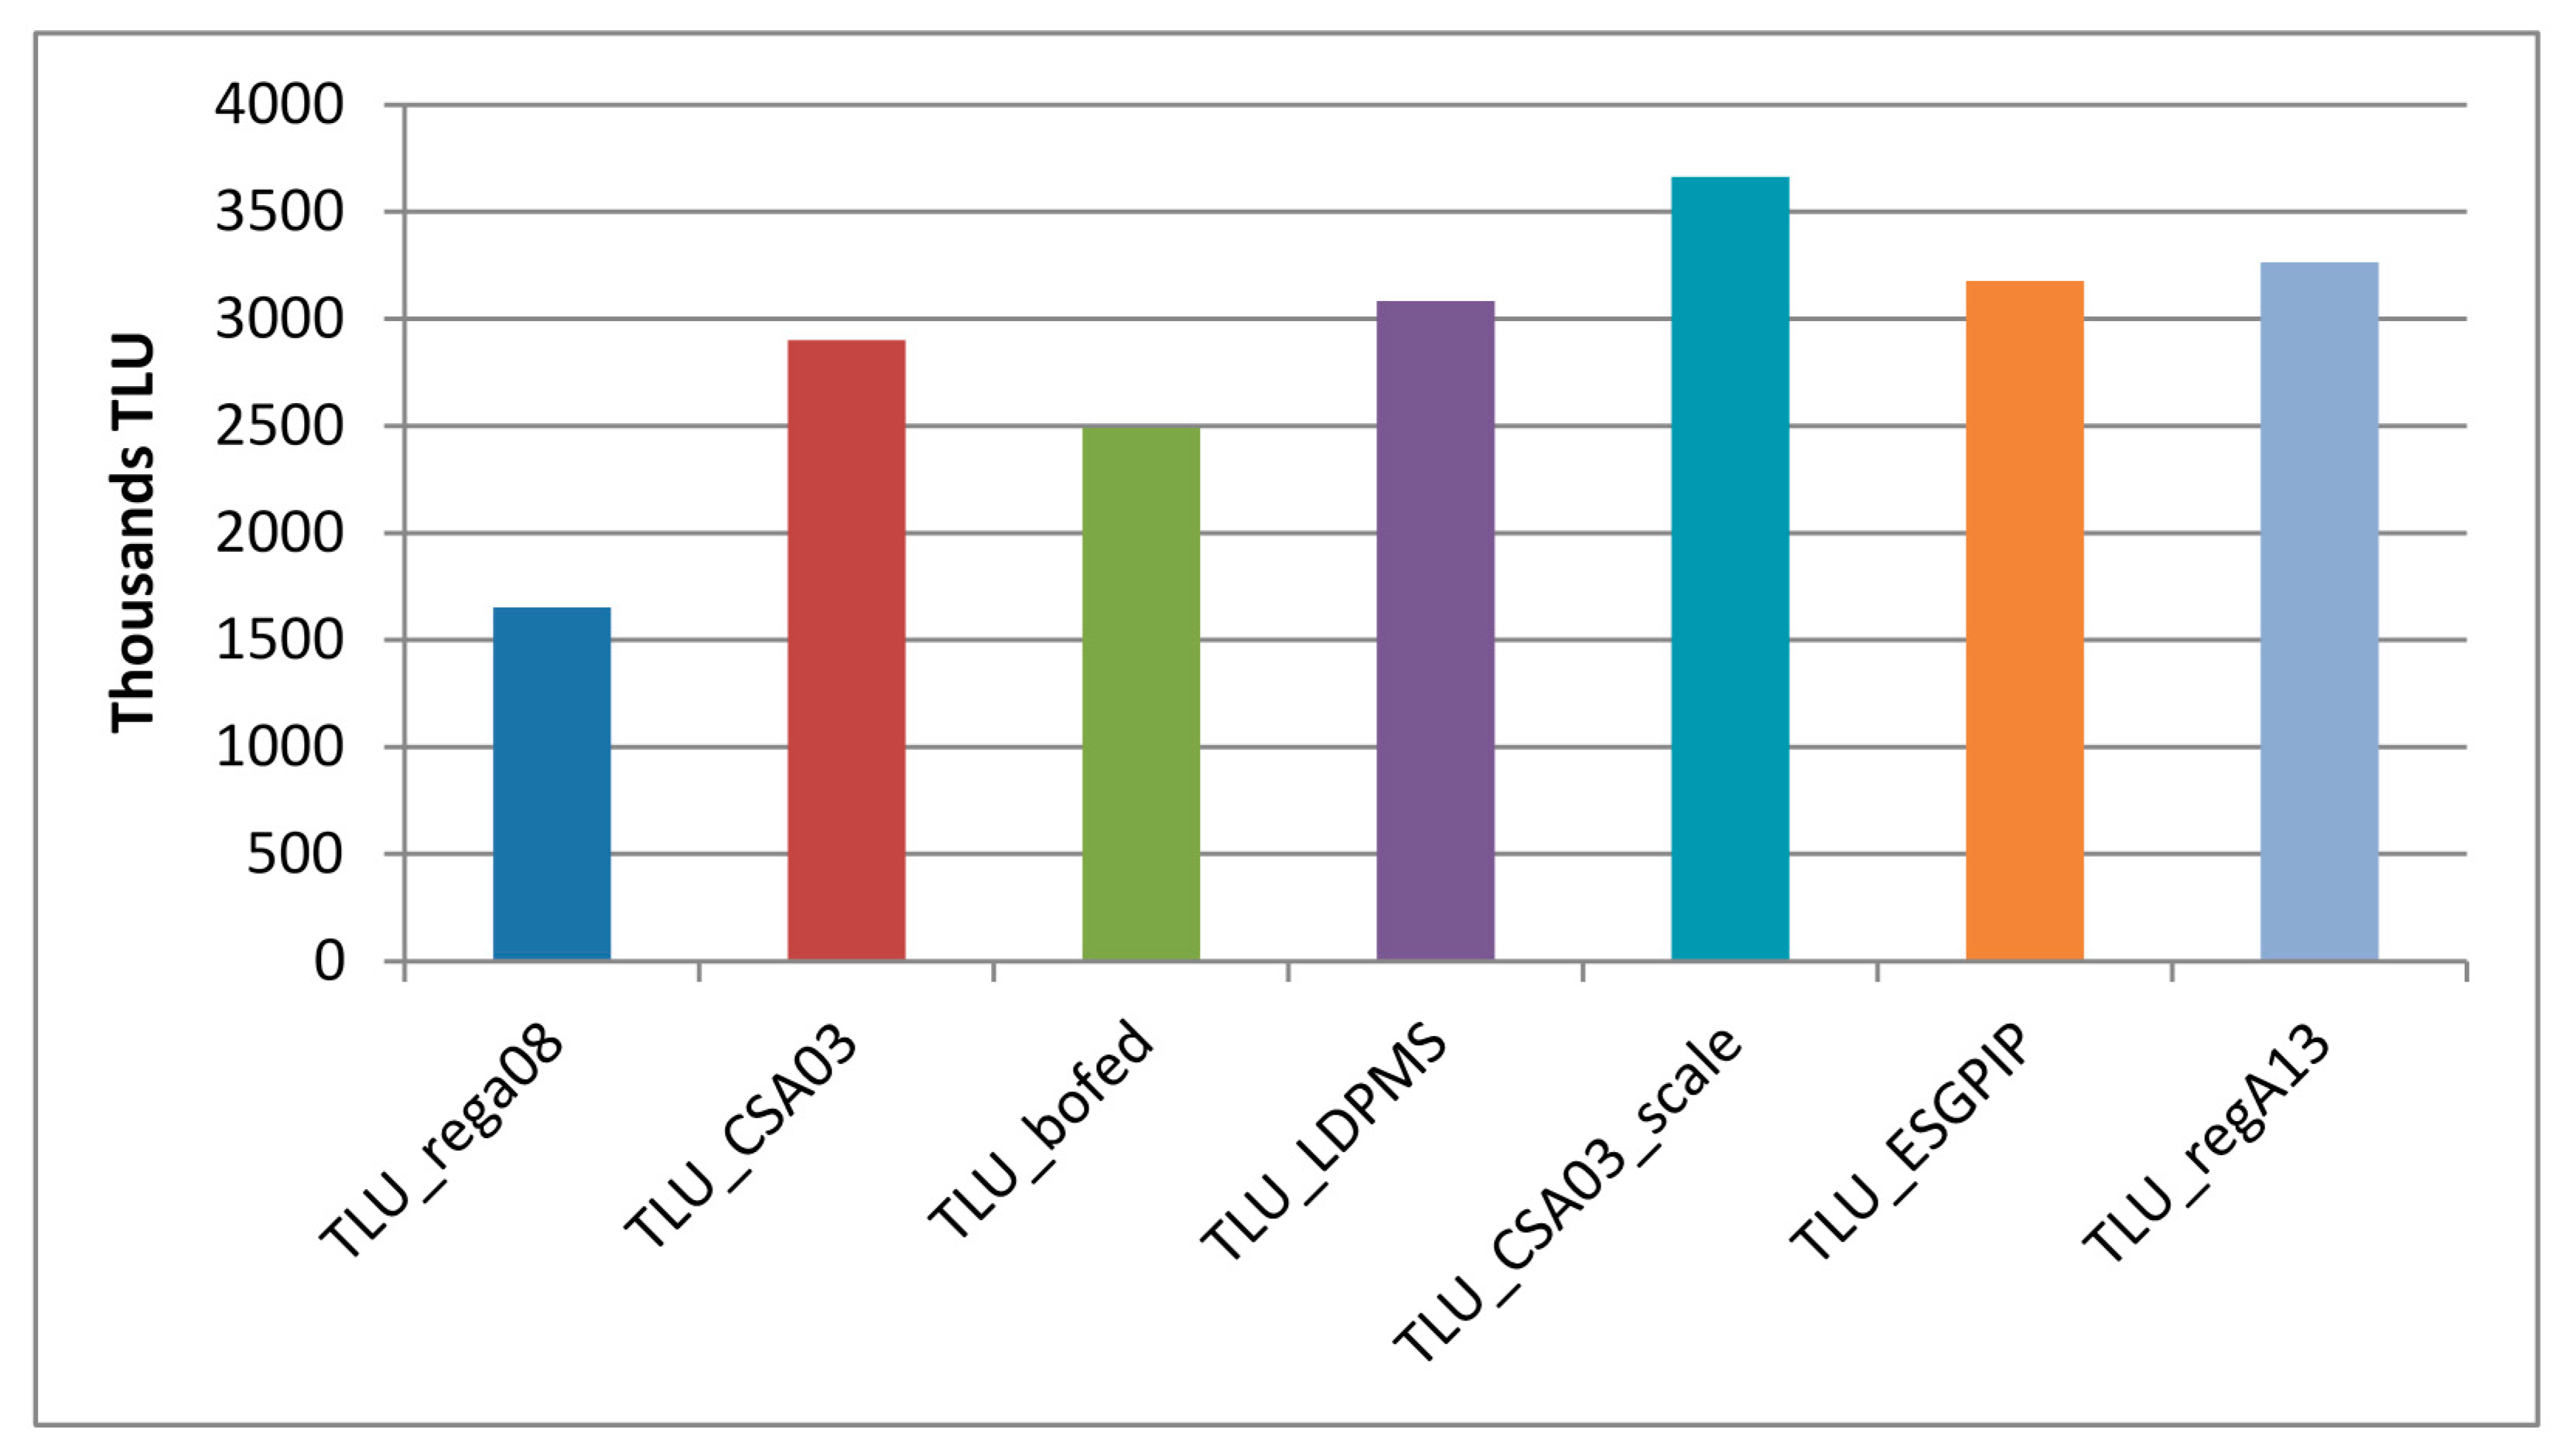
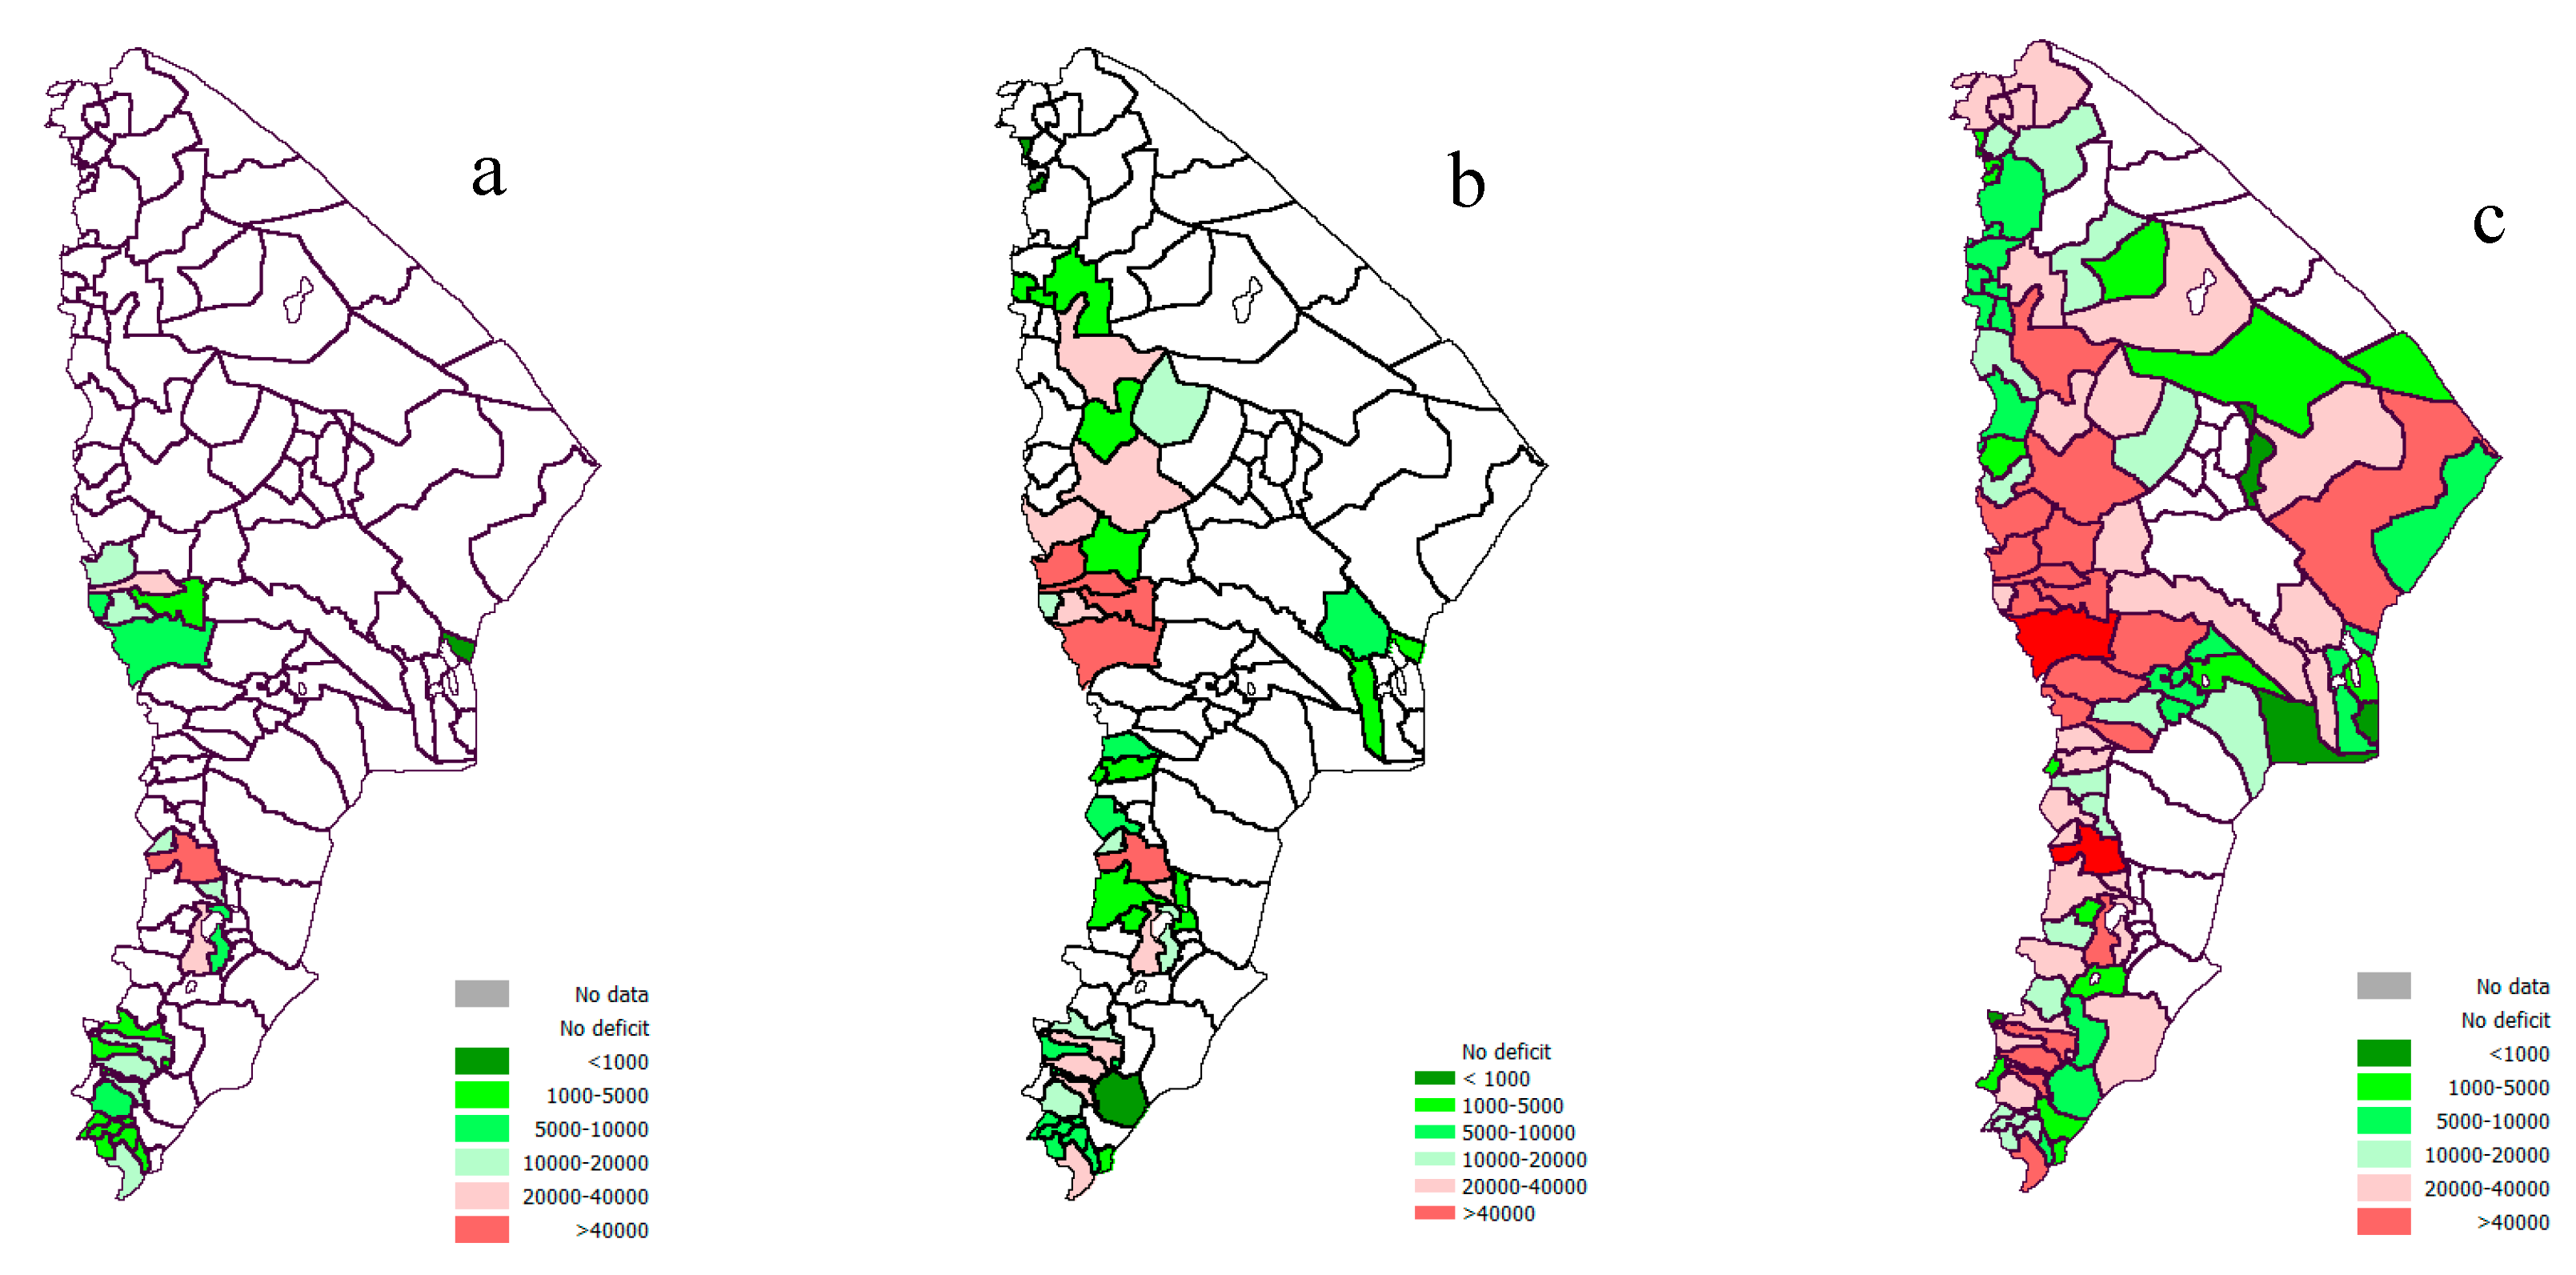
5
A clear reference of TLU numbers in Gebremeskel 2012 was missing and is not further elaborated.
6
Sub-clan areas corresponding to Woreda’s are identified by crossing both maps.
Figure 1. Ethiopia (scale 1:41,000,000) Afar State, zones and woredas (scale 1:9,200,000).
Land 06 00082 g001
Figure 2. The base map of the sub-clan areas (scale 1:3,700,000).
Land 06 00082 g002
Figure 3. Afar Land Use Map (scale 1:5,500,000).
Land 06 00082 g003
Figure 4. TLU in the Afar by data source.
Land 06 00082 g004
Figure 5. TLU by zone and data source.
Land 06 00082 g005
Figure 6. Livestock distribution in TLU with sub-clan totals at own territory (panel a) and annual fodder supply expressed in TLU equivalents (panel b) (scale 1:6,500,000)
Land 06 00082 g006
Figure 7. Surplus (panel a) and deficit (panel b) of annual fodder supply in case of no migration expressed in TLU (scale 1:6,500,000).
Land 06 00082 g007
Figure 8. Harkamella sub-clan, Belig (a), Keremet (b), Bega (c) and Tsedaye (d) seasons (scale 1:9,900,000).
Land 06 00082 g008
Figure 9. Wadijma sub-clan, Belig (a), Keremet (b), Bega (c) and Tsedaye (d) seasons (scale 1:9,900,000).
Land 06 00082 g009
Figure 10. Annual livestock presence in TLU after migration (panel a), annual fodder supply expressed in TLU equivalents (panel b) (scale 1:7,200,000).
Land 06 00082 g010
Figure 11. Surplus (panel a) and deficit (panel b) of annual fodder supply expressed in TLU equivalents after migration (scale 1:7,200,000).
Land 06 00082 g011
Figure 12. Ratio of livestock demand over fodder supply after migration (scale 1:7,200,000).
Land 06 00082 g012
Figure 13. Comparing seasonal herd presence during the Belig (a), Keremet (b), Bega (c) and Tsedaye (d) seasons with the no migration option (upper) (scale 1:7,900,000).
Land 06 00082 g013
Figure 14. Ratio feed demand over supply for ’Worst, ‘Baseline’ and ‘Best’ scenario.
Land 06 00082 g014
Figure 15. Results of sensitivity analysis. Ratio feed demand over supply for ’Best’, ‘Baseline’ and ‘Worst’ scenario.
Land 06 00082 g015
Figure 16. Surplus feed: ‘Best’ (panel a), ‘Base’ (panel b) and ‘Worst’ (panel c) scenario’s (scale 1:7,200,000).
Land 06 00082 g016
Figure 17. Feed deficits: ‘Best’ (panel a), ‘Base’ (panel b) and ‘Worst’ (panel c) scenarios (scale 1:7,200,000)
Land 06 00082 g017
Table 1. Rainfall dependent forage production functions.
AreaEquation (Number of Observation; R2)Reference
Amboseli (Tanzania)Y = −367 + 3.8X(6; 0.99)[53]
Kiboko (Kenya)Y = 262 + 4.41X(38; 0.78)[54]
Serengeti (Tanzania)Y = 262 + 4.8X(7; 0.93)[55]
Tsavo (Kenya)Y = 380 + 8.0X(89; 0.65)[56]
Serengeti (Tanzania)Y= −1644 + 10.7X(12; 0.62)[55]
Serengeti (Tanzania)Y = -185 + 6.6X(24; 0.90)[57]
Athi (Kenya)Y = -251 + 1.2X + 0.01X2(24; 0.95)[58]
Serengeti (Tanzania)Y = −1052 + 8.6X(10; 0.56)[55]
East AfricaY = −195.77 + 8.49X(32; 0.67)[59]
Y = Biomass in kg DM ha−1; X = rainfall in mm.
Table 2. Biomass production by land use [60].
Land Use/Cover TypesProduction (Herbage Yield, ton/ha)
Moderately cultivated0.9
Open grassland2.3
Open grassland shrub-bed1.4
Dense shrub-land0.3
Open shrub land (Open bush shrub land)0.8
Open woodland0.9
Wooded grassland shrub bed1.5
Riparian wood/shrub land/bush-land0.5
Table 3. Rule based procedure to map biomass assessment for land use categories in the Woody Biomass project.
Land Use CategoryRule Based Procedure to Assign EIAR/Werer Biomass to LUC of the Woody BiomassHerbage Yield ton/ha
Bareland; Exposed rock 0
Bareland; Exposed sand/soil 0
Cultivated Land; Irrigated50% of Moderately cultivated0.45
Cultivated Land; Rainfed; Cereal Land Cover System; lightly stocked50% of Moderately cultivated0.45
Cultivated Land; Rainfed; Cereal Land Cover System; moderately stocked50% of Moderately cultivated0.45
Cultivated Land; Rainfed; Cereal Land Cover System; unstocked (woody pl)50% of Moderately cultivated0.45
Forest; Montane coniferous; Open (20–50% crown cover)Open woodland0.9
Forest; Riparian; Dense (5–80% crown cover)50 % Riparian wood/shrub land/bush-land0.25
Forest; Riparian; Open (2–50% crown cover)Riparian wood/shrub land/bush-land0.5
Grassland; lightly stockedOpen grassland2.3
Grassland; moderately stocked50% Open grassland1.2
Grassland; unstocked (woody plant)25% Open grassland0.6
Shrubland; Dense (>50% woody cover)Dense shrub-land0.3
Shrubland; Open (20–50% woody cover)Open shrub land (Open bush shrub land)0.8
Wetland; Open waterRiverside0.5
Wetland; Perennial Swamp/Marsh25% of Riverside0.13
Wetland; Seasonal Swamp/Marsh50% of Riverside0.25
Woodland; Dense (>50% tree cover)50% of Open woodland0.45
Woodland; Open (20–50% tree cover)Open woodland0.9
Source: Sutcliffe, 2006 [50] and own computations.
Table 4. Forage production, yield and maximum Tropical Livestock Unit (TLU) estimates for Afar State using rain dependent production functions and rain dependent production functions adjusted for land cover characteristics.
Source EquationForage Production, Rain Dependent (1000 ton)Forage Yield Rain Dependent (ton per ha)Max TLU
Rain Dependent
(in 1000)
Forage Production adj. Land Charact.
(1000 ton)
Forage Yield adj. Land Charact.
(ton per ha)
Max TLU. adj. Land Charact.
(in 1000)
[53]50290.7262437140.51615
[54]75061.0391654050.82350
[55]81131.1423358460.82542
[56]13,3841.9698396521.34197
[55]12,6791.8661594851.34124
[57]98321.4513071701.03117
[58]12,0101.7626694131.34093
[55]10,8441.5565880521.13501
[59]12,7511.8665292901.34039
Average10,2391.4534275591.03286
Table 5. Estimation of total forage production (t DM ha-1) under various rainfall regimes [52].
Rainfall (mm)200400600800Source
West Africa0.61.11.72.2[61]
Zimbabwe (water holding cap.: 100 mm)0.51.72.22.5[62]
Zimbabwe (water holding cap.: 200 mm)0.72.63.23.7[62]
Kenya1.12.33.6-[63]
Table 6. Sources of livestock numbers in the Afar.
DataSourceSpatial coverageYear
Gebremeskel (2012) [60]Zone 1, 3, 42006
CSA03[65]29 Woredas2003
REGA_08[66]29 Woredas2008–2009
CSA (2011) [64]Zone 1,32011
ESGPIP[67]Region-wide2005
LDMPS[68]Region-wide2006
BOFED [69]Region-wide2009
REGA13[70]31 woredas2013
Table 7. Percentage of herds migrating, by season.
BeligKeremetBegaTsedaye
Average30%49%20%8%
Minimum13%30%8%3%
Maximum36%58%34%13%
Table 8. Scenario description.
Herd EstimateDry MatterTLU Conversion
Scenario 1LowLowLow
Scenario 2LowLowBase
Scenario 3LowLowHigh
Scenario 4BaseLowLow
Scenario 5BaseLowBase
Scenario 6BaseLowHigh
Scenario 7HighLowLow
Scenario 8HighLowBase
Scenario 9HighLowHigh
Scenario 10LowBaseLow
Scenario 11LowBaseBase
Scenario 12LowBaseHigh
Scenario 13BaseBaseLow
BaselineBaseBaseBase
Scenario 14BaseBaseHigh
Scenario 15HighBaseLow
Scenario 16HighBaseBase
Scenario 17HighBaseHigh
Scenario 18LowHighLow
Scenario 19LowHighBase
Scenario 20LowHighHigh
Scenario 21BaseHighLow
Scenario 22BaseHighBase
Scenario 23BaseHighHigh
Scenario 24HighHighLow
Scenario 25HighHighBase
Scenario 26HighHighHigh

