Quantifying the Spatiotemporal Pattern of Urban Expansion and Hazard and Risk Area Identification in the Kaski District of Nepal


1
The State Key Laboratory of Remote Sensing Science, Institute of Remote Sensing and Digital Earth, Chinese Academy of Sciences, Beijing 100101, China
2
Department of Remote Sensing and GIS, Faculty of Geography, University of Tehran, Tehran 1417853933, Iran
3
Faculty of Humanities and Social Sciences, Mahendra Ratna Multiple Campus, Ilam 57300, Nepal
4
Everest Geo-Science Information Service Center, Kathmandu 44600, Nepal
*
Author to whom correspondence should be addressed.
Land 2018, 7(1), 37; https://doi.org/10.3390/land7010037
Submission received: 11 January 2018
/
Revised: 9 March 2018
/
Accepted: 13 March 2018
/
Published: 16 March 2018
Abstract
:The present study utilized time-series Landsat images to explore the spatiotemporal dynamics of urbanization and land use/land-cover (LULC) change in the Kaski District of Nepal from 1988 to 2016. For the specific overtime analysis of change, the LULC transition was clustered into six time periods: 1988–1996, 1996–2000, 2000–2004, 2004–2008, 2008–2013, and 2013–2016. The classification was carried out using a support vector machine (SVM) algorithm and 11 LULC categories were identified. The classified images were further used to predict LULC change scenarios for 2025 and 2035 using the hybrid cellular automata Markov chain (CA-Markov) model. Major hazard risk areas were identified using available databases, satellite images, literature surveys, and field observations. Extensive field visits were carried out for ground truth data acquisition to verify the LULC maps and identify multihazard risk areas. The overall classification accuracy of the LULC map for each year was observed to be from 85% to 93%. We explored the remarkable increase in urban/built-up areas from 24.06 km2 in 1988 to 60.74 km2 by 2016. A majority of urban/built-up areas were sourced from cultivated land. For the six time periods, totals of 91.04%, 78.68%, 75.90%, 90.44%, 92.35%, and 99.46% of the newly expanded urban land were sourced from cultivated land. Various settlements within and away from the city of Pokhara and cultivated land at the river banks were found at risk. A fragile geological setting, unstable slopes, high precipitation, dense settlement, rampant urbanization, and discrete LULC change are primarily accountable for the increased susceptibility to hazards. The predicted results showed that the urban area is likely to continue to grow by 2025 and 2035. Despite the significant transformation of LULC and the prevalence of multiple hazards, no previous studies have undertaken a long-term time-series and simulation of the LULC scenario. Updated district-level databases of urbanization and hazards related to the Kaski District were lacking. Hence, the research results will assist future researchers and planners in developing sustainable expansion policies that may ensure disaster-resilient sustainable urban development of the study area.
1. Introduction
Land-cover refers to the physical and biological materials over the Earth’s surface [1]. Land-cover change occurs as a natural process, whereas land use change occurs due to human activities [2,3]. Urbanization is the proportion of a population living in urban areas [4]. Rapid urbanization affects land use worldwide and creates major challenges for planners and policy makers in making cities for more sustainable [5]. Hazards are single, consecutive, or collective physical events that cause the loss of lives or property, socioeconomic disruption, or environmental deterioration. Vulnerability is the condition generated by physical, social, economic, and environmental factors that influence the susceptibility of a community to the impacts of hazards [6]. These phenomenon are either introduced via natural causes and/or by humans [7,8] and are globally recognized due to their widespread occurrences [9,10,11,12]. Numbers of natural hazards and the loss and damages due to such events have increased globally in the past few decades [12]. A total of 330 disasters were triggered by the beginning of 2014, and this increased to 376 in 2015 [13]. In 2015, various disasters killed a total of 22,765 people worldwide, victimized 110.3 million, and caused loss and damage worth $70.3 billion. The period between 2010 and 2015 was characterized by the severe earthquakes, particularly in Chile, Haiti, New Zealand, Japan, and Nepal [14]. The continent of Asia was the site of 62.7% of the deaths and 49.15% of the total damage caused by disasters. Seven Asian countries are in the top ten list of countries with the highest total death count [13]. These are mainly developing countries with low-income and lower-middle economies [8,15]; they experience greater loss and damage due to hazards. Low income and lower-middle economies account 69.9% of the total victims. Nepal, DPR Korea, Myanmar, and Somalia have acquired the highest number of victims since 2005 [13]. Nepal is listed as the 20th most disaster-prone country in the world and the 30th most flood-vulnerable country [16]. Landslide, mass movements, and floods are common occurrences in hilly and mountainous regions of Nepal [17]. In 2014, there were 588 disaster-related mortalities of which 294 were landslide and flood related [18]. More than 4300 landslides were recorded in Nepal after the Gorkha earthquake (of magnitude 7.8) that took place on 25 April 2015 and its subsequent aftershocks. Flashfloods and landslides that took place on July 2016 killed 120 people, 18 remained missing, 151 were injured, and 2100 homes were damaged [19].
Remote sensing (RS) and geographic information system (GIS) technologies are globally applied key tools for the accurate characterization of LULC change [20,21,22,23,24,25] and monitoring and mapping multiple hazard areas [11,15,26,27,28,29,30,31]. RS and GIS-based risk-area mapping is recognized as an imperative process to obtain effective hazard risk reduction and mitigation output [9]. Monitoring over-time changes requires consistency among maps, both ontologically and statistically [22], and time-series remote sensing data has made it possible to monitor changes in urban structure [32] and LULC [33,34]. Application, GIS, and remote sensing along with LULC modeling provides an wider understanding of human and environmental systems and improved knowledge of future changes cities are to confront [35,36]. Land change-related research works are cooperative for land managers and policy makers to predict potential future landscape changes; simulation modeling tends to function as the experimental tool that helps governments to characterize hazard-exposure consequences and their incorporation into hazard mitigation plans [37,38]. LULC models are capable of simplifying the complexity of LULC, analyzing past changes and simulating future changes effectively [39,40]. Urban growth modeling and simulation history dates back to the 1950s [41]. It is gradually gaining a wide range of attention [35,42,43]. A cellular-automata Markov (CA-Markov) model is appropriate to simulate the LULC change in multiple time scales [35,40] and determine the actual amount of change in land use classes [44,45,46,47]. Furthermore, few studies has integrated LULC scenarios with hazards exposure and population [37]. Consequently, exploring multiple hazard risks is a fundamental prerequisite to establishing sustainable disaster risk management plans.
The study area, the Kaski District, contains huge natural caves. Deep gorges exist from the northernmost to the southernmost part of the area where water often disappears underneath and only its sound can be heard (e.g., the Mahendra bridge area within Pokhara City) [48]. The walls of the Sabche Gang consists of sedimentary rocks (mostly limestone) belonging to the Tibetan series of the Higher Himalaya [49], which primarily contain metamorphic with some sedimentary and igneous rocks [50]. Similarly, the Higher Himalaya is prone to Glacial lake outburst floods GLOFs and avalanches, while the Fore Himalaya receives high rainfall and is vulnerable to geodisasters. Rock fall is more frequent because of the reduced soil deposits on the steep slopes. Due to the orographic effects, the south Pokhara area gets higher rainfall than other parts of the country [51]. The mean annual rainfall at the Lumle and Pokhara stations is 5700 and 3967 mm, respectively [52]. Various geohazards in the district are associated with the geophysical setting of the Kaski District. A total of 5000 houses in various villages of the district are at risk of hazards [53]. Land collapse, land subsidence, and sinkhole hazards are most prominent within Pokhara City [54]. Thulibesi phant in Armala, where 117 sinkhole spots were observed, is exposed to severe sinkhole hazards [55]. Sarangakot and Kaskikot within the Phewa watershed [56] and the Rupakot area of the Rupa watershed [57] are prone to landslide hazards. The Phewa Lake catchment area in Pokhara witnessed a shallow seated landslide due to extreme rainfall in 2007 [51]. The area has an earthquake hazard probable intensity of VIII MMI, [58] while several settlements and river banks are at high risk of liquefaction [8,58]. Consequently, this area experiences bare rock cliffs and landslides [50]. Studies [49,59] have explored the historical occurrences of mass wasting [60] and flash floods from 400 to 1100 CE. The latest hyper-concentrated flash floods occurred on 5 May 2012 in the Seti River within Pokhara City. It claimed [60,61] 40 lives, while 32 went missing; economic loss was worth NRS 85 million [62]. Hazards of this kind may have low recurrence rates but leave important consequences and are a substantial threat for the growing population [60]. Unplanned cities [6,63] with rampant urban sprawl within the unregulated municipal system [64], like the unplanned city centers and fringes of the Kaski District, are at high risk of hazards. Settlements within the core city have weak structures and also are extended in the hazard risk areas. This trend is predicted to continue in the future [8].
Additionally, the region has been undergoing high population growth and an unprecedented rate of urbanization in the recent decades. Rural–urban migration, high population growth increase, and the reclassification of rural areas into urban areas are significantly influencing an urban population increase [8]. According to the Central Bureau of Statistics (CBS) in 2011 [52], the total number of annual immigrants in the district was 8000. The population of the district was 221,272 in 1981, and this increased to 292,945 in 1991, 380,527 in 2001, and 492,098 in 2011. The average annual growth rate as per the periodical analysis was 3.23%, 2.98%, and 2.93% during 1981–1991, 1991–2001, and 2001–2011, respectively. Based on new and local-level reconstruction, the total urban population of the district accounted for 84.16% (in Pokhara-Lekhnath) of the total district population of 2011. The new constitution of Nepal—promulgated in 2015 through the Constitution Assembly—legally and institutionally mandated the reconstruction of the administrative units within a federal state. During the reconstruction, former Village Development Committees were integrated into what was the Pokhara Sub metropolitan; this is now known as the Pokhara-Lekhnath Metropolitan City. The urban land area of the Seti watershed was 24.03 km2 in 1990; it has increased by 60% and reached 54.20 km2 in 2013. A total of 29.19 km2 prime cultivated land was transformed into urban area [8].
The land resource mapping project (LRMP 1986) and the topographical data prepared by the Cadastral Survey Branch for the Survey Department in 1998 [65] are the two official databases for the Kaski District. These databases cover a limited time period and, hence, do not show the long-term LULC change of the study area. A detailed geographical study of Pokhara, Kaski was carried out by Gurung in 1965 [66]. Yet, there are few studies have assessed the hazard risk scenario [54,55,56,57,58] and urbanization trends [67,68] of Pokhara City and the Seti watershed [8]. However, long-term time-series studies of urbanization and the hazard risk of the entire Kaski District is lacking. Disaster-resilient sustainable development and urban planning is hindered due to the lack of reliable district-level databases. Disasters capture widespread attention only in relation to the extreme loss of lives and properties. With this in mind, this research aims to analyze the spatiotemporal dynamics of urban expansion on an annual basis from 1988 to 2016 using Landsat time-series images. It also aims to predict the urban expansion scenario by 2025 and 2035 using the CA-Markov model and identify the major hazard risk areas of the district.
2. Materials and Methods
2.1. Study Area
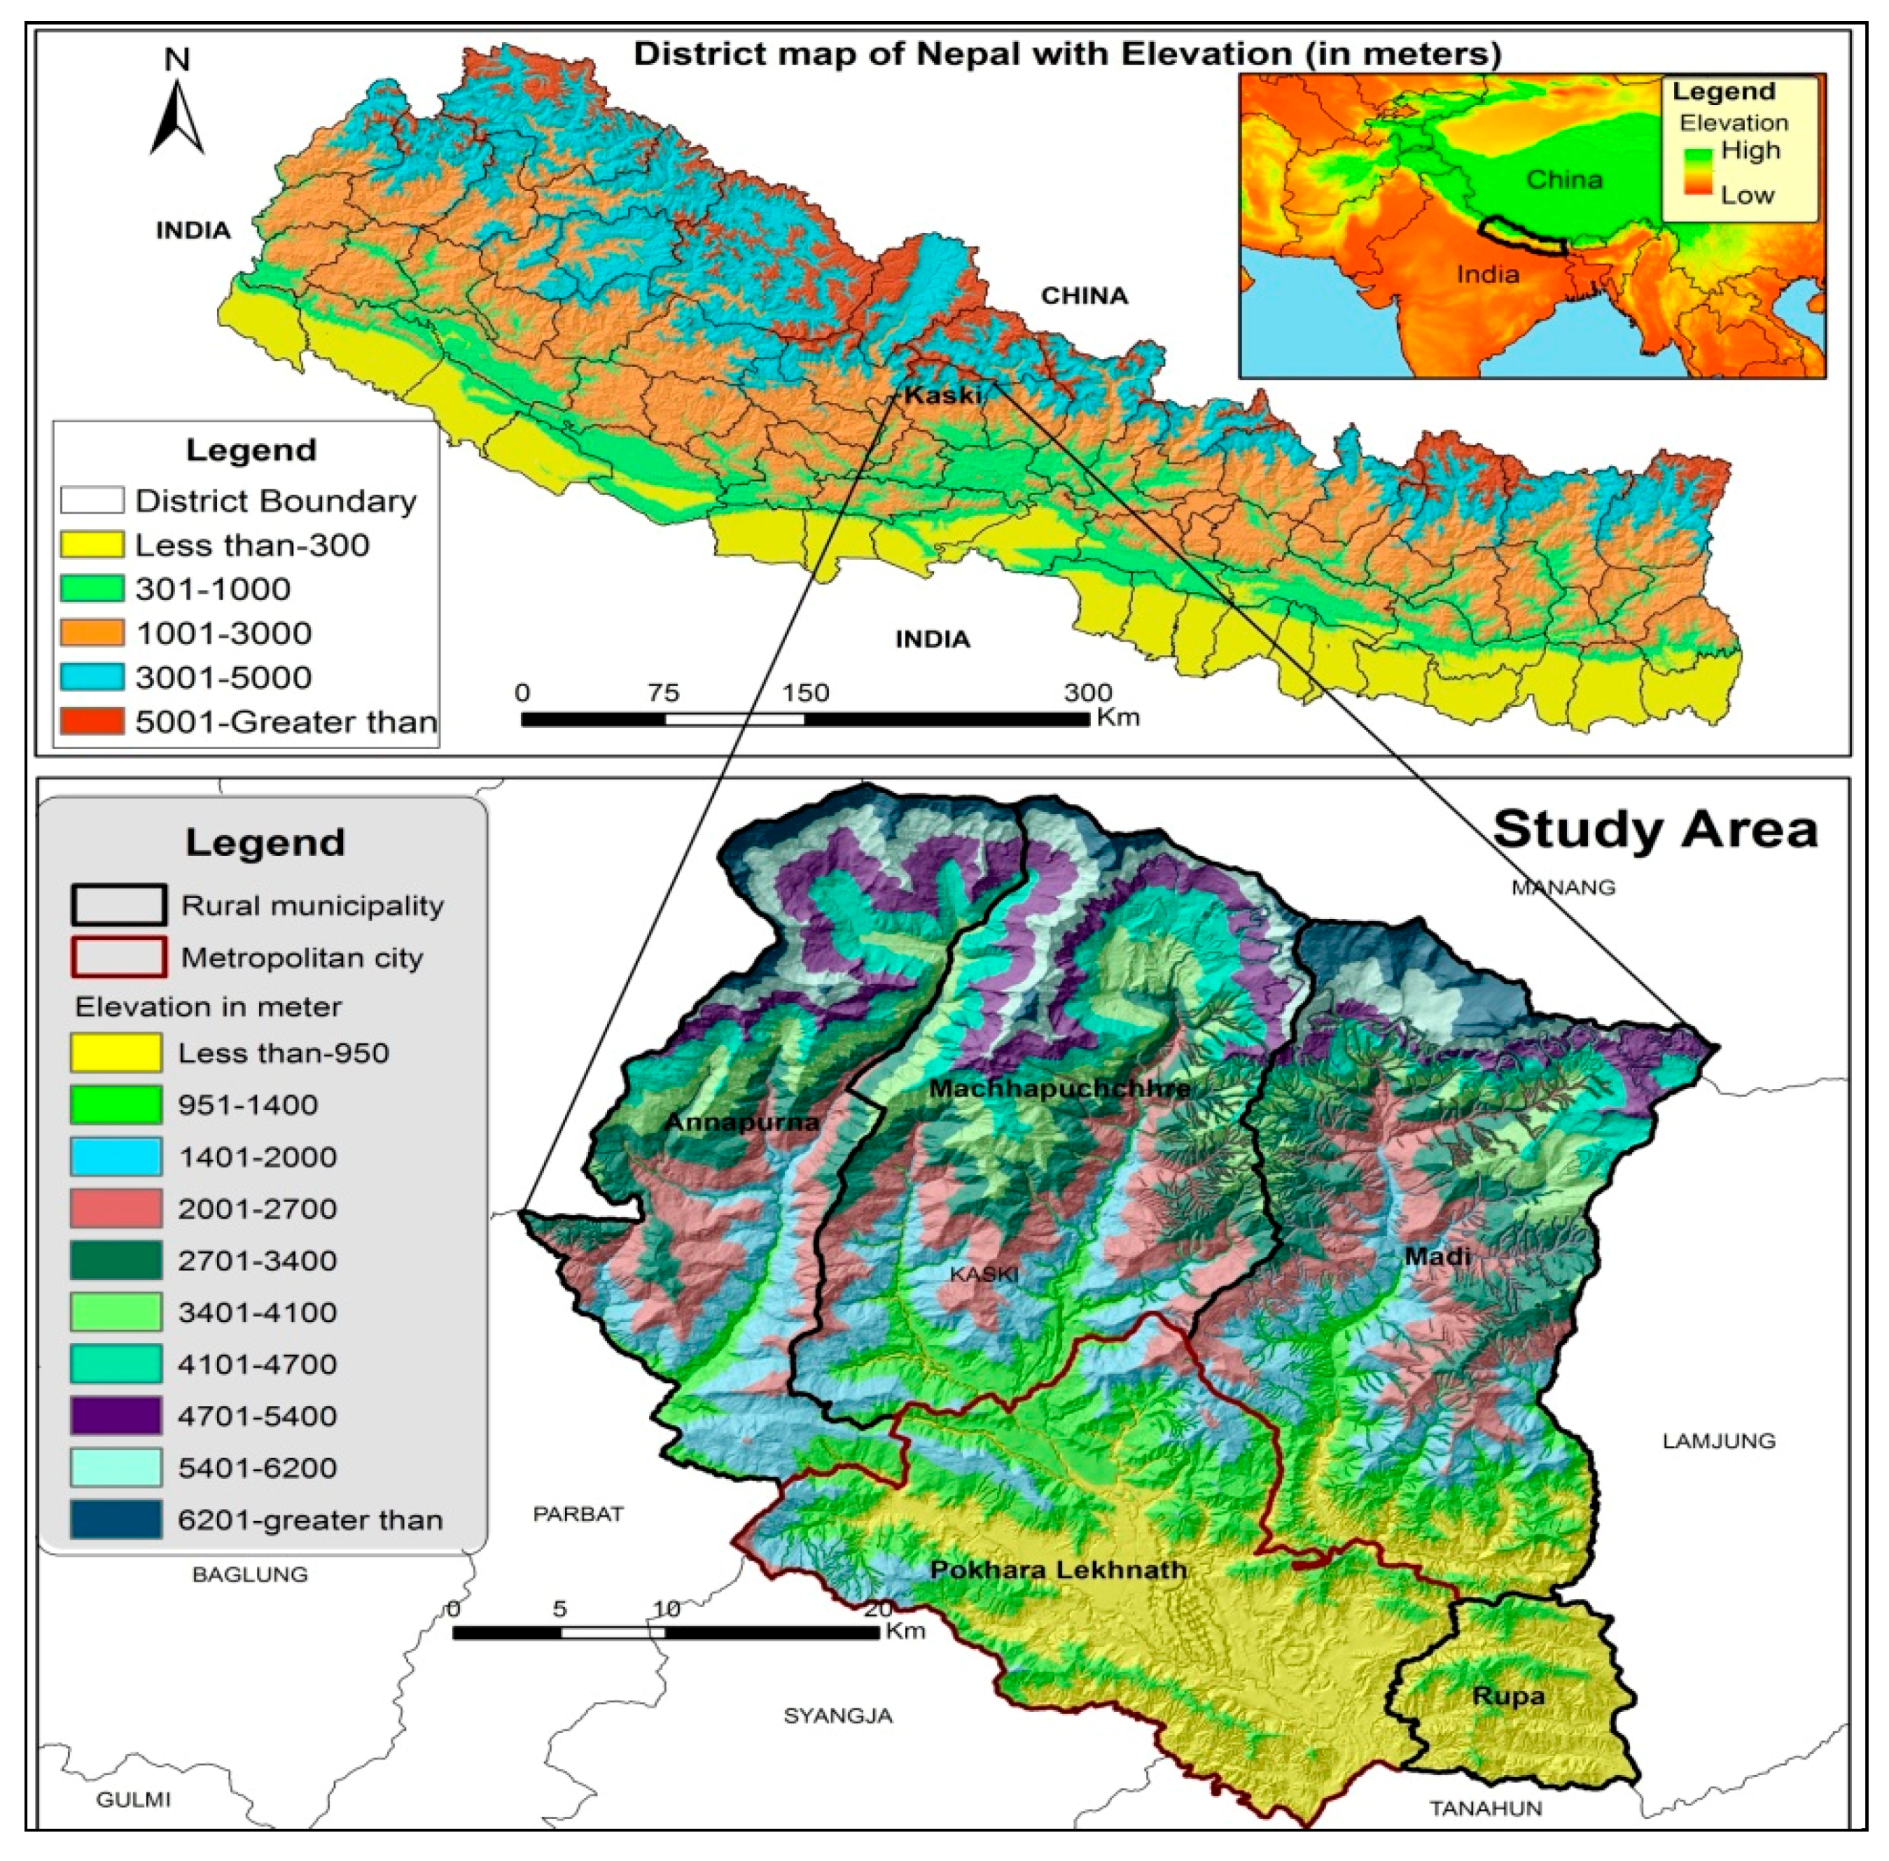
The study area (Figure 1), Kaski District in the Gandaki Zone of Nepal’s Western Development Region, is geographically situated in the southern lap of the Annapurna Mountain range, the Mahabharat Great Himalayan range, and the Midlands. The district is located between 28°6′ to 28°36′ N and 83°40′ to 84°12′ E. It covers an area of 2088.25 km2 and ranges from 450 to 8091 MASL (i.e., Annupurna, the tenth highest mountain peak of the world).
The land surface of the district can be divided into the High Himalayan Massit, the Middle Mountain, and hills. The climatic condition varies according to the elevation of the area. It is subtropical in altitudes of up to 1500 m in the southern part, temperate in altitudes of 1500–2000 m, temperate-cold in altitudes of 2000–3000 m, alpine in altitudes of 3000–4500 m, and tundra in altitudes of 4500 m and above. The region above 4500 m gets occupied by a thick snow cover year-round and has 11 integrated mountain peaks above 7000 m [69]. The Seti, Mardi, Madi, and Modi rivers (and their tributaries) as well as various lakes (Phewa, Rupa, Begnas, Dipang, Maidi, etc.) are the major water sources of the district.
The southern part of the Annapurna Himal presents one of the sharpest contrasts in landscape; and the highlands in the north have the highest relief value than southern hills [66]. The mountain ranges in the north, the deep gorges, Seti River, Davi’s Falls, several natural caves, and the large lakes are attractions for the large numbers of domestic and global tourists; this fosters the socioeconomic activities that influence urbanization. Additional drivers of urbanization processes of the area include its plentiful water resources, suitable climatic condition, promising livelihood opportunities, and access to various public services [70]. Administratively, the Kaski District is divided into one metropolitan (Pokhara-Lekhnath) and four rural municipalities (Rupa, Madi, Machhapuchhre, and Annapurna).
2.2. Data
Geometrically, radiometrically, and topographically corrected surface reflectance (SR) Landsat thematic mapper (TM), enhanced thematic mapper (ETM+), and operational land image (OLI) (with Path/Row 142/40) images from 1988 to 2016 were collected from the United States Geological Survey (USGS) website (https://earthexplorer.usgs.gov/) [71] (Table 1). Landsat 5 TM and Landsat 7 ETM with SR data product was generated from the Landsat Ecosystem Disturbance Adoptive Processing System (LEDAPS) developed by NASA [72]. The Landsat 8 OLI-SR data was generated from the Landsat Surface Reflectance Code (LaSRC) [73], which is commonly used in land-cover monitoring and mapping [20]. Most images were clear and nearly free of clouds. However, some were covered by seasonal snowfall in northern part of the district. The Scan Line Corrector (SLC)-off data was excluded. All images were projected in UTM zone 45 of WGS 1984. The administrative boundary data at district, municipal, and village levels were acquired from the Survey Department of Nepal [74]. Shuttle Rader Topographical Mission (SRTM) digital elevation model (DEM) with 30-m resolution (https:/lta.cr.usgs.gov/SRTM) was used for the verification of slope of the study area. In addition, high-resolution images from Google Earth (http://earth.google.com) of topographical maps from multiple dates published by the Survey Department of the Government of Nepal in 1998 (scale 1:25,000) [74] were used for references. Socioeconomic data was collected from the CBS [52,75]. Additional datasets such as hazard risk area database for the Seti watershed was collected from Department of Mine and Geology (DMG), Government of Nepal [76], disaster reports from Ministry of Home Affairs (MoHA) for 2015 [16] and 2017 [77] and District profile (district information report) 2016 was collected from District Development Committee (DDC) office website (e.g., www.ddckaski.gov.np) [69]. Furthermore, major land-cover change, road networks, and hazard area information were gathered using GPS during the data collection and field verification campaign in 2015 and 2016.
2.3. Image Processing and Analysis
Image processing was carried out in the ENVI environment. A supervised approach using a support vector machine (SVM) classifier [21] was employed for the abstraction of LULC and the change analysis. There are multiple approaches for LULC classification [21,22]. In this study, we have used a nonparametric machine learning SVM algorithm, which has been applied successfully with sufficient accuracy in several studies [78,79,80]. The outputs of SVMs varies depending on the choice of the Kernel function and its parameters [81]. In the current study, the default work situation (DWS), a radial basis function (RBF) Kernel has been accepted during image classification. In the current version of ENVI (version 5.3), SVM classifier provides four types of Kernels: e.g., linear, polynomial, radial basis function (RBF) and sigmoid. The RBF Kernel, which works well in the most cases [82]. The penalty parameter maximum value 100 was allocated during the classification.
2.4. LULC Extraction, and Analysis
A modified version of the land-cover classification scheme was used for remotely-sensed data, as recommended by Anderson et al. [83]. After extensive field observation and using topographical map developed by Government of Nepal in 1998 (scale 1:25,000) [74], 11 land-use classes were identified namely urban/built-up, cultivated, forest, shrub, grass, barren land, sand, water body, swamp, ice and snow cover, and open (Table 2). The northern part of the study area gets covered by permanent and seasonal snow. Meanwhile, cloud-free images of the region during summer and autumn seasons were unavailable. Due to the snowfall in the winter, snow-cover area fluctuates according to season each year. This also determines the area of barren land, forest, and grass. Thus, to achieve more reliable outputs, LULC analysis was conducted on an annual basis.
2.5. LULC Based Transition Analysis
After the final production of an LULC maps, land change modeler (LCM) of the IDRISI/TerrSet software was taken into consideration to explore the LULC transition. For the close analysis of cultivated-to-urban land conversion, LULC statistics in six time periods: 1988–1996, 1996–2000, 2000–2004, 2004–2008, 2008–2013, and 2013–2016 were analyzed using the LCM. The computed transition matrix consisted of rows and columns of landscape categories at times t1 and t2 [35,84].
2.6. Identification of Multihazard and Risk Analysis
Historical events of landslides, floods, and sinkholes and their loss and damage information were collected based scientific research works and other literatures including disaster reports of Ministry of Home Affairs (MoHA) for 2015 [16] and 2017 [77]. Hazard risk area database for the Seti watershed area with the scale of 1:50,000 was collected from Department of Mine and Geology (DMG), Government of Nepal [76] and District profile (district information report) 2016 [69]. The field visit data, hazards risk areas database and LULC information developed by Rimal et al. [8] were also utilized for the analysis. Additional landscape or risk area observations and primary data acquisition were conducted during the field data collection in 2015 and field verification campaign in 2016. Highly risky areas in terms of flood, landslide, sinkhole, and edge fall were captured with the help of GPS. High-resolution Google Earth images were used for the further verification of hazard risk zones. Furthermore, local experts’ knowledge was also taken into consideration. The collected information of risk areas was plotted, and final hazard risk layer was developed using Geographic Information System (GIS) to prepare multiple hazard risk map. The map was overlaid with the land-use map of 2016 and the predicted map of 2035 to develop the risk sensitivity land-use map of 2016 and hazard risk area of 2035.
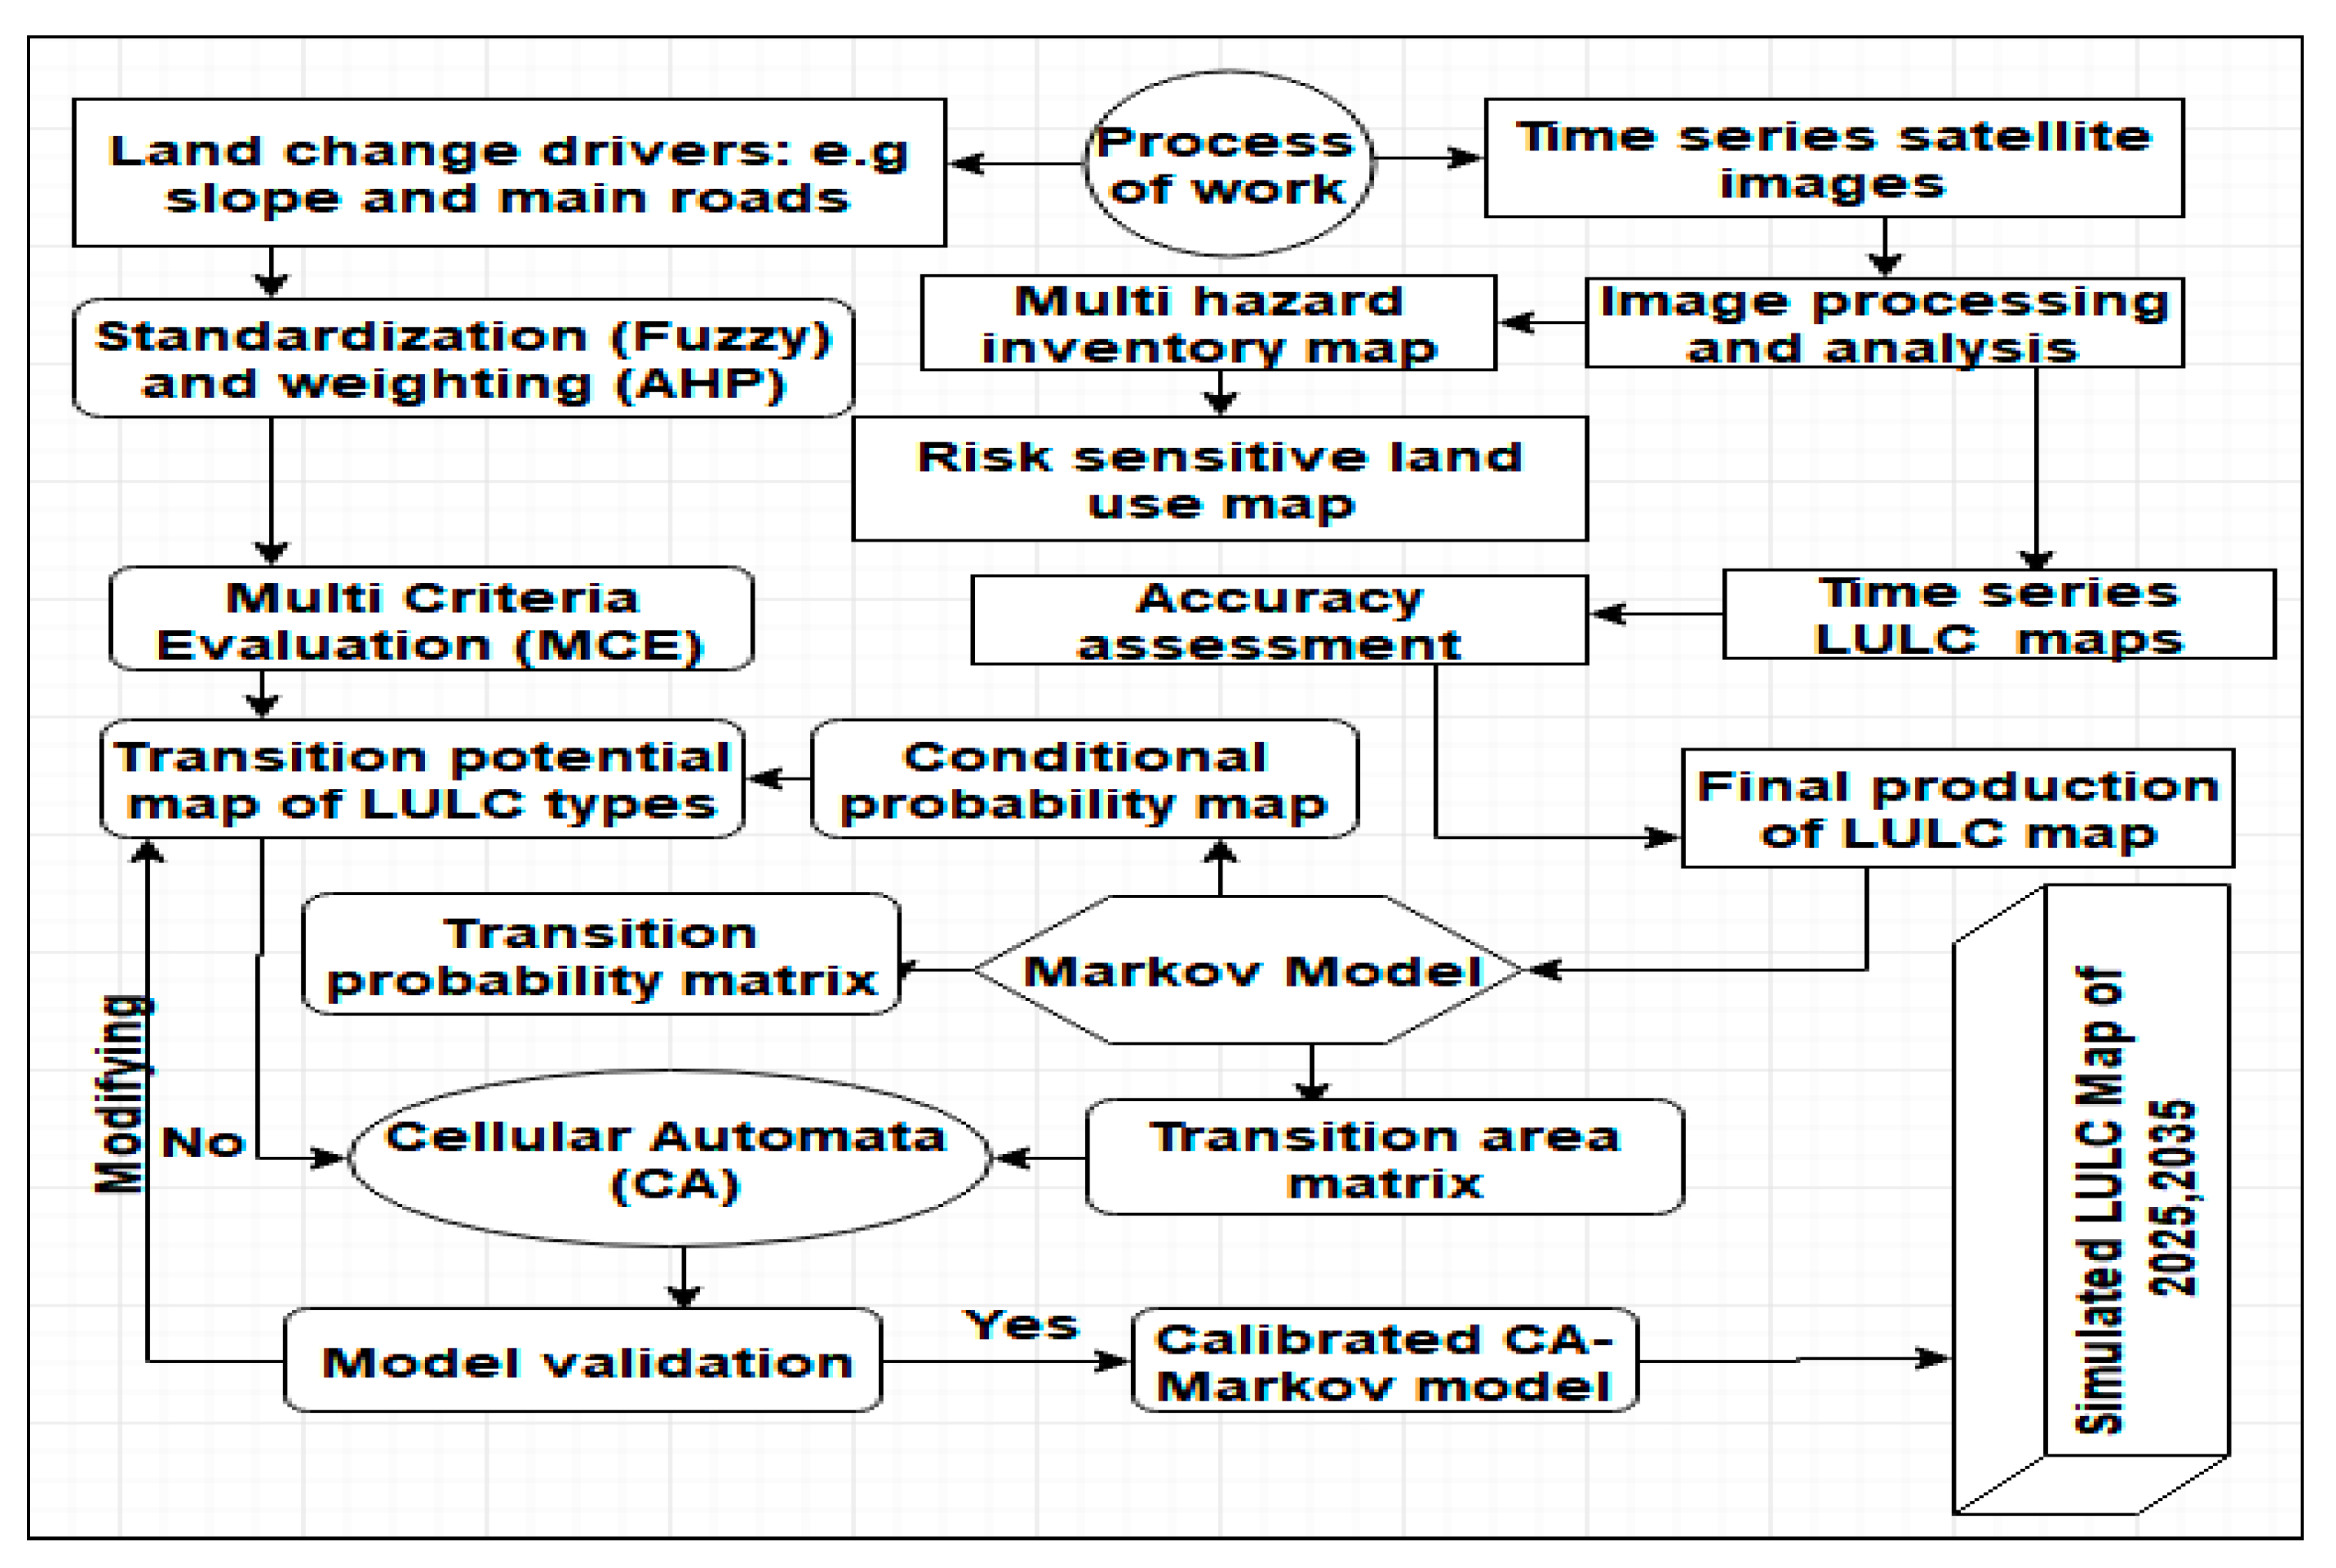
2.7. The CA-Markov Model
In this section, the trend of land-use transformation was observed to predict transformations that would occur by 2025 and 2035. For this, a hybrid model (i.e., CA-Markov) has been widely used to effectively understand and measure urban expansion [35,85] and landscape dynamics [42]. The model mainly comprises the following steps: (a) calculation of the transition area matrix using a Markovian process; (b) generation of transition potential maps; (c) model evaluation based on the Kappa index; and (d) simulation of future land-use using the CA-Markov model. Description of the CA-Markov model and its assumptions are summarized in Keshtkar and Voigt [40]. In this study, the Markov model has computed transitional area matrices based on the historical land-use information from 1995–2005, 2005–2015, and 1995–2015. To produce transition potential maps of urban areas, four general agents (namely distance to main roads, water body, urban areas, and slope) were set as driving factors. The ancillary data was chosen based on similar previous studies [35,40]. Fuzzy membership functions were applied to rescale drive maps into the range of 0 to 1, where 0 represents unsuitable locations and 1 represents ideal locations. In addition, an analytic hierarchy process (AHP) model was run to regulate the weight of driving forces with the use of pair-wise evaluations. The distinct weights and control points are summarized in Table 3. Then, the performance of the CA-Markov model was evaluated using actual (i.e., derived from satellite image) and predicted (i.e., simulated using the transition area matrix of 1995–2005) maps from the year 2015 based on the Kappa index. Since the CA-Markov model tends to predict LULC changes better within the same time span for which the model is calibrated [40], 2025 and 2035 LULC maps have been predicted using the opposite trend of the LULC changes during 2005–2015 and 1995–2015. Accordingly, the LULC map of 2015 was used as a base map to simulate LULC maps for 2025 and 2035 by calculating the transition area matrix of 2005–2015 and 1995–2015, respectively.
2.8. Evaluation of Land-Cover Modeling
Kappa variations were applied to evaluate the model by comparing the land-use map of 2015 with the simulated map of 2015. The accuracy of the models, which was more than 80%, determined them to be potent predictive tools [40,45]. In the present study, Kno, Kstandard, and Klocation were used to validate the model. Descriptions of these Kappa indices are summarized in Keshtkar and Voigt [40]. The detailed study design is presented in Figure 2.
2.9. Accuracy Accessment
Assessment of classification accuracy becomes highly essential for the LULC maps obtained using remote sensing technology [22,84,86]. Due to the unavailability of updated land-cover data, high spatial resolution images of Google Earth from multiple dates, topographical maps published by the Survey Department of the Government of Nepal in 1998 (scale of 1:25,000) [74], land-cover maps from 1990 and 2013 developed by Rimal et al. [8] and GPS points were used as references. In this study, a stratified random sampling was implemented to select a total of 660 ground truth data for the validation of classified images. At least 60 sample points were represented for each class. Finally, accuracy assessment was based on the calculation of the overall accuracy, user’s accuracy, and producer’s accuracy.
3. Results
3.1. LULC Change Analysis of 1988–2016
In the study, overall accuracy, user’s accuracy, and producer’s accuracies of the LULC map for each year were observed in course of accuracy assessment task (Supplementary Information S1). The overall classification accuracy ranged between 85% and 93% (1988 to 2016) was observed, which refers to the suitability and reliability of remote sensing based LULC classification and modeling. The highest producer’s accuracy (100%) was obtained in the swamp cover during 2013 and the lowest (74.24%) in shrub land during 1988. Consequently, the highest user’s accuracy (96.67%) was acquired in urban/built up, 2013 and the lowest (76.67%) in barren land, 1989.
Exploring the spatiotemporal pattern of LULC dynamics is a strong foundation for sustainable urban planning and effective land management [35,84]. The explored research outputs indicate a wide range of fluctuations over the study years in various land-cover classes. Overall changes include (a) a gradual increase in urban/built-up (UB), forest cover (FC) and open field (OF) land areas; (b) a linear decrease in cultivated (CL) and shrub land (SL); (c) high fluctuation in barren land (BL) grass land (GL) and ice and snow-cover (I & SC) land areas; and (d) almost constant sizes of sandy area (SA), water body (WB) and swamp cover (SC).
As per the analysis, it was observed that urban/built-up area experienced the largest transformation during 1988–2016 (Figure 3a). Remarkable changes occurred mainly after 2000 (Supplementary Information S2). The majority of new urban areas over the period were sourced from cultivated land. During 1988–1996, the annual rate of urban growth was 1.79% (increased by 3.46 km2). Of this, 3.15 km2 (91.04%) was converted from cultivated land. Consequently, between 1996 and 2000, the annual rate of urban growth was 4% and there was a total increase of 4.41 km2 in new urban area, of which 3.47 km2 (78.68%) was converted from cultivated land. Between 2000 and 2004, 6.06 km2 of new urban area was developed, and 4.6 km2 (75.9%) of this was from cultivated land (Figure 3a). The annual rate of urban growth reached to 4.74% during this period. In the period between 2004 and 2008, with the annual growth rate of 5.16%, there was 7.85 km2 of new urban area, and 7.1 km2 (90.44%) of this was from cultivated land. Between 2008 and 2013, an additional 9.29 km2 of urban area was developed, and 8.58 km2 (92.35%) of this was converted from cultivated land alone. The growth rate dropped to just 4.05% during this period. The urban expansion rate during 2013–2016 was 3.39%. A total of 5.61 km2 of new urban area was created, and 5.58 km2 (99.46%) of this was transformed from cultivated land. Figure 3b presents the spatiotemporal pattern of urban/built-up areas for six periods from 1988 to 2016.
Urban/built-up areas, which totaled 24.06 km2 in 1988, increased to 60.74 km2 in 2016 (Figure 4a). Contrarily, cultivated land gradually declined from 445.02 km2 in 1988 to 402.55 km2 in 2016 (Figure 4b). Despite fluctuation during different years, forest cover has gained an overall increase in the 28 years of the investigation period. Forest had occupied 841.22 km2 in 1988, and this expanded to 887.25 km2 by 2016 (Figure 4c). Expansion of forest cover is closely associated with privately owned as well as community based forest management programs [8]. The reason behind this is the overall preservation of forest resources because of community forest management programs, and the expansion of private forests in the abandoned cultivated land. The remaining land-cover classes (shrub and water) remained almost constant over the study periods (Figure 4d).
Almost the entire northern portion of the district usually gets covered by ice and snow. However, some variation in ice/snow-cover area was found due to the variation in date and time of the captured images. This has determined the fluctuation of barren land and grass. The higher the ice/snow cover, the lower the barren land and grass and vice versa (Figure 4e). The annual distribution of sand, open field and swamp area is shown in Figure 4f.
For instance, ice/snow had occupied 277.04 km2 in 1988, while 317.36 km2 areas was grassland. As ice/snow-covered area increased to 443.65 km2 in 2010, grassland area dropped down to 152.53 km2 (Supplementary Information S3). Consequently, during 2004, barren land was confined within 32.8 km2 and 411.93 km2 was ice/snow-covered. However, barren land increased to 80.04 km2 in 2005 mainly because of the significant decrease of ice/snow-cover to 287.97 km2. LULC transition maps during 1988–1996, 1996–2000, 2000–2004, 2004–2008, 2008–2013, and 2013–2016 have been presented in Figure 5. Transition map shows that cultivated land area changed into urban/built-up as stated above. The northern part of the study area witnessed remarkable transitions between grass land and ice/snow cover. For example, during 1996–2000, ice and snow cover had occupied large part of grassland. However, during 2000–2004, remarkable areas of grass land were transformed into ice and snow cover. A similar trend was observed in the conversion of barren land and ice and snow cover area.
3.2. Multihazard Risk
Study area exposed to several hazards. The main hazards and its impacted areas are summarized below (Figure 6a–d).
3.2.1. Flood Hazard
The settlements and farm lands at the river banks were found to be at a particular risk of flood hazards. These farm lands and settlements local to the Seti, Bhunge and Phusre rivers, tributaries, and streams are at more high risk of monsoonal flooding. According to the Nepal Disaster Risk Reduction Report for the Kaski District [77], eight people were killed while seven remained missing, three were injured, and 41 households were affected by flood hazard events in the Pokhara, Machhapuchre, Sildjure, Lekhnath, Dhikurpokhari, Ghandruk, and Lamachaur areas of the Kaski District from 2011 to 2017. This was along with an economic loss of NRS 7 million. The northern part of the Seti watershed in the district is highly prone to avalanches and flash floods. However, the discussion of hazard type is beyond the scope this study. The estimated annual soil erosion rate of the Phewa watershed alone is 142,959 tons/year which is 12.2 tons/ha/year.
3.2.2. Edge Fall and Landslides
There is high downpour every monsoon season resulting in severe landslides in several parts. Edge fall can be witnessed in the banks of various rivers and streams. Between 2011 and 2017, landslides claimed 50 lives; three were reported missing and 30 injured while 96 households were affected. Estimated loss was worth NRS 1,450,000. Pokhara, Lekhnath, Kalika, Saimarang, Dhikurpokhari, Bhaudaure Tamagi, Lumle, Hemja, Sarangkot, Salyan, and Thumki were mainly impacted by the landslide events [77]. Major landslides and edge fall risk areas of Kaski District [69] are presented in Table 4.
3.2.3. Land Subsidence and Sinkhole
Sinkhole and land subsidence are the most common and sensitive hazard types prevalent in the district. Random land-use practices and fragile geology are considered the two major factors associated with these hazards. The study area lies in the Ghachok formation, which consists of sediments with limestone fragments. Water in the basin passes through the gravel layer to the dissolvable lime and, finally, underground ponds emerge causing sinkholes and land subsidence. The settlements in close proximity to the Seti riverbank are at high risk of these disasters [8,48]. The Seti basin in Armala is a severely sinkhole-affected area where more than a hundred sinkhole spots can be witnessed. These have displaced the surrounding settlements during 2014. Similarly, various locations within the Pokhara-Lekhnath Metropolitan City have experienced land subsidence. Pokhrel [54], Rijal [55], and Rimal et al. [8] have reported the highly susceptible areas to land subsidence.
Existing settlements are expanded to the hazard risk areas. A total of 16.63 km2 (27.37%) of the urban/built-up area during 2016 is at risk of hazards, while 3.83 km2 (6.30%) of the urban area of the region needs special attention (Figure 7a). According to the prediction analysis, this trend is likely to continue in the future since the new urban areas are spreading to the risk zones. Of the total urban/built-up area by 2035, 18.21 km2 (25.72%) will expand at risk areas and 4.42 km2 (6.24%) will be in the regions which require special attention. The areas which are at high risk to landslides, flood, sinkhole and edge fall within the district are presented in Figure 7b.
3.3. Modeling and Validation of Land-Use Change from 2015 and Onwards
Transitional probability matrices that are produced by Markov model prepare details on the probability of transition between LULC types during the periods 1995–2005 and 2005–2015 (Table 5). For example, this results show that the probability of future changes of shrub land to cultivated area from 1995 to 2005 is 12.9%. This likelihood of transition decreased reasonably to 2.2% in 2015. Table 5 shows that for both periods, sand and cultivated lands possessed the highest likelihood of changing into urban/built-up areas.
In assessing the overall accuracy, using the value of Kno is better than Kstandard [87]. The Kno and Kstandard values were 0.92 and 0.90, respectively. The Klocation value is a reasonable representation of the location by the model and had a value of 0.95. Thus, according to the results obtained from Kappa values, the CA-Markov model is a strong predictive tool for simulating future land-use changes.
To tackle inherent limitations and add special characters to the model, the Markov model required integration with the CA-Markov model [42]. Effectively, the prediction of future changes in 2025 and 2035 requires the definition of the 2015 land-use map, conditional probability images derived from the Markov model, suitability maps from the MCE analysis, transition area matrices (2005–2015), and the selection of a contiguity filter (i.e., 5 × 5 Moore neighborhood Kernel).
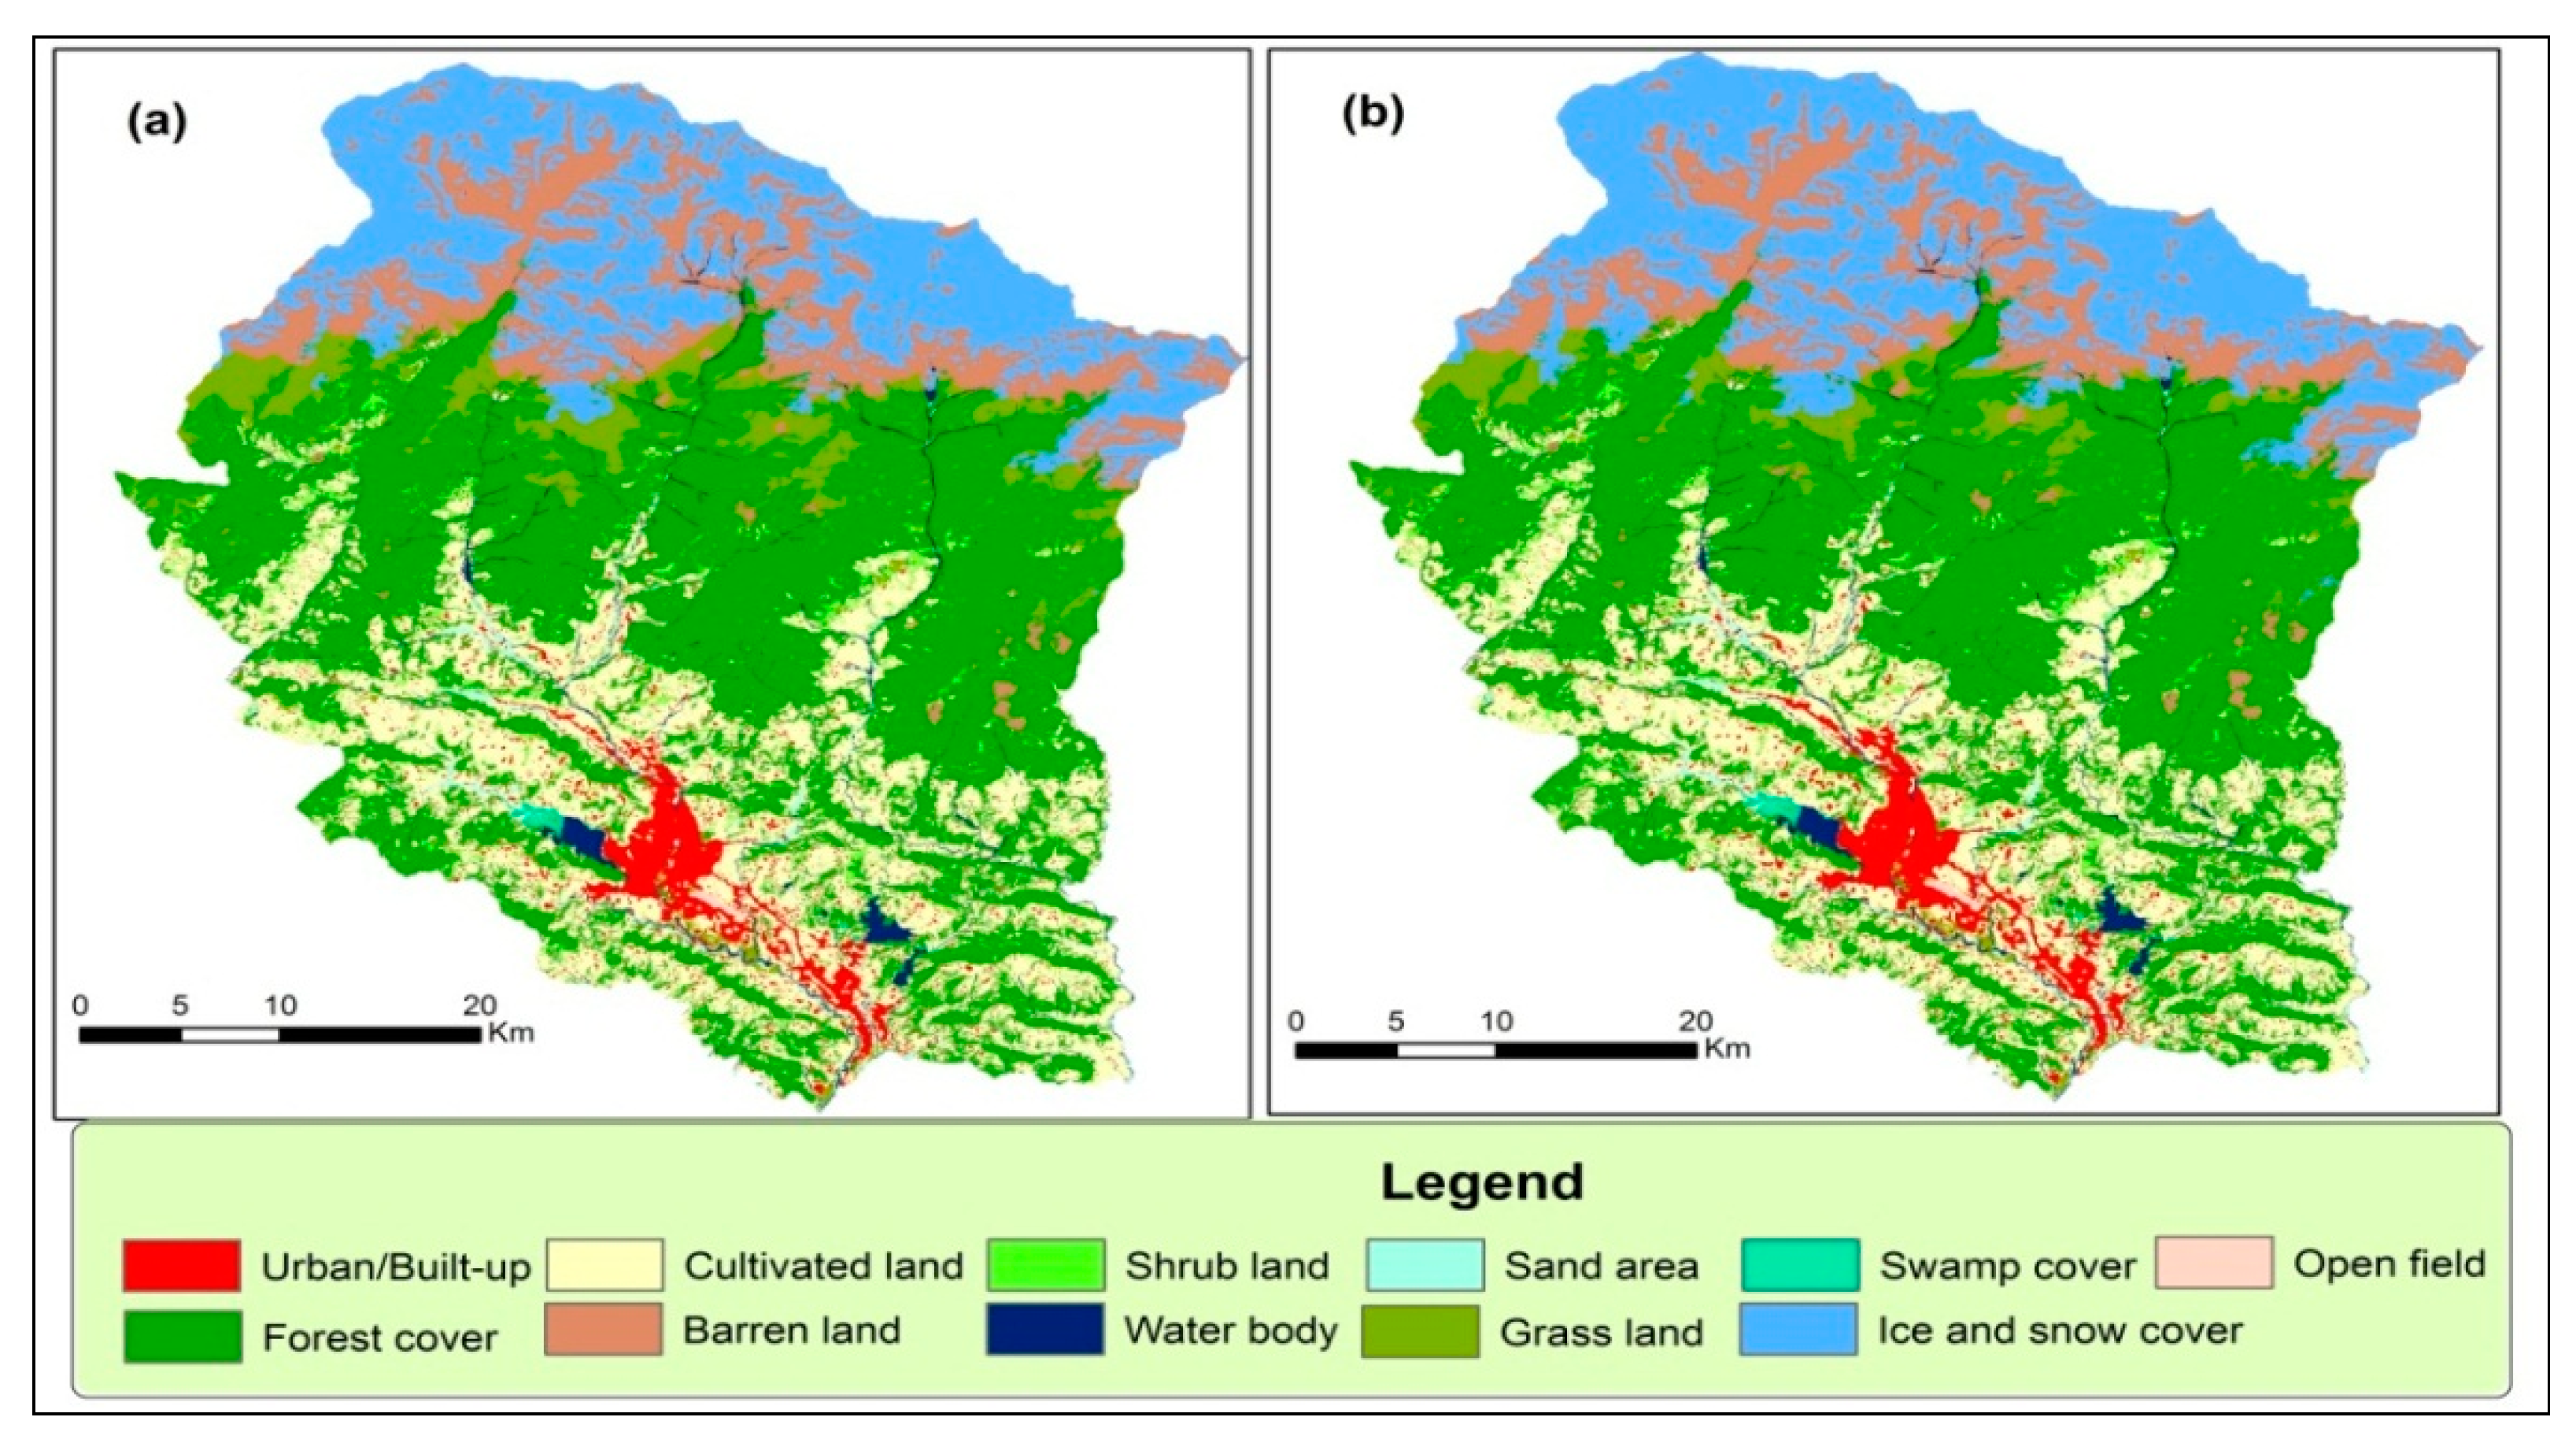
According to the prediction analysis (Table 6), urban areas will occupy 64.12 km2 by 2025 and 70.80 km2 by 2035. Cultivated land area is estimated to decrease to 403.07 km2, and 399.46 km2, respectively (Table 6 and Figure 8). Forest-covered area will decline to 865.02 km2 and 860.57 km2 while water body will decrease to 32.99 km2 and 31.5 km2 by 2025 and 2035, correspondingly. As shown in Figure 8, urban area will increase at the cost of cultivated land and also will extend in hazard risk areas. A total of 18.21 km2 in urban/built-up areas are expected to extend in hazard risk areas within the Kaski District by 2035.
4. Discussion
The Kaski District possesses a long history of urbanization, and the trend has been quite rapid in the recent years. Due to its location between mountainous and Tarai regions, the district has become an important east–west stage point in the trans-Himalayan trade route [67,70] since the medieval age. It is also the center of religious gatherings and a permanent market place experiencing speedy urbanization and population growth. Nepal experienced a decade-long political, armed conflict since 1996 that peaked in 2001, caused migration within and outside country [88]. The development activities undertaken after 2006 in the aftermath of political settlement further contributed to the acceleration of the urbanization process [70], and the Kaski was not exempt. Economic opportunities, public service accessibility, population growth and migration, globalization, the physical condition, tourism, plans and policies, the land market, and political factors are the major drivers resulting in accentuated urbanization in Pokhara [8,68].
The Himalayan region often experiences severe fatalities generated from various hazards [60]. High precipitation in the mountain range and adjacent foothills generally results in extreme flooding in the area and the forelands [89]. The hazard of flooding becomes stronger with the excessive rainfall and alteration of floodplains into impervious surfaces [90,91] and the modification of hydrological cycle due to land-use changes [91], which take place mostly in unregulated municipal systems [64] and urban poor areas [92]. Landslide is one of the crucial geomorphic drivers of LULC change; it redistributes the sediments from mountains and hills to the gentler plains. Exploitation of forest cover, over steeping natural slopes, disruption in the hydrological system, high precipitation, massive earthquakes, and rampant land-use practices enhance the landslide susceptibility of any region [17]. The threat is nourished by (1) rapid urbanization, haphazard land-use practice, and the accommodation of high populations in hazard prone areas and (2) a combination of structural poverty, decaying and sub-standard infrastructures, the concentration of economic assets and commercial/industrial activities, and a weak institutional capacity for the disaster risk management [91]. Kaski is the district which received the highest precipitation in a year in the country. The district has been exposed to multiple hazards including avalanches, debris flow, glacial lake outburst floods (GLOFs), landslides, edge fall, floods, sinkholes, land subsidence, and fires common in the district. Geologically, the region is incorporated in the Pokhara formation which is related to the catastrophic debris and water flow from the upper glaciated cirque of the Sabche Pokhara basin. The urban centers, particularly downstream, are more susceptible to the adverse effects of hazards,
Anthropogenic activities affect biodiversity and the natural environment [35,93,94]; they often trigger multiple hazard occurrences. Environmental problems also arise in the absence of well-defined plans and policies to dissuade the haphazard use of natural landscape. Although developing countries often lack strong policies to manage sustainable urbanization [84], Nepal has the 2015 National Land Use Policy [95], which focuses on land consolidation, compact settlement and dissuading land fragmentation and scatter settlements. However, its implementation is lacking in the absence of long-term strategies and political commitments [96].
5. Conclusions and Recommendations
This study examined the trend of spatiotemporal patterns of urbanization of the Kaski District between 1988 and 2016 using time-series Landsat images. Results predicted urban sprawl by 2025 and 2035 using the CA-Markov model and identified the most hazardous areas in terms of flood, landslide or edge fall, sinkhole, and land subsidence. Research explored the gradual expansion of urban land, which increased from 1.15% to 2.91% over the study period. This spatial trend of urbanization is expected to continue to grow in future years. As per the prediction analysis, urban land area will expand to 3.07% by 2024 and 3.39% by 2032. First, urbanization has occurred mainly at the expense of prime farm lands. Of the total 36.68 km2 expansion in urban land area between 1988 and 2016, 32.48 km2 (88.54%) was converted from cultivated land alone. Second, urban/built-up areas expanding into areas of high risk of multiple hazards. During 2016, a total of 27.37% of the urban/built-up area was determined to be at risk. Results predicted that the urban sprawl might trespass into core and fertile farmlands and hazard prone areas. These spatial trends of urbanization pose serious challenges to sustainable food security and a sustainable urban future of the region. The study confirmed the suitability and effectiveness of long term time-series data for spatiotemporal analysis of land-use change and for identifying multihazard risk areas. However, high-resolution satellite images are recommended for detailed monitoring of hazard risk for areas with complex topography. Hazard risk and management information needs to be disseminated widely and hazard prone zones should be monitored on a routine basis. Implementation of building codes in Pokhara City is praiseworthy and should be made compulsory for the entire Kaski District.
Filling the existing gap between the technical outputs and essential prevention and coping measures should help to establish sustainability and disaster resilience in the region. Thus, it is of prime importance at this time to not only gain a general overview of the area’s multiple risks, but to also establish strong mechanisms for effective disaster risk management. Despite the sensitivity of the study area, urbanization has been rapidly gaining momentum. Hence, future research should focus on the influencing factors of urbanization in the hazard risk area of the Kaski District.
Supplementary Materials
The following are available online at https://www.mdpi.com/2073-445X/7/1/37/s1, Table S1: accuracy assessment table. Table S2: LULC statistics from 1988 to 2016. Figure S1: LULC trend from 1988 to 2016.
Acknowledgments
This study was supported by the President’s International Fellowship Initiative (PIFI) of the Chinese Academy of Sciences (CAS), Grant No. 2016PE022. Monique Fort is highly acknowledged for her valuable advices and guidelines in the research work. We are thankful Khagendra Raj Poudel who shared his expertise and local knowledge during the field visit. We sincerely thank anonymous reviewers for their constrictive comments and suggestions. The team benefited from the careful English language editing of this manuscript by the language editor. Sincere gratitude goes to Betsy Armstrong from University of Colorado USA, who edited English language in the abstract and the conclusion section of the final version of the manuscript.
Author Contributions
Bhagawat Rimal designed the project and took overall responsibility for the preparation and finalization of manuscript, remote sensing/GIS analysis, and preparation of figures including data collection. Lifu Zhang supervised the project and provided useful suggestions throughout the preparation of the manuscript. Hamidreza Keshtkar processed the model, Xuejian Sun carried out a revision of the article and gave useful advice and Sushila Rijal contributed to put the research in the local context, supported the field work and prepared the field visit report. All of the authors revised and contributed to the final manuscript.
Conflict of Interest
The authors declare no conflicts of interest.
References
- Ellis, E. Landuse and landcover change and climate change. In Landuse and Landcover Change Encyclopedia of Earth; Cutler, J.C., Ed.; Environmental Information Coalition, National Council for Science and the Environment: Washington, DC, USA, 2007. [Google Scholar]
- Khanal, N.R. Land Use and Land Cover Dynamics in the Himalayan: A Case Study of the Madi Watershed, Western Development Region, Nepal (2002). Ph.D. Thesis, Tribhuvan University, Kathmandu, Nepal, 2002. [Google Scholar]
- Álvarez-Berríos, N.; Redo, D.; Aide, T.; Clark, M.; Grau, R. Land change in the greater antilles between 2001 and 2010. Land 2013, 2, 81–107. [Google Scholar] [CrossRef]
- Sharma, P. Urbanization and development. In Population Monograph of Nepal; Statistics, C.B.O., Ed.; Central Bureau of Statistics: Kathmandu, Nepal, 2003; Volume 1, pp. 375–412. [Google Scholar]
- Hedblom, M.; Andersson, E.; Borgström, S. Flexible land-use and undefined governance: From threats to potentials in peri-urban landscape planning. Land Use Policy 2017, 63, 523–527. [Google Scholar] [CrossRef]
- United Nations International Strategy for Disaster Reduction (UNISDR). Living with Risk. A Global Review of Disasterreduction Initiatives; United Nations, Inter-Agency Secretariat of the International Strategy for Disaster Reduction: New York, NY, USA; Geneva, Switzerland, 2004; Volume 1. [Google Scholar]
- Batuk, F.Ş.B.; Emem, O. Relations between disaster management, urban planning and NSDI. Int. Arch. Photogramm. Remote Sens. Spat. Inf. Sci. 2008, 37, 441–444. [Google Scholar]
- Rimal, B.; Baral, H.; Stork, N.; Paudyal, K.; Rijal, S. Growing city and rapid land use transition: Assessing multiple hazards and risks in the pokhara valley, nepal. Land 2015, 4, 957–978. [Google Scholar] [CrossRef]
- Kwak, Y.-J. Nationwide flood monitoring for disaster risk reduction using multiple satellite data. ISPRS Int. J. Geo-Inf. 2017, 6, 203. [Google Scholar] [CrossRef]
- Ban, H.-J.; Kwon, Y.-J.; Shin, H.; Ryu, H.-S.; Hong, S. Flood monitoring using satellite-based rgb composite imagery and refractive index retrieval in visible and near-infrared bands. Remote Sens. 2017, 9, 313. [Google Scholar] [CrossRef]
- Li, S.; Cui, Y.; Liu, M.; He, H.; Ravan, S. Integrating global open geo-information for major disaster assessment: A case study of the myanmar flood. ISPRS Int. J. Geo-Inf. 2017, 6, 201. [Google Scholar] [CrossRef]
- Eskandari, M.; Omidvar, B.; Modiri, M.; Nekooie, M.; Alesheikh, A. Geospatial analysis of earthquake damage probability of water pipelines due to multi-hazard failure. ISPRS Int. J. Geo-Inf. 2017, 6, 169. [Google Scholar] [CrossRef]
- Guha-Sapir, D.; Hoyois, P.; Below, R. Annual Disaster Statistical Review 2015: The Numbers and Trends; Centre for Research on the Epidemiology of Disasters: Brussels, Belgium, 2016. [Google Scholar]
- Mitchell, D.; Grant, D.; Roberge, D.; Bhatta, G.P.; Caceres, C. An evaluation framework for earthquake-responsive land administration. Land Use Policy 2017, 67, 239–252. [Google Scholar] [CrossRef]
- Sanyal, J.; Lu, X.X. Application of remote sensing in flood management with special reference to monsoon asia: A review. Nat. Hazards 2004, 33, 283–301. [Google Scholar] [CrossRef]
- Minister of Home Affairs (MoHA). Nepal Disaster Report 2015; The Government of Nepal, Minister of Home Affairs (MoHA) and Disater Preparedness Network (DPNeT): Kathmandu, Nepal, 2015.
- Sidle, R.C.; Hirotaka, H. Landslides Processes, Prediction, and Land use. In Water Resources Monograph; American Geophysical Union: Washington, DC, USA, 2006; ISBN 13-978-0-87590-322-4. [Google Scholar]
- Guha-Sapir, D.; Hoyois, P.; Below, R. Annual Disaster Statistical Review 2014: The Numbers and Trends; Centre for Research on the Epidemiology of Disasters: Brussels, Belgium, 2015. [Google Scholar]
- Ahmed, B.; Dewan, A. Application of bivariate and multivariate statistical techniques in landslide susceptibility modeling in chittagong city corporation, bangladesh. Remote Sens. 2017, 9, 304. [Google Scholar] [CrossRef]
- Feng, M.; Huang, C.; Channan, S.; Vermote, E.F.; Masek, J.G.; Townshend, J.R. Quality assessment of landsat surface reflectance products using modis data. Comput. Geosci. 2012, 38, 9–22. [Google Scholar] [CrossRef]
- Schneider, A. Monitoring land cover change in urban and peri-urban areas using dense time stacks of landsat satellite data and a data mining approach. Remote Sens. Environ. 2012, 124, 689–704. [Google Scholar] [CrossRef]
- Sexton, J.O.; Song, X.-P.; Huang, C.; Channan, S.; Baker, M.E.; Townshend, J.R. Urban growth of the Washington, DC—Baltimore, MD metropolitan region from 1984 to 2010 by annual, Landsat-based estimates of impervious cover. Remote Sens. Environ. 2013, 129, 42–53. [Google Scholar] [CrossRef]
- Masser, I. Managing our urban future: The role of remote sensing and geographic information systems. Habitat Int. 2001, 25, 503–512. [Google Scholar] [CrossRef]
- Goodchild, M.F. Spatial information for land use management. In Spatial Analysis: Methods and Problems in Land Use Management; Hill, M.J., Aspinall, E.R.J., Eds.; Gordon and Breach Science Publishers: Amsterdam, The Netherlands, 2000; pp. 39–51. [Google Scholar]
- Thapa, R.B.; Murayama, Y. Examining spatiotemporal urbanization patterns in kathmandu valley, Nepal: Remote sensing and spatial metrics approaches. Remote Sens. 2009, 1, 534–556. [Google Scholar] [CrossRef]
- Islam, M.M.; Sado, K. Development of flood hazard maps of bangladesh using noaa-avhrr images with gis. Hydrol. Sci. J. 2000, 45, 337–355. [Google Scholar] [CrossRef]
- Gomes, R.; Guimarães, R.; de Carvalho, O.; Fernandes, N.; do Amaral, E. Combining spatial models for shallow landslides and debris-flows prediction. Remote Sens. 2013, 5, 2219–2237. [Google Scholar] [CrossRef] [Green Version]
- Asare-Kyei, D.; Forkuor, G.; Venus, V. Modeling flood hazard zones at the sub-district level with the rational model integrated with gis and remote sensing approaches. Water 2015, 7, 3531–3564. [Google Scholar] [CrossRef]
- Byun, Y.; Han, Y.; Chae, T. Image fusion-based change detection for flood extent extraction using bi-temporal very high-resolution satellite images. Remote Sens. 2015, 7, 10347–10363. [Google Scholar] [CrossRef]
- Cao, C.; Xu, P.; Wang, Y.; Chen, J.; Zheng, L.; Niu, C. Flash flood hazard susceptibility mapping using frequency ratio and statistical index methods in coalmine subsidence areas. Sustainability 2016, 8, 948. [Google Scholar] [CrossRef]
- Song, C.; Kwan, M.P.; Zhu, J. Modeling fire occurrence at the city scale: A comparison between geographically weighted regression and global linear regression. Int. J. Environ. Res. Public Health 2017, 14, 396. [Google Scholar] [CrossRef] [PubMed]
- Taubenböck, H.; Clodt, S.; Wurm, M.; Wegmann, M.; Jürgens, C. The Capabilities of Remote Sensing to Derive Urban Location Factors for Probability-Based Spatial Growth Analysis. In Proceedings of the International Conferences of Crop Konferenzs, Wien, Austria, 18–20 May 2010; pp. 1–10. [Google Scholar]
- Rodríguez-Maturino, A.; Martínez-Guerrero, J.; Chairez-Hernández, I.; Pereda-Solis, M.; Villarreal-Guerrero, F.; Renteria-Villalobos, M.; Pinedo-Alvarez, A. Mapping land cover and estimating the grassland structure in a priority area of the chihuahuan desert. Land 2017, 6, 70. [Google Scholar] [CrossRef]
- Paudel, B.; Zhang, Y.; Li, S.; Wu, X. Spatiotemporal Reconstruction of Agricultural Land Cover in Nepal from 1970 to 2010. Reg. Environ. Chang. 2017, 17, 2349–2357. [Google Scholar] [CrossRef]
- Rimal, B.; Zhang, L.; Keshtkar, H.; Wang, N.; Lin, Y. Monitoring and modeling of spatiotemporal urban expansion and land-use/land-cover change using integrated markov chain cellular automata model. ISPRS Int. J. Geo-Inf. 2017, 6, 288. [Google Scholar] [CrossRef]
- Haack, B.N.; Rafter, A. Urban growth analysis and modeling in the kathmandu valley, nepal. Habitat Int. 2006, 30, 1056–1065. [Google Scholar] [CrossRef]
- Sleeter, B.M.; Wood, N.J.; Soulard, C.E.; Wilson, T.S. Projecting community changes in hazard exposure to support long-term risk reduction: A case study of tsunami hazards in the U.S. Pacific Northwest. Int. J. Disaster Risk Reduc. 2017, 22, 10–22. [Google Scholar] [CrossRef]
- Sleeter, B.M.; Wilson, T.S.; Sharygin, E.; Sherba, J.T. Future scenarios of land change based on empirical data and demographic trends. Earth Future 2017, 5, 1068–1083. [Google Scholar] [CrossRef]
- Kozak, J.; Gimmi, U.; Houet, T.; Bolliger, J. Current practices and challenges for modelling past and future land use and land cover changes in mountainous regions. Reg. Environ. Chang. 2017, 17, 2187–2191. [Google Scholar] [CrossRef]
- Keshtkar, H.; Voigt, W. A spatiotemporal analysis of landscape change using an integrated markov chain and cellular automata models. Model. Earth Syst. Environ. 2015, 2, 10. [Google Scholar] [CrossRef]
- Allen, J.; Lu, K. Modeling and prediction of future urban growth in the charleston region of south carolina: A gis-based integrated approach. Ecol. Soc. 2003, 8. [Google Scholar] [CrossRef]
- Keshtkar, H.; Voigt, W. Potential impacts of climate and landscape fragmentation changes on plant distributions: Coupling multi-temporal satellite imagery with gis-based cellular automata model. Ecol. Inform. 2016, 32, 145–155. [Google Scholar] [CrossRef]
- Alilou, H.; Moghaddam Nia, A.; Keshtkar, H.; Han, D.; Bray, M. A cost-effective and efficient framework to determine water quality monitoring network locations. Sci. Total Environ. 2018, 624, 283–293. [Google Scholar] [CrossRef] [PubMed]
- Shafizadeh Moghadam, H.; Helbich, M. Spatiotemporal urbanization processes in the megacity of mumbai, india: A markov chains-cellular automata urban growth model. Appl. Geogr. 2013, 40, 140–149. [Google Scholar] [CrossRef]
- Araya, Y.H.; Cabral, P. Analysis and modeling of urban land cover change in setúbal and sesimbra, Portugal. Remote Sens. 2010, 2, 1549–1563. [Google Scholar] [CrossRef]
- Cheng, J. Modelling Spatial and Temporal Urban Growth. Ph.D. Thesis, Utrecht University P.O. Box 80.115 3508 TC Utrecht, Faculty of Geographical Sciences Utrecht University, Utrecht, The Netherlands, 2003. [Google Scholar]
- Aaviksoo, K. Simulating vegetation dynamics and land use in a mire landscape using a markov model. Landsc. Urban Plan. 1995, 31, 129–142. [Google Scholar] [CrossRef]
- Fort, M. The Pokhara Valley: A Product of a Natural Catastrophe. In Geomorphological Landscapes of the World; Springer: Dordrecht, The Netherlands, 2010; pp. 265–274. [Google Scholar]
- Fort, M. Sporadic Morphogenesis in a Continental Subduction Setting: An Example from the Annapurna Range, Nepal Himalaya. Z. Geomorphol. 1987, 63, 36. [Google Scholar]
- Nepal Environmental and Scientific Services (NESS). Feasibility Study on upper Seti (Damauli) Storage Hydroelectric Project for Nepal Electricity Authority (NEA); Nepal Environmental and Scientific Services: Kathmandu, Nepal, 2001. [Google Scholar]
- Dahal, R.K.; Bhandary, N.P. Geo-disaster and its mitigation in nepal. In Progress of Geo-Disaster Mitigation Technology in Asia; Springer: Berlin/Heidelberg, Germany, 2013; pp. 123–156. [Google Scholar]
- Central Bureau of Statistics (CBS). Environment Statistics of Nepal; National Planning Commission Secretariat, Central Bureau of Statistics (CBS): Kathmandu, Nepal, 2011.
- Baral, R. Kaski at high risk of flood and landslip. The Himalayan Times, 20 June 2016. [Google Scholar]
- Pokharel, R.P. Vulnerable land in pokhara city and its use potentiality. Himal. Geogr. 2013, 8, 51–58. [Google Scholar]
- Rijal, M. Characterization of sinkholes affected area of Thulibeshi Phat, Armala, Kaski, Nepal. J. Inst. Sci. Technol. 2017, 22, 17–24. [Google Scholar] [CrossRef]
- Basnet, P.; Balla, M.K.; Pradhan, B.M. Landslide hazard zonation, mapping and investigation of triggering factors in Phewa lake watershed, Nepal. Banko Janakari 2013, 22, 43–52. [Google Scholar] [CrossRef]
- Prashad Bhatt, B.; Datt Awasthi, K.; Prasad Heyojoo, B.; Silwal, T.; Kafle, G. Using geographic information system and analytical hierarchy process in landslide hazard zonation. Appl. Ecol. Environ. Sci. 2013, 1, 14–22. [Google Scholar] [CrossRef]
- GENESIS. Report on Impact of Settlement Pattern, Land Use Practice and Options in High Risk Areas; Pokhara Sub-Metropolitan City; UNDP/ERRRP—Project Nep/07/010; GENESIS: Kathmandu, Nepal, 2009. [Google Scholar]
- Yamanaka, H.; Yoshida, M.; Arita, K. Terrace landforms and quaternary deposits around the pokhara valley. J. Nepal Geol. Soc. 1982, 2, 113–142. [Google Scholar]
- Fort, M.; Adhikari, B.R.; Stolle, A.; Schwanghart, W.; Korop, O. Catastrophic mountain wall collapses in the nepal himalayas: A review, with focus on pokhara valley. In Gradualism vs Catastrophism in Landscape Evolution; International Association of Geomorphologists: Barnaul, Russia, 2015; pp. 15–18. [Google Scholar]
- Kargel, J.S.; Paudel, L.; Leonard, G.; Regmi, D.; Joshi, S.; Poudel, K.; Thapa, B.; Watanabe, T.; Fort, M. Causes and human impacts of the seti river (Nepal) disaster of 2012. In Glacial Flooding & Disaster Risk Management Knowledge Exchange and Field Training; High Mountains Adaptation Partnership: Huaraz, Peru, 2013; pp. 1–11. [Google Scholar]
- The Japanese Disaster Survey Team (JDST). Survey Report on Seti River Flood, Nepal; The Japanese Disaster Survey Team (JDST), Nepal-Japan Friendship Association for Water Induced Disaster Prevention(NFAD): Tokyo, Japan, 2012. [Google Scholar]
- Dickson, E.; Baker, J.L.; Hoornweg, D.; Tiwari, A. Urban Risk Assessments: Understanding Disaster and Climate Risk in Cities; International Bank of Reconstruction and Development, The World Bank: Washington, DC, USA, 2012. [Google Scholar]
- Gigović, L.; Pamučar, D.; Bajić, Z.; Drobnjak, S. Application of gis-interval rough ahp methodology for flood hazard mapping in urban areas. Water 2017, 9, 360. [Google Scholar] [CrossRef]
- Government of Nepal. Stocktaking Report: Land Degradation, National Capacity Self-Assessment for Global Environment Management; Ministry of Environment, Science and Technology: Kathmandu, Nepal, 2008.
- Gurung, H. Pokhara Valley, Nepal Himalaya, a Field Study in Regional Geography. Ph.D. Thesis, University of Edinburgh, Edinburgh, UK, 1965. [Google Scholar]
- Poudel, K.R. Urban growth and land use change in the himalaya region a case study of Pokhara sub-metropolitan city. GIS Ostrav. 2008, 27, 1–11. [Google Scholar]
- Rimal, B. Urban growth and land use/land cover change of Pokhara sub-metropolitan city, Nepal. J. Theor. Appl. Inf. Technol. 2011, 26, 118–129. [Google Scholar]
- District Development Committee (DDC). District Profile; District Development Committee (DDC): Kaski, Nepal, 2015. [Google Scholar]
- Rimal, B. Urban Development and Land Use Change of Main Nepalese Cities. Ph.D. Thesis, University of Wroclaw, Wroclaw, Poland, 2011. [Google Scholar]
- United States Geological Survey (USGS). Earth Explorer, Landsat Data Archive. 2016. Available online: https://earthexplorer.usgs.gov (accessed on 12 March 2018).
- Masek, J.G.; Vermote, E.F.; Saleous, N.E.; Wolfe, R.; Hall, F.G.; Huemmrich, K.F.; Feng, G.; Kutler, J.; Teng-Kui, L. A landsat surface reflectance dataset for North America, 1990–2000. IEEE Geosci. Remote Sens. Lett. 2006, 3, 68–72. [Google Scholar] [CrossRef]
- Vermote, E.; Justice, C.; Claverie, M.; Franch, B. Preliminary analysis of the performance of the landsat 8/oli land surface reflectance product. Remote Sens. Environ. 2016, 185, 46–56. [Google Scholar] [CrossRef]
- GoN. Topographical Map; Government of Nepal, Ministry of Land Resources and Management Survey Department, Topographic Survey Branch: Kathmandu, Nepal, 1998.
- Central Bureau of Statistics (CBS). Population Monograph of Nepal; National Planning Commission Secretariat, Central Bureau of Statistics (CBS): Kathmandu, Nepal, 2014.
- Department of Mines and Geology (DMG). Engineering and Environmental Map of Pokhara Valley; Department of Mines and Geology (DMG): Kathmandu, Nepal, 1996.
- Minister of Home Affairs (MoHA). Nepal Disaster Report. The Government of Nepal, Minister of Home Affairs. Available online: http//drrportal.gov.np (accessed on 19 November 2017).
- Huang, C.; Davis, L.S.; Townshend, J.R.G. An assessment of support vector machines for land cover classification. Int. J. Remote Sens. 2002, 23, 725–749. [Google Scholar] [CrossRef]
- Mubea, K.; Menz, G. Monitoring land-use change in Nakuru (Kenya) using multi-sensor satellite data. Adv. Remote Sens. 2012, 1, 74–84. [Google Scholar] [CrossRef]
- Pal, M.; Mather, P.M. Support vector machines for classification in remote sensing. Int. J. Remote Sens. 2005, 26, 1007–1011. [Google Scholar] [CrossRef]
- Kavzoglu, T.; Colkesen, I. A kernel functions analysis for support vector machines for land cover classification. Int. J. Appl. Earth Observ. Geoinf. 2009, 11, 352–359. [Google Scholar] [CrossRef]
- Pervez, W.; Uddin, V.; Khan, S.A.; Khan, J.A. Satellite-based land use mapping: Comparative analysis of landsat-8, advanced land imager, and big data hyperion imagery. J. Appl. Remote Sens. 2016, 10, 026004. [Google Scholar] [CrossRef]
- Anderson, J.R.; Hardy, E.E.; Roach, J.T.; Witmer, R.E. A Land Use and Land Cover Classification System for Use with Remote Sensor Data; United States Government Printing Office: Washington, DC, USA, 1976.
- Rimal, B.; Zhang, L.; Fu, D.; Kunwar, R.; Zhai, Y. Monitoring urban growth and the Nepal earthquake 2015 for sustainability of Kathmandu Valley, Nepal. Land 2017, 6, 42. [Google Scholar] [CrossRef]
- Thapa, R.B.; Murayama, Y. Scenario based urban growth allocation in Kathmandu Valley, Nepal. Landsc. Urban Plan. 2012, 105, 140–148. [Google Scholar] [CrossRef]
- Jensen, J.R. Introductory Digital Processing: A Remote Sensing Perspective; Prentice-Hall: Upper Saddle River, NJ, USA, 1996. [Google Scholar]
- Pontius, G. Quantification error versus location error in comparison of categorical maps. Photogramm. Eng. Remote Sens. 2000, 66, 1011–1016. [Google Scholar]
- Muzzini, E.; Aparicio, G. Urban Growth and Spatial Transition in Nepal: An Initial Assessment; The World Bank: Washington, DC, USA, 2013. [Google Scholar]
- Prokop, P.; Walanus, A. Impact of the darjeeling–bhutan himalayan front on rainfall hazard pattern. Nat. Hazards 2017, 89, 387–404. [Google Scholar] [CrossRef]
- Alkema, D. Flood Risk Assessment for Eia; an Example of a Motorway near Trento, Italy. Acta Geol. 2001, 78, 147–153. [Google Scholar]
- Dewan, A.M. Geospatial Techniques in Assessing Hazards, Risk and Vulnerability; Springer: Berlin, Germany, 2013. [Google Scholar]
- Wamsler, C. Managing Urban Disaster Risk. Analysis and Adaptation Frameworks for Integrated Settlement Development Programming for the Urban Poor; Housing Development & Management (HDM) Architecture and Built Environment Lund University: Lund, Sweden, 2007. [Google Scholar]
- Dewan, A.M.; Islam, M.M.; Kumamoto, T.; Nishigaki, M. Evaluating flood hazard for land-use planning in greater dhaka of bangladesh using remote sensing and gis techniques. Water Resour. Manag. 2007, 21, 1601–1612. [Google Scholar] [CrossRef]
- Rahman, M. Detection of land use/land cover changes and urban sprawl in Al-Khobar, Saudi Arabia: An analysis of multi-temporal remote sensing data. ISPRS Int. J. Geo-Inf. 2016, 5, 15. [Google Scholar] [CrossRef]
- National Land Use Project (NLUP). National Land Use Policy; National Land Use Project, Government of Nepal, Ministry of Land Resource and Management: Kathmandu, Nepal, 2015.
- Ministry of Housing and Urban Affairs (MOUD). National Urban Development Strategy (Nuds); Government of Nepal, Ministry of Urban Development, MOUD: Kathmandu, Nepal, 2015.
Figure 1.
Location map of the study area.

Figure 2.
Research design.

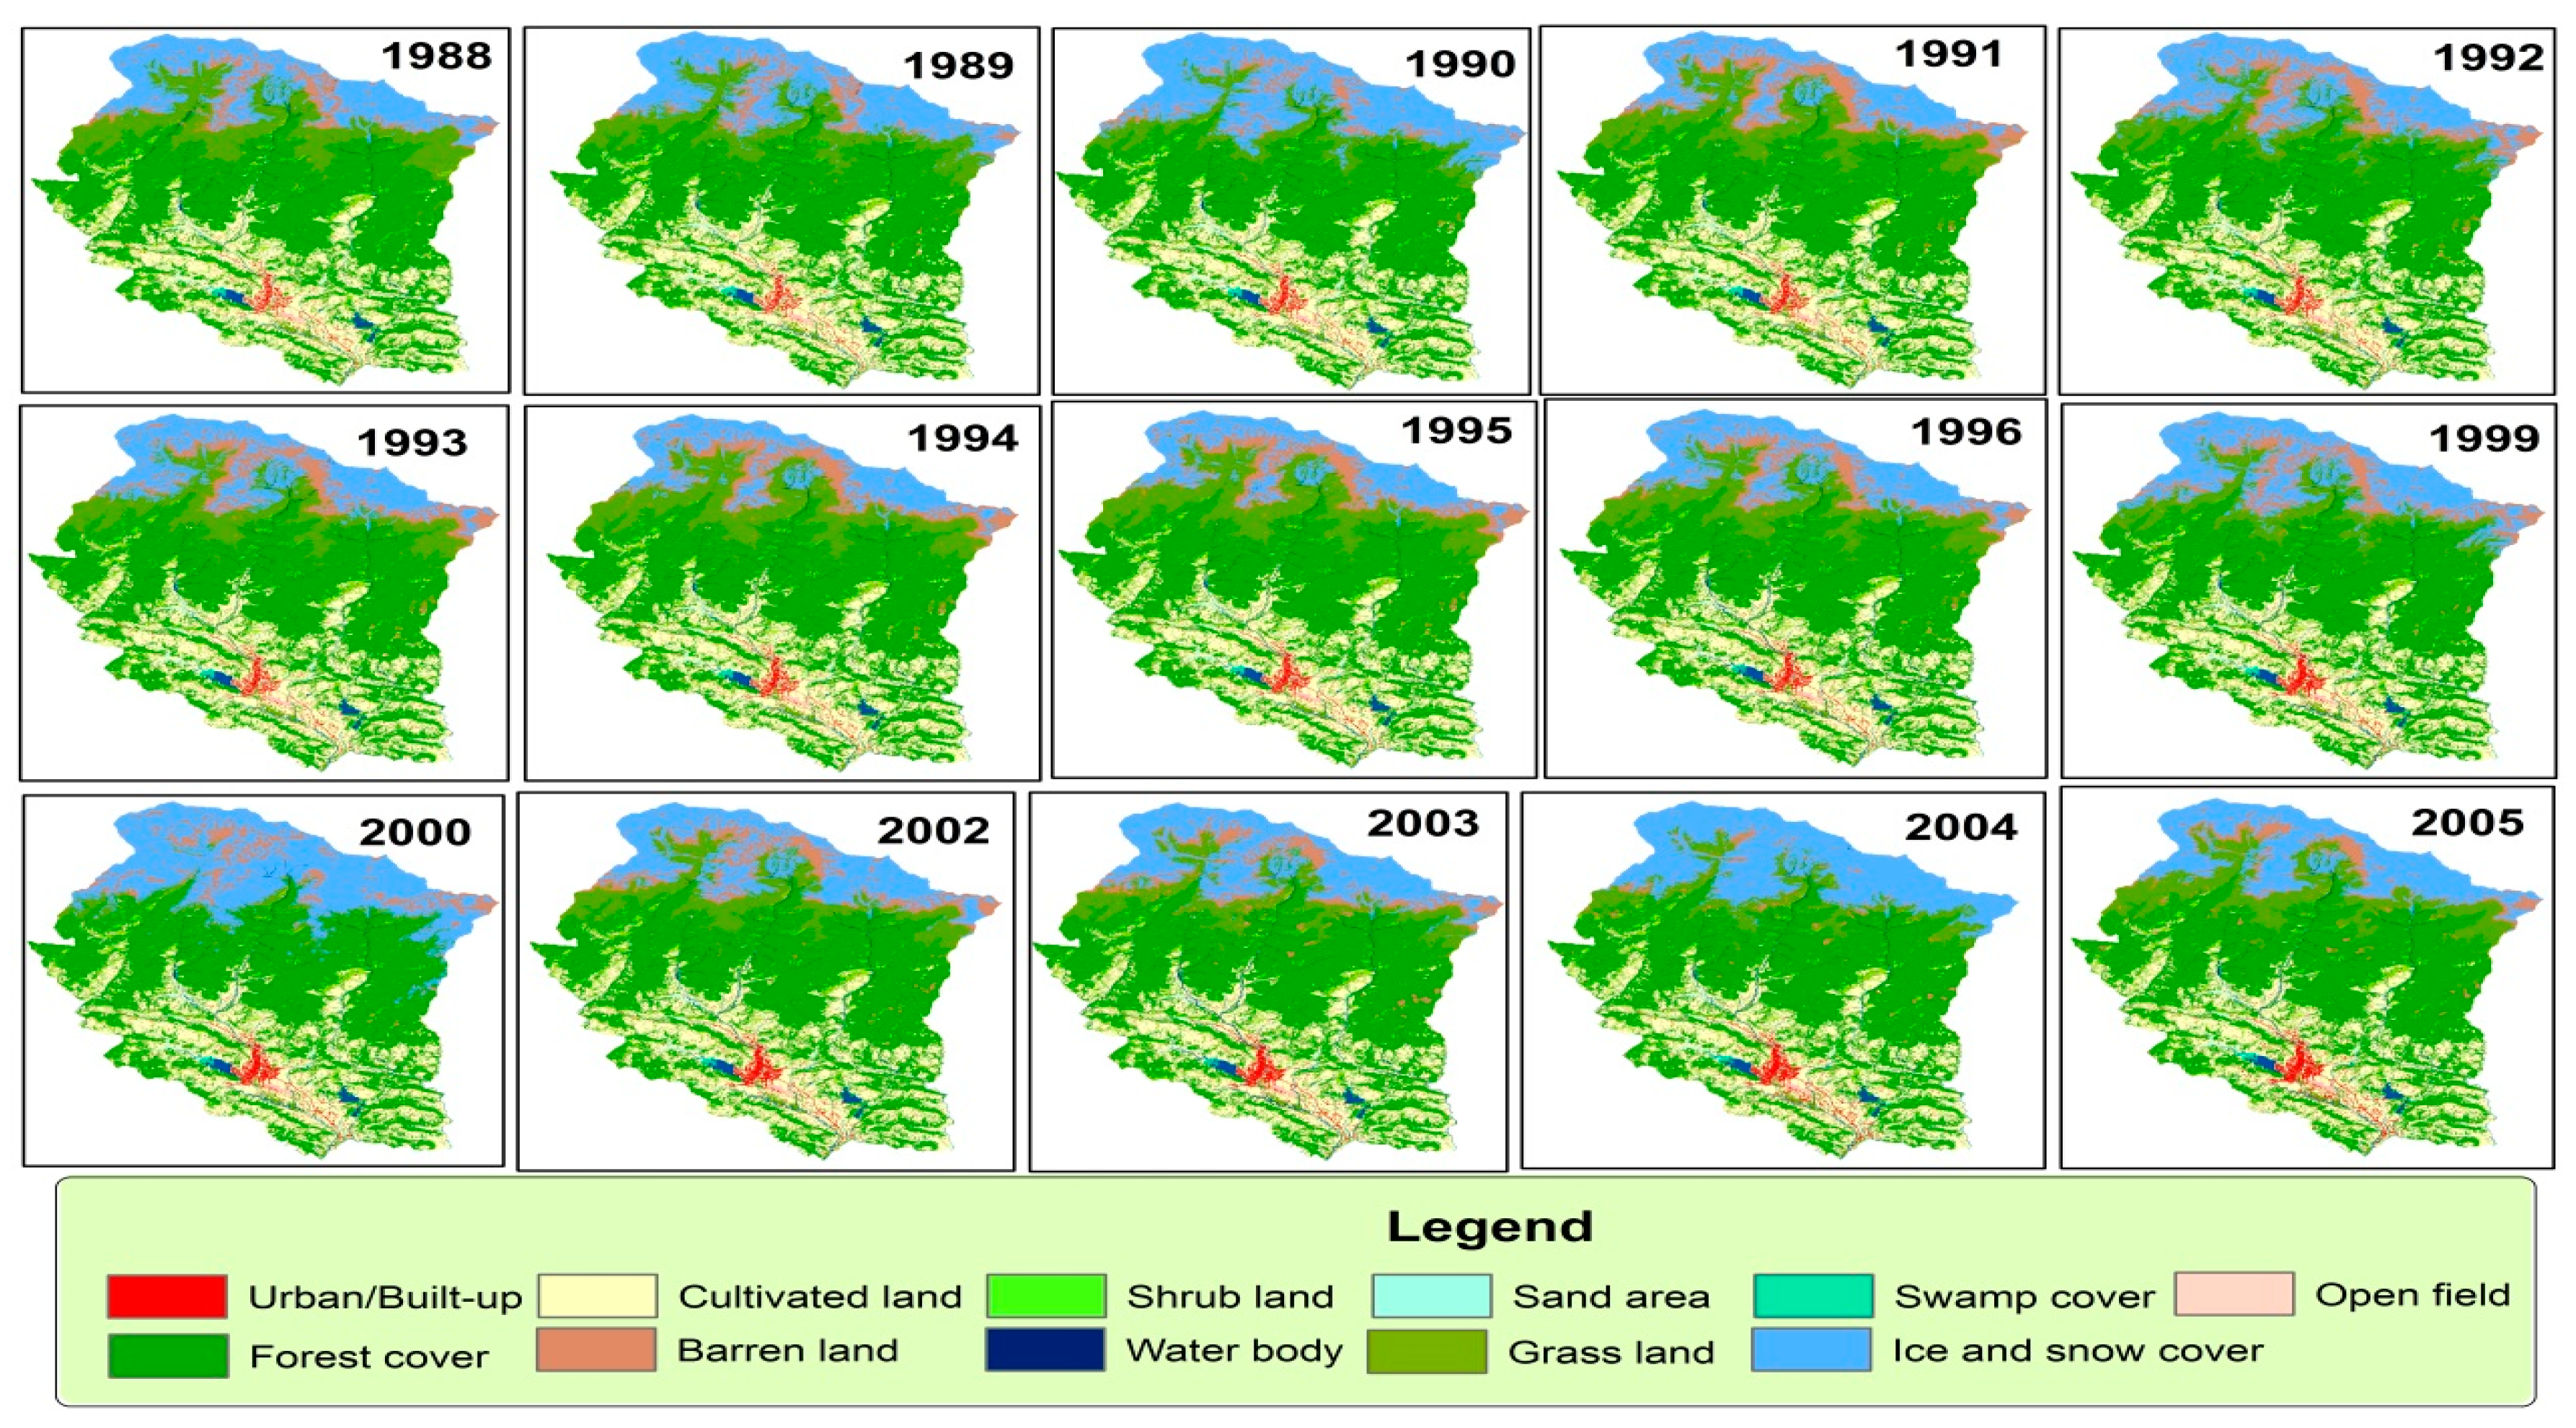
Figure 3.
(a) LULC map for individual years from 1988 to 2016; (b) urban area from 1988 to 2016.

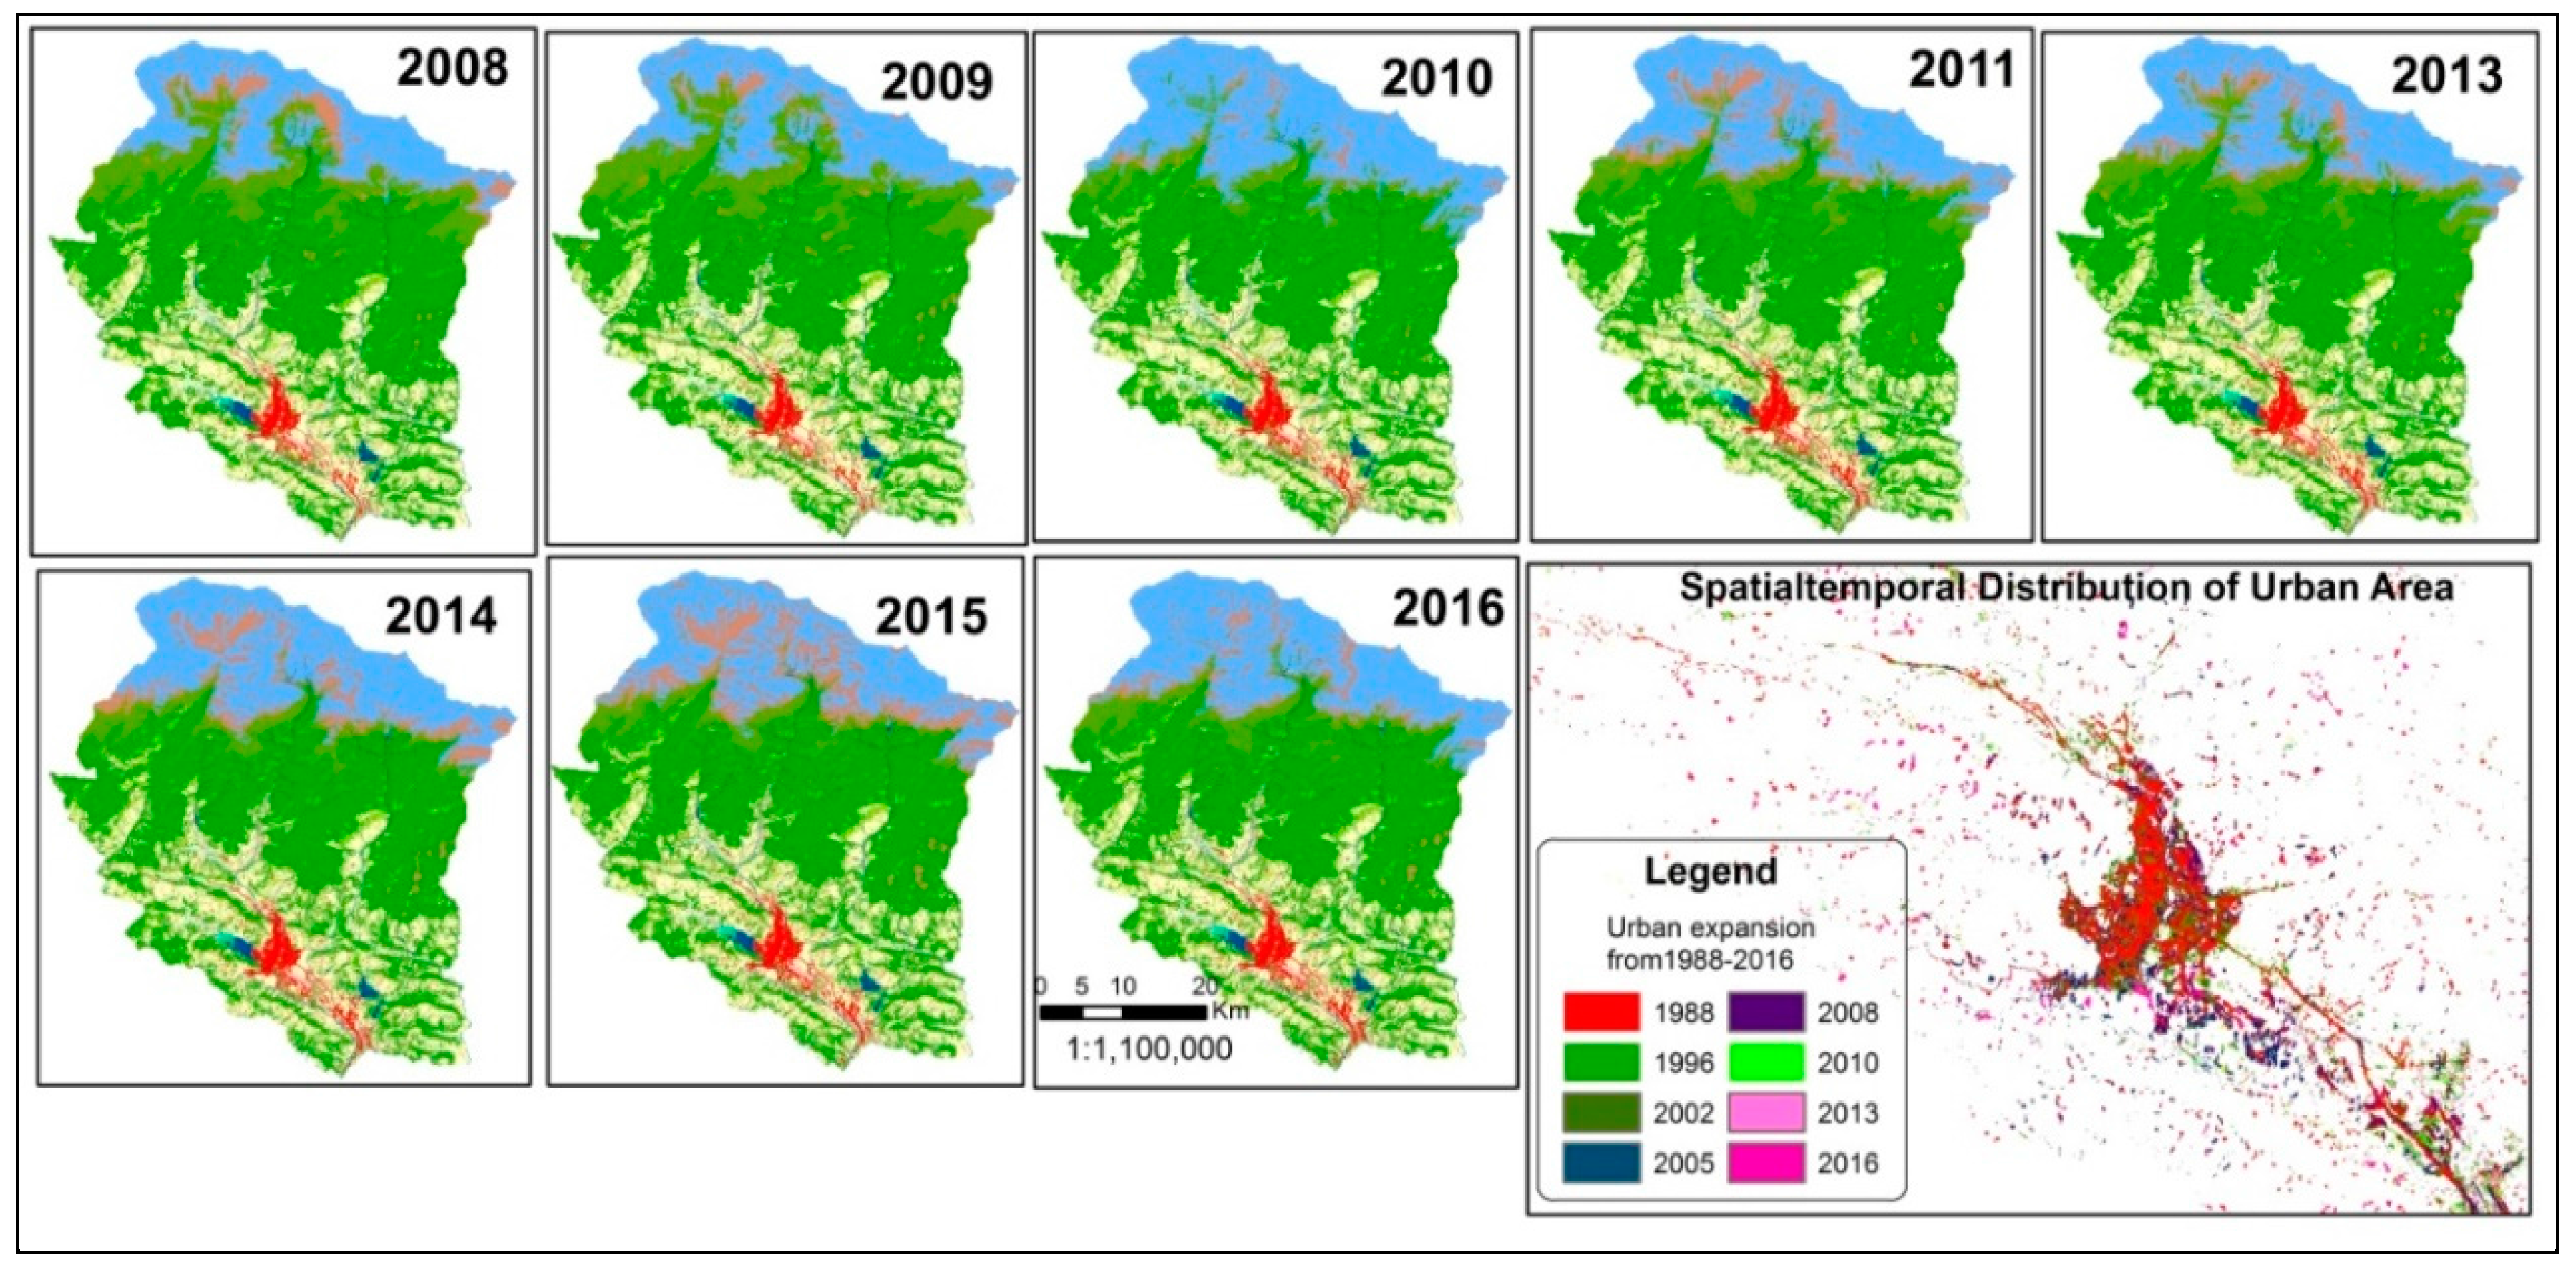
Figure 4.
LULC trend during 1988–2016 for land-use types (a) urban/built-up; (b) cultivated; (c) forest; (d) shrub and water; (e) ice and snow-cover, grass land and barren land (f) sand, open and swamp-cover.
Figure 4.
LULC trend during 1988–2016 for land-use types (a) urban/built-up; (b) cultivated; (c) forest; (d) shrub and water; (e) ice and snow-cover, grass land and barren land (f) sand, open and swamp-cover.
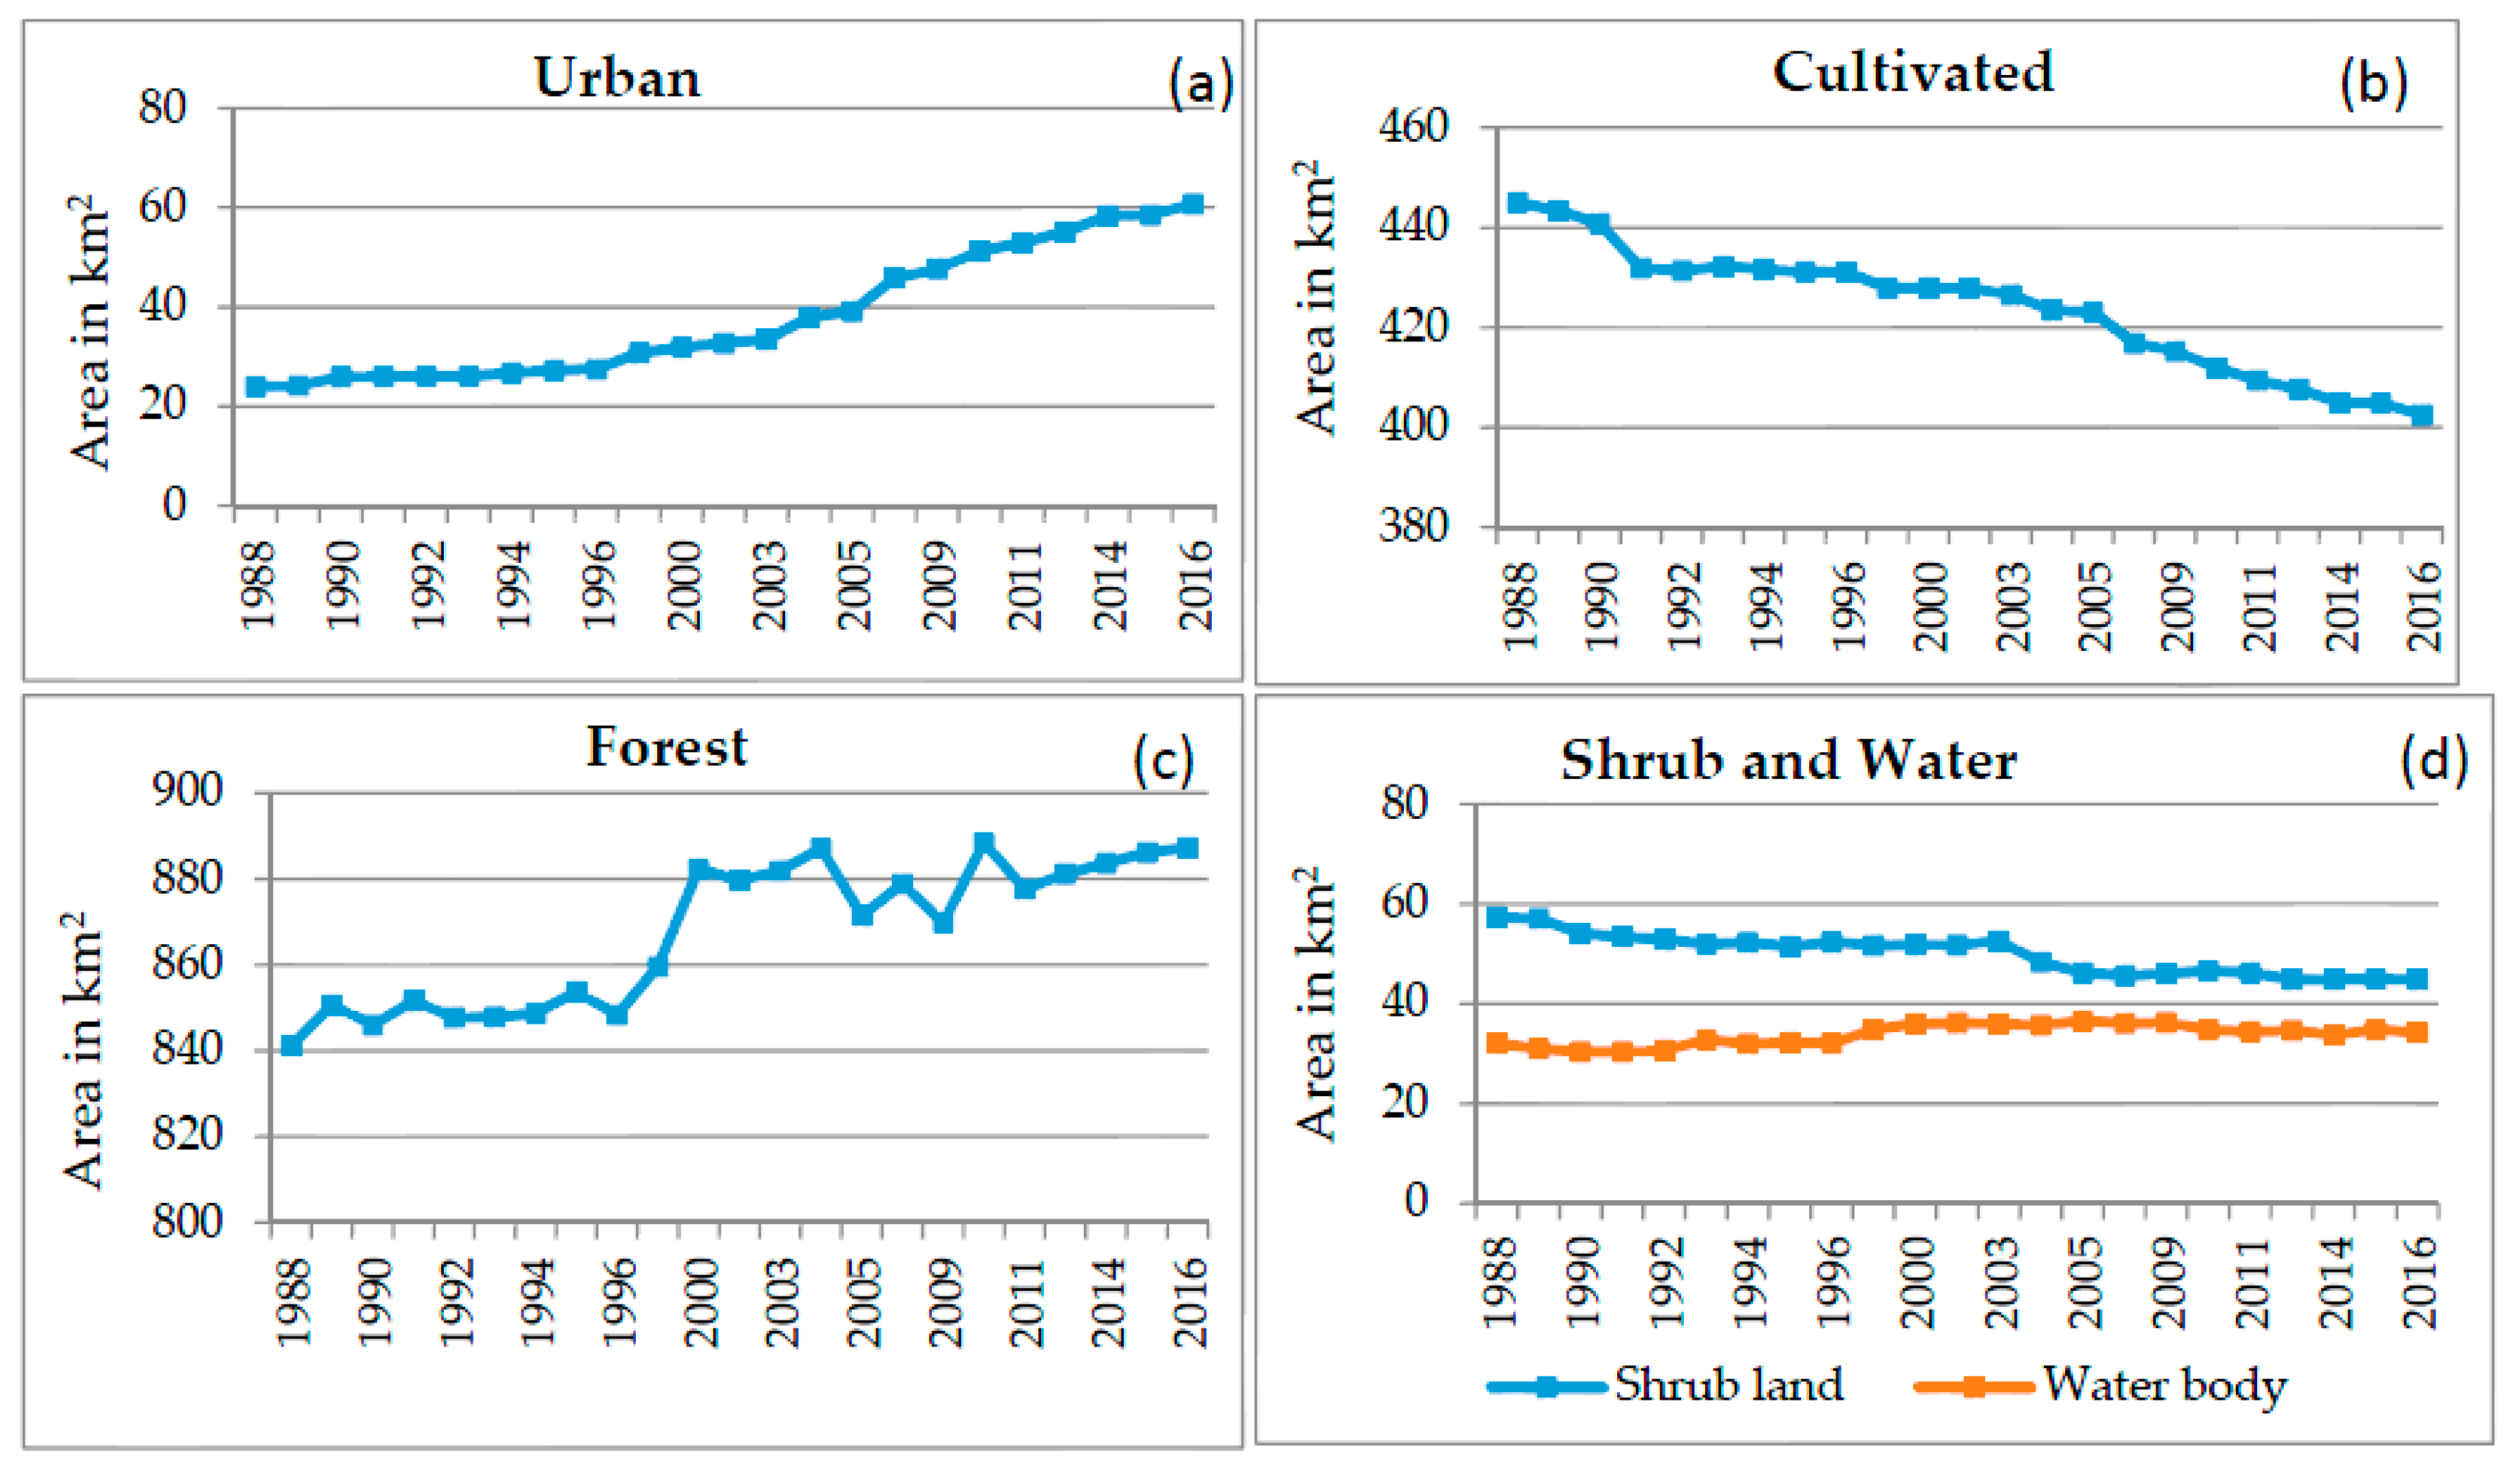
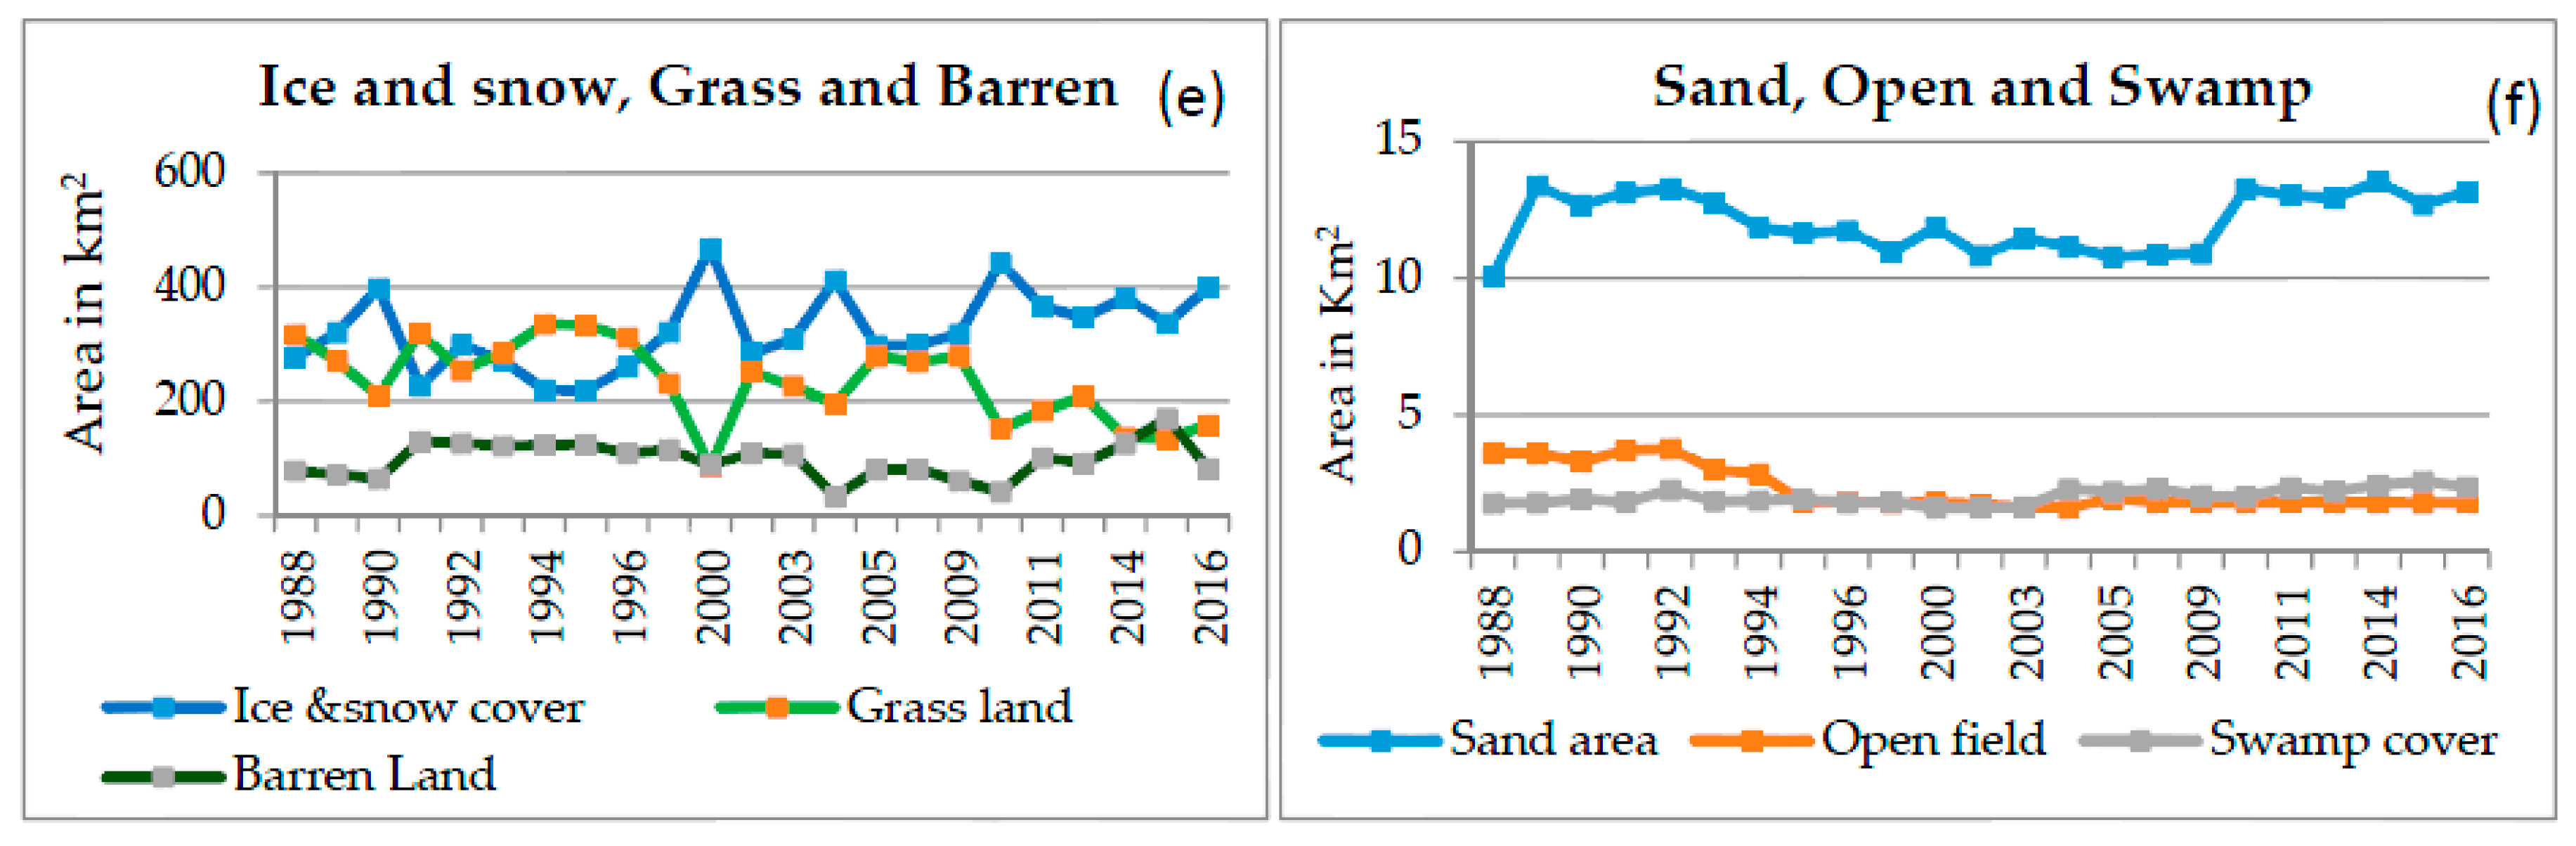
Figure 5.
LULC transition map for six time periods.
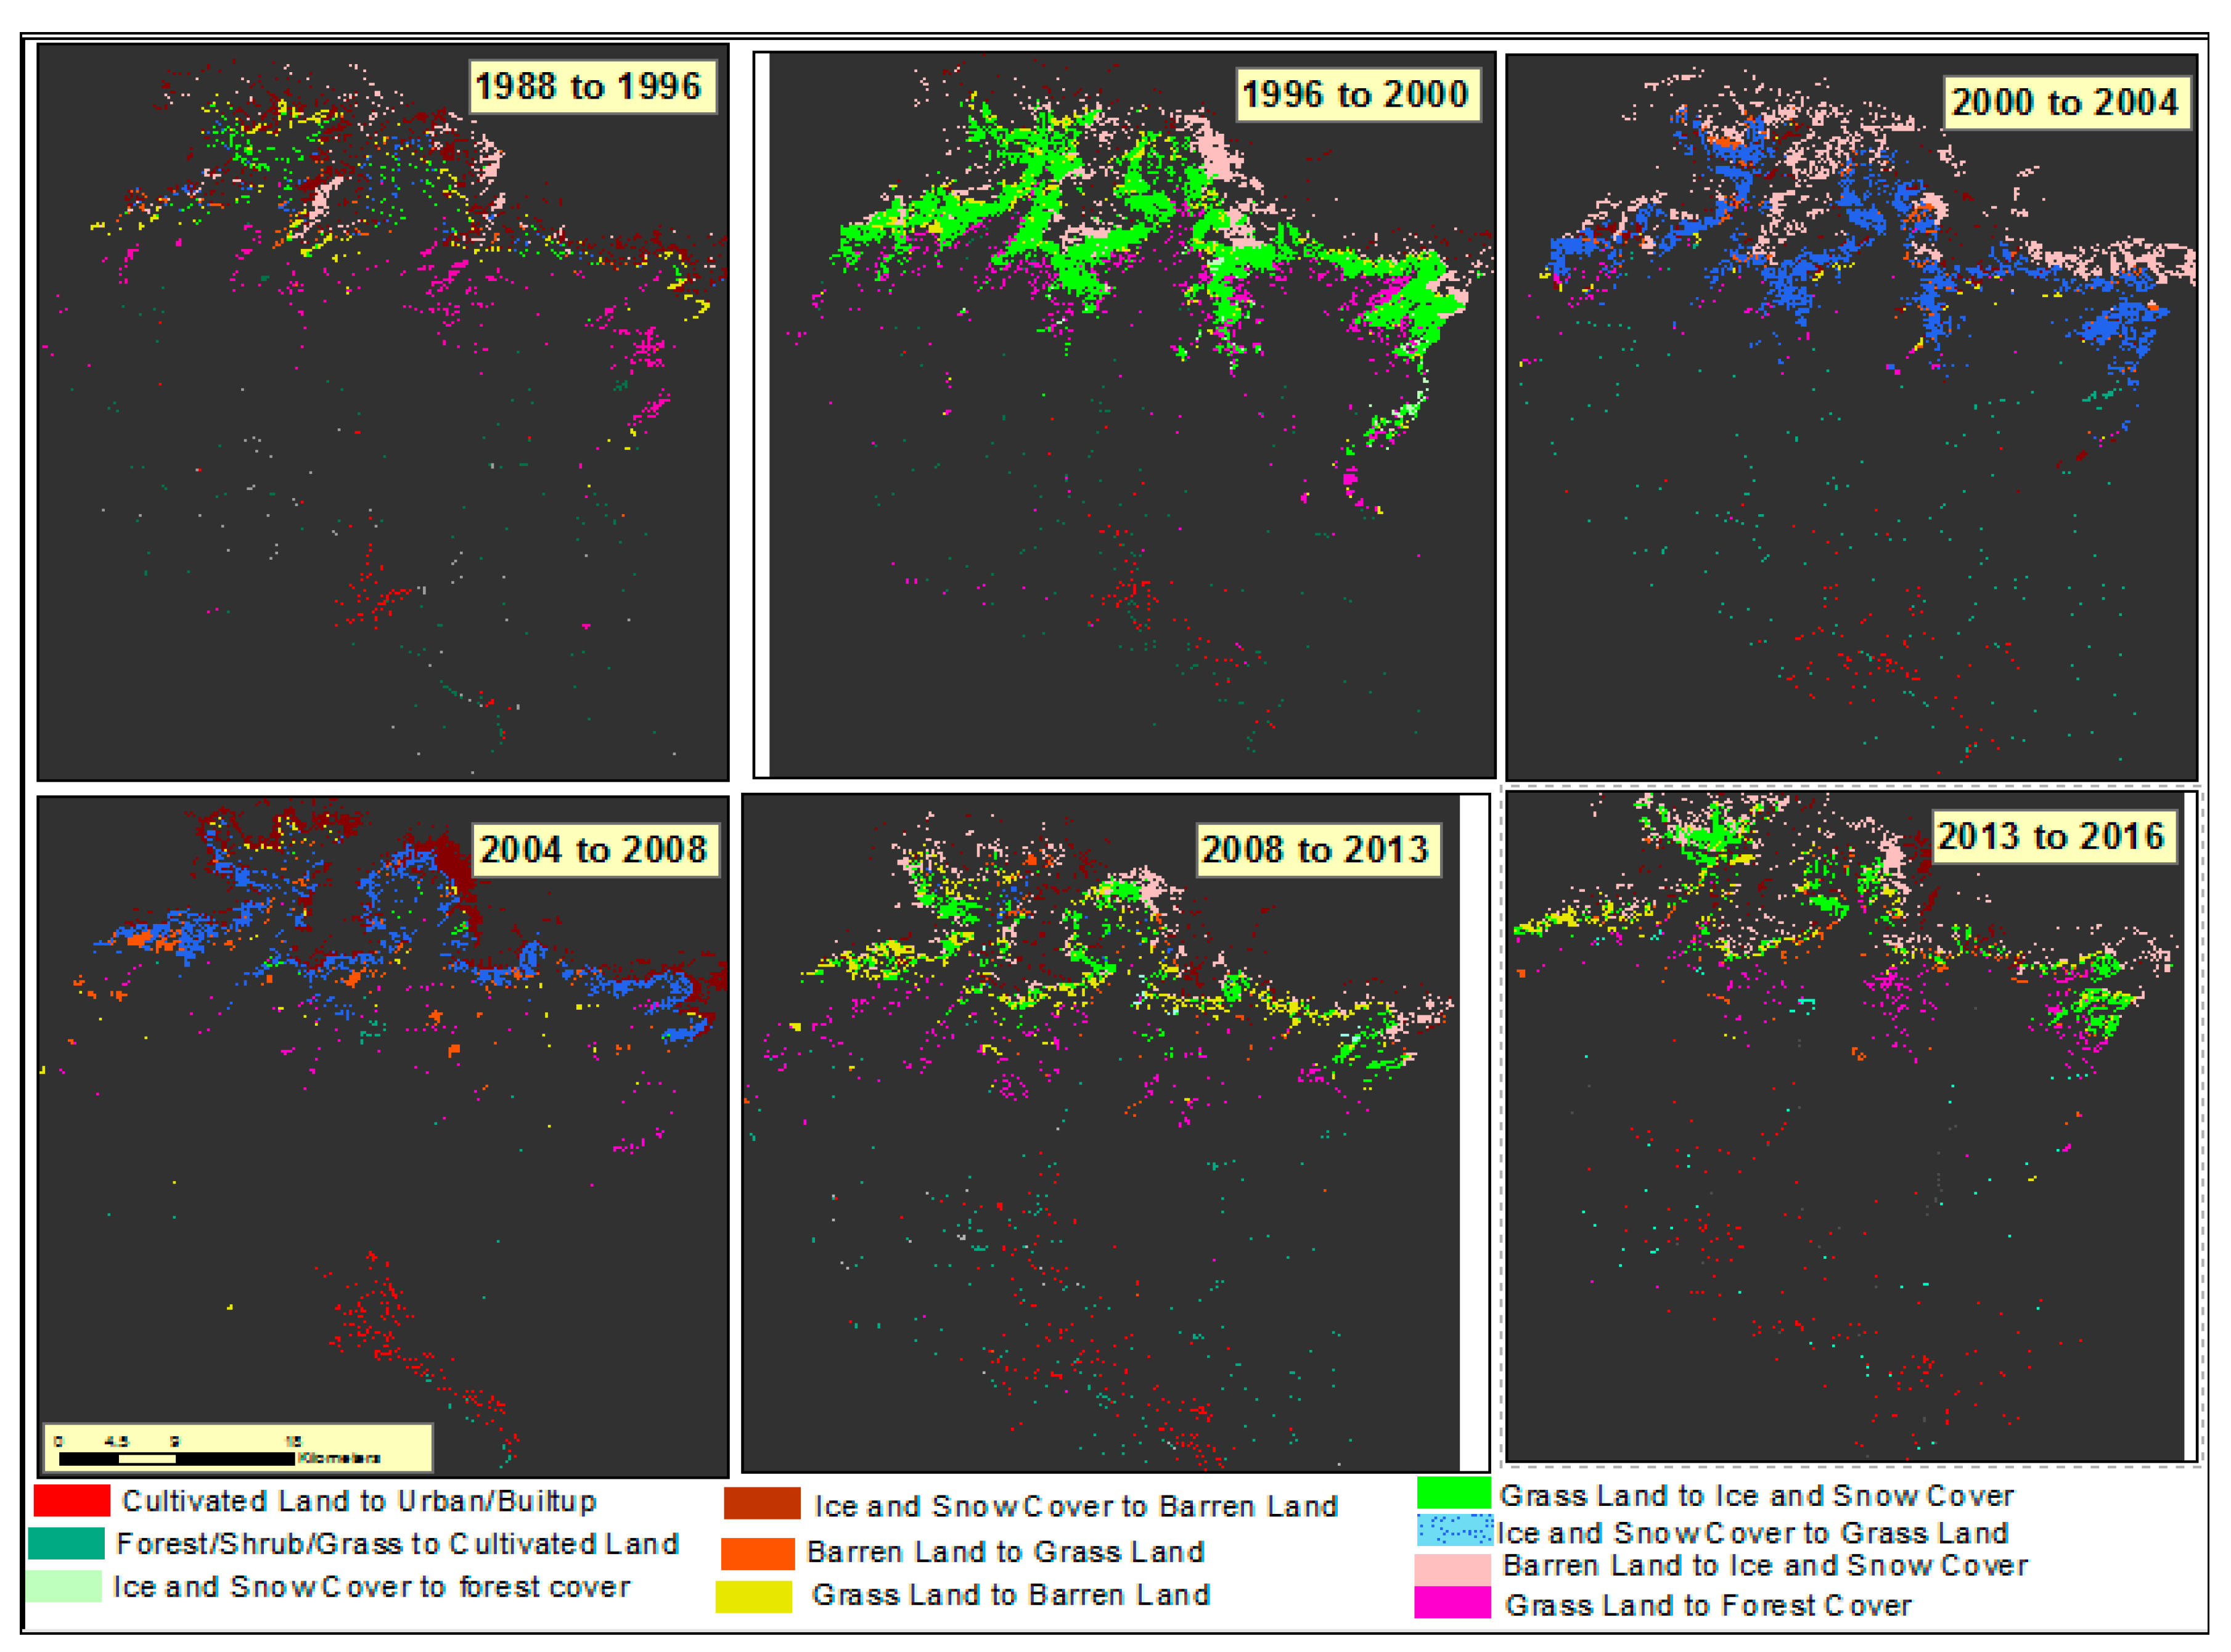
Figure 6.
Multihazard risk map of the study area: (a) major flood area; (b) multihazard risk urban areas; (c) flood and edge fall and sinkhole risk areas; and (d) overlay of multiple hazards in district map.
Figure 6.
Multihazard risk map of the study area: (a) major flood area; (b) multihazard risk urban areas; (c) flood and edge fall and sinkhole risk areas; and (d) overlay of multiple hazards in district map.
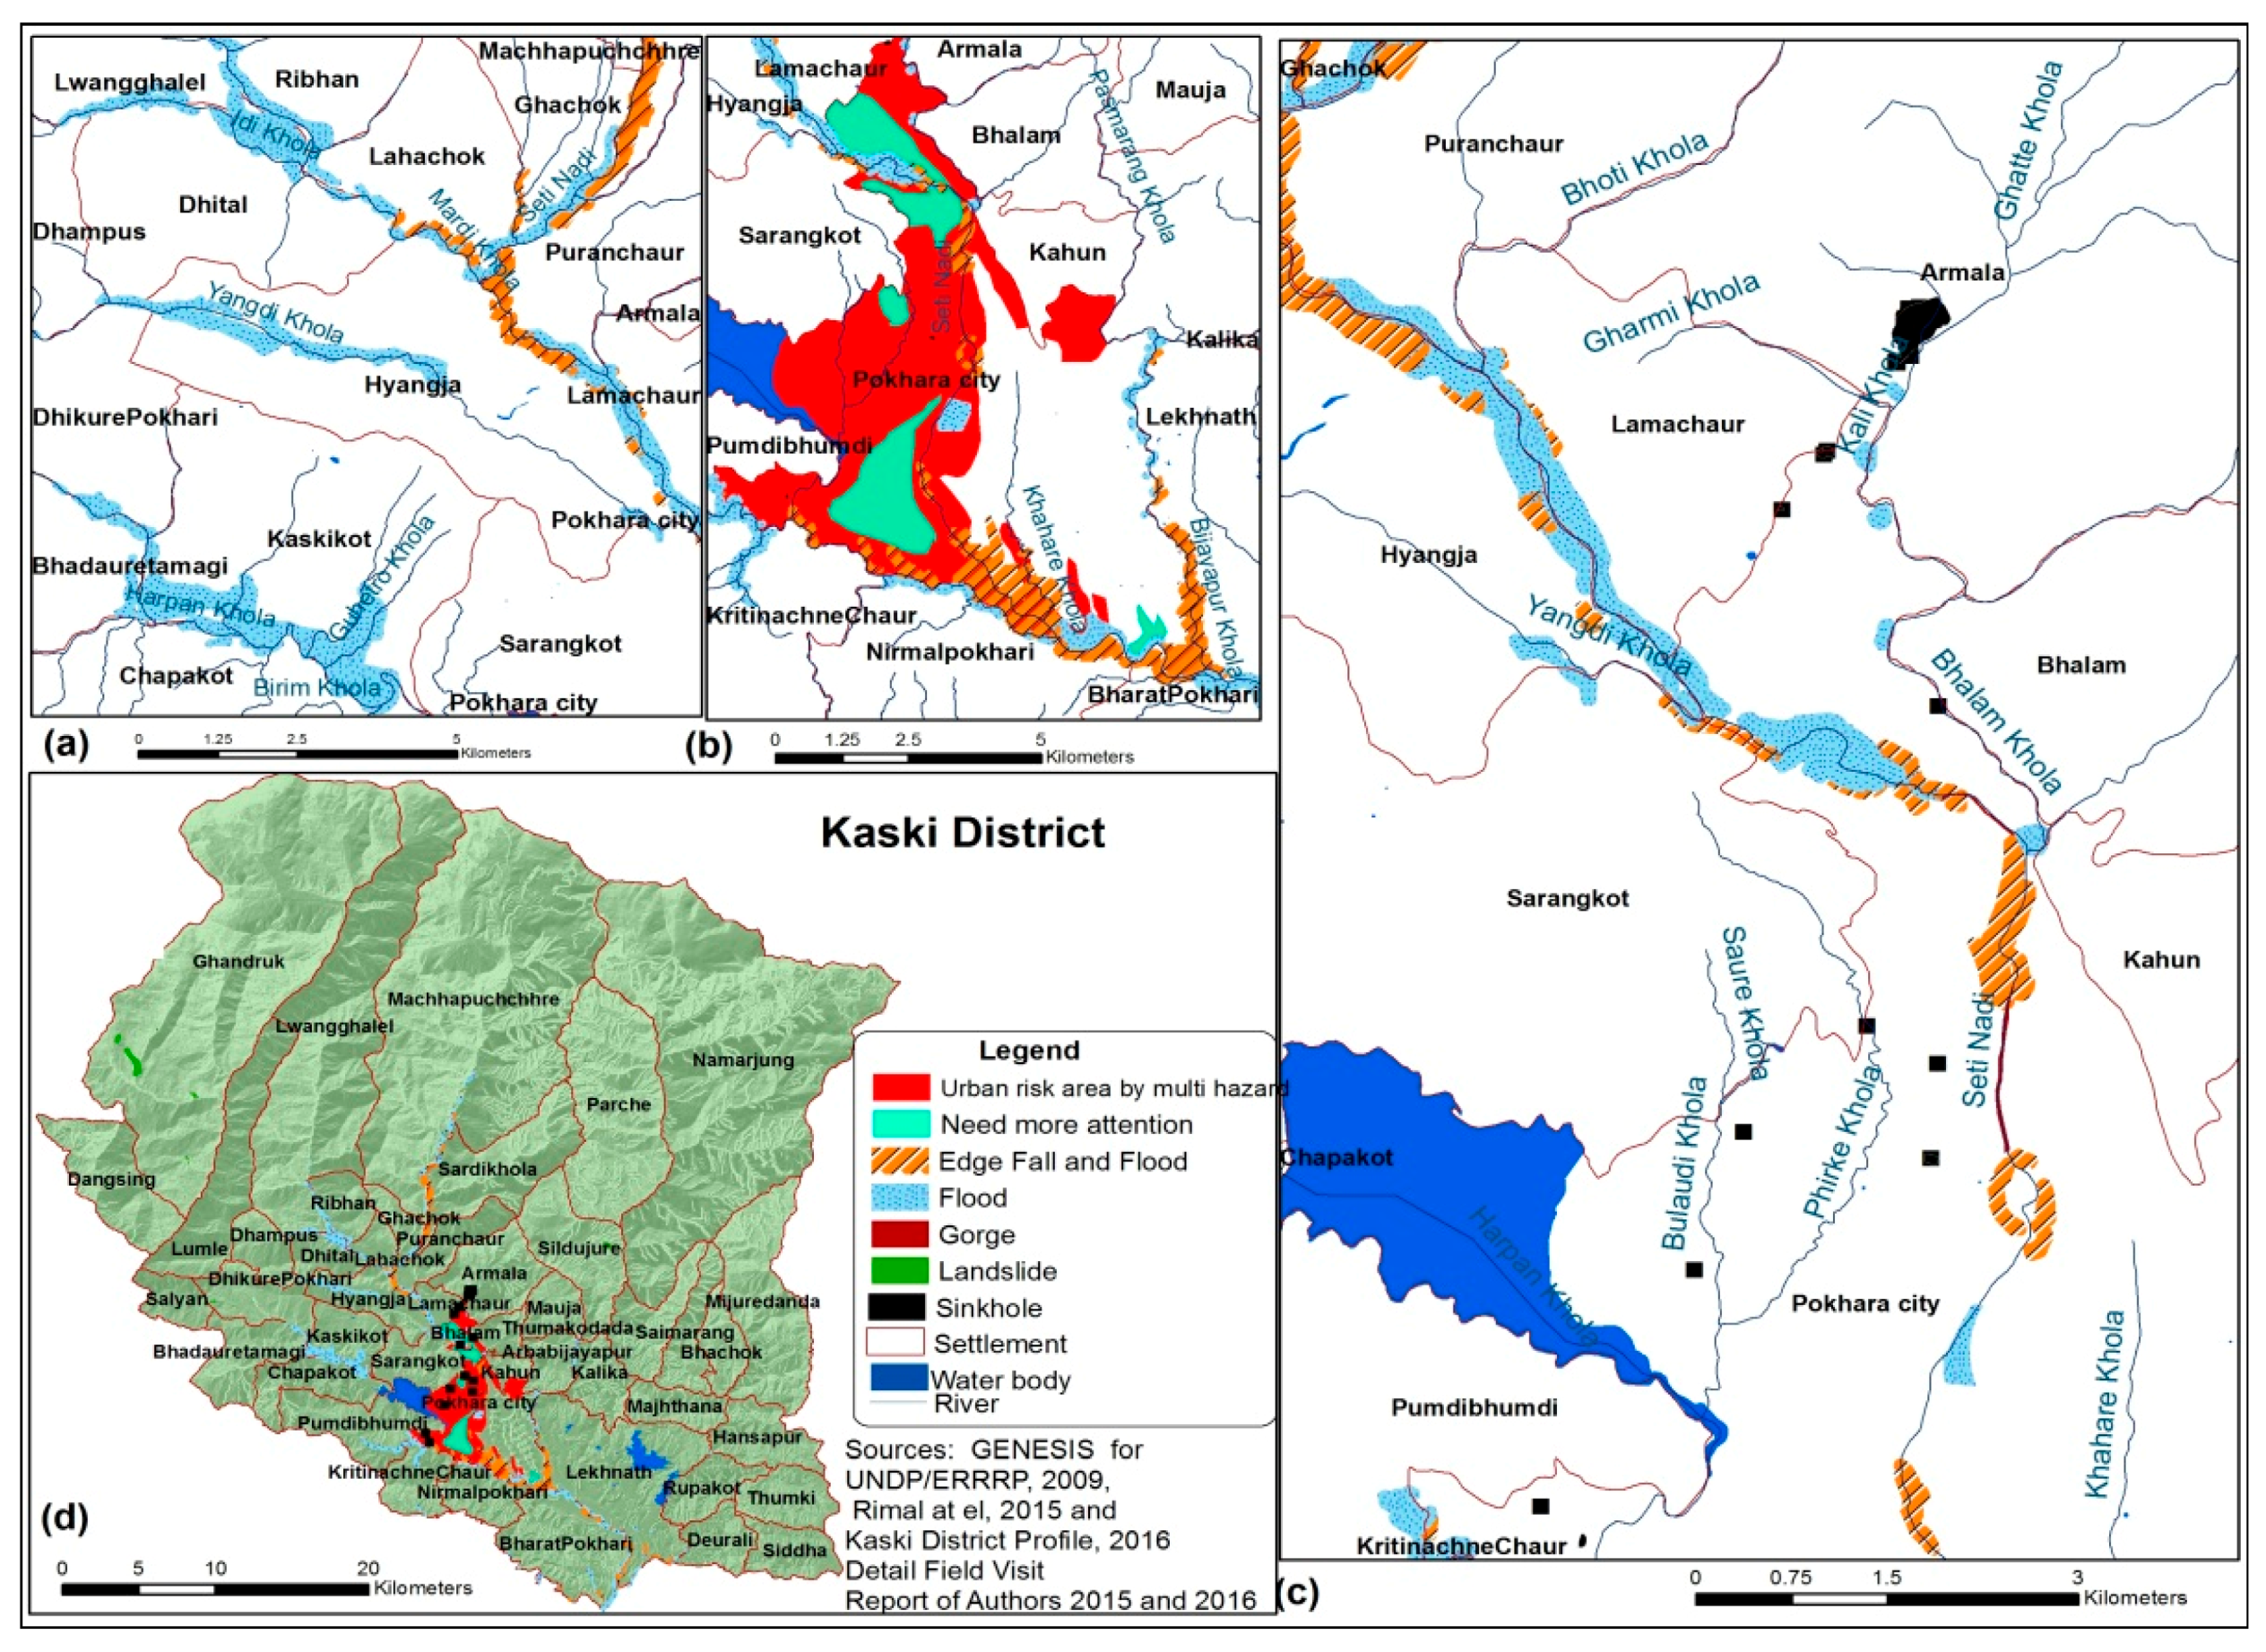
Figure 7.
(a) Risk-sensitive land-use map of 2016; and (b) multihazard risk area in Kaski District.
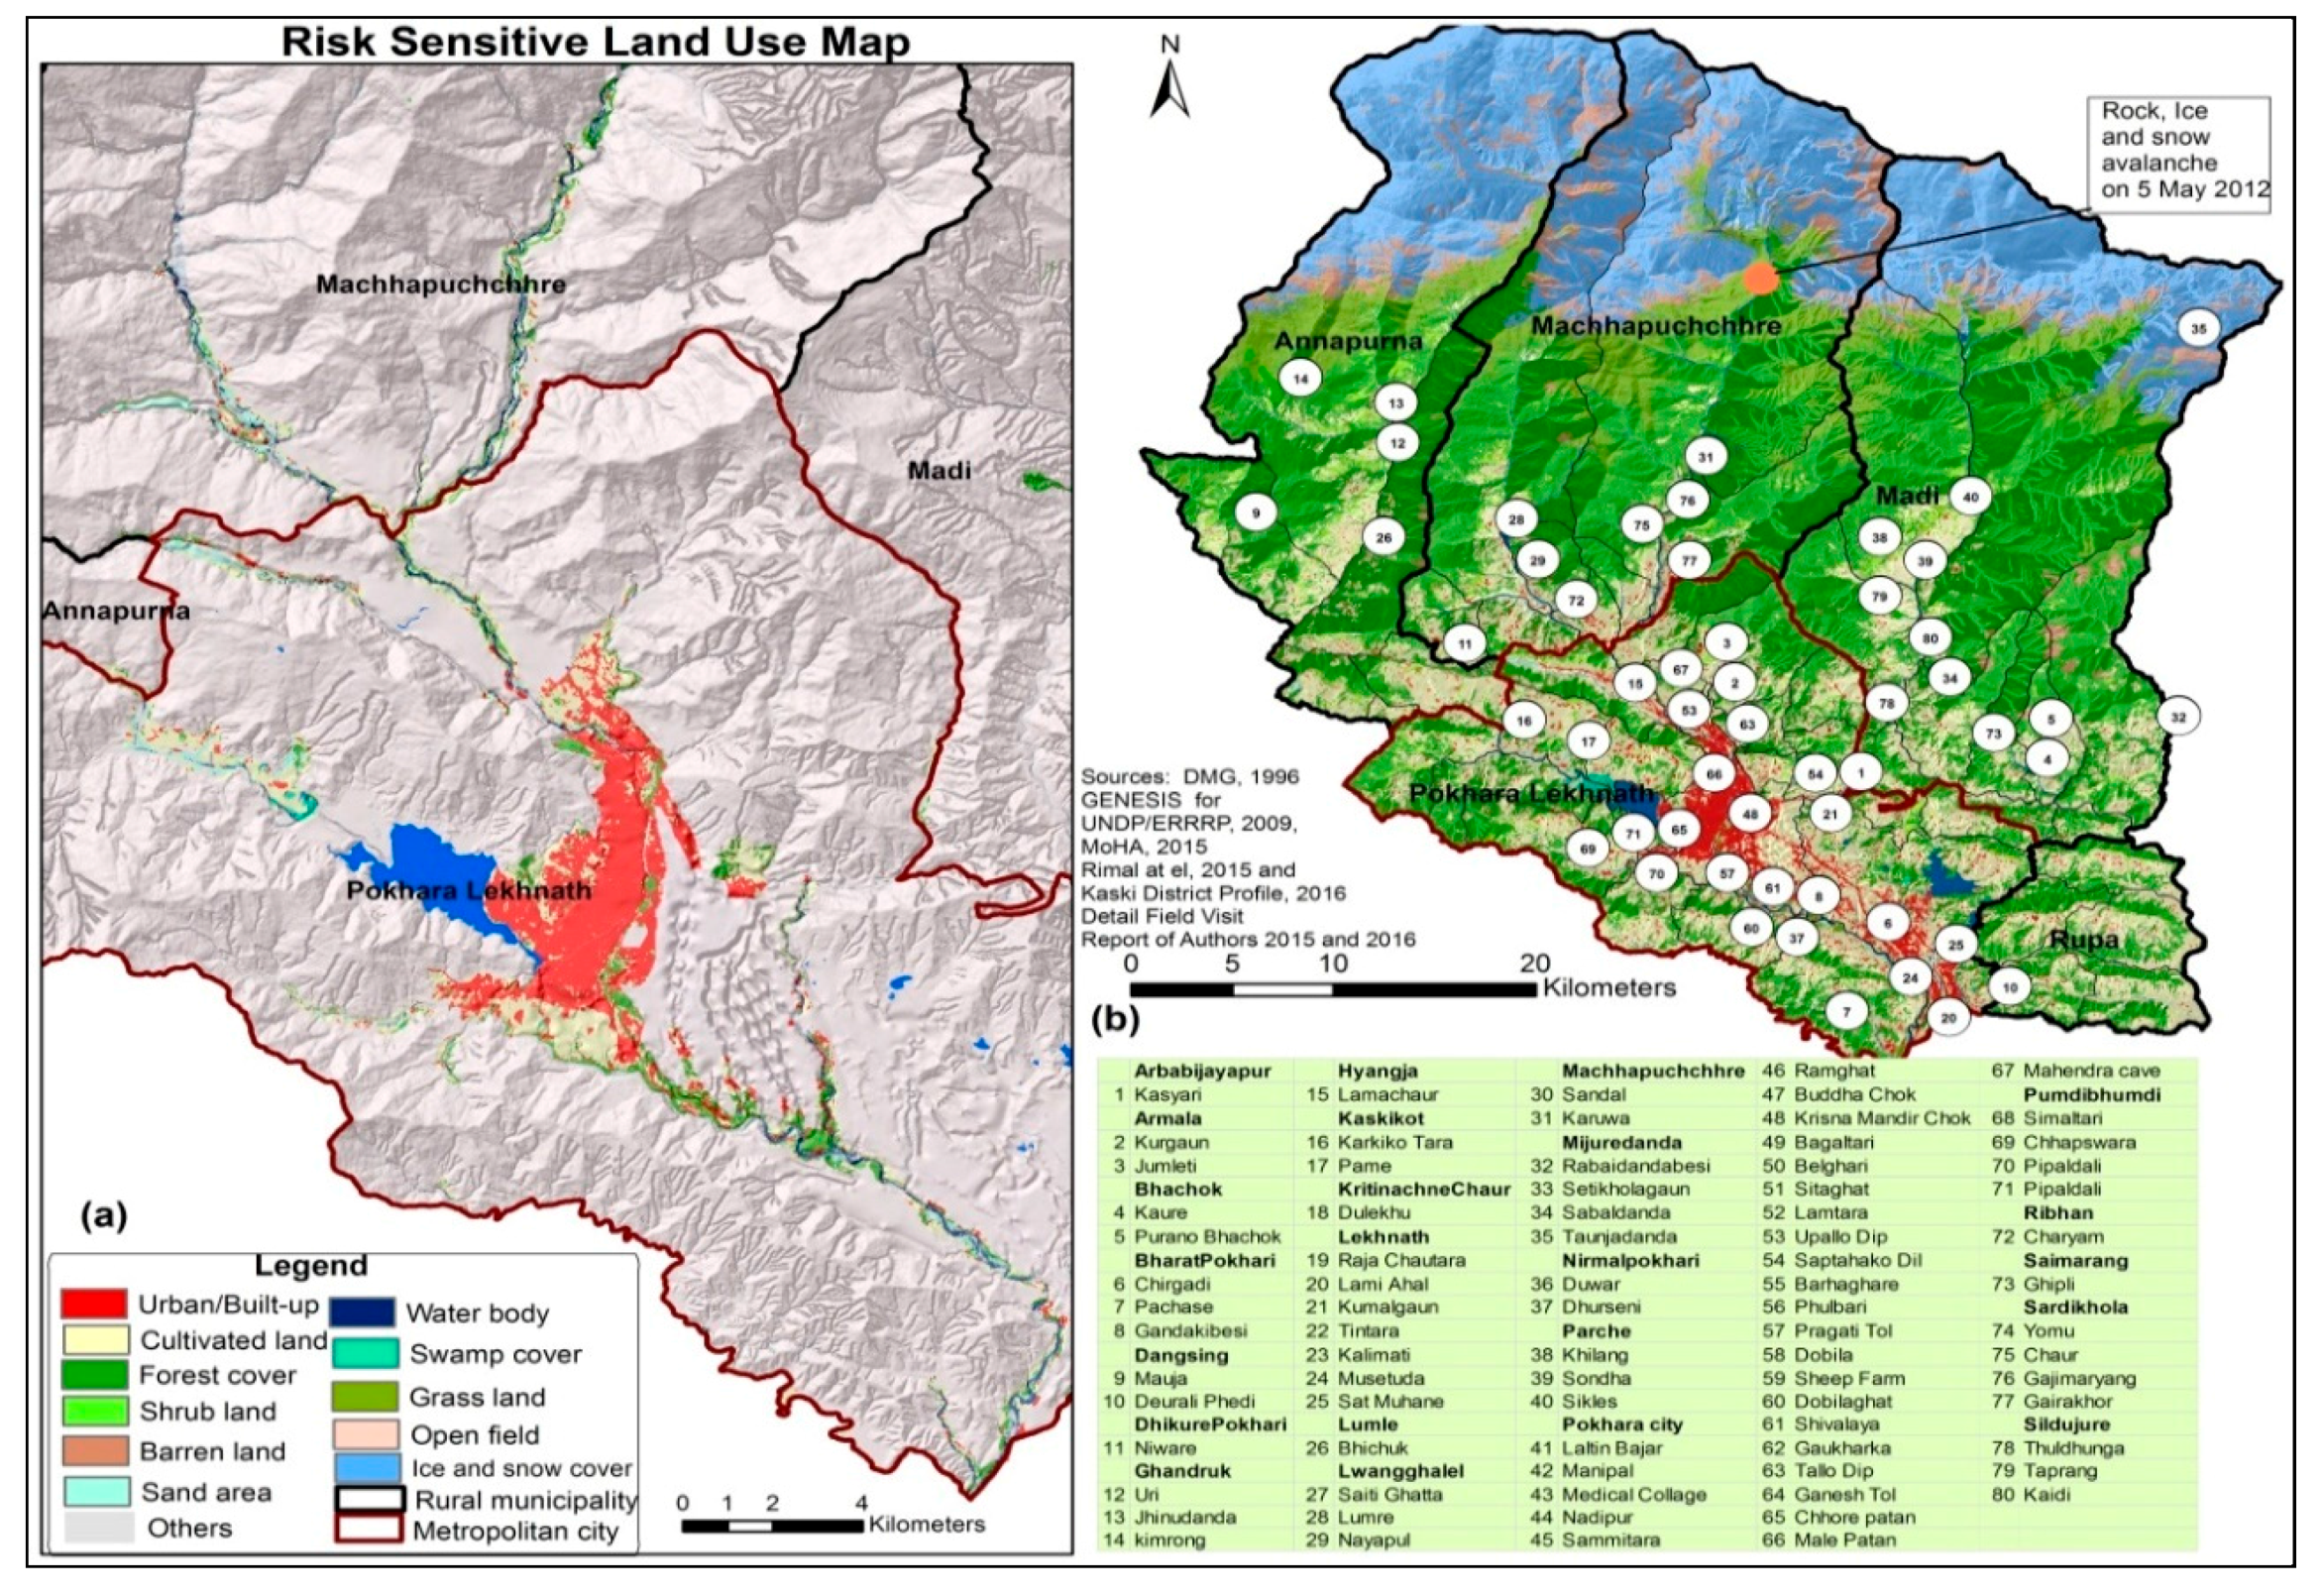
Figure 8.
Simulated LULC maps for (a) 2025 and (b) 2035.

Table 1.
Satellite data used in the study: Landsat Time series 5, 7 and 8 images: Landsat 5 or Thematic Mapper (TM); Landsat 7 or Enhanced Thematic Mapper Plus (ETM+); and Landsat 8 or Operational Land Image (OLI) (Path/Row 142/040).
Table 1.
Satellite data used in the study: Landsat Time series 5, 7 and 8 images: Landsat 5 or Thematic Mapper (TM); Landsat 7 or Enhanced Thematic Mapper Plus (ETM+); and Landsat 8 or Operational Land Image (OLI) (Path/Row 142/040).
| Year | 1988 | 1989 | 1990 | 1991 | 1992 | 1993 | 1994 | 1995 | 1996 | 1999 | 2000 |
| Months | 19-October | 7-November | 16-April | 12-October | 4-March | 20-December | 20-October | 8-November | 12-December | 13-December | 15-February |
| Sensor | TM | TM | TM | TM | TM | TM | TM | TM | TM | ETM+ | ETM+ |
| 2002 | 2003 | 2004 | 2005 | 2008 | 2009 | 2010 | 2011 | 2013 | 2014 | 2015 | 2016 |
| 3-November | 12-April | 15-October | 18-October | 26-October | 29-October | 18-February | 5-February | 24-October | 13-February | 15-January | 22-March |
| ETM + | ETM + | TM | TM | TM | TM | TM | TM | OLI | OLI | OLI | OLI |
Table 2.
Land-cover classification scheme.
| Land Cover Types | Description |
|---|---|
| Swamp/Wetland | Swamp land/and with a permanent mixture of water and marsh |
| Open field | Government protected area for the construction, playground, unused land |
| Ice and snow-cover | Perpetual/temporary snow-cover, perpetual ice/glacier lake |
| Barren land | Cliffs/ small landslide, bare rocks, other permanently abandoned land |
| Sand | Sand area, other unused land, river bank |
| Water | River, lake/pond, canal, reservoir |
| Shrub | Mix of trees (<5 m tall) and other natural covers |
| Grass | Mainly grass field-(dense coverage grass, moderate coverage grass and low coverage grass) |
| Forest | Evergreen broad leaf forest, deciduous forest, scattered forest, low density sparse forest, degraded forest |
| Cultivated land | Wet and dry croplands, orchard and dry croplands, orchards |
| Urban/built-up | Commercial areas, urban and rural settlements, industrial areas, construction areas, traffic, airports, public service areas (e.g., school, college, hospital) |
Table 3.
Extracted weights on analytic hierarchy process (AHP) and fuzzy standardization for urban areas.
Table 3.
Extracted weights on analytic hierarchy process (AHP) and fuzzy standardization for urban areas.
| Factors | Function | Control Points | Weights |
|---|---|---|---|
| Slope | Sigmoid | 0% highest suitability 0–15% decreasing suitability >15% no suitability | 0.19 |
| Distance from roads | J-shaped | 0–500 m highest suitability 500–5000 m decreasing suitability >5000 m no suitability | 0.28 |
| Distance from water bodies | Linear | 0–100 m no suitability 100–7500 increasing suitability 7500 m highest suitability | 0.15 |
| Distance from built-up areas | Linear | 0–100 m highest suitability 100–5000 m decreasing suitability 5000 m no suitability | 0.38 |
Table 4.
Landslide hazard prone areas of Kaski District.
| Watershed | Location |
|---|---|
| Madi | Surrounding of Rabaidanda village of Mijure VDC and Pakhurikot, Ghartidanda and Puranokopakha of Bhachok VDC, almost areas of Saimarang VDC, eastern and western part of Yangjakot in Thumakodanda, Setikhola pakha in Narmajung VDC, Nangjung landslide area of Sildjure VDC, Madi river bank from Sodha to Sikles of Parche VDC, and the hill between Chippali to Khilanko |
| Bijaipur | Mauja and Bhalam VDCs |
| Kalikhola | Armala and Bhalam areas |
| Seti gandaki | Sardikhola and Dhiprang khola area |
| Mardikhola | Idikhola area |
| Modi | Tanchok, Bhichok and Modi bank of Landrung village, upper belt of Kyumrong khola, Uri gaun and Kimche gaun of Ghandruk vdc, Bhurungdi khola area of Dangshigh vdc and Salyan VDC |
| Harpankhola | Kaskikot, Dhikupoikhari, Bhaduretamagi and Sarraukot VDC |
| Fursekhola | Pumbhumdi VDC |
| Suraudi | Kristi nachne chaur |
Source: District Development Committee (DDC) Kaski, 2016.
Table 5.
Transition probability matrix of LULC classes for the periods 1995–2005 and 2005–2015.
| LULC | UB | CL | FC | SL | BL | SA | WB | SC | GL | OF | I & SC | |
|---|---|---|---|---|---|---|---|---|---|---|---|---|
| 1995–2005 | UB | 0.9402 | 0.0068 | 0.0068 | 0.0008 | 0.001 | 0.0024 | 0.0379 | 0 | 0.0022 | 0.002 | 0 |
| CL | 0.0288 | 0.911 | 0.0353 | 0.001 | 0.0007 | 0.001 | 0.0063 | 0.0054 | 0.0103 | 0.0003 | 0 | |
| FC | 0.0004 | 0.0101 | 0.9309 | 0.0032 | 0.0185 | 0 | 0.0056 | 0.0001 | 0.0306 | 0.0004 | 0.0002 | |
| SL | 0.0001 | 0.1293 | 0.0182 | 0.8227 | 0.0016 | 0.0003 | 0.0005 | 0 | 0.0233 | 0 | 0 | |
| BL | 0 | 0 | 0.0119 | 0 | 0.3925 | 0.0004 | 0 | 0 | 0.0626 | 0 | 0.0356 | |
| SA | 0.0368 | 0.0301 | 0.0123 | 0.0041 | 0.0098 | 0.7578 | 0.1377 | 0.0004 | 0.0102 | 0.0003 | 0.0005 | |
| WB | 0.0189 | 0.0056 | 0.0188 | 0.0004 | 0.0011 | 0.0551 | 0.874 | 0.0029 | 0.0058 | 0.0011 | 0.0312 | |
| SC | 0.001 | 0.0379 | 0.2168 | 0 | 0 | 0 | 0.2178 | 0.5265 | 0 | 0 | 0 | |
| GL | 0.0026 | 0.0209 | 0.1074 | 0.0022 | 0.0644 | 0.0023 | 0.0055 | 0 | 0.717 | 0.0005 | 0.0071 | |
| OF | 0.0216 | 0.0181 | 0.0508 | 0.0028 | 0.009 | 0.009 | 0.0139 | 0 | 0.025 | 0.8498 | 0 | |
| I & SC | 0 | 0 | 0.0002 | 0 | 0.0935 | 0.0008 | 0.0027 | 0 | 0.1062 | 0 | 0.9186 | |
| 2005–2015 | UB | 0.9236 | 0.0213 | 0.0078 | 0.0001 | 0.0016 | 0.0175 | 0.0209 | 0.0003 | 0.0059 | 0.001 | 0 |
| CL | 0.0621 | 0.8891 | 0.0216 | 0.0052 | 0.0006 | 0.0043 | 0.0031 | 0.0026 | 0.0113 | 0.0001 | 0 | |
| FC | 0.0008 | 0.0138 | 0.9327 | 0.0019 | 0.0203 | 0.0003 | 0.0018 | 0.0003 | 0.0234 | 0.0003 | 0.0045 | |
| SL | 0.0006 | 0.0245 | 0.0233 | 0.8804 | 0.0002 | 0.0006 | 0.001 | 0 | 0.0694 | 0.0001 | 0 | |
| BL | 0.0001 | 0.0005 | 0.0721 | 0.0008 | 0.5274 | 0.0007 | 0.0004 | 0 | 0.0568 | 0.0002 | 0.341 | |
| SA | 0.0491 | 0.0366 | 0.002 | 0.0019 | 0.0045 | 0.771 | 0.1136 | 0.0001 | 0.0259 | 0.0013 | 0.0001 | |
| WB | 0.0273 | 0.0182 | 0.0717 | 0.0001 | 0.0012 | 0.1122 | 0.7466 | 0.0118 | 0.0064 | 0.0006 | 0.0039 | |
| SC | 0.0009 | 0.2497 | 0.0313 | 0 | 0 | 0.0028 | 0.0055 | 0.708 | 0.0018 | 0 | 0 | |
| GL | 0.0031 | 0.0203 | 0.0673 | 0.0014 | 0.2826 | 0.0018 | 0.001 | 0 | 0.4087 | 0.0001 | 0.2137 | |
| OF | 0.0405 | 0.0317 | 0.0133 | 0.0028 | 0.0017 | 0.0072 | 0.0028 | 0 | 0.1046 | 0.7764 | 0 | |
| I & SC | 0 | 0 | 0.0002 | 0 | 0.0935 | 0.0008 | 0.0027 | 0 | 0.1062 | 0 | 0.8661 |
Table 6.
Distribution of land-use categories (in km2) and percentage of the categories for 2025–2035.
Table 6.
Distribution of land-use categories (in km2) and percentage of the categories for 2025–2035.
| LULC | UB | CL | FC | SL | BL | SA | WB | SC | GL | OF | I & SC |
|---|---|---|---|---|---|---|---|---|---|---|---|
| 2025 | 64.12 | 403.07 | 865.02 | 41.21 | 205.36 | 14.43 | 32.99 | 2.99 | 108.29 | 1.57 | 349.2 |
| 2035 | 70.8 | 399.46 | 860.57 | 42.53 | 200.83 | 15.68 | 31.5 | 3.29 | 82.98 | 1.58 | 379.03 |
© 2018 by the authors. Licensee MDPI, Basel, Switzerland. This article is an open access article distributed under the terms and conditions of the Creative Commons Attribution (CC BY) license (http://creativecommons.org/licenses/by/4.0/).
Share and Cite
MDPI and ACS Style
Rimal, B.; Zhang, L.; Keshtkar, H.; Sun, X.; Rijal, S. Quantifying the Spatiotemporal Pattern of Urban Expansion and Hazard and Risk Area Identification in the Kaski District of Nepal. Land 2018, 7, 37. https://doi.org/10.3390/land7010037
AMA Style
Rimal B, Zhang L, Keshtkar H, Sun X, Rijal S. Quantifying the Spatiotemporal Pattern of Urban Expansion and Hazard and Risk Area Identification in the Kaski District of Nepal. Land. 2018; 7(1):37. https://doi.org/10.3390/land7010037
Chicago/Turabian StyleRimal, Bhagawat, Lifu Zhang, Hamidreza Keshtkar, Xuejian Sun, and Sushila Rijal. 2018. "Quantifying the Spatiotemporal Pattern of Urban Expansion and Hazard and Risk Area Identification in the Kaski District of Nepal" Land 7, no. 1: 37. https://doi.org/10.3390/land7010037
Note that from the first issue of 2016, this journal uses article numbers instead of page numbers. See further details here.