Article

Sustainability of Smallholder Livelihoods in the Ecuadorian Highlands: A Comparison of Agroforestry and Conventional Agriculture Systems in the Indigenous Territory of Kayambi People

by
Raúl Córdova
1,*,
Nicholas J. Hogarth
1,2 and
Markku Kanninen
1
1
Viikki Tropical Resources Institute (VITRI), Department of Forest Sciences; University of Helsinki, Latokartanonkaari 7, P.O. Box 27, 00014 Helsinki, Finland
2
Helsinki Institute of Sustainability Science (HELSUS), University of Helsinki, 00014 Helsinki, Finland
*
Author to whom correspondence should be addressed.
Submission received: 9 March 2018 / Revised: 4 April 2018 / Accepted: 5 April 2018 / Published: 10 April 2018

Abstract

:
Smallholder farming constitutes an important but marginalized sector, responsible for most of the world’s agricultural production. This has a significant influence in the land use/cover change process and agrobiodiversity conservation, especially in mountainous regions of the developing world. Thus, the maintenance of sustainable smallholder farming systems represents a key condition for sustainable land management and to safeguard the livelihoods of millions of rural households. This study uses a combination of biophysical and socioeconomic data based on household interviews to compare 30 highland agroforestry systems and 30 conventional agriculture systems, to determine which system provides better conditions to support sustainable livelihoods for smallholder farmers. The interview data is based mainly on the perceptions of Kayambi indigenous farmers who use these farming systems to support their livelihoods. Independent-Samples t Test and descriptive statistics were applied to analyse the data from 60 farms. The results indicate that agroforestry systems contain greater agrobiodiversity; more diversified livelihoods; better land tenure security and household income; more diversified irrigation sources and less dependency on rainfall than conventional systems. These findings highlight the role of agroforestry systems in supporting sustainable livelihoods of smallholder farmers in mountainous areas.

1. Introduction

An estimated 570 million farms throughout the world are considered to be small or family operated [1]. Smallholder farms are characterized by being less than 10 ha in size [2]; and being family-operated, with limited or no hired labour. In many cases, the smallholders live with poverty, food insecurity, and with limited access to markets and services [3,4]. Despite their socioeconomic and environmental limitations, smallholder farmers play an important role in food supply chains and economies at the local, regional and global level, especially in the developing world, e.g., [1,2,3,4,5,6]. Lowder et al. [1] explain the importance of smallholder farmers, reporting that about 75% of global agricultural land is occupied by smallholders or family farms, which are also responsible for the majority of the world’s agricultural production. Consequently, smallholder farmers have an important influence in the process of land-use/land-cover change and agrobiodiversity conservation [5].
In the Latin American and Caribbean (LAC) context, recent evidence indicates that the situation and importance of smallholder farmers supporting food production systems, livelihoods of rural and urban households, and local and regional economies, have some important similarities and significant differences compared to the regional and global context [1,4,6,7]. One major difference between LAC and other regions is the greater agricultural land grabbing resulting in the consolidation of large landholdings in the hands of landlords and agribusiness companies [1,7]. The higher land consolidation and increasing land grabbing in LAC [8,9] is reducing the possibilities for smallholder access to agricultural land, and usually accelerates the expansion of agricultural frontiers, fragmentation and overexploitation of existing agricultural land and water resources [10]. The marginalization and poverty of smallholder farmers’ households, also increases inequality and reduced access to farmland and other assets for production, such as access to technology, information, credit and technical support [10,11]. In line with the global context, smallholder farmers in LAC play a key role in supporting food production systems and local and regional economies [12]. Altieri et al. [13] reported that smallholder farmers in LAC represents a population of about 66 million people, including 40–55 million indigenous people who are responsible for the production of the main staple foods consumed in the region; including maize, beans, and potatoes. A study conducted in six LAC countries by Soto et al. [6] found that smallholder farming employed between 57% of the agricultural sector and 77% of the rural employment.
In the case of Ecuador, the situation of smallholder farmers appears similar to the general trends in the LAC region. The increasing trend of land consolidation, land grabbing, and unequal distribution of agricultural lands and other assets for production are threatening the maintenance and improvement of smallholders’ livelihoods [14,15,16]. Agricultural land consolidation is also a significant environmental and socioeconomic problem in Ecuador. Approximately 76% of farmers are smallholders (with farms <10 ha), but they occupy only 12% of the agricultural land. In contrast, 6% of farmers have large holdings (>50 ha) and occupy 61% of the land [15,17,18]. Land consolidation and grabbing are associated with the concentration of other productive assets, especially water, which is also concentrated in few and large landholdings [14,15,19,20]. The accumulation of land and water as primary productive assets is closely related to the increase of marginalization, poverty and malnutrition, which are common problems experienced by Ecuadorian smallholders [15,21]. The unequal access to land and water is strongly connected with socioeconomic and cultural discrimination, whereby agricultural land areas with high levels of fragmentation commonly coincide with areas having high poverty levels, and where most indigenous people live. These areas are located mainly in the highlands, which are characterized by steep slopes and harsh environmental conditions [14,15,16].
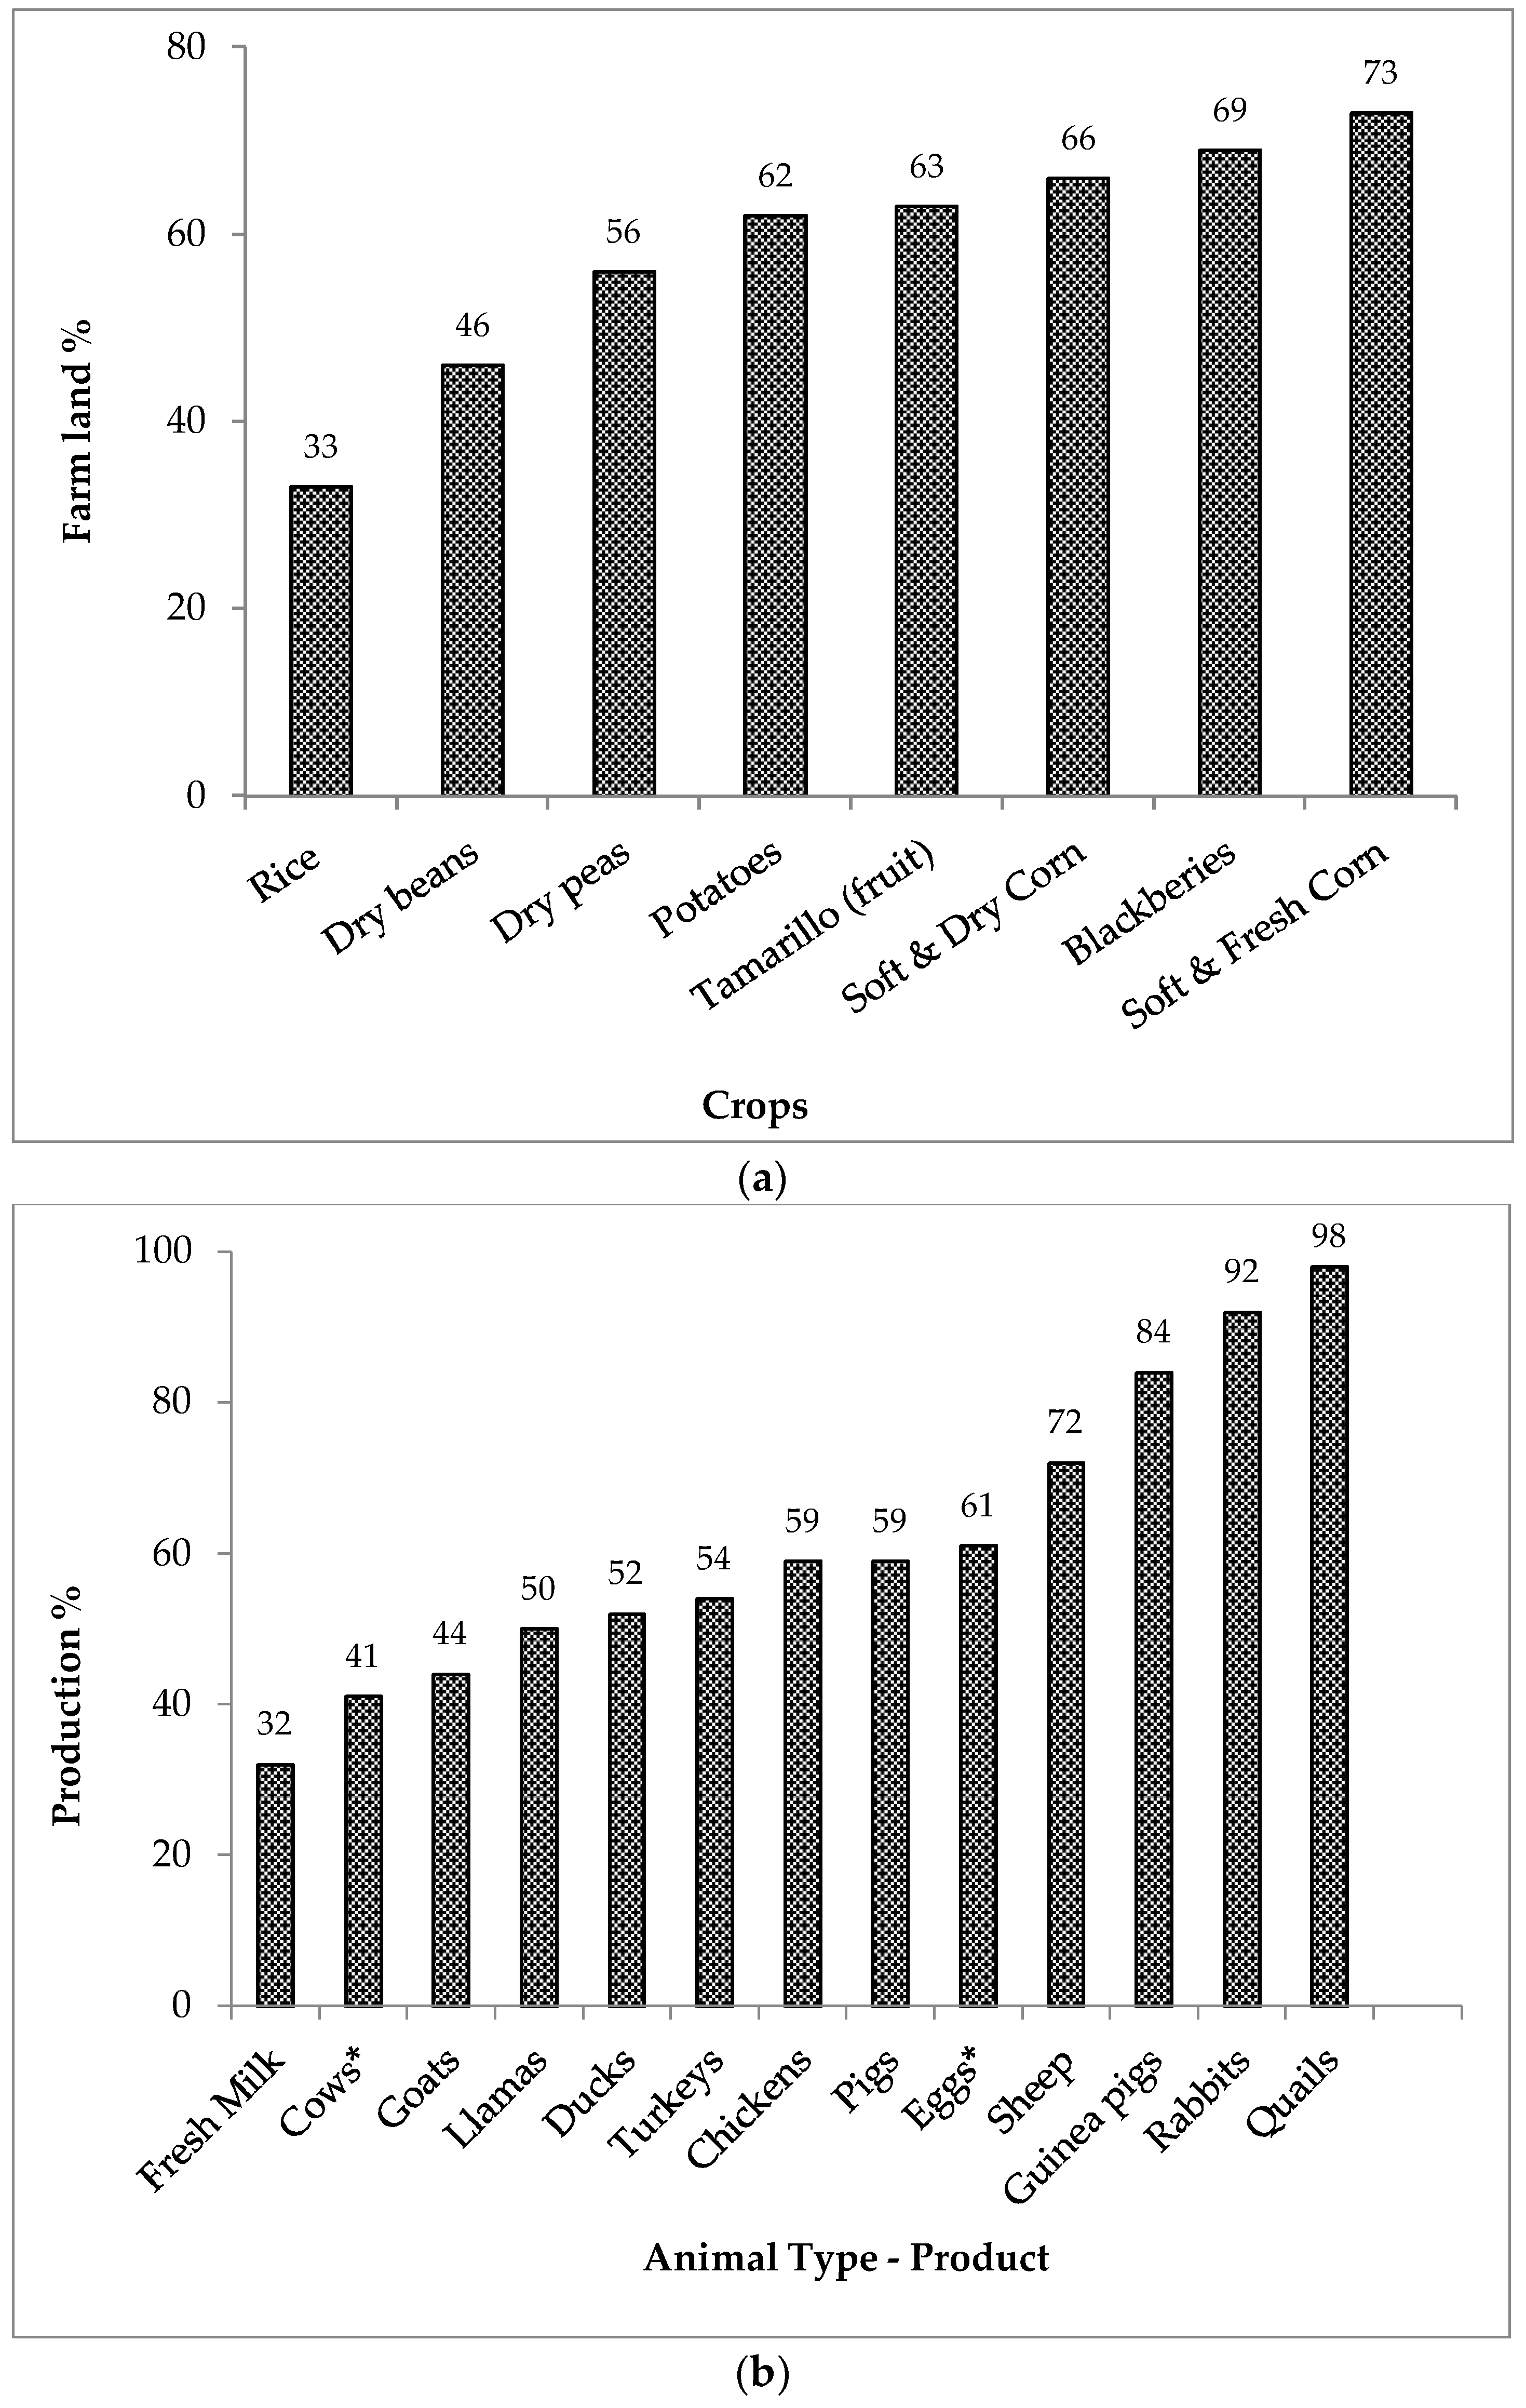
Smallholder farmers in Ecuador play an important role in local food supply for millions of rural and urban households and livelihoods. Data from the last agricultural national census 2000 [18] (Figure A1) and other publications [6,12,19,21,22,23], indicate that most of the staple food consumed in the country is produced by smallholder farmers, giving them a strategic role supporting agrobiodiversity, food security and food sovereignty. Although there is a lack of information detailing the contribution of smallholder farmers to the economy, official data shows that the agriculture sector, which includes smallholdings, contributes 9% to total GDP [15,24], 15.4% of the non-petroleum GDP, and directly employs about 70% of rural workers [15]. Furthermore, the smallholder farming sector employs about 16% of permanent and 40% of non-permanent hired labour in the country [18]. Considering that smallholder farming mainly uses family labour, these figures represent an important contribution by the smallholder sector to rural employment and livelihoods in Ecuador.
In this context, and taking into account that smallholder farming in the developing world is also a very culturally and ecologically heterogeneous sector [25], the aim of this paper is to provide a socioeconomic and environmental analysis of how different types of production systems contribute to the sustainability of smallholder livelihoods in the tropical highlands. The analysis compares smallholder farmers’ perceptions of the main biophysical and socioeconomic components of the farming systems that support their livelihoods. A comparison is made within and between two types of smallholder production systems; agroforestry systems (AFS) and conventional agricultural systems (CAS). CAS are commonly found in the Indigenous Territory of Kayambi People (ITKP), while AFS are less practiced but there is an increasing interest of smallfarmer groups and local institutions, on the implementation of this type of farming systems. The main element differentiating AFS from CAS in this study is the proportion of the farm area covered by trees or shrubs (described in detail in Section 2.2), which influences the biophysic and socioeconomic functioning of the farming system [26].
The main research question addressed in this study is: How sustainable are smallholder AFS and CAS in the ITKP, Ecuador? This question will be addressed through two sub-questions, which are: (1) What are the main biophysical and socioeconomic characteristics and differences between current AFS and CAS? and (2) Which system provides better opportunities to enhance sustainable smallholder farmers’ household incomes and livelihoods?
This paper presents a simplified multidisciplinary case study and contributes towards an improved understanding of the structure and dynamics that maintain and enhance sustainable livelihoods of smallholder farmers in highlands.

2. Materials and Methods

2.1. Study Area

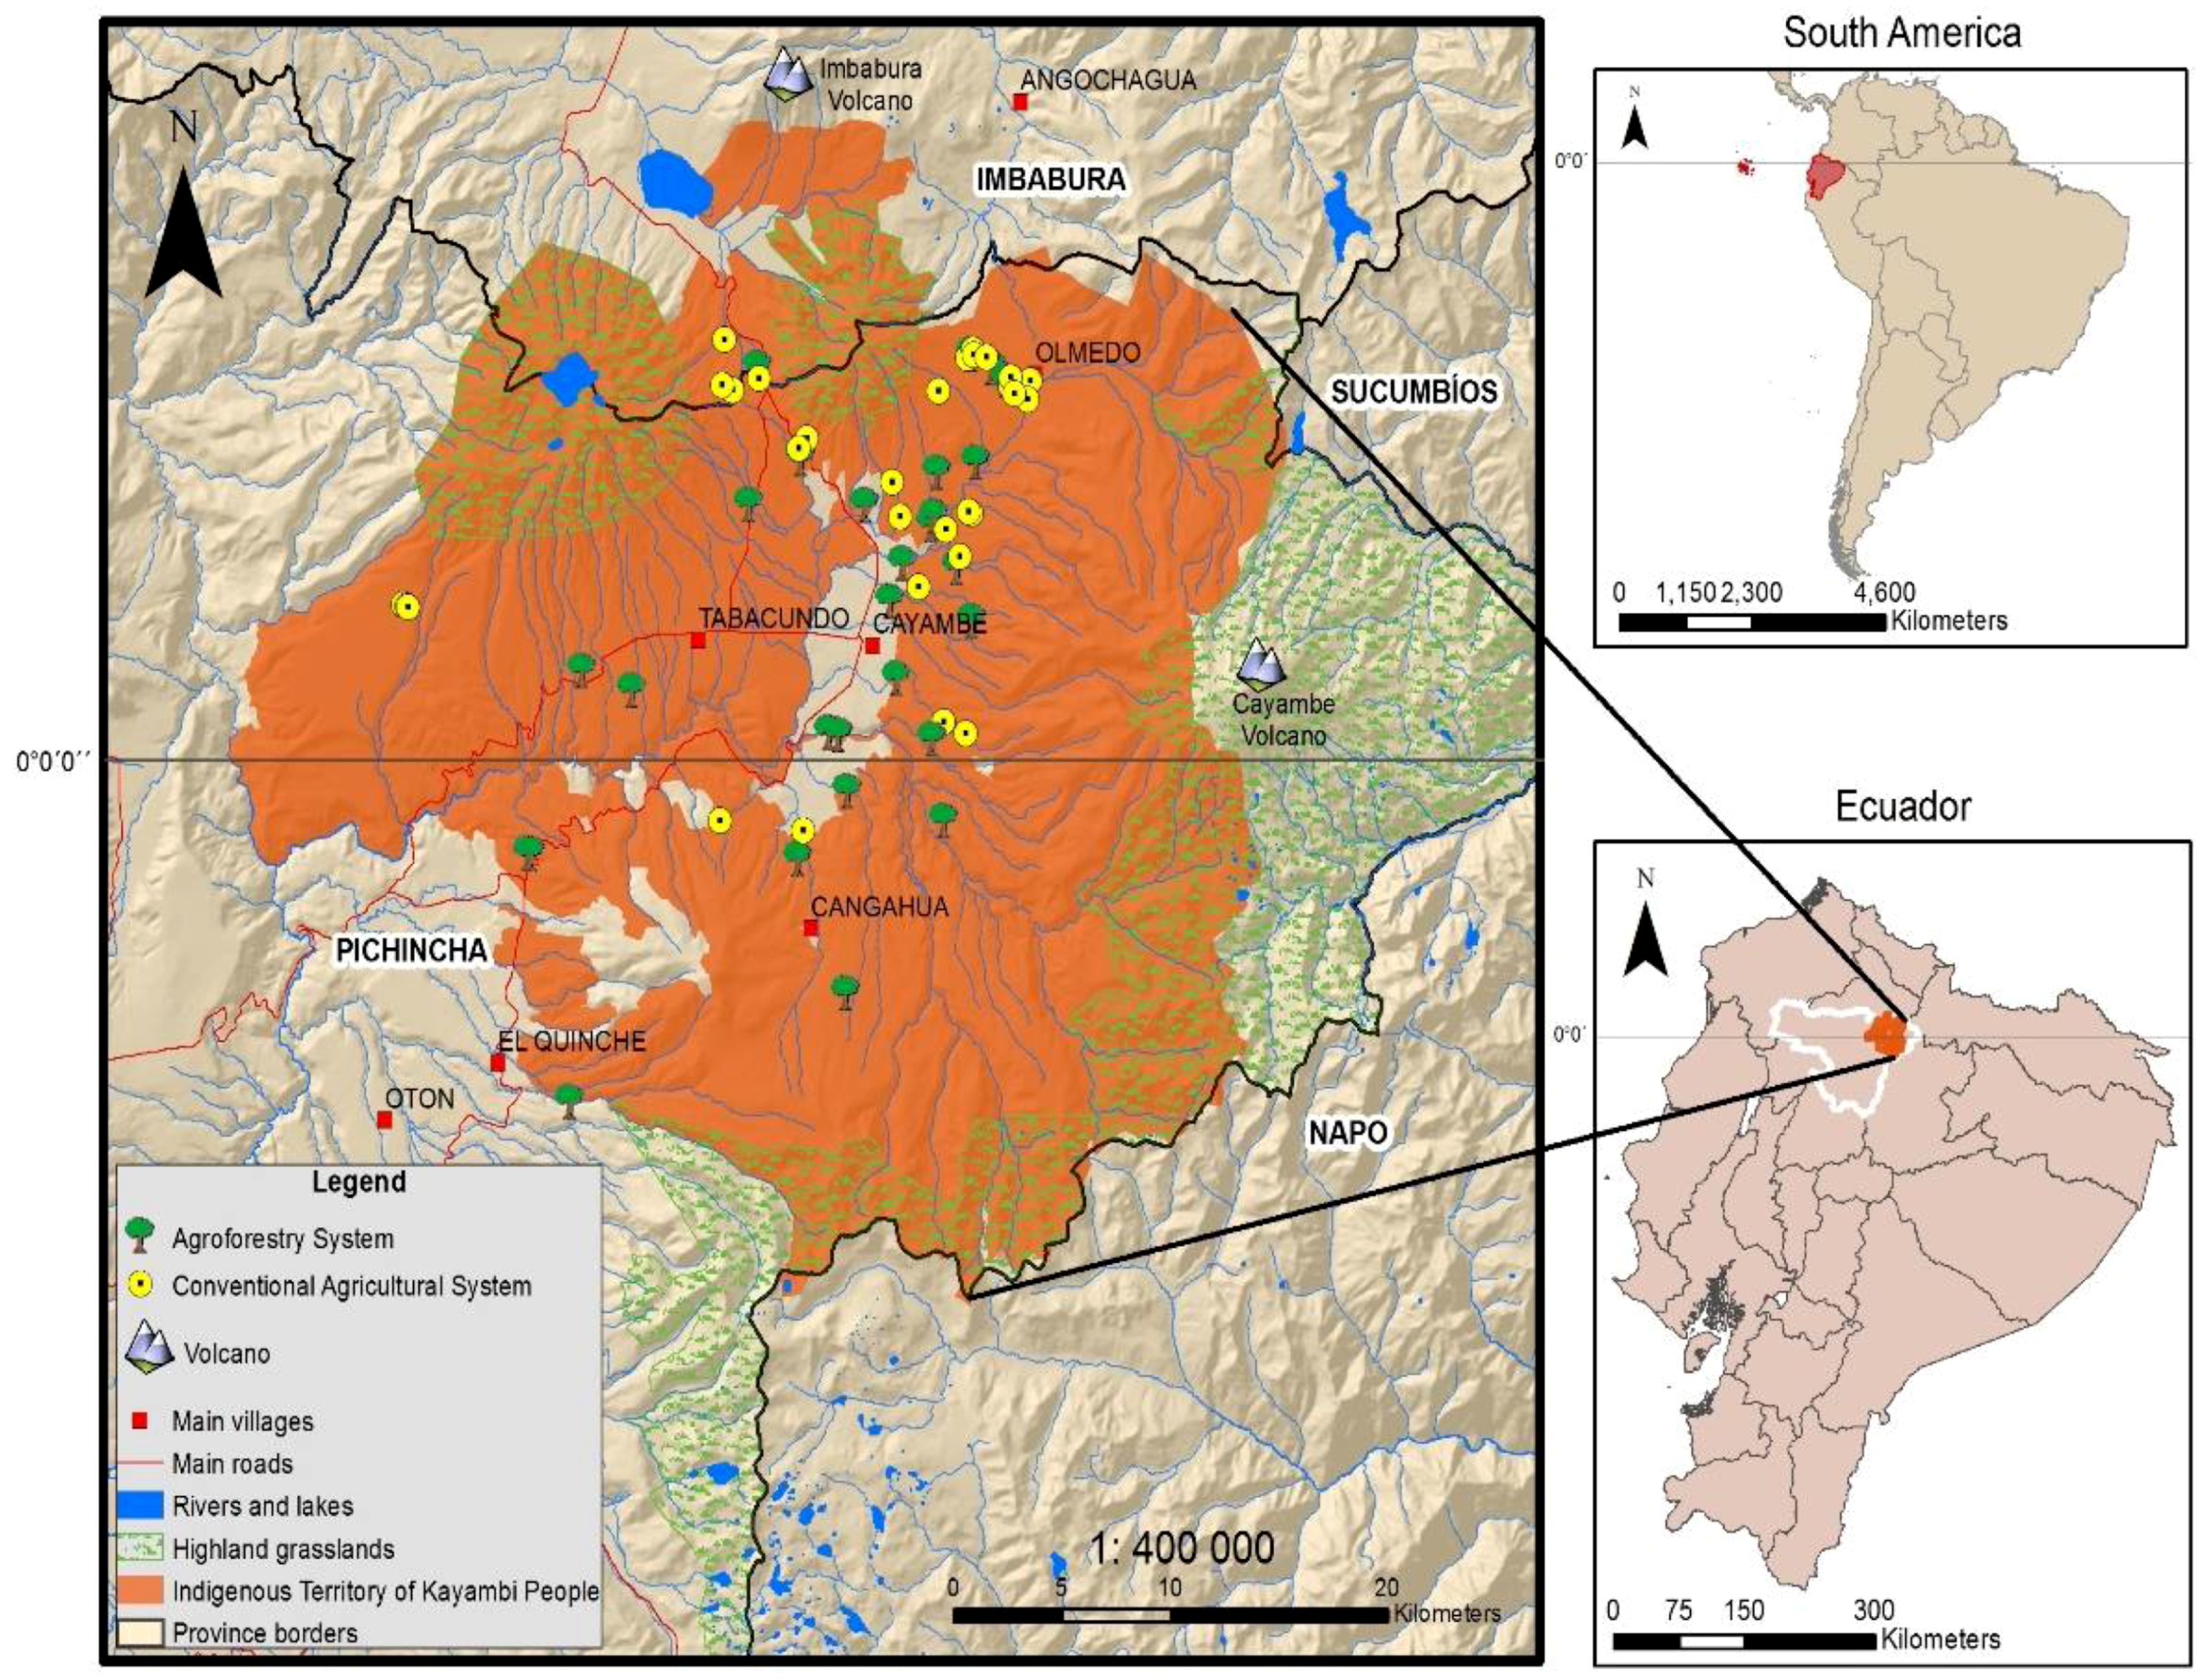
The research area was located in the Northern Highland Andes of Ecuador as part of the ITKP (
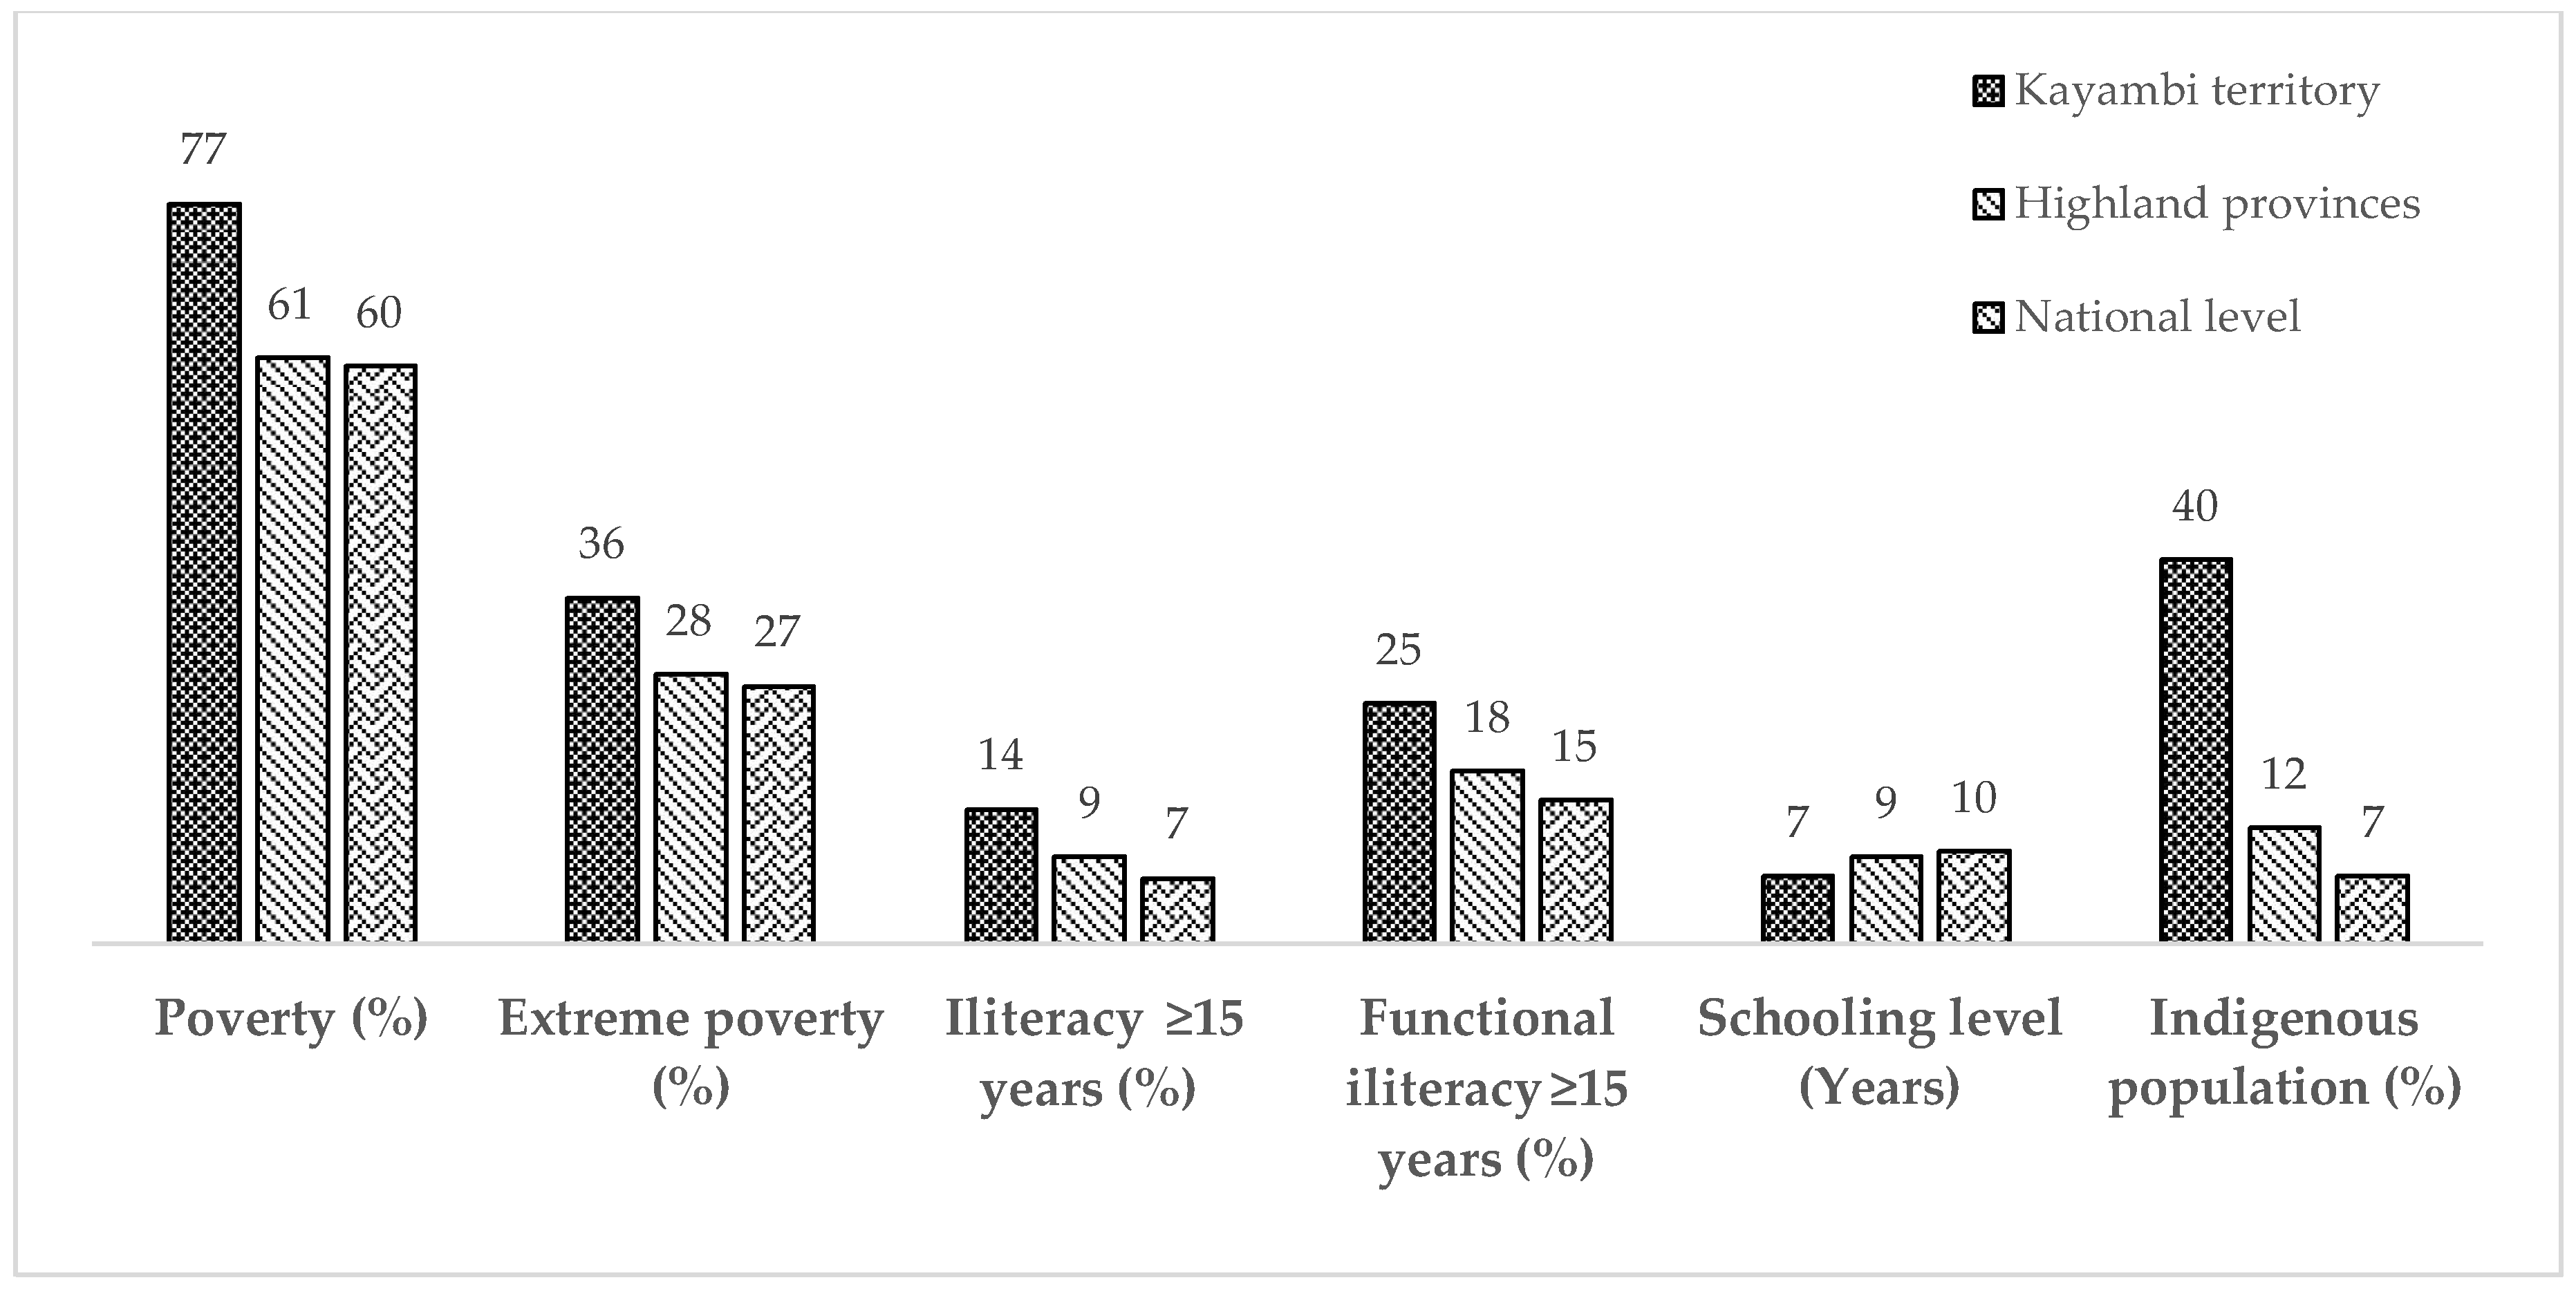
Figure 1). The biophysical and socioeconomic conditions, and problems affecting smallholders in the study area are similar, and in most cases are worse than the conditions and problems of other highland smallholders throughout the country (Figure 2). The Kayambi’s territory includes approximately 1329 km² [27], distributed mainly along the rural highlands of three provinces, six cantons, 16 parishes and 168 communities [28,29,30]. The territory covers an altitude range of 2000 (low valleys) to 5790 m (Cayambe Volcano), along the eastern and western volcanic mountain chains and between the inter-Andean valleys. The Inter-Andean valleys are the lower areas between the two mountain chains and are characterized by the flat or low-sloping topography, while the hillsides are highly eroded with high slopes and little flat land [31]. These geomorphological and topographic features contribute to the formation of a variety of bioclimatic and biotic zones [32,33].
The ITKP includes areas under agricultural production interspersed with natural and semi-natural native ecosystem remnants, especially highland grasslands known locally as “Páramo”. The soils in the ITKP are classified as andisols, mollisols and inceptissols, based on volcanic ash and distinguished by their productivity and fertility [34]. The rainy season usually occurs from September to April with a mean annual rainfall ranging from 250 to 2000 mm [32,35]. The rainy season is commonly distributed in two rain periods, with the first occurring from October to November and the second from February to April. An intermediate period—summer—occurs from June to August and is characterized by dryness, strong winds and high solar radiation and temperature [32]. The temperature varies from dry and temperate in low inter-Andean valleys with average annual temperatures of 12 to 18 °C, to the cold and humid highland grasslands with average annual temperatures of 3 to 6 °C [36].
The ITKP has a population of 154,437, and according to the last national population census [37], the mean concentration of self-recognized indigenous population in the territory is approximately 40% (Table A1 in the Appendix). The indigenous population is unevenly distributed, exceeding 70% in some areas, and more than 90% in others (Table A1, Appendix). The Kayambi’s territory is not an official administrative territory, but rather it can be considered as ancestral territory, managed by the Kayambi people according to their customs and recognized by local, national, international, public and private institutions. These figures reveal the indigenous cultural dominance in the territory, which has a significant influence over the management practices implemented in the traditional farming systems throughout the territory.
The study area was located in the highlands of the ITKP at an altitudinal range of 2500 to 3300 m. Areas such as these have special importance in terms of food security and production, at both the local and national levels. Most of the vegetables and tubers consumed locally and in other regions of the country are produced in these areas. Additionally, dairy farming is becoming one of the most expanded activities. Agricultural management in this area is predominantly with permanent and temporary monoculture crops such as pastures, potatoes, maize, broad beans, Andean lupin and vegetables, but in some places alternative management practices such as crop rotation, agroforestry and agrosilvopastoral systems are also implemented. Most of the crops are produced for home consumption and sale in local markets.
Highlands are transition zones with competition between farmland and highland grassland ecosystems, mainly distributed around Cayambe and Imbabura volcanoes, and in the uplands around Olmedo, Cangahua and Tabacundo villages (Figure 1). The highland grasslands are considered a key Andean ecosystem due to their fresh water supply and regulation function. Currently the expansion and intensification of the agriculture and livestock farming activities are the main drivers of highland grassland depletion [39].
The ITKP was selected because the territory fulfilled the main research requirements, which were: the existence of smallholder agroforestry and conventional agricultural farms in highlands, rural livelihoods based mainly on agricultural activities; and importantly, and the willingness of smallholder farmers and indigenous’ organizations to participate in the research. The favourable logistics and access to reach and work in the area (road infrastructure; security level and relatively easy access from the capital Quito) were also important considerations in the selection of the study area. The Kayambi People’s organisation showed a keen interest in the research and facilitated the access to the territory. The organisation also provided local technicians for logistic and cultural support. Before selecting the ITKP as study area, 15 key informant interviews with smallholder farmers and indigenous leaders were conducted in four highland provinces: Imbabura, Pichincha, Cotopaxi and Chimborazo.

2.2. Sampling and Data Collection

A sample of 60 smallholder farms were randomly selected from a total of 633 smallholder farms belonging to the local smallholder farmer organization RESSAK (Network for Food Sovereignty and Solidarity Economy of the Kayambi’s territory). These farms are part of approximately 12,000 smallholder farms in the ITKP [40]. The process to select the 60 sample farms was conducted by the main author and three local technicians from the Kayambi People’s Organization who identified and chose the farms based on the following criteria: (1) farm size, up to 10 ha [2]; (2) altitude, between 2500 and 4000 m.a.s.l; and (3) the percentage of farm area covered by trees and/or shrubs. Farms with 10% or more of the area covered by trees and/or shrubs in any spatial arrangement were considered AFS [41], while farms with less than 10% tree and/or shrub cover were considered CAS.
The AFS and CAS samples were located in upper inter-Andean valleys, foothills and along gorges (Figure 1). AFS sites were difficult to locate since they are a much less common than CAS (which includes mainly annual or seasonal croplands and permanent pastures), and they are scattered throughout the territory. Therefore it was not possible to use villages as a unit, because individual villages had very few households with AFS. This land use pattern is common for the whole Ecuadorian high Andes, where AFS have almost disappeared as a consequence of the influence of colonization, which also changed the production systems [42].
To collect the data, 60 household surveys were conducted mostly with individual farmers, but in some cases with farming couples (73% of the farmers surveyed were women, 10% were men and the remaining 17% were couples). Surveys were conducted using semi-structured questionnaires designed to collect primary data about the main biophysical and socioeconomic characteristics of the farming systems (Table A2 in Appendix). The 60 surveys were conducted directly by the lead author of this paper from December 2015 to May 2016. The detailed questionnaires took an average of between three to four hours to conduct, and the data were directly entered into the database (Table A2 in Appendix). Depending on the farmer’s time availability, one or two visits to the farm were sometimes needed to complete the survey. The survey work started with direct observation of the farmland, in a process led by the farmer who was able to explain the main biophysical and socioeconomic characteristics of their farm in person. This was an important step to get the farmer involved in the survey and to improve the interaction between the farmer and the researcher. Many features related to the farmer’s household and livelihoods were also highlighted at this step of the survey. In addition, a set of photographs were taken to document each farmer’s plot.
The main variables considered in the biophysical component were agrobiodiversity, soil fertility and microclimate conditions inside the farm. Agrobiodiversity was divided into two categories, cultivated biodiversity and associated biodiversity, in order to establish the composition and main characteristics of agrobiodiversity within and between the AFS and CAS. Cultivated biodiversity includes all species, cultivars and breeds introduced and managed by the farmer, which play an important role maintaining food security-sovereignty and enhancing cash income generation. Cultivated biodiversity was analysed in detail through 11 subcategories. In complement, the associated biodiversity category considers the wild plant and animal species commonly found and used in the farming system. The analysis of associated biodiversity was essential to establish its importance for the ecological functionality of the farming system and also to determine its contribution to food security (subsistence) and income generation of smallholders. The method used by the farmers to register and estimate the number of animals and plant species was based on a progressive checklist. The checklist was made as follows: in the first interview the farmer was asked about the species used in the different categories of agrobiodiversity. Every species, cultivars and breeds described by the farmer was registered in the questionnaire matrix (Table A2 in Appendix) and it represented the starting checklist. In the subsequent interviews, additions were made to the list when the farmer indicated new species, varieties and breeds.
To establish the soil fertility conditions, the main chemical, physical and biological parameters were measured and evaluated through basic soil laboratory analysis (Table A3 in Appendix). The variables for microclimate conditions inside the farm included temperature, humidity and wind velocity (Table A4 in Appendix). For the analysis of soil fertility and microclimate conditions, a subsample of 16 farms were chosen randomly from the 60 sample farms and included eight AFS and eight CAS. Only 16 farms were chosen as subsamples due to time and budget limitations. The microclimatic conditions were measured using the Davis Vantage Pro2 micro weather station. The weather station was located strategically in the middle of the farm in order to provide an extensive microclimate measurement. Microclimate measurements were automatically logged every 30 min during a seven day period in each farm.
For the socioeconomic component, the main variables considered were livelihoods, income levels, agrobiodiversity usage, land tenure and irrigation sources (Table A2 in 
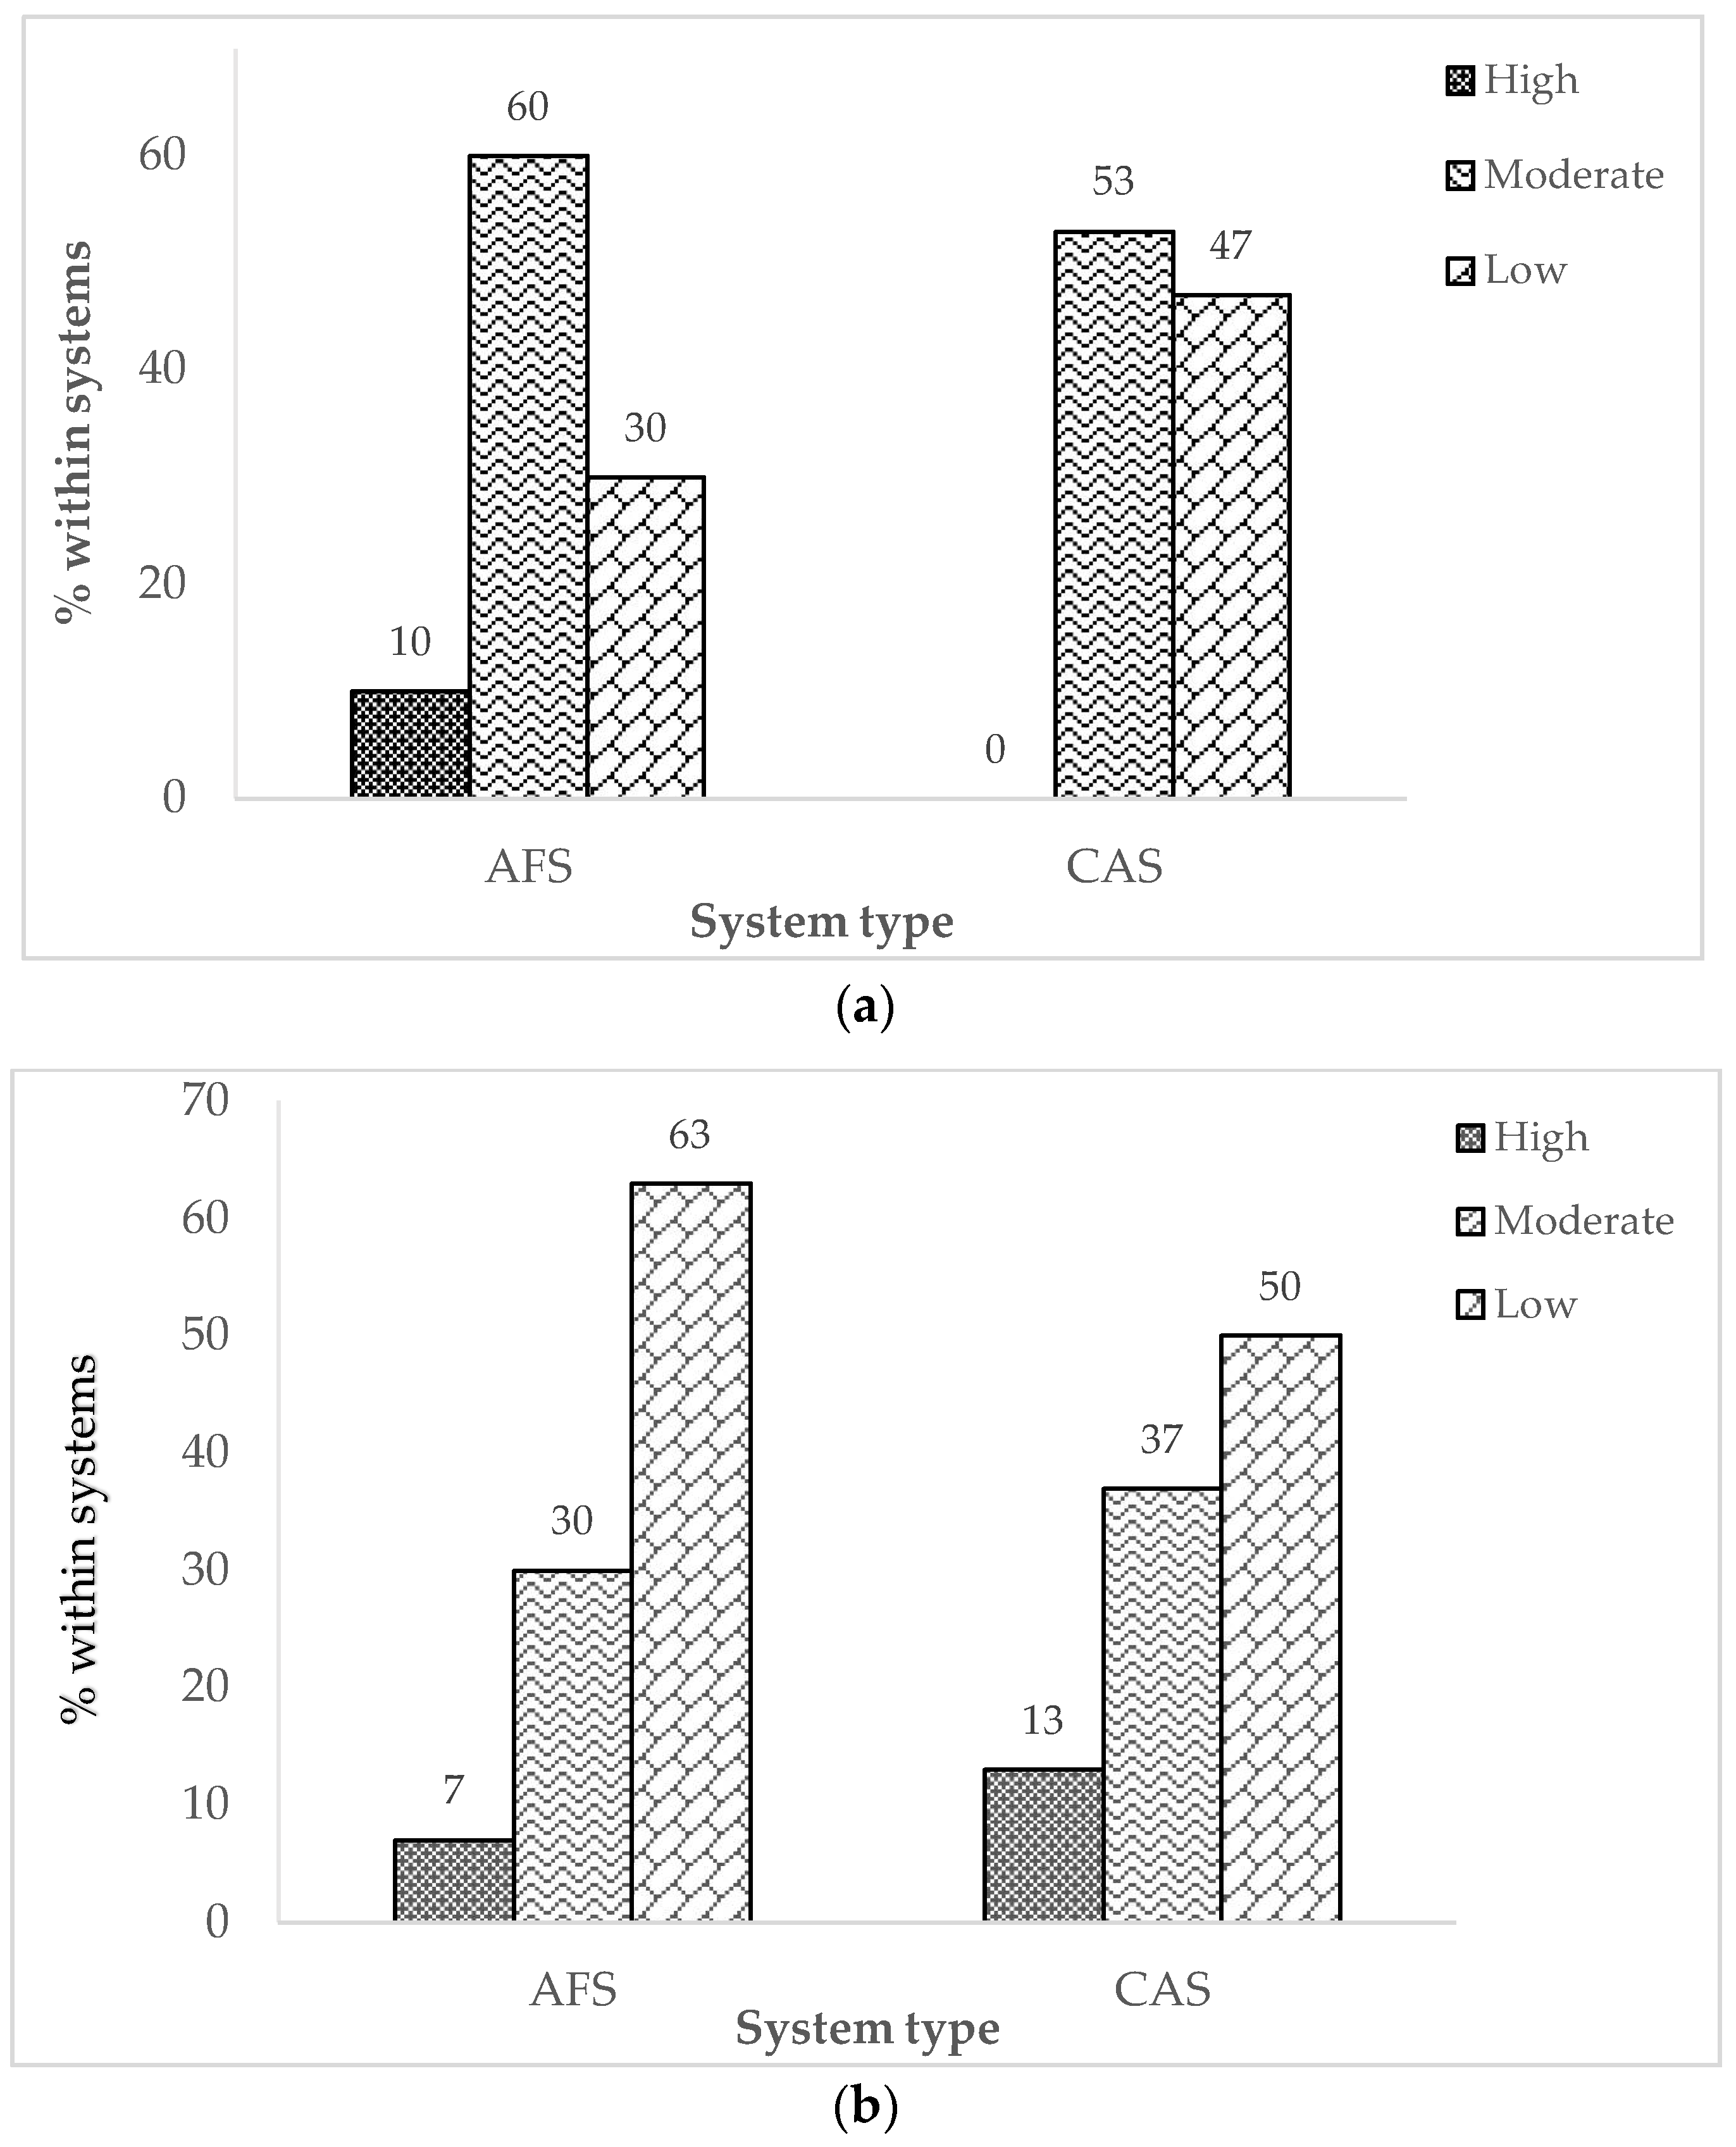
Appendix). To categorise and analyse the livelihoods, farmers were asked to describe their main livelihood activities and prioritise them, starting from the activity which generated the highest cash income. The prioritised livelihood activities represented the key data for the identification of the main livelihood categories. Complementary to the livelihood activities analysis, farmers were asked about the contribution of on-farm and off-farm income activities to the household economy. On-farm income activities are related mostly to the commercialisation of farm products and dairy farming, while off-farm income activities are linked to wages obtained from off-farm work, usually related to the construction and fresh cut-flower industries. Based on the basic salary (BS) for Ecuador (1 BS = 375 USD in 2016–2017), incomes were classified according to three levels (high, moderate and low). High income represented more than 1 BS per month, while moderate income was 1 BS, and low income indicates less than 1 BS.
For the analysis on how agrobiodiversity contributes to maintain and enhance the smallholder farmers’ livelihoods and household economies, the species of cultivated and associated biodiversity were classified in two main use categories: commercial and subsistence-functional species. A species was considered commercial when the species, or a derived product, was used mainly in the provision of cash income rather than providing basic household needs (usually food, medicine or fodder). On the other hand, subsistence or functional species were species used by farmers mostly to fulfil basic needs, or species that constitute an intrinsic part of the farming system and support its functionality (usually as pollinators and predator-pest control species). To estimate the ratio of commercial and subsistence-functional species, the farmer was asked about the amount of the production of the species (in %) used for subsistence (family consumption) or commercial purposes. To define if the species belongs to the subsistence, commercial or both categories, the major proportion was considered, i.e., (a) in the ratio 95/05 (95% of the production used for subsistence purposes and 05% for commercial) the species was defined and counted as subsistence species (as in the case of banana passion fruit in Table A2 in Appendix); (b) in the ratio 05/95, the species was counted as commercial (avocado case in Table A2 in Appendix); (c) in the case of ratio 50/50, the species was counted equals as subsistence and commercial. To calculate how many subsistence or commercial species are used by the farmer, the species was assigned a value = 1 in the cases a and b. In the case c, the species was assigned a value = 0.5 for counting as subsistence species and 0.5 for commercial. This logic was applied in order to conduct the significance test.
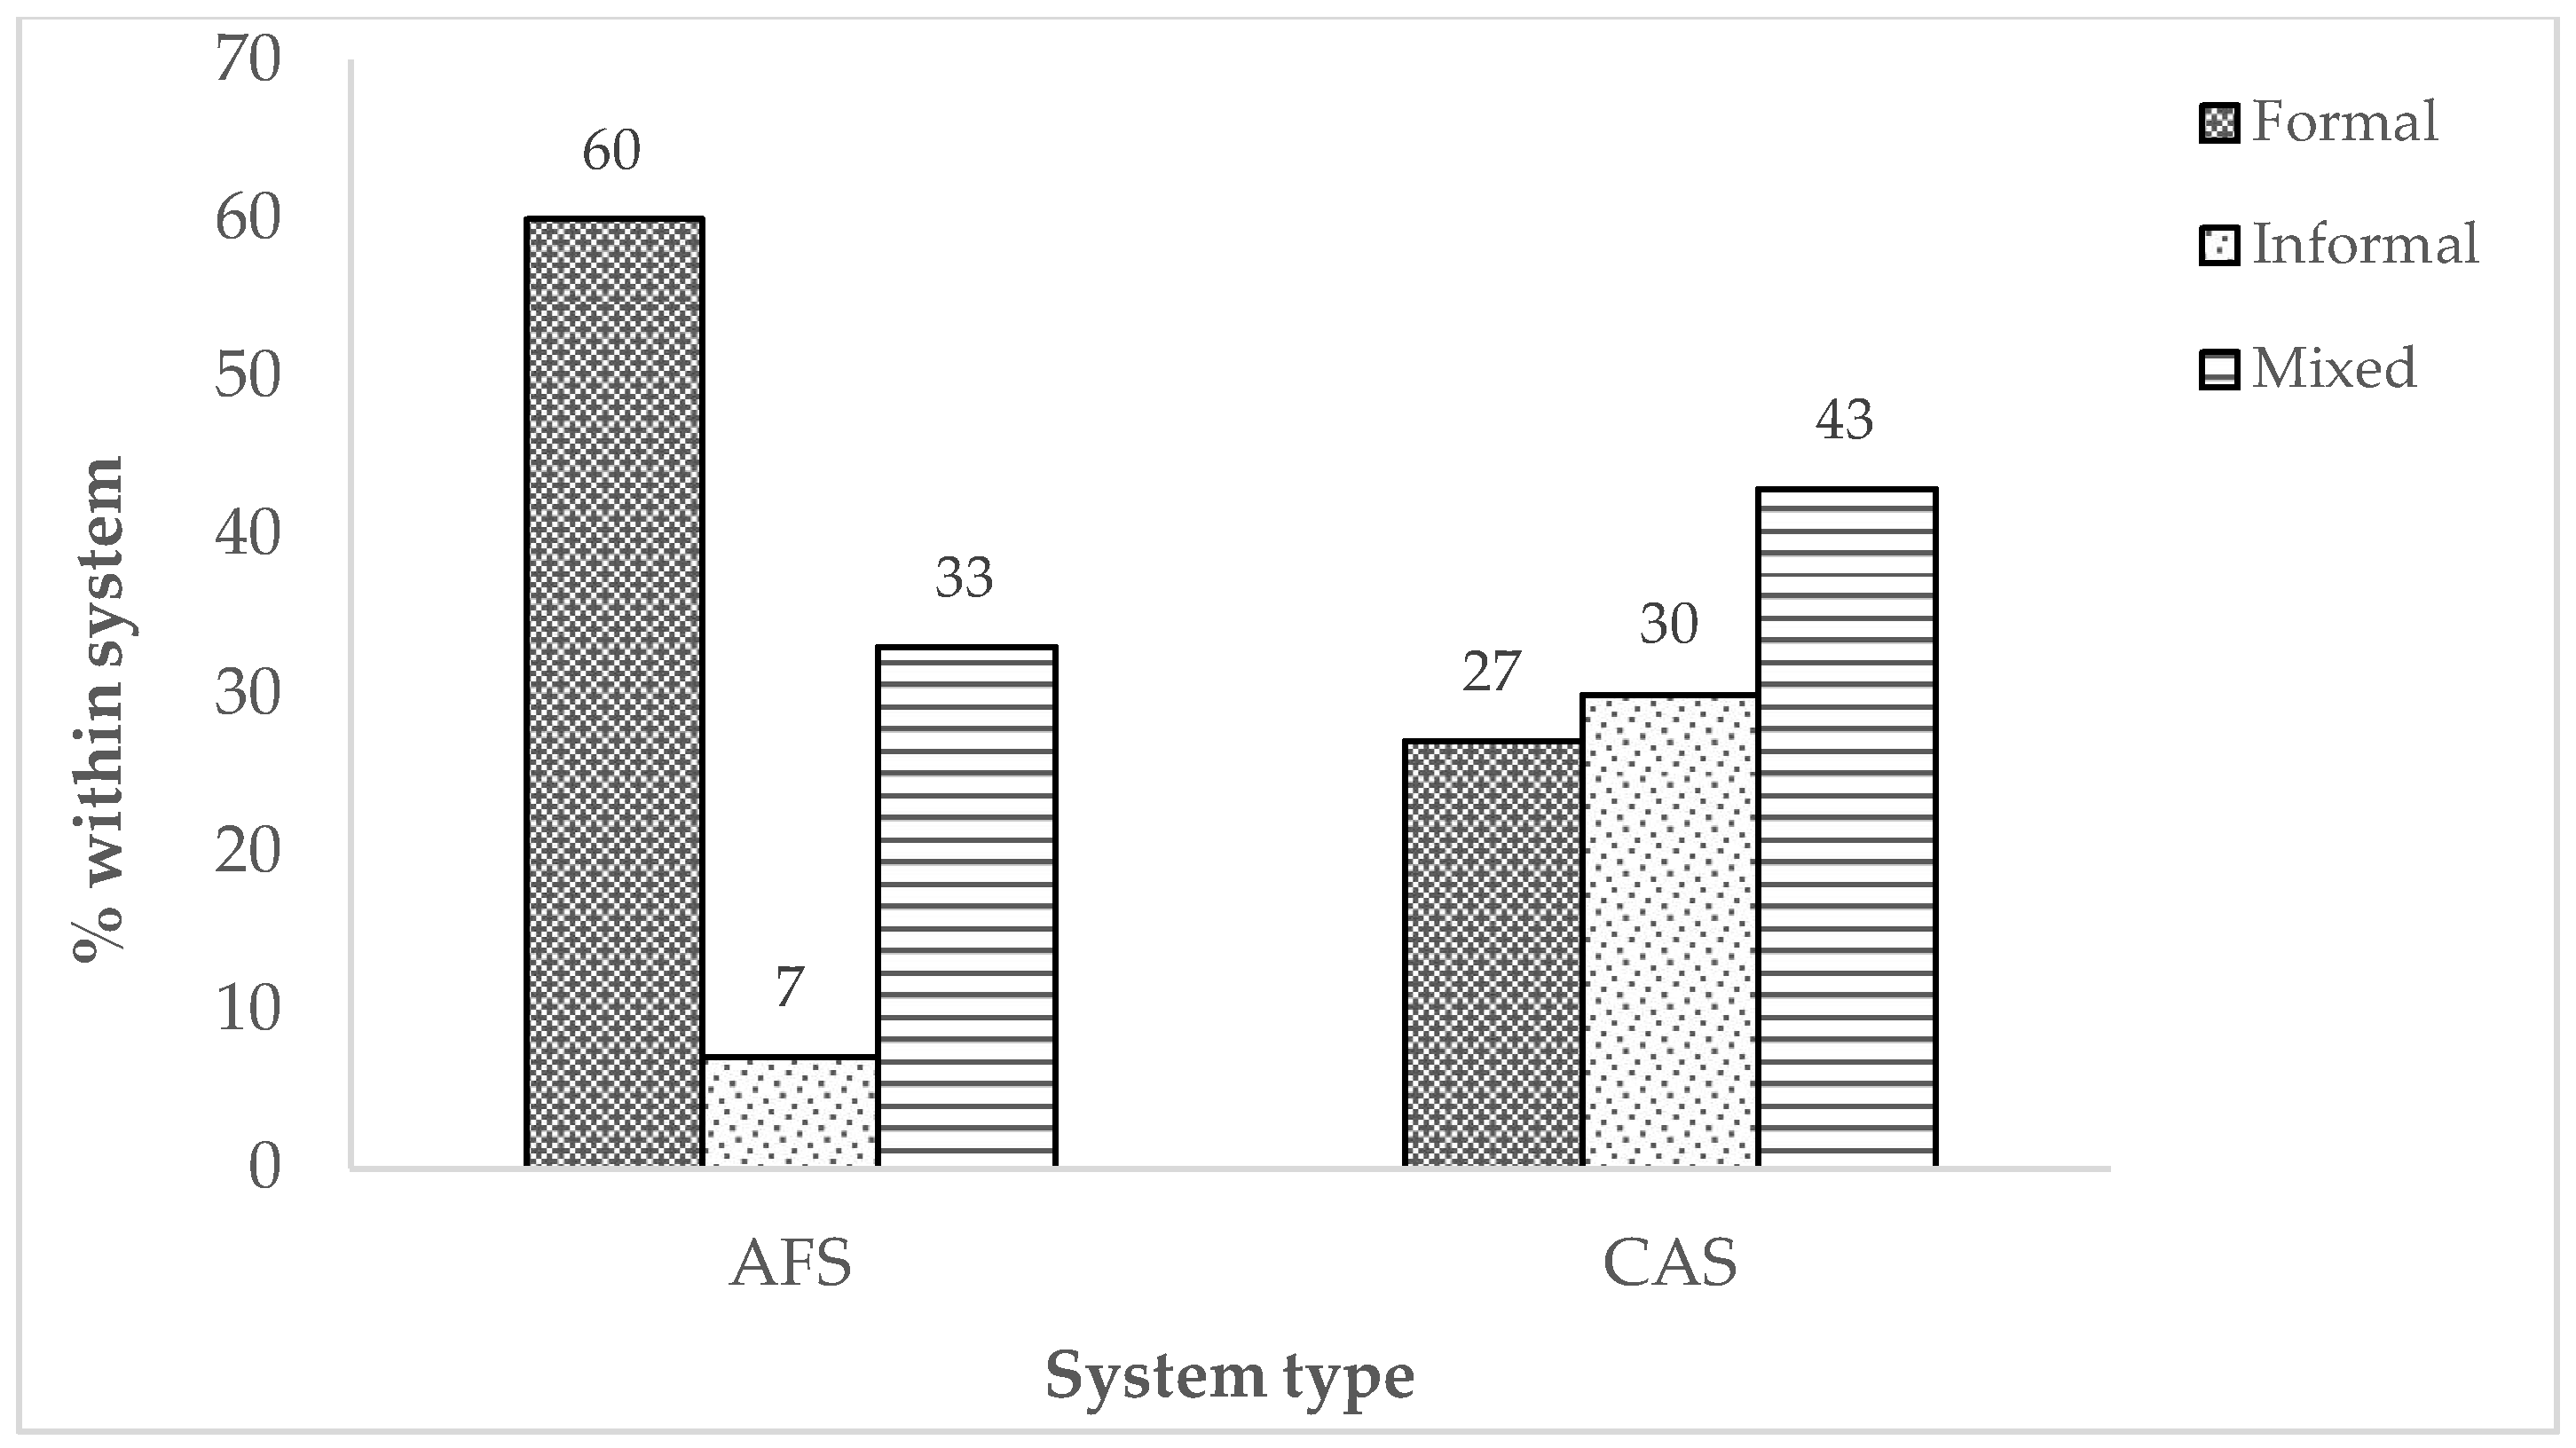
To analyse the land tenure between farming systems, three basic land ownership categories were included, formal, informal and mixed. Formal ownership means that the property rights of the land are officially recognized and protected by the state. In the informal ownership category the property rights are not fully recognized and protected by the state but the access and control of the land are recognized by the community and customary laws. Mixed ownership category includes farmers with some of their farmland as formal and informal.
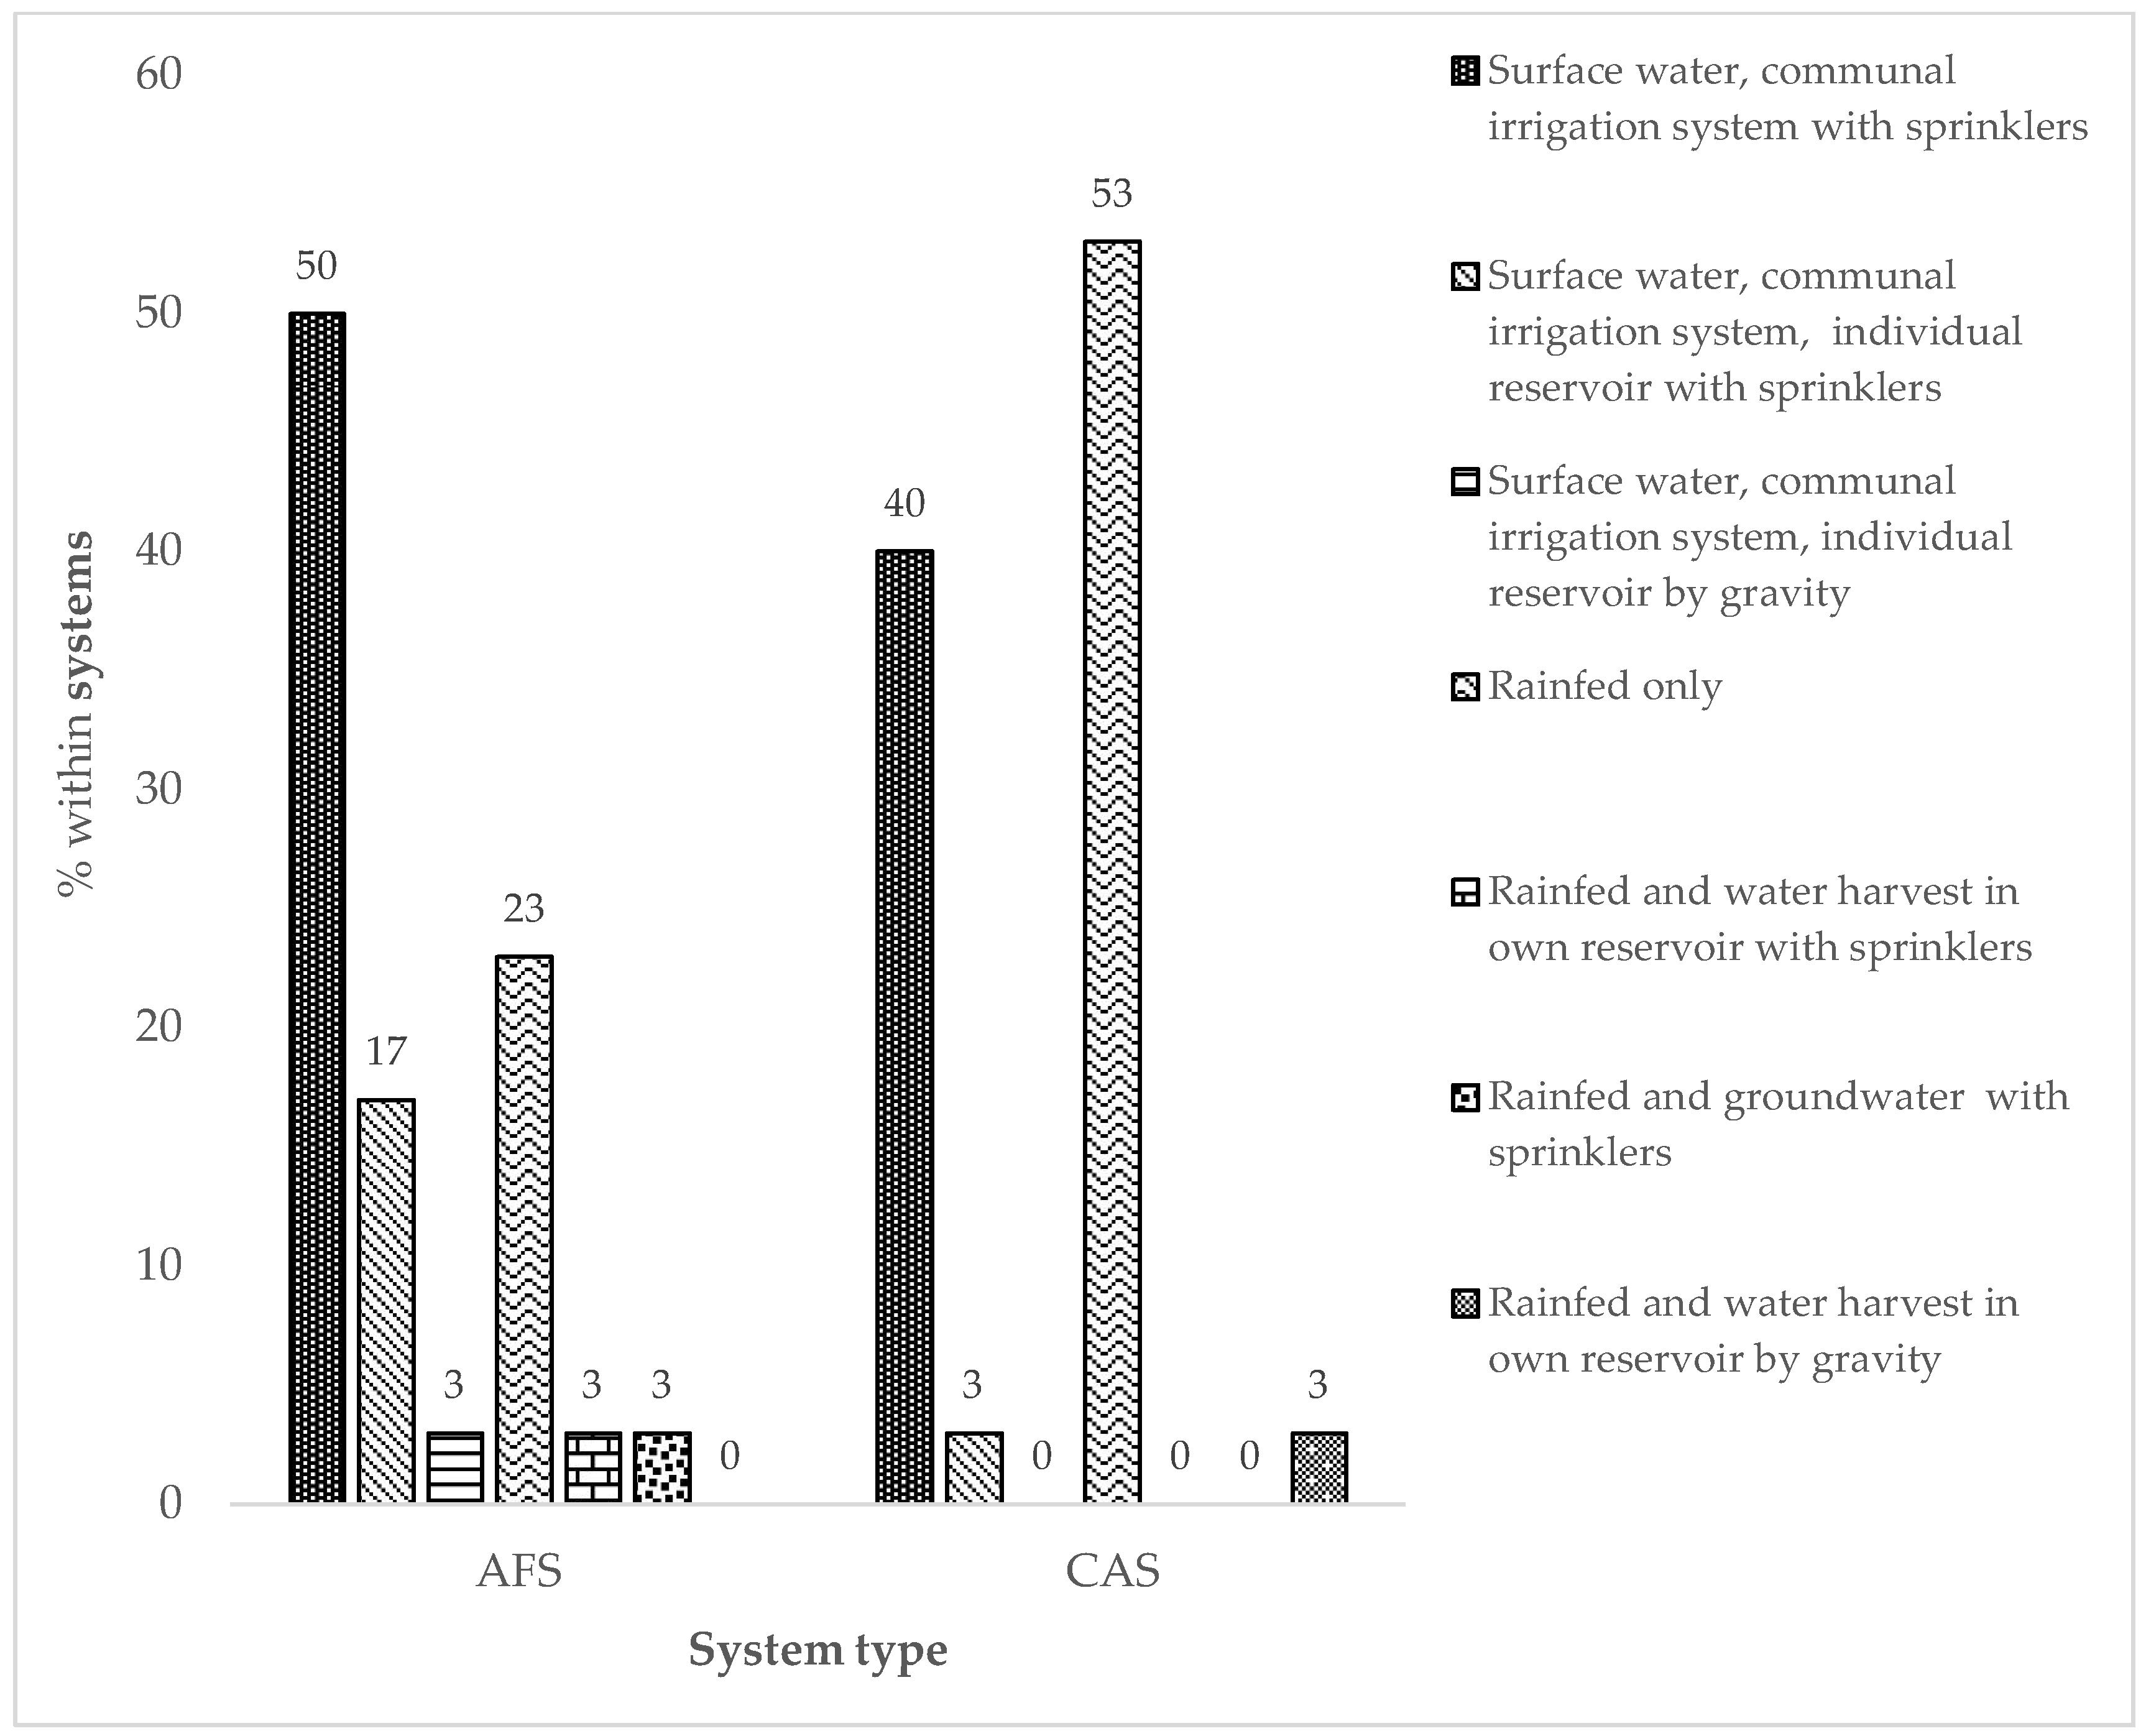
Finally, to categorise the main irrigation sources, the interview included information related to dependency on rainfall (i.e., rain-fed agriculture), types of irrigation systems, and the methods for water harvesting and storage used by the farmer.

2.3. Data Analysis

A comparative analysis approach was applied to analyse the characteristics of the two farming system types. Descriptive statistics (Crosstabs) were used for qualitative variables (livelihood types, land tenure, irrigation sources, income types and levels); and inferential statistical test (Independent-Samples t Test) for quantitative variables (agrobiodiversity and usage; soil fertility parameters and microclimate conditions inside the farms). To analyse the sustainability of the farming systems, key qualitative and quantitative variables were chosen within the biophysical and socioeconomic components of the farming systems. The bulk of the data collected by interviews were based on smallholder farmers’ perceptions and observations, except the microclimate and soil data (which was biophysical). The perceptions were related to the main characteristics that maintain and enhance the sustainability of the farming systems.

3. Results

3.1. Biophysical Characteristics within and between Farming Systems

3.1.1. Agrobiodiversity

The results of agrobiodiversity differences between farming systems indicate that there is a statistically significant difference (p < 0.001) between AFS and CAS (Table 1). Total agrobiodiversity, formed by the cultivated and associated biodiversity, is 20% greater in AFS than in CAS. This significant difference, represented by 58 extra species reported in AFS, revels that AFS are more complex and biodiverse systems than CAS (Figure 3a and Table 1).
There was also a statistically significant difference in the number of species between agrobiodiversity categories (in the same system) and between farming systems (p < 0.001 for cultivated biodiversity and p < 0.05 for associated biodiversity) (Table 1). AFS have both higher cultivated biodiversity and associated biodiversity than CAS (30% and 8% higher respectively; Figure 3a and Table 1).
A deeper analysis within agrobiodiversity subcategories shows other important differences between AFS and CAS. In relation to cultivated biodiversity, all AFS subcategories have significantly higher biodiversity than CAS (p < 0.05) (Table 1), with the exception of livestock, which has no significant difference (p > 0.05). The subcategory with the greatest difference in biodiversity between farming systems is ‘Trees and shrubs’ (44% more) followed by medicinal, aromatic and condiment plants (44%); other species (39%) and vegetables (31%).
In order to determine how genetically diverse the cultivated biodiversity subcategories are between the two farming systems, the observed number of cultivars and breeds were also analysed. The results indicate a statistically significant difference in the number of cultivars and breeds between farming systems (p < 0.001), with AFS having 31% greater biodiversity than CAS (Figure 3b and Table 1). The most important differences occur in medicinal, aromatic and condiment plants (45% more); trees and shrubs (45%); vegetables (34%) and non-tree and shrubs fruits (26%) (Figure 3b and Table 1). There were no significant differences between farming systems in the number of livestock breeds (Table 1).
In the case of associated biodiversity, the wild animals and plants subcategories also presented a statistically significant difference (p < 0.05 and p < 0.001 respectively) (Table 1). AFS had a greater number of species of wild animals (6%) and plants (15%) than CAS (Table 1). Detailed analysis within the wild animals’ subcategory indicates that AFS has a statistically significant higher number species of birds (8%), amphibians (14%) and mammals (8%) than CAS (p < 0.05) (Table 1). Although AFS had more species of reptiles (6%) and invertebrates (5%) than CAS, there was no statistically significant differences (Table 1).

3.1.2. Soil Fertility

Soil fertility conditions of AFS were found to be similar to the conditions of CAS, with no statistically significant differences in the results of the subsample of soil fertility parameters (Table A3 in Appendix). Only phosphorous shows a statistically significant difference between farming systems (p < 0.05), indicating that CAS soil has lower levels of phosphorous than AFS, although the levels remained optimal. Considering that phosphorous is one of the three most important macronutrients in soil (nitrogen and potassium being the other two), the lower phosphorous levels shown in CAS (23 ppm) could negatively affect the metabolism of the plants, vegetative growth, root system development, fruit and seed quality, and consequently reduce the potential yields of CAS [43,44]. The soil texture for both AFS and CAS were classified as being the same, sandy loams. Sandy loam soils are considered suitable for most crops, trees and pastures, performing at optimal levels under frequent irrigation and low soil surface pressure to avoid compaction practices [45,46,47,48]. The low bulk density values for AFS and CAS (Table A3 in Appendix), indicate the absence of soil compaction problems and denote optimal conditions of these sandy loam soils to promote favourable development of crops, trees and pastures [48,49]. Field capacity measurements also denote an appropriate capacity of AFS and CAS soils to retain water and indicate that the total available water content percent (the portion of water available for plants as a result of the difference between field capacity and wilting point), is also favourable for normal development of crops, pastures and trees. Usually the total available water content for sandy loam soils could reach 20% (20 g of water/100 g of soil), presenting some limited access to the available soil water, especially for shallow rooted crops [50,51]. It is important to note that the non-significant differences among most soil parameters were probably due to the small subsample size.

3.1.3. Microclimate Conditions inside Subsampled Farms

The results of the microclimate analyses (Table A4 in Appendix) show that there were no statistically significant differences between AFS and CAS. Considering that variation of microclimate conditions in mountain farming systems, especially temperature and humidity, could promote or restrict the viability of many crops [52,53,54], it is important to take even small microclimatic differences into account in order to establish which farming system has the most suitable conditions to support agrobiodiversity and smallholder farmers’ livelihoods. Results for temperature and wind velocity inside farm indicate more favourable conditions for AFS (Table A4 in Appendix). Warmer conditions and less influence of wind in the microclimate of AFS, probably due to the greater presence and influence of trees and shrubs, are important aspects to be taken in account in highland farming systems where cold, quick temperature fluctuations, and frost could affect agrobiodiversity, especially the viability of some species and cultivars of crops, pastures and animals.

3.2. Main Socioeconomic Characteristics within and between Farming Systems

To analyse the socioeconomic dimension of the studied farming systems, the questionnaire (Table A2) included data related to smallholder farmer’s livelihoods, income level, main uses of agrobiodiversity, and the main assets to support sustainable livelihoods such as their land tenure situation and irrigation sources.

3.2.1. Livelihoods

Figure 4 below shows how the smallholder farmers have classified and prioritised their livelihoods depending on their relevance in terms of which activities generate more cash income for the household economy. The description and prioritisation of the main livelihood activities enabled the identification of seven livelihood categories. Each category contains the main two or three productive activities supporting the cash income and subsistence of the household. The results of Figure 4 denote interesting differences among the livelihoods of smallholder farmers between the two farming systems. Agroforestry farmers show more complex and diversified livelihoods than conventional farmers. Agroforestry households are included in all seven livelihood categories identified in the study, while conventional households are only included in five categories. The cash income activities of agroforestry farmers’ livelihoods rely mostly on the commercialisation of farm products (40%), while only 17% of the conventional farmers’ livelihoods depend on the same activity. On the other hand, most conventional farmers’ livelihoods (37%) rely mainly on dairy farming in contrast to a marginal 3% of agroforestry farmers who depend on this activity.
Dairy farming, complemented with commercialisation of farm products, is also an important economic activity for agroforestry farmers, representing 20% of their livelihood activities, while only 7% of conventional farmers’ livelihoods depend on this combination of activities. Figure 4 also highlights the high dependency of conventional farmers’ livelihoods on off-farm work (33%), while only 17% of the agroforestry farmers’ livelihoods rely exclusively on off-farm work activities. The complexity and diversification of agroforestry livelihoods are denoted also in off-farm work complemented with other productive activities such as dairy farming, farm products’ commercialisation and subsistence farming. In that sense, the results indicate that 20% of agroforestry farmers’ livelihoods rely on these activities, while only 7% of conventional farmers’ livelihoods show a similar dependence. It is also important to note that subsistence farming was identified in all livelihoods categories, stressing the importance of this activity in the maintenance of smallholder farmers’ livelihoods for both farming system types.

3.2.2. Income Levels

The results of Figure 5a,b, shows the farmers’ estimations on the contribution of on-farm and off-farm activities to their livelihoods and household economies.
These results stress the importance of on-farm income for agroforestry farmers and off-farm income for conventional farmers. Figure 5a indicates that most of agroforestry farmers (70%) estimated that their on-farm incomes were distributed between high and moderate levels (10% and 60% respectively). In contrast, all the conventional farmers qualified their on-farm income only as moderate and low level incomes (53% and 47% respectively).
In the case of the income obtained from off-farm activities, only 7% and 30% of agroforestry farmers consider these incomes as high and moderate, respectively. Most agroforestry farmers (63%) consider the income earned from off-farm work as being low- income levels (Figure 5b). On the other hand, 13% of conventional farmers estimate their off-farm income levels as being high and 37% moderate, while the other 50% perceive these earnings as being low income levels. Consequently, the on-farm income levels reported by agroforestry farmers are greater than the on-farm and off-farm income levels reported by conventional farmers.

3.2.3. Main Agrobiodiversity Uses

Considering that agrobiodiversity could play an important role supporting farming systems’ functionality, food sovereignty and security, and livelihoods of smallholder farmers, the interviews included a section to record the main uses of agrobiodiversity (Table A2).
In the case of associated biodiversity usage, Table 2 shows that agroforestry farmers use 9% more species for subsistence farming and farming system functionality than conventional farmers (p < 0.05). In addition to the usage of associated biodiversity species, commercialisation of wild animals and plants does not represent an important income generation activity for smallholders’ livelihoods in either of the studied farming systems, with no statistically significant difference (Table 2).
The results of Table 2 indicate that the role of agrobiodiversity in enhancing the livelihoods of smallholder farmers is more relevant for agroforesters than conventional farmers, i.e., through the maintenance of household economies and the main subsistence needs (food, medicine and fodder), and at the same time supporting the ecological functionality of the farming systems.

3.2.4. Land Tenure and Irrigation Sources

An analysis of land tenure, water availability, and irrigation sources was included in this study because farmland and water are considered the main assets of production, and at the same time the access and control of these resources constitute common limiting factors affecting the livelihoods of smallholder farmers [14,15].
Although all the farmers included in this study sample have access to private farmland (an average of 3 ha), the land tenure situation between farming systems reveals some interesting differences. Figure 6 shows the land tenure status of smallholder farmers and indicates more favourable conditions for agroforestry farmers than for conventional farmers. Most agroforesters (60%) are formal owners (when farmland is formally recognised by the state), while only 27% of conventional farmers have the same ownership status. On the other hand, 30% of conventional farmers are informal owners (when farmland is not formally recognised by the state but it is recognized by the community through customary rights) compared to only 7% of agroforesters in the same category. Mixed land ownership (when some part of the farmland is formally recognised by the state and another part recognised only by the community) is also higher in CAS (43%) than in AFS (33%).
In the case of water availability and irrigation sources, Figure 7 describes the seven irrigation categories found in the study and their distribution between farming systems. Results indicate more diversified irrigation sources for agroforesters (six categories) than conventional farmers (four categories). Agroforestry farmers are less dependent on rain-fed methods (29%) than conventional farmers (56%). Most agroforesters have greater access to surface water as part of a communal irrigation system with sprinklers (50%) than conventional farmers (40%). From the point of view of water-use efficiency and adaptability to climate change and variability, the farmers with access to surface water through communal irrigation systems—which use sprinklers and reservoirs—certainly are the best prepared farmers to deal with these issues. A higher percentage of agroforesters are included in this category (17%) compared to conventional farmers (3%).

4. Discussion

The results of this paper provide important evidence to inform understanding of how the basic biophysical and socioeconomic features of two farming system types (AFS and CAS) could contribute to support sustainable livelihoods of smallholder farmers.
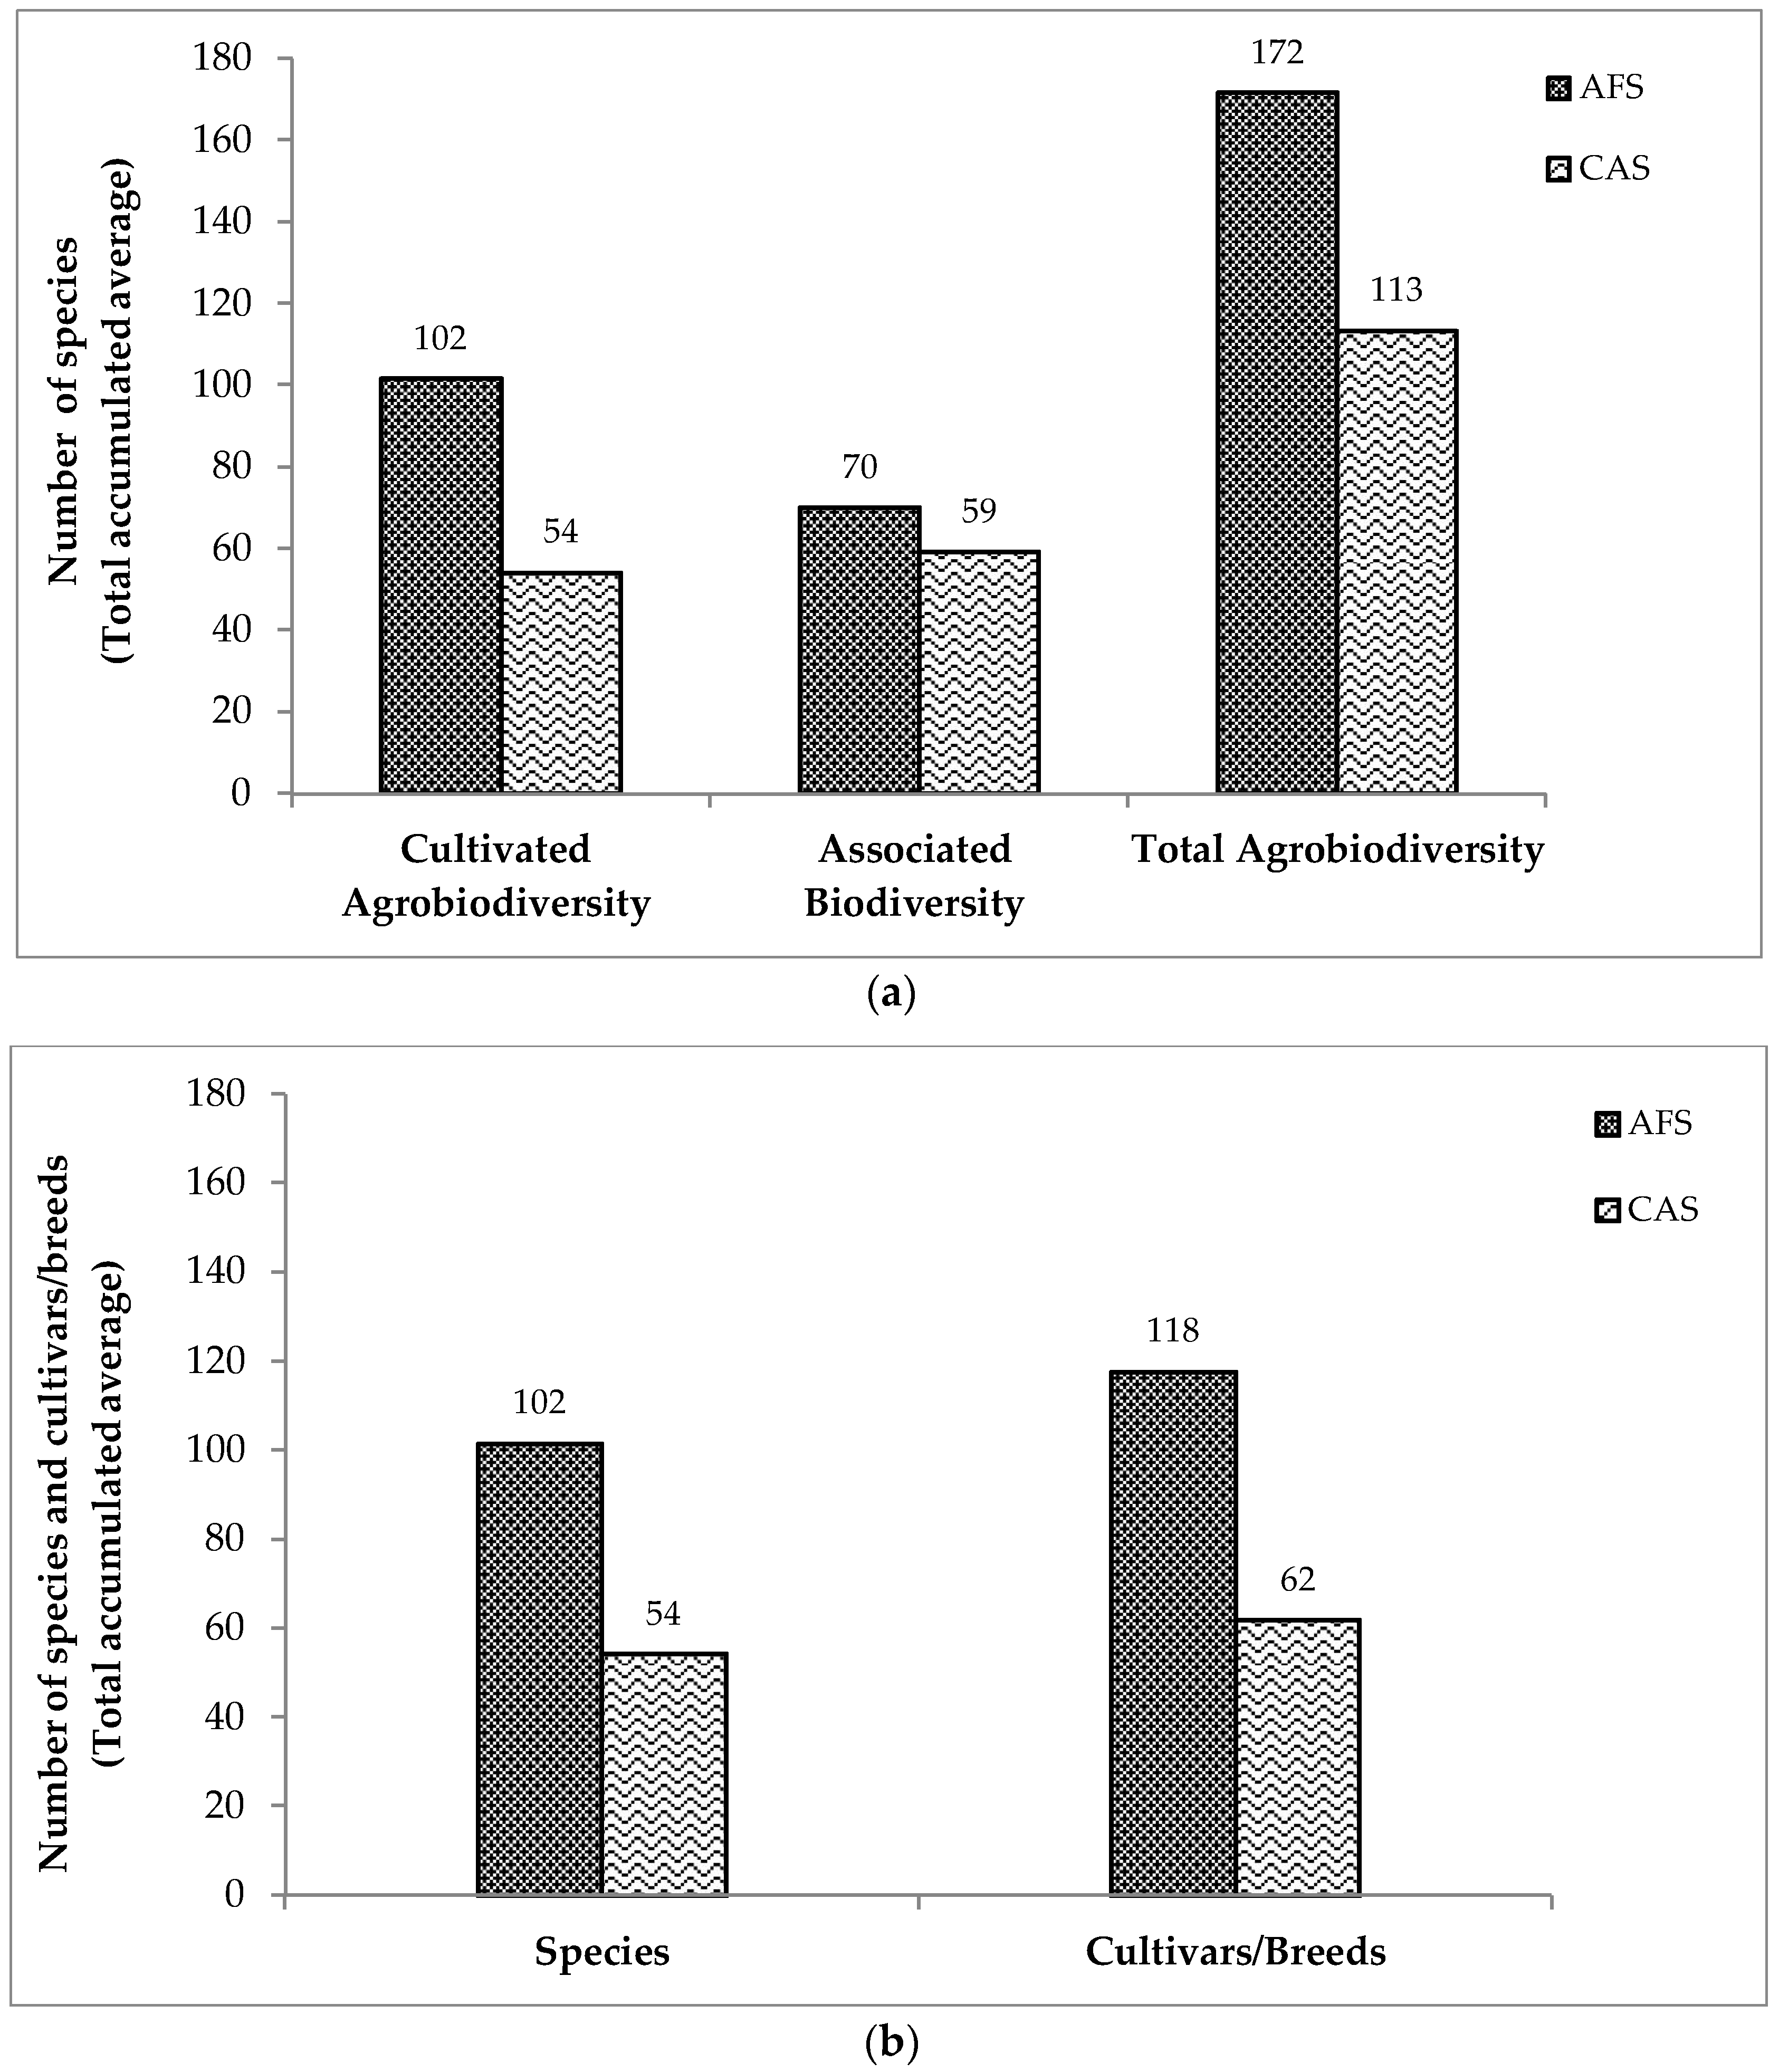
Among the biophysical features included in this study, the higher levels of agrobiodiversity estimated for AFS represent one of the most interesting—although unsurprising—findings. In reviewing the literature, many papers have stressed the intrinsic value of agrobiodiversity to sustain rural livelihoods and maintain important farming system services. According to the literature, agrobiodiversity plays a key role in providing better food access; improved diets; reduced malnutrition (a major problem in the study area); and to support more sustainable food systems [55,56,57,58]. Complementing this, the greater levels of agrobiodiversity in a system contributes to enhanced delivery of some important regulatory and provisioning ecosystem services such as pest and disease control, pollination, microclimate control, yield stability and efficiency, primary production, provision of habit, and nutrient and water cycling. Considering these benefits, the results of this study support the increasing body of evidence that agrobiodiversity provides better environmental and socioeconomic opportunities to sustain livelihoods of smallholder farmers, especially in the context of global change [59,60]. Therefore the higher levels of agrobiodiversity found in AFS represent an important farming system asset to support the natural capital (natural resource base) [61,62] of agroforesters’ livelihoods. In addition, the benefits of greater agrobiodiversity levels of AFS are also related to the greater use of subsistence-functional and commercial species, especially in the case of cultivated biodiversity shown by agroforesters (Table 2). Greater availability and usage of subsistence-functional species support agroforesters’ livelihoods with better opportunities to sustain food security-sovereignty and farming system services (natural capital). Complementing this, the greater use of commercial species by agroforesters (Table 2) diversifies their economic incomes and provides better support to the financial-economic capital.
Despite the lack of similar studies conducted in the highland region of Ecuador, the agrobiodiversity results of this study are aligned with results of other studies on smallholder farmers carried out in the region. The estimated levels of cultivated agrobiodiversity presented in this study follow a similar tendency found by Oyarzun et al. [23] in the Central Highlands of Ecuador. These authors reported highly cultivated agrobiodiversity levels in smallholdings, showing a positive relationship between the number of on-farm cultivated species and the number of species and products destined for home consumption. The study indicates that smallholdings with high agrobiodiversity levels tend to consume more on-farm food items than the households living in low agrobiodiversity farms. The results of the main agrobiodiversity usages also coincides with well-established assumptions of other studies [63,64] which indicate that smallholder farmers in the Andes of Ecuador dedicate most of their production to subsistence needs.
Although the greater availability and usage of subsistence-functional species found in AFS do not directly indicate their specific contribution to support sustainable livelihoods and farming systems´ functioning, these findings highlight the potential of these species to be developed as ‘Agroforestry Tree Products (AFTP)’ [58] for sustainable and multifunctional farming systems (especially in the case of indigenous and exotic trees and shrubs). AFTP are new and highly nutritious crops (originated from the domestication of useful trees), which could enhance the production and the socioeconomic and environmental sustainability of smallholder farming systems [58]. Such an approach could be relevant for the study area and Andean Highlands.
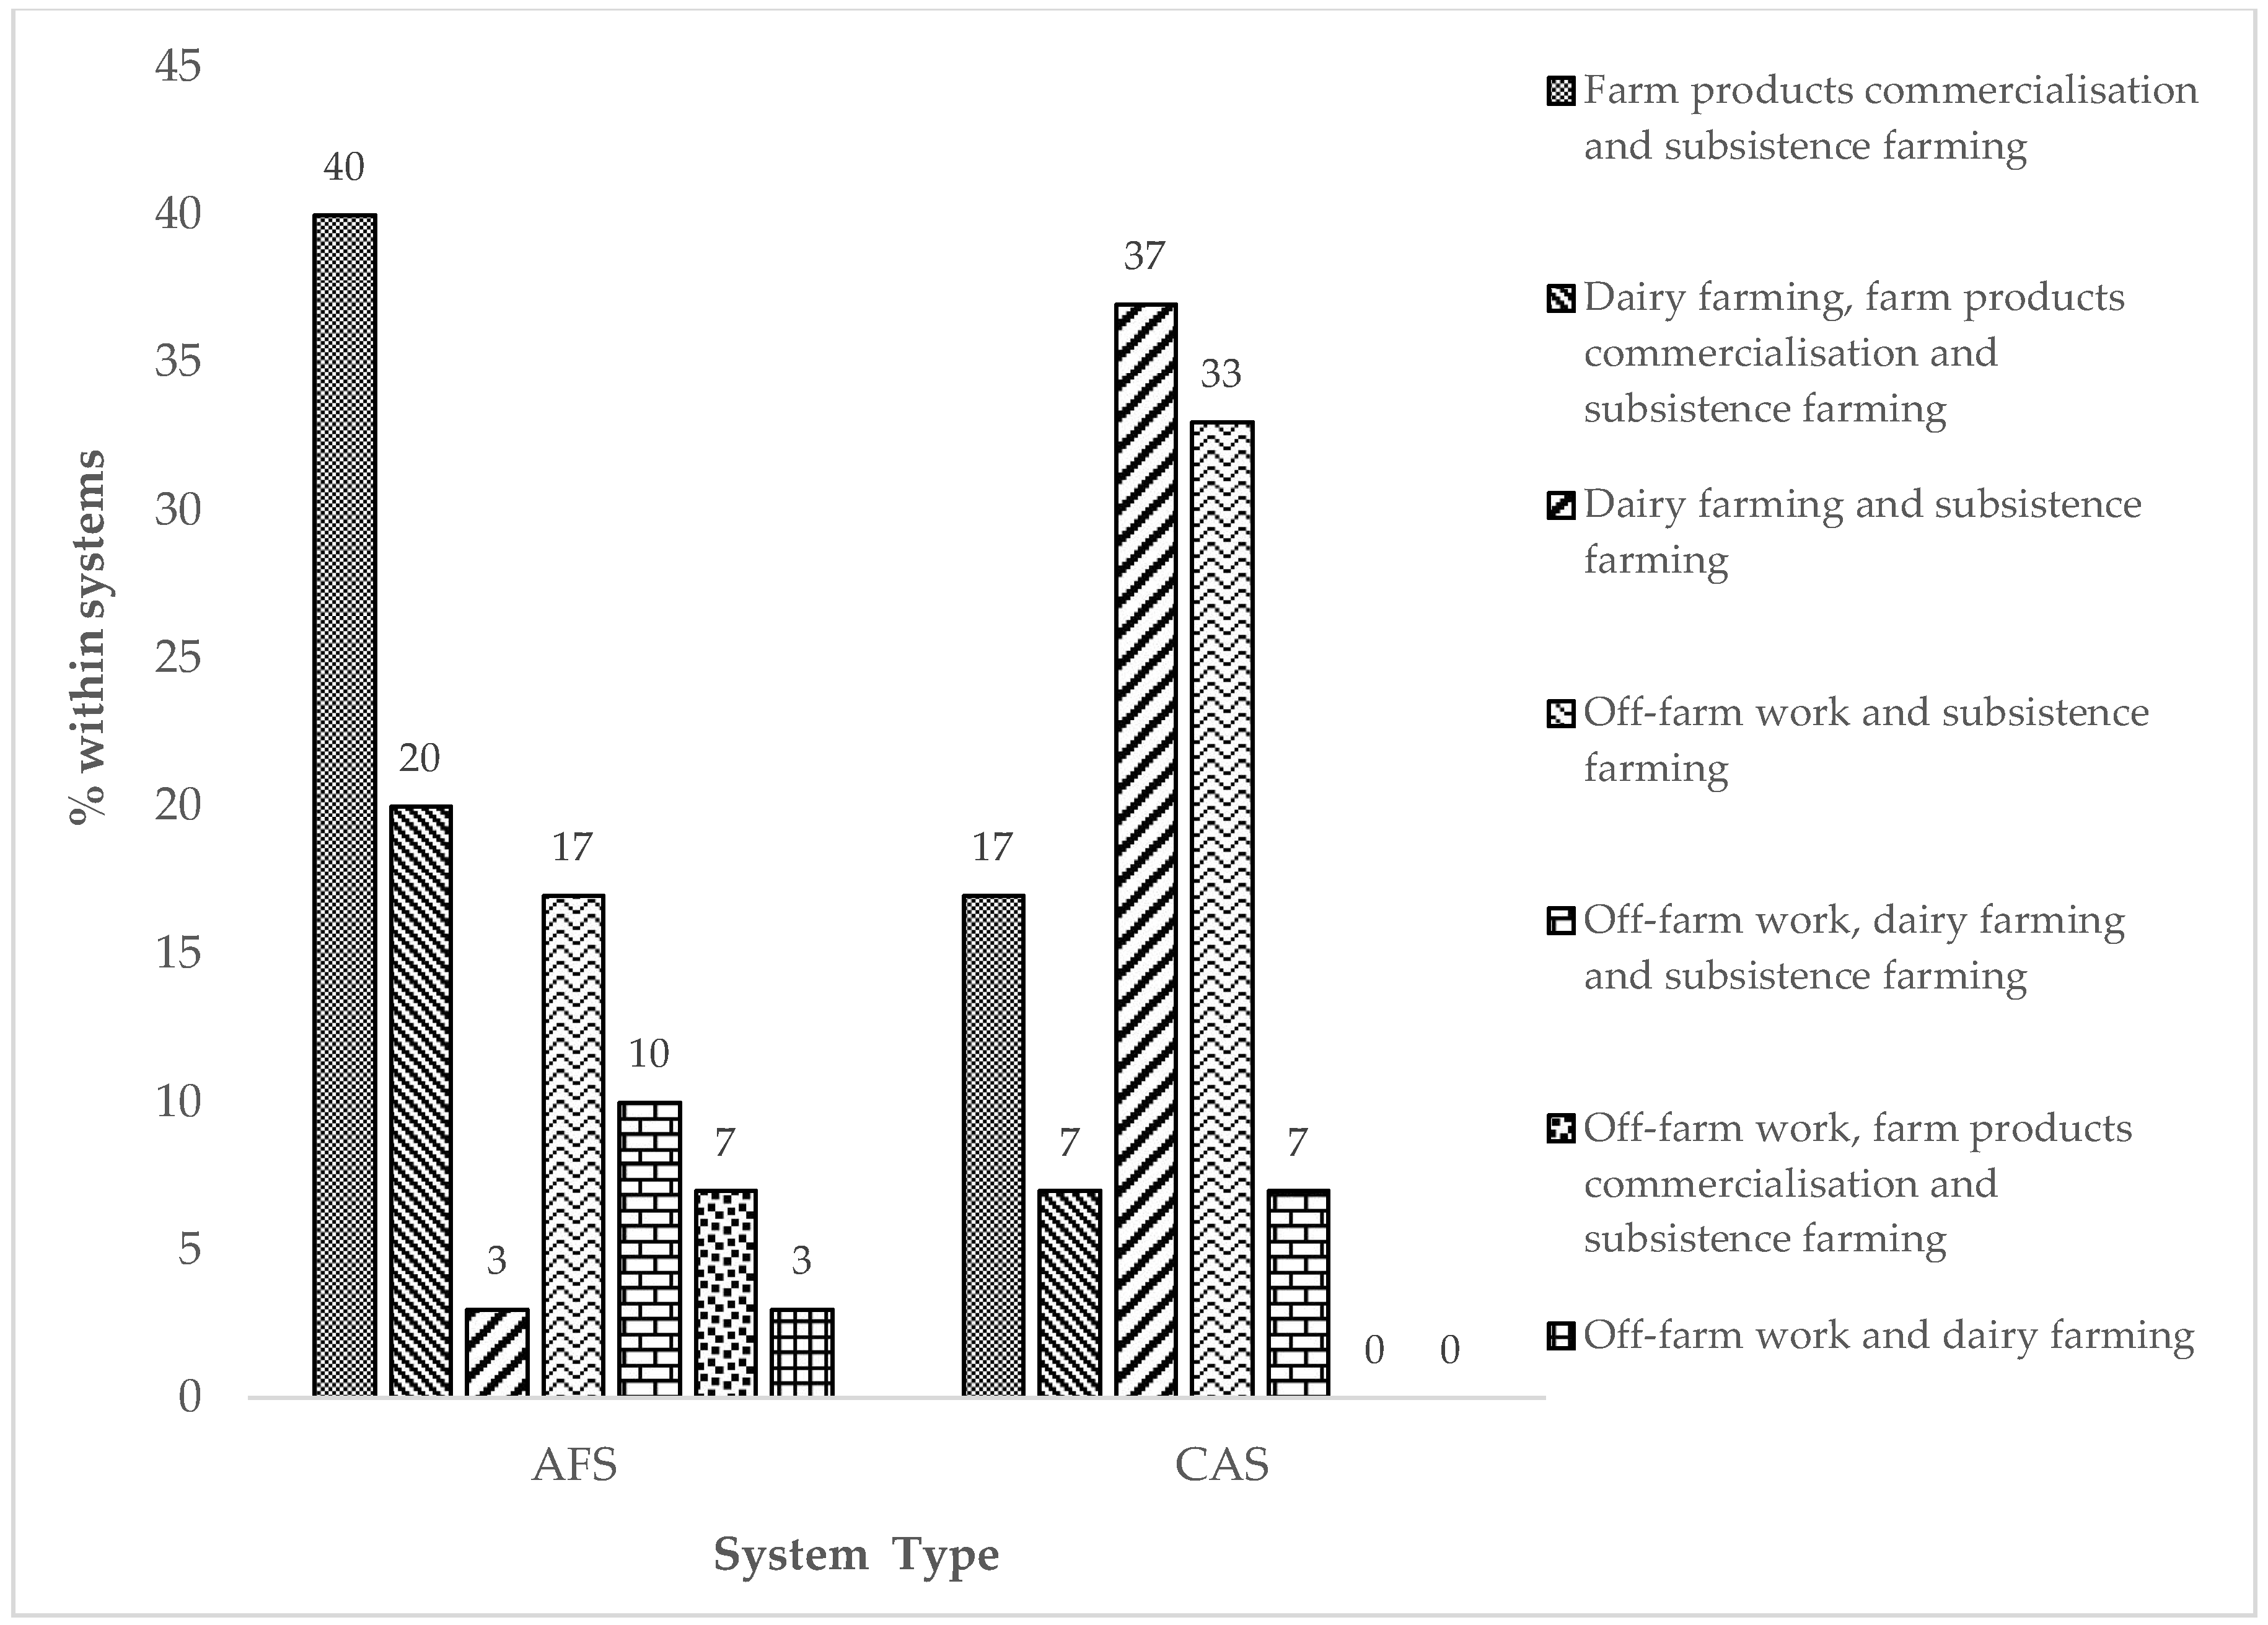
For the socioeconomic features considered in this study (such as livelihood composition, income levels, agrobiodiversity usages, land tenure and irrigation sources), the findings show a greater potential for agroforesters to support sustainability than conventional farmers. The composition of livelihoods prioritised by smallholder farmers based on the activities which generate the main cash incomes denote the livelihood portfolios used by farmers to improve their incomes and reduce socioeconomic and environmental risks. Although the livelihood portfolios of agroforesters and conventional farmers are quite similar, there are remarkable differences among on- and off-farm activities, which could provide interesting inputs for sustainability analysis. The more diverse agroforesters’ livelihoods portfolios represent an important advantage to reduce socioeconomic and environmental vulnerability and risk (such as market fluctuations, disease, natural hazards and climate extremes) especially in the context of global change. In addition, although the levels of dependence on off-farm activities between the livelihoods of agroforesters and conventional farmers are similar, the off-farm portfolios of agroforesters include complementary on-farm activities mainly oriented to improve their cash incomes and support food security. For example: off-farm work + dairy farming; or off-farm work + farm product commercialization + subisistence farming; or off-farm work + dairy farming + subsistence farming (Figure 4). By contrast, the on-farm activities included in off-farm portfolios of conventional farmers are mostly focused on staple food supply through subsistence farming (Figure 4). Therefore, the off-farm portfolio composition of agroforesters in this study could be seen as an advantage to enhance sustainable livelihoods since these activities could give extra support to their financial capital component. In general, off-farm portfolios of smallholder farmers are characterised by activities that promote extra cash income [65,66]. These are often based on temporary or permanent migration to work as hired labour, which is one of the most common strategies for livelihood diversification [60,61,65,66]. In this context, the off-farm portfolios of smallholder farmers in this study are also characterised by temporary or permanent migration whereby typically the male household head migrates to other areas to be employed as a low cost worker in the building sector (especially in urban areas) or in the expanding fresh-cut flower industry [67,68,69,70,71]. This explains why most of the household heads interviewed in this study were women.
The less dependence of agroforesters’ livelihoods on off-farm activities and off-farm income differs from the findings of other studies which estimate that the majority of smallholdings in Ecuador, with more prevalence in highlands, depend mainly on off-farm activities and incomes [72] (the case of conventional farmers´ households in this study).
The differences found in land tenure conditions between agroforesters and conventional farmers also provide an interesting angle to discuss the sustainability of the studied farming systems. According to the literature on the topic, the land tenure status may represent one of the most decisive issues influencing other socioeconomic features included in the study. The more secure land tenure situation for most agroforesters in this study, could enhance farmers’ opportunities to invest and increase production [73], while at the same time contributing to livelihood diversification and enhancing sustainability [66,74]. By contrast, the land tenure insecurity indicated by most of the conventional farmers puts property rights at risk due to other potential land claimants or even through eviction [74]. In addition, insecure land tenure affects the farmers’ assets to provide food sovereignty and security to their households, restricting farmer’s investments in important assets for production such as irrigation systems; farm equipment and infrastructure; credits and financial assistance [73].
The greater diversification of irrigation sources and the lesser dependency on rain-fed agriculture found in AFS could have positive effects on the productivity of the system, and most likely reduces the vulnerability of these systems to climate variability and change, placing agroforesters in a better position to maintain and enhance their livelihoods than conventional farmers. Therefore, smallholder farmers—with clear property rights—would be more motivated to adopt alternative production approaches and make greater investments in productive assets (such as trees for agroforestry practices; increment on agrobiodiversity, improvements to farm equipment and infrastructure; and implementation of irrigation systems) in order to intensify the agricultural activities which enhance the self-sufficiency of their livelihoods (characterised mainly by economic and food security/sovereignty).
The socioeconomic findings of this study are also in line with those of previous studies, which consider AFS to be one of the land use practices with enormous potential to enhance sustainable livelihoods and promote the adaptation and mitigation of smallholder farmers’ farming systems to climate change and variability [26,41,75,76,77].

5. Conclusions

This study provides qualitative and quantitative evidence to suggest that the highland agroforestry farming systems in the ITKP provide more favourable biophysical and socioeconomic conditions than conventional farming systems to maintain and enhance sustainable livelihoods of smallholder farmers.
Among all the factors analysed, the statistically significant difference in agrobiodiversity species between farming systems—with AFS having more agrobiodiversity than CAS—was one of the most important findings. Other interesting findings were the differences found in the numbers of cultivars/breeds and commercial and subsistence/farming system functioning species used by farmers. AFS could be considered as more genetically diversified farming systems than CAS. The greater levels of agrobiodiversity found in AFS, and especially in the case of the cultivated biodiversity (species, cultivars and breeds), indicate that agroforesters have better socioeconomic and environmental assets to sustain their livelihoods and households than conventional farmers.
All the socioeconomic aspects included in this study, especially livelihood composition; on-and off-farm income levels and agrobiodiversity usages, indicate major advantages of AFS to support sustainable smallholder farmers’ household incomes and livelihoods compared to CAS.
Additional studies using quantitative methods could be done to complement the findings of this study. For example: in the case of agrobiodiversity, on-farm inventories during different crop seasons could be done to establish a more precise number of cultivated and wild species used by farmers. In the case of some socioeconomic variables such as agrobiodiversity usages and income levels, it could be interesting to know how the commercialisation of agrobiodiversity economically contribute to improve the incomes levels and if the improvements of income levels and land tenure status contributes to enhancing sustainability through the direct investments on productive assets (such as infrastructure, equipment, technology and capacitation). An analysis of the vulnerability and resilience of different farming system types to climatic variability and change also is needed in order to have a complete appraisal of the sustainability of smallholders’ livelihoods in the global change context. These issues were beyond the aims of current study and could be considered for further research.
The methods and findings of this research could be considered as an important contribution and reference point for the scarce, but increasing body of knowledge comparing traditional agroforestry and conventional agriculture systems in the tropical highlands. Considering the limited knowledge and geographical expansion of agroforestry practices in the study area and Ecuadorian highlands in general, the results of this study could enhance the initiatives which promote trees and agroforestry practices as essential components to improve the livelihoods and sustainability of smallholder farmers, and contribute to the increasing agroecological approach implemented at local, regional and global levels to deal with the global change process. The results of this study suggest that AFS should be promoted in Ecuadorian highlands due to the socioeconomic and environmental advantages to support and enhance sustainable livelihoods.
Finally, more multidisciplinary research is needed in the High Andes in order to understand the characteristics of the different farming systems and the strategies implemented by the farmers to support sustainable livelihoods in the context of local, regional and global change.

Acknowledgments

This study was supported by the Ecuadorian people and government through a scholarship from the National Secretariat of Higher Education, Science, Technology and Innovation (SENESCYT). We thank the University of Helsinki and the Viikki Tropical Resources Institute (VITRI) for the academic and extra financial support for the field work. We are grateful to the Kayambi People Organization and all the farmers who contributed and shared their traditional knowledge. A special recognition to the Geographer Anaí Bustos for the elaboration of the study area map.

Author Contributions

Raúl Córdova conceived the paper, designed the methods and carried out the data collection. Raúl Córdova and Nicholas J. Hogarth analysed the data. Raúl Córdova wrote the main draft and Nicholas J. Hogarth and Markku Kanninen edited and contributed to the interpretation of results and discussion.

Conflicts of Interest

The authors declare no conflict of interest.

Appendix A

Table A1. Socioeconomic and demographic data of the Indigenous Territory of Kayambi People.
ProvinceCantonParishTotal PopulationPoverty * (%)Extreme Poverty * (%)Illiteracy ≥15 Years (%)Functional Illiteracy ≥15 Years (%)Schooling Level (Years)Indigenous Population (%)
ImbaburaIbarraAngochagua326392692942492
OtavaloSan Pablo990172391929741
Gonzalez Suarez563084391626772
PichinchaQuitoEl Quinche16056541861596
CayambeCayambe508295321715917
Ascazubi5050632171787
Cangahua1623195642440581
Olmedo-Pesillo677289571726681
Otón276693401732520
Pedro MoncayoSata Rosa de Cuzubamba4147812891974
Tabacundo164036223816817
La Esperanza39867130717732
Malchinguí46247121132672
Tocachi19858246122465
Tupigachi617495461725673
NapoChacoOyacachi62079231424793
Total population ITK154437------
Mean-77361425740
* Poverty and extreme poverty based on unsatisfied basic needs index (NBI). Source: Social Indicators System of Ecuador (SIISE) and data from the national population and housing census 2010 [37,38].
Table A2. Questionnaire for the main biophysical and socioeconomic characteristics of highland farming systems.
(Printable Format Sample 1)
1. General Information
Survey No:Date:
Farmer name:
Province:Canton:Community:
Altitude (m.a.s.l):Coordinates: Slope (%):
2. Main Agroecosystem aspects:
Agroecosystem typeAgroforestryx
Conventional
Main land useArea (ha)Age (years):Remarks
Crops and trees/shrubs0.516Slow-forming terraces
Pastures and trees/shrubs
Only crops: (monocrops/many crops/rotating crops)
Only pastures: (planted pastures, meadows)
Others, specify: (grazing communal area, own or communal native forest remnants)
Fallow plot in other locality12
Total1.5
3. Main socioeconomic aspects:
Ethnic groupIndigenousxNationality/People:Kichwa/Kayambi
Mestizo
Main livelihoods description:
Garage (husband and older daughter), agroecological production and commercialisation of fruits,
vegetables and minor animals ( whole family), food sale at weekends (younger daughter)
Main cash income livelihoods:
1.- Garage
2.- Commercialisation of agroecological products
Income categorisation:
Low (<375 USD)Moderate (=375 USD)High (>375 USD)
On-farm income x
Off-farm income at household level x
Irrigation sourcesRemarks
Irrigation systemxTypeSprinklers in a communal systemIn dry seasons: 3 hours every 2 days per week.
Rainfed only Period/months
ReservoirxCapacity (m3)502 individual reservoirs
Other/specify:
Land tenureRemarks
Formal ownerxWhole farming land is state recognized
Informal owner
Other/specify:
(Printable Format Sample 2)
4. Agrobiodiversity
Cultivated biodiversity
Forestry component
Trees and shrubs (included fruit species):
SpeciesCultivars/BreedsSubsistence UseCommercial UseSubst./Comerc. %
Aguacate/Avocado/Persea americana Mill.Guatemaltecoxx05/95
Blackxx05/95
National Blackxx05/95
National Greenxx05/95
Jasshxx05/95
Crops component
Grains and legums:
Maíz/Corn/Zea mays L.Mishkax
Morochox
Popcornx
Blackx
White and softx
Tubers and roots:
Potato/Solanum tuberosum L.Violetx
Cholax
Super cholax
White Chauchax
Uniquex
Curipampax
Fruits (other fruits different from trees and shrubs:
Taxo/banana passionfruit/Passiflora sp. xx95/05
Uvilla/Golden berry Physalis peruviana L. x
Vegeables:
Col/Cabbage/Brassica oleracea L.Head cabbagexx10/90
Leaf cabbagexx
Loose leaf cabbagexx
Hearth cabbagexx
Purple cabbagexx
Pastures (included wild species in meadows):
Vicia sp. x
Alfalfa /Lucerne/Medicago staiva L. x
Avena/Barley/Hordeum vulgare L. x
Medicinal, aromatic and condiment species (planted):
Romero/Rosemary/Rosmarinus officinalis L. x
Yuyungilla x
Yerba Buena/Spearmint/Mentha spicata L. x
Matico/Aristeguietia glutinosa (Lam.) R.M.King & H. Rob. x
 
(Printable Format Sample 3)
4. Agrobiodiversity (continuation)
 Animal component
 Livestock:
SpeciesCultivars/BreedsSubsistence UseCommercial UseSubst./Comerc. %
Vacas/Cattle
Ovejas/Sheep
Chivos/Goats
Llamas
Minor animals:
Gallinas/Chickens xx10/90
Cuy/Cavy/Guinea pigs xx10/90
Chanchos/Pigs xx5/95
Conejos/Rabbits x
Palomas/Doves x
Other species/varieties component (ornamental, cultural, burden species, etc.)
Achera/Canna indica L.Redx
Cartucho/Zantedeschia aethiopica (L.) Spreng.Whitex
Greenx
Geranio/Geranium sp.Fuchsiax
Associated biodiversity
Wild plants:
Paico /Dysphania ambrosioides (L.) Mosyakin & Clemants x
Llantén/Grater plantain/Plantago major L. x
Verbena/Vervena sp. x
Wild animals:
Birds
Chihuako/Mirlo/Turdus sp. x
Guiragchuru/Pheucticus chrysogaster x
Reptiles
Lagartija negra/Black lizard x
Culebra verde/Green snake x
Amphibians
Rana marsupial-Verde/Andean marsupial tree frog/Gastroteca riobambae x
Mammals
Raposa/Common opossum/Didelphys marsupialis x
Chucuri/Long tail weasel/Mustela frenata x
Invertebrates
Saltamontes verde/Green grasshopper x
Catso negro/Black soil beetle-scarab x
Figure A1. (a) Percentage of smallholding areas under staple crops production in Ecuador; (b) Percentage of basic food products, livestock and minor animals produced by smallholder farmers in Ecuador. * Local varieties. Source: Based on data of the national agricultural census 2000 [18].
Land 07 00045 g0a1

Appendix B

Table A3. Results of main soil fertility parameters in AFS and CAS.
Soil SamplesSoil Parameters ©
pHCE *SOM **NPKCEC ***TextureBD ¤FC ºMY MAB
dS/cm%%ppmmeq/100 gmeq/100 gClass(g/cc) (%)(CFU/g)(CFU/g)
Agroforestry Systems
16.2L0.3L5.4O0.3O39.2O1.2O18.4OSandy loam1.235.6127,0001,273,000
27.2H0.3L4.1O0.2O44.5O1.2O19.6OSandy loam1.447.954,0001,640,000
36.3L0.3L4.8O0.2O48.8O0.7O16.6OSandy loam1.323.6104,000818,000
47.1H0.3L3.6O0.2O57.3O1.2O18.4OSandy loam1.434.827,0001,820,000
57.7H0.7O4.2O0.2O40.6O2.8H20.9OSandy loam1.340.054,0005,364,000
66.5O0.1L3.2O0.2O31.9O0.7O19.2OSandy loam1.610.086,0005,864,000
76.2L0.1L3.5O0.2O29.3O0.3O16.4OSandy loam1.316.1180,0003,864,000
86.1L0.2L3.4O0.2O33.6O0.6O19.7OSandy loam1.420.3209,0005,818,000
Mean6.6O0.3L4.0O0.2O40.6O1.1O18.6O-1.428.5105,1253,307,625
Conventional Agriculture Systems
16.2L0.2L5.1O0.3O53.1O1.3O18.9OSandy loam1.428.359,000182,000
27.4H0.4L3.0L0.1L31.3O0.9O16.7OSandy loam1.532.982,0001,540,000
36.4L0.4L3.5O0.2O23.6O1.2O17.9OSandy loam1.631.2127,0003,360,000
46.7O0.2L3.1L0.2O17.1O0.7O15.3OSandy loam1.126.3182,0002,727,000
56.6O0.4L3.1L0.2O27.9O0.6O22.4OSandy loam1.522.8109,0005,636,000
67.1H0.1L2.4L0.1L0.0L0.4O21.8OSandy loam1.638.536,0004,545,000
75.9L0.2L3.1O0.2O14.8L0.5O14.6OSandy loam1.540.1145,0007,318,200
85.8L0.2L4.0O0.2O14.9L0.3O11.4OSandy loam1.030.5104,0005,681,800
Mean6.5O0.3L3.4O0.2O22.8O0.7O17.4O-1.431.3105,5003,873,750
t Sig.*0.590 0.566 0.137 0.137 0.015 0.272 0.387 -0.6830.5910.9900.625
Evaluation: H = High; O = Optimal; L = Low; * Soil Electrical Conductivity; ** Soil Organic Mater; *** Cation Exchange Capacity; ¤ Bulk density; º Field capacity; Moulds and yeast; Mesophilic aerobic bacteria; Analyis methods: pH: 1:1.25 H2O; SOM: 0.1–0.5 K2Cr2O7 0.8 N; P & K: Modified Olsen ; CEC: Ammonium Acetate 1 N pH 7.0; CE: Saturated Paste; BD and FC: Physical methods; Moulds and yeast/Mesophilic aerobic bacteria: AOAC 990.12 (Petrifilm); © Evaluated and analysed by the water and soil laboratory of the Salesian Polytechnic University, Cayambe-Ecuador.
Table A4. Main microclimate parameters differences between AFS and CAS.
Inside Farm RecordsTemp (°C)Temp High (°C)Temp Low (°C)Humidity (%)Dew Point (°C)Wind Speed (m/s)Wind High Speed (m/s)Wind Chill (°C)Heat Index (°C)
Agroforestry systems
116.116.415.778.211.92.35.215.616.0
214.815.014.685.211.91.33.014.714.9
315.415.715.294.314.40.31.515.415.8
417.017.516.682.613.71.03.217.017.3
518.218.617.880.214.40.93.818.218.5
616.316.616.195.415.51.33.116.316.7
717.718.017.388.915.61.02.717.718.1
816.717.116.490.615.00.82.716.717.1
Mean16.516.916.286.914.11.13.116.516.8
Conventional agricultural systems
115.916.215.691.814.51.13.015.916.2
216.516.716.294.215.40.31.616.516.9
316.416.816.080.212.72.14.716.116.5
416.216.615.883.013.01.03.116.216.4
517.217.616.879.613.42.66.416.917.3
615.215.514.987.612.92.03.814.915.3
715.215.614.992.613.91.02.715.215.6
816.817.116.586.814.52.26.116.617.1
Mean16.216.515.887.013.81.53.916.016.4
t Sig. *0.4370.4830.4070.9890.6700.2380.2810.3940.430
* α = 0.05.
Figure A2. Gender of the main household head system type.
Land 07 00045 g0a2

References

  1. Lowder, S.K.; Skoet, J.; Raney, T. The number, size, and distribution of farms, smallholder farms, and family farms worldwide. World Dev. 2016, 87, 16–29. [Google Scholar] [CrossRef]
  2. Food and Agriculture Organization of the United Nations. Smallholders and Family Farmers Factsheet. Available online: http://www.fao.org/fileadmin/templates/nr/sustainability_pathways/docs/Factsheet_SMALLHOLDERS.pdf (accessed on 3 November 2016).
  3. Rapsomanikis, G. The Economic Lives of Smallholder Farmers: An Analysis Based on Household Data from Nine Countries; I5251E/1/12.15; Food and Agriculture Organization of the United Nations (FAO): Rome, Italy, 2015. [Google Scholar]
  4. Berdegué, J.A.; Fuentealba, R. Latin america: The state of smallholders in agriculture. In New Directions for Smallholder Agriculture; International Fund for Agricultural Development: Rome, Italy, 2011. [Google Scholar]
  5. Vadjunec, J.; Radel, C.; Turner, B., II. Introduction: The continued importance of smallholders today. Land 2016, 5, 34. [Google Scholar] [CrossRef]
  6. Soto, B.; Rodriguez, M.; Falconí, C. (Eds.) Políticas Para la Agricultura Familiar en America Latina y el Caribe, 1st ed.; Organización de las Naciones Unidas para la Alimentación y Agricultura—FAO: Santiago, Chile, 2007. [Google Scholar]
  7. Graeub, B.E.; Chappell, M.J.; Wittman, H.; Ledermann, S.; Kerr, R.B.; Gemmill-Herren, B. The state of family farms in the world. World Dev. 2016, 87, 1–15. [Google Scholar] [CrossRef]
  8. Costantino, A. Land grabbing in latin america: Another natural resource curse? Agrar. South J. Political Econ. 2014, 3, 17–43. [Google Scholar] [CrossRef]
  9. Borras, S., Jr.; Franco, J.; Kay, C.; Spoor, M. El acaparamiento de tierras en américa latina y el caribe visto desde una perspectiva internacional más amplia. In Reflexiones Sobre la Concentración y Extranjerización de la Tierra en América Latina y el Caribe; Baquero, F., Gómez, S., Eds.; FAO: Santiago, Chile, 2014; pp. 15–68. [Google Scholar]
  10. Baquero, F.; Gómez, S. (Eds.) Reflexiones Sobre la Concentración y Extranjerización de la Tierra en América Latina y el Caribe; FAO: Santiago, Chile, 2014. [Google Scholar]
  11. De Ferranti, D.M. Inequality in Latin America: Breaking with History? The World Bank: Washington, DC, USA, 2004. [Google Scholar]
  12. Michael, L.; Salcedo, S.; Jara, B.; Boero, V.; Muñoz, M. La agricultura familiar en cifras. In Agricultura Familiar en America Latina y el Caribe: Recomendaciones de Política; Salcedo, S., Guzmán, L., Eds.; FAO: Santiago, Chile, 2014; pp. 35–56. [Google Scholar]
  13. Altieri, M.A.; Funes-Monzote, F.R.; Petersen, P. Agroecologically efficient agricultural systems for smallholder farmers: Contributions to food sovereignty. Agron. Sustain. Dev. 2012, 32, 1–13. [Google Scholar] [CrossRef]
  14. Isch, L.E.; Zapatta, A. Tierra y Agua: Interrelaciones de un Acceso Inequitativo; Sistema de Investigación Sobre la Problemática Agraria en el Ecuador: Quito, Ecuador, 2010. [Google Scholar]
  15. Carrión, D.; Herrera, S. Ecuador Rural del Siglo xxi: Soberanía Alimentaria, Inversión Pública y Política Agraria; Instituto de Estudios Ecuatorianos: Quito, Ecuador, 2012. [Google Scholar]
  16. Brassel, F.; Herrera, S.; Laforge, M. Reforma Agraria en el Ecuador: Viejos Temas, Nuevos Argumentos; Sistema de Investigación Sobre la Problemática Agraria en el Ecuador: Quito, Ecuador, 2008. [Google Scholar]
  17. Larrea, C. Tenencia de la tierra, cambios agrarios y etnicidad indígena en el ecuador: 1954–2000. In Desarrollo Rural y Neoliberalismo: Ecuador desde una Perspectiva Comparada; North, L., Cameron, J., Eds.; Universidad Andina Simón Bolívar-Corporación Editora Nacional: Quito, Ecuador, 2008. [Google Scholar]
  18. INEC. Resultados Nacionales con Resúmenes Provinciales, Censo Nacional Agropecuario 2000. Available online: http://www.ecuadorencifras.gob.ec/censo-nacional-agropecuario/ (accessed on 11 October 2016).
  19. Barragán, C.; Cahuasquí, L.; Landívar, N.; Ruiz, M. El Derecho a la Alimentación en el Ecuador: Balace del Estado Alimentario de la Población Ecuatoriana desde una Perpectiva de Derechos Humanos; Foodfirst Information and Action Network-FIAN Ecuador: Quito, Ecuador, 2010. [Google Scholar]
  20. Gaybor, A. Acumulación Capitalista en el Campo y Despojo de Agua; Foro de los Recursos Hídricos: Quito, Ecuador, 2010. [Google Scholar]
  21. Tamayo, C.; Francisco, H. Dificultades y Desafíos para el Riego Campesino; Todos por el agua, el agua para Todos. Quinto Encuenro Nacional. Documentos de Discusión, Portoviejo and Montecristi—Ecuador, 2008; Isch, E., Ed.; Foro de los Recuros Hídricos-Consorcio CAMAREN: Portoviejo, Ecuador, 2008; pp. 159–173. [Google Scholar]
  22. Salcedo, S.; Sanchez, A.; Coloma, M. Agricultura familiar y la seguridad alimentaria: El exitoso caso de forsandino. In Agricultura Familiar en America Latina y el Caribe: Recomendaciones de Política; Salcedo, S., Guzmán, L., Eds.; FAO: Santiago, Chile, 2014; pp. 58–78. [Google Scholar]
  23. Oyarzun, P.J.; Borja, R.M.; Sherwood, S.; Parra, V. Making sense of agrobiodiversity, diet, and intensification of smallholder family farming in the highland andes of ecuador. Ecol. Food Nutr. 2013, 52, 515–541. [Google Scholar] [CrossRef] [PubMed]
  24. Guerrero, A.; Salvador, S. Panorama Agroeconómico del Ecaudor, una Visión del 2015. Available online: http://sinagap.agricultura.gob.ec/pdf/estudios_agroeconomicos/panorama_agroeconomico_ecuador2015.pdf (accessed on 3 February 2017).
  25. Altieri, M.A.; Toledo, V.M. The agroecological revolution in latin america: Rescuing nature, ensuring food sovereignty and empowering peasants. J. Peasant Stud. 2011, 38, 587–612. [Google Scholar] [CrossRef]
  26. Van Noordwijk, M.; Bayala, J.; Hairiah, K.; Lusiana, B.; Muthuri, C.; Khasanah, N.M.; Mulia, R. Agroforestry solutions for buffering climate variability and adapting to change. In Climate Change Impact and Adaptation in Agricultural Systems; Fuhrer, J., Gregory, P.J., Eds.; CAB-International: Wallingford, UK, 2014; pp. 216–232. [Google Scholar]
  27. Maldonado, P. Mapa del Territorio de la Confederación del Pueblo Kayambi; Confederación del Pueblo Kayambi: Cayambe, Ecuador, 2016. [Google Scholar]
  28. Pilataxi, C. Plan Estratégico de Desarrollo del Pueblo Kayambi; Confederación del Pueblo Kayambi: Cayambe, Ecuador, 2001. [Google Scholar]
  29. INEC. Población, Superficie (km2), Densidad Poblacional a Nivel Parroquial. Available online: http://www.ecuadorencifras.gob.ec/informacion-censal-cantonal/ (accessed on 5 October 2016).
  30. Becker, M. Pueblo Kayambi. Available online: http://www.kayambi.org/index.html (accessed on 10 January 2016).
  31. Knapp, G. Andean Ecology: Adaptive Dynamics in Ecuador; Westview: Boulder, CO, USA; Oxford, UK, 1991. [Google Scholar]
  32. Cañadas, L. El Mapa Bioclimático y Ecológico del Ecuador; Banco Central del Ecuador: Quito, Ecuador, 1983. [Google Scholar]
  33. Medina, G.; Mena, P. Los páramos en el ecuador. In Los Páramos del Ecuador. Particularidades, Problemas y Perspectivas; Medina, G., Mena, P., Hofstede, R., Eds.; Abya Yala: Quito, Ecuador, 2001; pp. 1–23. [Google Scholar]
  34. Moreno, L. Actualización del Plan de Desarrollo y Ordenemiento Territorial del Gobierno Autónomo Descentralizado Intercultural y Plurinacional Municipal de Cayambe 2015–2025; GADIP Cayambe: Cayambe, Ecuador, 2015. [Google Scholar]
  35. INAMHI. Mapa de Precipitación Media Multianual (1965–1999). Available online: http://www.serviciometeorologico.gob.ec/wp-content/MapasBiblioteca/5%20PrecipitacionA0.pdf (accessed on 3 January 2017).
  36. López, M. Generación de geo Información para la Gestión del Territorio a Nivel Nacional, Escala 1: 25,000, Sistemas Productivos Cantón Cayambe; Instituto Espacial Ecuatoriano y Gobierno Autónomo Descentralizado Provincia de Pichincha: Quito, Ecuador, 2013. [Google Scholar]
  37. INEC. Población por Área, Según Provincia, Cantón y Parroquia de Empadronamiento y Grupos Étnicos. Available online: http://www.ecuadorencifras.gob.ec/informacion-censal-cantonal/ (accessed on 13 January 2017).
  38. SIISE. Pobreza por Necesidades Básicas Insatisfechas (nbi). Available online: http://www.siise.gob.ec/siiseweb/siiseweb.html?sistema=1# (accessed on 13 February 2017).
  39. Hofstede, R. El impacto de las actividades humanas sobre el páramo. In Los Páramos del Ecuador. Particularidades, Problemas y Perspectivas; Mena, P., Medina, G., Hofstede, R., Eds.; Abya Yala: Quito, Ecuador, 2001; pp. 161–185. [Google Scholar]
  40. CODEMIA. Sistematización y Análisis de los Resultados de la Caracterización Agropecuaria y Mapas Temáticos del Sistema de Riego Cayambe—Pedro Moncayo; Consorcio de Desarrollo de Manejo Integral de Agua y Ambiente: Cayambe, Ecuador, 2015. [Google Scholar]
  41. Zomer, R.J.; Trabucco, A.; Coe, R.; Place, F.; van Noordwijk, N.; Xu, J.C. Trees on Farms: An Update and Reanalysis of Agroforestry’s Global Extent and Socio-ecological Characteristics. Working Paper 179. Available online: http://www.worldagroforestry.org/downloads/Publications/PDFS/WP14064.pdf (accessed on 10 May 2015).
  42. Hofstede, R.; Lips, J.; Jongsma, W. Geografía, Ecología y Forestación de la Sierra alta del Ecuador; Abya Yala: Quito, Ecuador, 1998. [Google Scholar]
  43. Spargo, J.; Allen, T.; Kariuki, S. Interpreting Your Soil Test Results. Available online: http://ag.umass.edu/soil-plant-tissue-testing-lab/fact-sheets/interpreting-your-soil-test-results (accessed on 12 June 2016).
  44. Espinoza, L.; Slaton, N.; Mozaffari, M. Understanding the Numbers on Your Soil Test Report. Available online: https://www.uark.edu/depts/soiltest/NewSoilTest/pdf_files/FSA-2118.pdf (accessed on 13 June 2016).
  45. Hull, W.X. Manual de Conservación de Suelos; Mexico, D.F., Ed.; Servicio de Lenguas Extranjeras, Secretaría de Estado de los Estados Unidos de América: Whashington, DC, USA, 1992; p. 331. [Google Scholar]
  46. What Is Sandy Loam. Available online: http://www.southernmulch.com/article-what-is-sandy-loam.php (accessed on 15 June 2017).
  47. Kavdir, Y.; Zhang, W.; Basso, B.; Smucker, A.J.M. Development of a New Long-term Drought Resilient Soil Water Retention Technology. Available online: http://www.jswconline.org/content/69/5/154A.full.pdf+html?sid=cf76b9ac-4e83-4f03-9da9-841cd72324b0 (accessed on 21 June 2017).
  48. USDA, Natural Resources Conservation Service. Rangeland Sheet 4, Rangeland Soil Quality-compaction. Available online: https://www.nrcs.usda.gov/Internet/FSE_DOCUMENTS/nrcs142p2_051912.pdf (accessed on 20 June 2017).
  49. USDA, Natural Resources Conservation Service. Soil Bulk Density/Moisture/Aireation, Soil Quality Kit-guides for Educators. Available online: https://www.nrcs.usda.gov/Internet/FSE_DOCUMENTS/nrcs142p2_053260.pdf (accessed on 22 June 2017).
  50. Suquilanda, M. Manejo Agroecológico de Suelos, 1st ed.; Ministerio de Agricultura, Ganadería, Acuacultura y Pesca: Quito, Ecuador, 2017; p. 32. [Google Scholar]
  51. Cornell University. Northeast Region Certified Crop Adviser (NRCCA) Study Resources; Competency Area 2: Soil Hydrology Aem; po 12.1-3 Field Capacity, Permanent Wilting Point & Available Water Capacity. Available online: https://nrcca.cals.cornell.edu/soil/CA2/CA0212.1-3.php (accessed on 23 June 2017).
  52. Zimmerer, K.S. Overlapping patchworks of mountain agriculture in peru and bolivia: Toward a regional-global landscape model. Hum. Ecol. 1999, 27, 135–165. [Google Scholar] [CrossRef]
  53. Beniston, M. Climatic change in mountain regions: A review of possible impacts. Clim. Chang. 2003, 59, 5–31. [Google Scholar] [CrossRef]
  54. Price, M.F. Climate change in mountain regions: A marginal issue? Environmentalist 1995, 15, 272–280. [Google Scholar] [CrossRef]
  55. De Boef, W.; Haga, M.; Sibanda, L.; Swaminathan, M.; Winters, P. (Eds.) Mainstreaming Agrobiodiversity in Sustainable Food Systems: Scientific Foundations for an Agrobiodiversity Index—Summary; Biodiversity International: Rome, Italy, 2016; p. 30. [Google Scholar]
  56. Biodiversity and Agriculture: Safeguarding Biodiversity and Securing Food for the World. Available online: https://www.cbd.int/doc/bioday/2008/ibd-2008-booklet-en.pdf (accessed on 29 May 2017).
  57. Thrupp, L.A. The importance of biodiversity in agroecosystems. J. Crop Improv. 2004, 12, 315–337. [Google Scholar] [CrossRef]
  58. Leakey, R. Socially modified organisms in multifunctional agriculture—Addressing the needs of smallholder farmers in africa. Arch. Crop Sci. 2017, 1, 20–29. [Google Scholar]
  59. Pascual, U.; Narloch, U.; Nordhagen, S.; Drucker, A. The economics of agrobiodiversity conservation for food security under climate change. Economia Agraria y Recursos Naturales 2011, 11, 191–220. [Google Scholar] [CrossRef]
  60. Zimmerer, K.; Vanek, S. Toward the integrated framework analysis of linkages among agrobiodiversity, livelihood diversification, ecological systems, and sustainability amid global change. Land 2016, 5, 10. [Google Scholar] [CrossRef]
  61. Sconnes, I. Sustainable Rural Livelihoods: A Framework for Analysis. Available online: https://opendocs.ids.ac.uk/opendocs/bitstream/handle/123456789/3390/Wp72.pdf?sequence=1 (accessed on 6 December 2017).
  62. Chambers, R.; Conway, G. Sustainable Rural Livelihoods: Practical Concepts for the 21st Century. Available online: https://opendocs.ids.ac.uk/opendocs/bitstream/handle/123456789/775/Dp296.pdf?sequence=1 (accessed on 28 November 2017).
  63. Chiriboga, M. La pobreza rural y la producción agropecuaria. In Ecuador: El mito del Desarrollo; Editorial El Conejo: Quito, Ecuador, 1982. [Google Scholar]
  64. Wong, S.; Ludeña, C. Caracterización de la Agricultura Familiar en Ecuador. Preliminary Report 1. Proyecto gcp/rla/152/iab; FAO: Quito, Ecuador, 2006. [Google Scholar]
  65. Hussein, K.; Nelson, J. Sustainable Livelihoods and Livelihood Diversification. Available online: http://www.ids.ac.uk/files/Wp69.pdf (accessed on 19 December 2017).
  66. Ellis, F. The determinants of rural livelihood diversification in developing countries. J. Agric. Econ. 2000, 51, 289–302. [Google Scholar] [CrossRef]
  67. Ampudia, L. (Ed.) Impacto de la Floricultura en los Campesinos de Cayambe; Instituto de Ecología y Desarrollo de las Comunidades Andinas (IEDECA): Cayambe, Ecuador, 1999; p. 108. [Google Scholar]
  68. Ávalos, D. Dinámicas de Agricultura Familiar en Torno a la Existencia de la Producción Florícola en la Parroquia Tabacundo, Ecuador; Facultad Latinomaericana de Ciencias Sociales, FLACSO Ecuador: Quito, Ecuador, 2017. [Google Scholar]
  69. Newman, C.; Larreamendy, P.; Maldonado, A. Mujeres y Floricultura, Cambios y Consecuencias en el Hogar; Abya-Yala, World Bank and CONAMU: Quito, Ecuador, 2002; p. 86. [Google Scholar]
  70. Vega, H.; Philhower, E. 2009 Ecuador Fresh Flower Industry Situation. Available online: https://gain.fas.usda.gov/Recent%20GAIN%20Publications/2009%20Ecuador%20Fresh%20Flower%20Industry%20Situation_Quito_Ecuador_6-9-2009.pdf (accessed on 12 January 2018).
  71. Conefrey, M. Roses with Altitude: Why Ecuador’s Flower Industry Stands Out. Available online: https://www.ft.com/content/eb5114d6-d846-11e4-ba53-00144feab7de (accessed on 12 January 2018).
  72. Martínez, L. La Agricultura Familiar en el Ecuador. Available online: http://portalsiget.net/ArchivosSIGET/recursos/Archivos/1682015_AgriculturaFamiliarE.pdf (accessed on 22 December 2017).
  73. Feder, G. Land ownership security and farm productivity: Evidence from thailand. J. Dev. Stud. 1987, 24, 16–30. [Google Scholar] [CrossRef]
  74. FAO. Land Tenure and Rural Development. Available online: ftp://ftp.fao.org/docrep/fao/005/y4307E/y4307E00.pdf (accessed on 26 August 2017).
  75. Lasco, R.D.; Delfino, R.J.P.; Espaldon, M.L.O. Agroforestry systems: Helping smallholders adapt to climate risks while mitigating climate change. Wiley Interdiscip. Rev. Clim. Chang. 2014, 5, 825–833. [Google Scholar] [CrossRef]
  76. Selvarajh-Jaffery, R.; Obanyi, G.; Wagner, B.; Sulzberger, E. (Eds.) Tackling Global Challenges through Agroforestry. Annual Report 2006; World Agroforestry Centre (ICRAF): Nairobi, Kenya, 2007; p. 60. [Google Scholar]
  77. Watson, R.T.; Noble, I.R.; Bolin, B.; Ravindranath, N.H.; Verardo, D.J.; Dokken, D.J. (Eds.) Land Use, Land-Use Change and Forestry. Special Reports; IPCC: Cambridge, UK, 2000; p. 375. [Google Scholar]
Figure 1. Location of the study area and distribution of the sample farms.
Land 07 00045 g001
Figure 2. Mean socioeconomic differences among ITKP, highland provinces and national-level, based on Table A1 in the Appendix and data from Social Indicators System of Ecuador (SIISE)/national population and housing census 2010 [37,38].
Land 07 00045 g002
Figure 3. (a) Agrobiodiversity categories differences between AFS and CAS in number of species; (b) Cultivated agrobiodiversity differences between AFS and CAS in number of species and cultivars/breeds.
Land 07 00045 g003
Figure 4. Livelihoods’ characterisation and prioritisation by cash income in highland agroforestry and conventional agriculture systems.
Land 07 00045 g004
Figure 5. (a) On-farm income level categorisation by system type; (b) Off-farm income level categorisation by system type.
Land 07 00045 g005
Figure 6. Land tenure categorisation by system type.
Land 07 00045 g006
Figure 7. Irrigation sources categorisation by system type.
Land 07 00045 g007
Table 1. Agrobiodiversity differences within and between AFS and CAS.
AgrobiodiversityNumber of spp.% of Difference ªNumber of Cultivars/Breeds% of Difference ª
AFSºCASºAFSºCASº
Cultivated Biodiversity (Subtotal 1)
Trees and shrubs321344****331344****
Legumes and grains9811***211324***
Tubers and roots5412**11719**
Non-tree and shrub fruits3225****3226****
Vegetables211131****251234****
Pastures8612**8612**
Medicinal, aromatic and condiment plants11444****11445****
Livestock 113 113
Minor animals 4322****4323****
Other (burden animals, ornamental and cultural spp.)7339***---
Subtotal 11025430****1186231****
Associated Biodiversity (Subtotal 2)
Wild animals:
Birds13118**---
Reptiles226 ---
Amphibians2214**---
Mammals548**---
Invertebrates30275 ---
Wild animals (Subtotal 2.1)52466**---
Wild plants (Subtotal 2.2)181315****---
Subtotal 2 (Subtotal 2.1 + Subtotal 2.2)70598***---
Total (Subtotal 1 + Subtotal 2)17211320****1186231****
º n = 30; * p < 0.1; ** p < 0.05; *** p < 0.01; **** p < 0.001; - Not applicable; ª = {(AFSspp. − CASspp.)(100)}/(AFSspp. + CASspp.); ruminants and pseudoruminants: cattle, sheep, goats, llamas and alpacas; guinea pigs, rabbits, pigs, chickens, turkeys, ducks, quails and geese.
Table 2. Main agrobiodiversity uses differences within and between AFS and CAS.
AgrobiodiversityNumber of Subsistence/Functional spp.% of Difference ªNumber of Commercial spp.% of Difference ª
AFSºCASºAFSºCASº
Cultivated biodiversity (Subtotal 1)
Trees and shrubs311243****1089*
Legumes and grains771 2141**
Tubers and roots439 1040*
Non-tree and shrub fruits3223***0052**
Vegetables12916**8259****
Pastures8610**00100
Medicinal, aromatic and condiment plants8434****3091**
Livestock 1015 117
Minor animals 3218***1038**
Other (burden animals, ornamental & cultural spp.)7339***00100
Subtotal 1844926****17556****
Associated biodiversity (Subtotal 2)
Wild animals:
Birds13118**000
Reptiles226 000
Amphibians2214**000
Mammals548**000
Invertebrates30275 00100
Wild animals (Subtotal 2.1)52466**00100
Wild plants (Subtotal 2.2)181315****00100
Subtotal 2 (Subtotal 2.1 + Subtotal 2.2)70598***00100
Total (Subtotal 1 + Subtotal 2)15410817****17556****
º n = 30; * p < 0.1; ** p < 0.05; *** p < 0.01; **** p < 0.001; - Not applicable; ª = {(AFSspp. − CASspp.)(100)}/(AFSspp. + CASspp.); ruminants and pseudoruminants: cattle, sheep, goats, llamas and alpacas; guinea pigs, rabbits, pigs, chickens, turkeys, ducks, quails and geese.

