Article

Model Based Regional Estimates of Soil Organic Carbon Sequestration and Greenhouse Gas Mitigation Potentials from Rice Croplands in Bangladesh

1
Institute of Biological & Environmental Science, University of Aberdeen, 23 St Machar Drive, Aberdeen AB24 3UU, UK
2
The James Hutton Institute, Craigiebuckler, Aberdeen AB15 8QH, UK
3
Natural Resource Ecology Laboratory, Colorado State University, Fort Collins, CO 80523, USA
4
Department of Soil Science, Bangladesh Agricultural University, Mymensingh 2202, Bangladesh
5
School of Agriculture and Food Technology, University of South Pacific, Suva, Fiji
*
Author to whom correspondence should be addressed.
Submission received: 25 June 2018 / Accepted: 2 July 2018 / Published: 5 July 2018

Abstract

:
Rice (Oryza sativa L.) is cultivated as a major crop in most Asian countries and its production is expected to increase to meet the demands of a growing population. This is expected to increase greenhouse gas (GHG) emissions from paddy rice ecosystems, unless mitigation measures are in place. It is therefore important to assess GHG mitigation potential whilst maintaining yield. Using the process-based ecosystem model DayCent, a spatial analysis was carried out in a rice harvested area in Bangladesh for the period 1996 to 2015, considering the impacts on soil organic carbon (SOC) sequestration, GHG emissions and yield under various mitigation options. An integrated management (IM, a best management practice) considering reduced water, tillage with residue management, reduced mineral nitrogen fertilizer and manure, led to a net offset by, on average, −2.43 t carbon dioxide equivalent (CO2-eq.) ha−1 year−1 (GHG removal) and a reduction in yield-scaled emissions intensity by −0.55 to −0.65 t CO2-eq. t−1 yield. Under integrated management, it is possible to increase SOC stocks on average by 1.7% per year in rice paddies in Bangladesh, which is nearly 4 times the rate of change targeted by the “4 per mille” initiative arising from the Paris Climate Agreement.

1. Introduction

The increase in atmospheric concentrations of greenhouse gases (GHG) is an issue of global concern. Agricultural activities release three major GHGs: carbon dioxide (CO2), methane (CH4) and nitrous oxide (N2O) [1]. Agricultural land, occupying 37% of the earth’s surface, contributes 13.5% of anthropogenic GHG emissions, including more than 60% of N2O (nitrous oxide) and 50% CH4 (methane) emissions [2]. Among all agricultural activities, wetland rice (Oryza sativa L.) production is a major contributor to the global budget of GHG emissions, comprising 55% of global agricultural GHG emissions, of which 90% are emitted from Asia [3].
Greenhouse gas emissions from agriculture could be mitigated by C sequestration in soils, or reducing non-CO2 GHG emissions. Increasing SOC stocks is not only beneficial for mitigating climate change but also important for improving soil quality and crop growth [4,5]. It is estimated that close to 90% of the agricultural sector’s total mitigation potential could be derived from SOC sequestration, with about 10% from reduction of non-CO2 GHGs [2]. Rice management offers substantial mitigation potential [6], which has been studied recently in Asia, including India [7,8] and China [1,9]. Under modified rice management practices, C could be sequestered in soils of rice growing countries such as India and China at a rate of about 8–16 Teragram (Tg) carbon (C) year1 and 8–500 Tg C year1, respectively [10,11]. An outcome of the Paris Climate Agreement was the 4 per mille initiative, which is a voluntary initiative aiming to increase global SOC stocks by 0.4% per year, both for climate change mitigation and to contribute to food security [12,13]. A preliminary analysis in 20 regions [13] suggests that there is scope to increase SOC stock by “4 per mille” (0.4%/year) or even more under best management practices in many areas. Bangladesh was not included in the review but as a one of the prominent rice-producing countries in the world, it is crucial to assess the feasibility of the 4 per mille initiative in Bangladesh [12,13]. However, to assess climate change mitigation, considering only SOC sequestration might not provide an effective guideline [14]. Because management practices affect more than one gas, by more than one mechanism and sometimes in opposite ways, the net climate benefits depend on the combined effects of all gases [1,15].
Being located in the subtropical zone with a humid tropical monsoon climate, Bangladesh grows a variety of crops but rice dominates [15]. As an agriculture driven country, around 15% of gross domestic product is obtained from this sector [16] and Bangladesh is responsible for 7% of global rice production [17]. Annually, around 34 million tonnes (Mt) of rice are produced in Bangladesh, covering over 75% of the total land surface [18]. The land use is mainly double cropping (i.e., crops are grown twice a year on the same land), which covered around 50% of net cropped area, followed by single cropped and triple cropped lands (i.e., crops are grown three times a year on the same land), at about 28% and 22% of the area, respectively. The irrigated rice-fallow-rainfed rice system is one of the dominant cropping systems in Bangladesh [19]. Irrigated (dry season) rice in the winter—known locally as boro—occupies around 4.8 Mha and rainfed (wet season) rice in the summer—known locally as aman—occupies 5.6 Mha of total harvested area [18]. Due to the greater productivity of irrigated rice production, the irrigated area under rice cultivation has expanded and now occupies 60% of the irrigated area. Methane emissions from rice have increased by 19% over the last 20 years, from 21 Tg CO2-eq. in 1996 to 25 Tg CO2-eq. in 2014 [17].
In Bangladesh, more emphasis has been placed on adaptation than mitigation in climate change policy. In terms of its Nationally Determined Contribution to the Paris Agreement, Bangladesh plans to develop a “business as usual” scenario and to harness mitigation potential from different non-agricultural sectors including power, transport and industry, which collectively will reduce GHG emissions unconditionally by 5% of the total emissions from business as usual level by 2030, based on existing resources. Conditionally, GHG emissions could be reduced by 15% through international support such as finance, investment, technology development and transfer and capacity building from developed countries compared to the business as usual scenario [20,21,22]. Resources are being invested in sectors other than agriculture, due to the lack of specific information available to assess the business as usual conditions in agriculture, although there is potential to reduce GHG emissions from agriculture in a cost-effective way [20,23]. Recently Bangladesh has pledged to reduce emissions from different activities, including rice cultivation, as part of the global agreement at COP 22 in Marrakech 2016, to meet mitigation commitments and food security goals [24].
Bangladesh has limited development of emissions factors that are more specific to national circumstances, which increases uncertainties and makes it more difficult to assess and develop mitigation targets with high levels of confidence. In Bangladesh, appropriate mitigation estimates from paddy rice are yet to be undertaken. To derive spatially distributed information about the mitigation potential and possible interactions with other variables, biogeochemical agroecosystem models are useful tools to estimate changes in SOC, yield and GHG emissions for different mitigation options. Recently, CH4 emissions were predicted under mineral and organic N amended conditions in double rice based cropping systems in Bangladesh using the semi-empirical model CH4MOD2.5 [25]. A large number of factors influence regional and inter-annual variability in CH4 flux [8] and while empirical models are simple, they may not adequately capture GHG emission dynamics due to this complexity [26]. Therefore, more complex process-based models are useful supplementary tools for studying SOC sequestration, CH4 and N2O emissions and mitigation potential under different agricultural management practices.
For this study, we selected the DayCent ecosystem model [27] because it can be readily applied to different land uses, including grasslands [27], croplands [28,29], forests [30] and savannas [31]. It has been tested in the global simulation of rice growth [32]. Furthermore, the latest version has recently been applied to 350 rice-based datasets in China [4]. The model was parameterised with a portion of the sites and independently evaluated with other sites [4]. The results from China provide confidence that the model produces reasonable results for estimating SOC changes in paddy rice systems [4]. GHG mitigation potentials were also determined in Chinese rice cropland using this model [4,33]. The DayCent model has also been tested by the US government and is used for estimating GHG emissions in their national inventory for reporting to the UN Framework Convention on Climate Change [34]. Soil organic carbon changes, GHG emissions and yield under different management has also been tested by DayCent in Bangladeshi rice experimental sites [35,36]. The present study aimed to determine the mitigation potential for SOC sequestration, considering the impacts on CH4 and N2O emissions, from double rice cropping systems in Bangladesh on a spatial basis. The outcome of the study provides tier 3 GHG emission inventory estimates at a national scale for double rice cropping systems in Bangladesh and provides recommendations on options to reduce GHG emissions while maintaining yield.

2. Materials and Methods

2.1. Model Description

We used the most recent version of the DayCent biogeochemical model (DayCent Rice version) [27], developed for paddy rice [33]. DayCent is the daily time-step version of the CENTURY model [27]. The processes are simulated daily and include net primary productivity (radiation use efficiency) and heterotrophic respiration, the biogeochemical processes of C, N, phosphorus and sulphur cycling, phenology and soil water dynamics. In the version used in this study, DayCent was extended to simulate anaerobic conditions as well as aerobic, which is relevant for flooded crop systems such as rice fields [33,37]. Methane production is based on C substrate supply derived from decomposition of SOM and root rhizodeposition [33]. Soil texture, soil pH, redox potential, soil temperature, climate and agricultural management impact methanogenesis and thereby CH4 formation [33]. DayCent does not simulate diffusion of CH4 through the surface water to the atmosphere because it is considered a minor pathway for CH4 emissions [33]. However, the model does simulate transfer through plants and ebullition, which occurs when the soil CH4 concentration exceeds a critical state that leads to formation of bubbles [33,37]. The trace gas sub-model of DayCent simulates soil N2O and NOx emissions from nitrification and denitrification processes. Daily denitrification rates are estimated for each soil layer based on nitrate (NO3) concentration, heterotrophic respiration (as a proxy for labile C availability), water content, texture and temperature [38]. Detailed information about model is described in greater detail elsewhere [33,37,38].

2.2. Input Data for Upscaling by DayCent

Simulations were carried out for total 64 districts of Bangladesh. The district level was selected as geographic unit for the analysis because most of the information available in maps and datasets were at the district level. The necessary input data required to run the model were generated from a Geographic Information System (GIS) that was prepared by the Bangladesh Agricultural Research Council [39] and the Soil Resource Development Institute [40].

2.2.1. Weather Data

Daily historical climate data including rainfall, daily maximum and minimum temperature were provided by the Bangladesh Meteorological Department [41]. The data set provides information for 35 stations for the period from 1975–2015. If weather data were unavailable for a specific district/year, data from the closest neighbouring weather station was used, with preference to those located in a similar division (a division constitutes several districts together). Regional climatic differences are minor, with average winter temperature ranges from 7.2 °C to 12.8 °C, with January as the coldest month and 23.9 °C to 31.1 °C during summer with highs in April-May [15,42]. Average rainfall is reported to be 187 cm and varies from 170–550 cm, with 80% of the total rainfall occurring during June-October [15,42]. There is lower rainfall in the north-western part, while the north-eastern part receives higher rainfall (Haq and Shoaib, 2013) [15].

2.2.2. Land Use and Agronomic Properties

We selected a fixed land use system for all districts: irrigated rice-fallow-rainfed rice, which is the dominant rice cropping rotation in Bangladesh [19]. The date and method of sowing, harvesting and irrigation were based on long-term double rice experimental datasets [35,43,44]. Fertilizer was applied assuming current farmer practice at a rate of 110 kg N ha−1 year1 for irrigated rice and 80 kg N ha−1 year1 for rainfed rice and applied as mineral N fertilizer [43,45,46]. Fertilizer was applied in three splits as suggested by previous literature [45]. The average yield for both rice seasons for the year 2015–2016 was collected from statistical yearbooks [18] to compare with modelled yield for both cropping seasons.

2.2.3. Other Soil Physical Properties

Soil pH and soil texture data were obtained from the GIS soils map for Bangladesh (BARC, 2018) [39]. For each district, the dominant soil type was used in the simulation. The model input data for soil water characteristics, including field capacity, wilting point and saturated hydraulic conductivity, were estimated from texture using the algorithm developed by Saxton and Rawls [47], as stated by previous literature [29].

2.2.4. Soil Bulk Density and Initial SOC Data

Due to a lack of available bulk density (BD) values for each district, BD was estimated using the method of Manrique and Jones [48] for SOC values as described in Souza et al. [49]. The calculated estimates for BD are in the range from 1.12–1.42 g cm−3, which are within the values reported by Haq and Shoaib [15] of between 1.1 and 1.6 g cm−3. For calculation of the SOC stock (t ha−1), we used the SOM map available for the year 1998 [40]. This map was categorised into 5 classes: very low (<1%), low (1–2%), medium (2–3%), high (3–4%) and very high (>5%). These values account for the SOM content in the top 15 cm of the soil. The initial SOC stock (in t ha−1) was estimated using the equation of Nayak et al. [1], multiplying measured %SOM by 0.58, depth (in cm) and BD (in g cm−3), which was used in a study of Chinese croplands including 50 studies of rice ecosystems.

2.3. Model Evaluation

The DayCent model has been tested in two long-term (more than 20 years) Bangladeshi rice experimental sites. A highly significant relationship (p < 0.05) with no systematic bias was attained between modelled and measured SOC changes [35]. A highly significant positive relationship (p < 0.001) between modelled and measured yields was observed under different management practices [35]. DayCent also captured the differences in variation for CH4 emissions from the four irrigated rice treatments under different N fertilization regimes [36]. The model performance for N2O emissions, evaluated only for one experimental site, did not show a close agreement between modelled and measured N2O flux; however, there was no systematic bias in the modelled results, just large uncertainties due to a lack of precision in the model predictions.

2.4. Upscaling SOC Simulations

We ran the model for 20 years from 1996–2015, using initial SOM data published in 1998 and we assumed no significant soil C change between 1996 and 1998. The simulated DayCent values, which are estimated for 20 cm, were adjusted to 15 cm depth by dividing DayCent outputs by 1.33, assuming an equal distribution of simulated SOC between 15 cm and 20 cm depth. The soil depth was constant at 1.5 m and all soil properties were kept constant for all 12 soil layers. Three different spin up approaches were tested based on SOC ranges with low, medium and high initial SOC content from each category. The variability of these SOC ranges show a negligible (<5%) impact on changes in SOC content. As a consequence, we simplified the run using the medium SOC content for each SOC category (e.g., very low, low, medium, high and very high), assuming no great influence on determining SOC changes and emission reductions under various combinations of management practices to that of current management—which is the subject of interest in this study.
To establish a baseline SOC level, DayCent was initialized for SOC pool distributions using historical runs, which consider native vegetation and cultivation history [4,29,50]. The spin up involved grass with low intensity grazing for 500–1600 years followed by arable cropping with manure fertilization equivalent to 80 kg N ha−1 year−1 for 200–300 years, until SOC reaches an equilibrium. Average historical land use information was obtained from different sources ([51] and site manager’s knowledge)

2.5. Baseline and Mitigation Management

Baseline input data, along with other relevant information to run the model, are presented in Table 1 for simulating 1996 to 2015. We simulated the baseline and mitigation strategies for 1996 to 2015 for all districts to evaluate the potential for GHG mitigation
Four alternative management practices were considered for mitigation including:
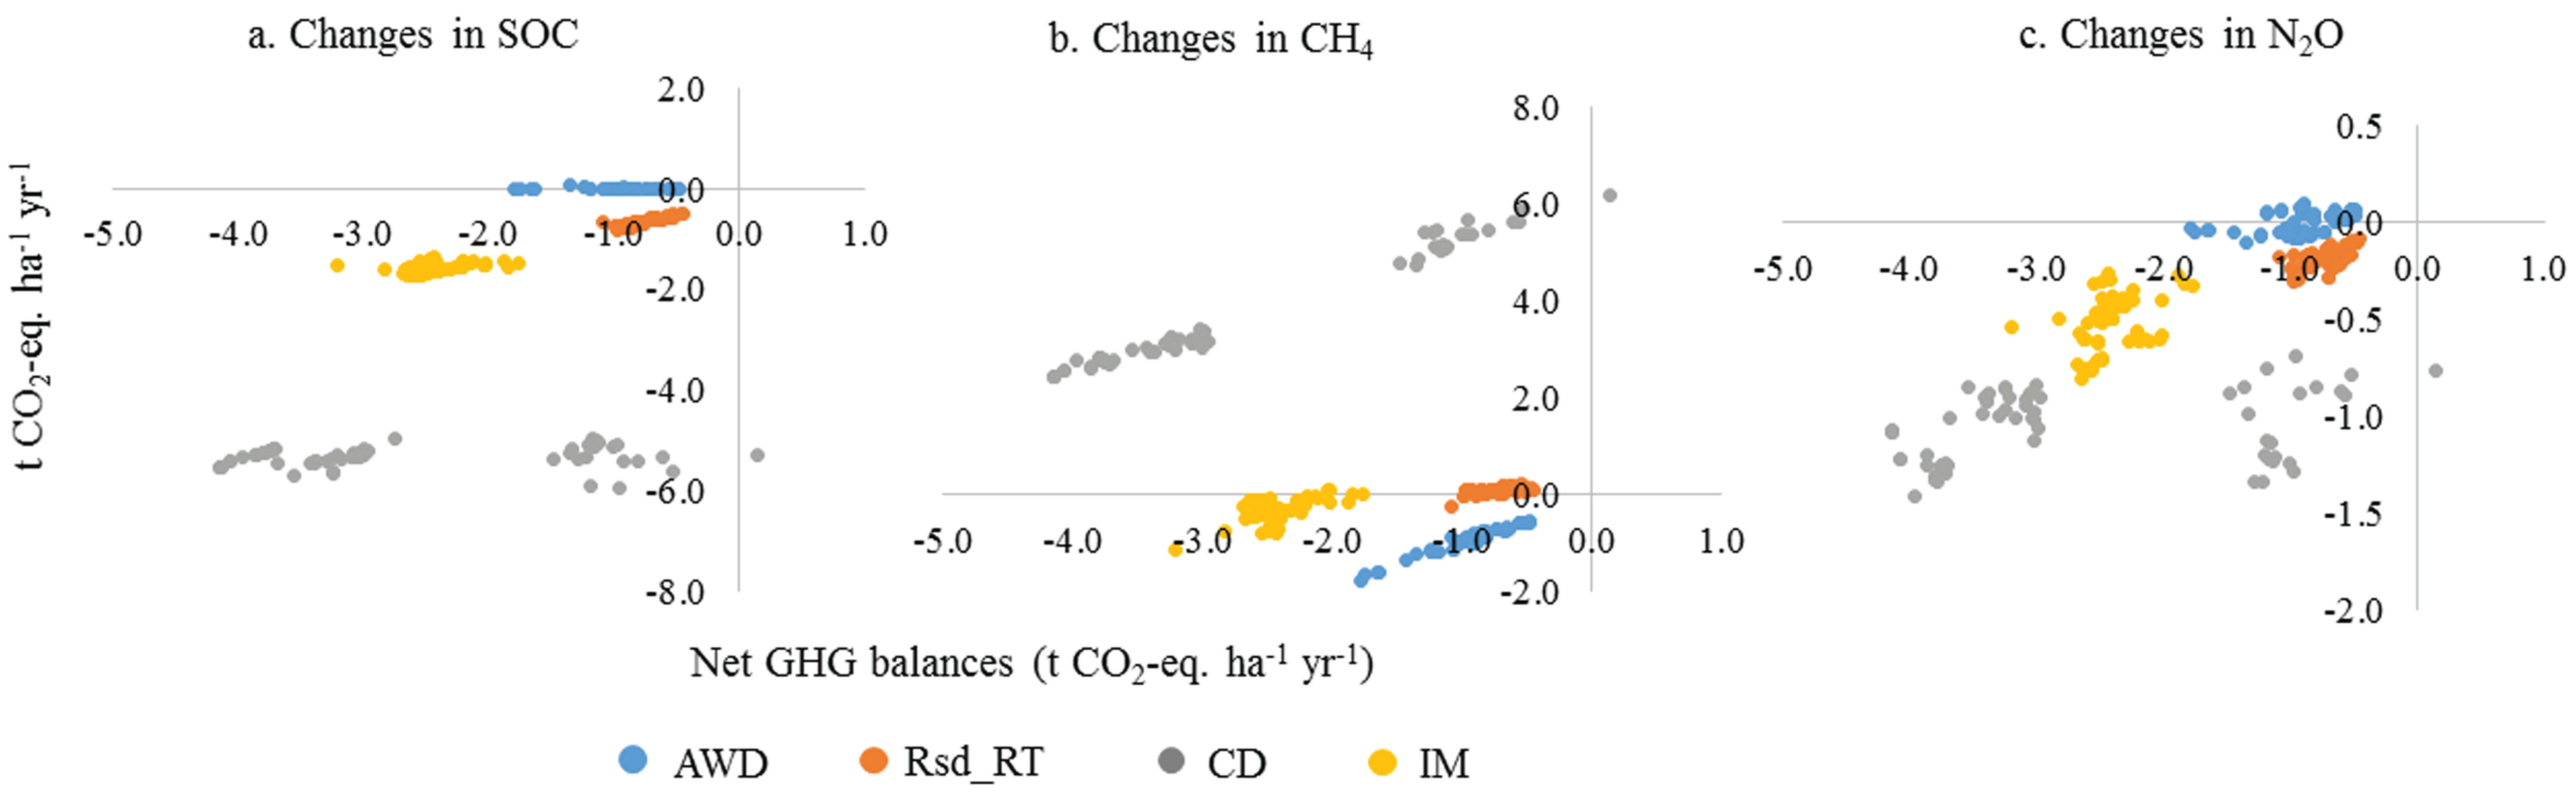
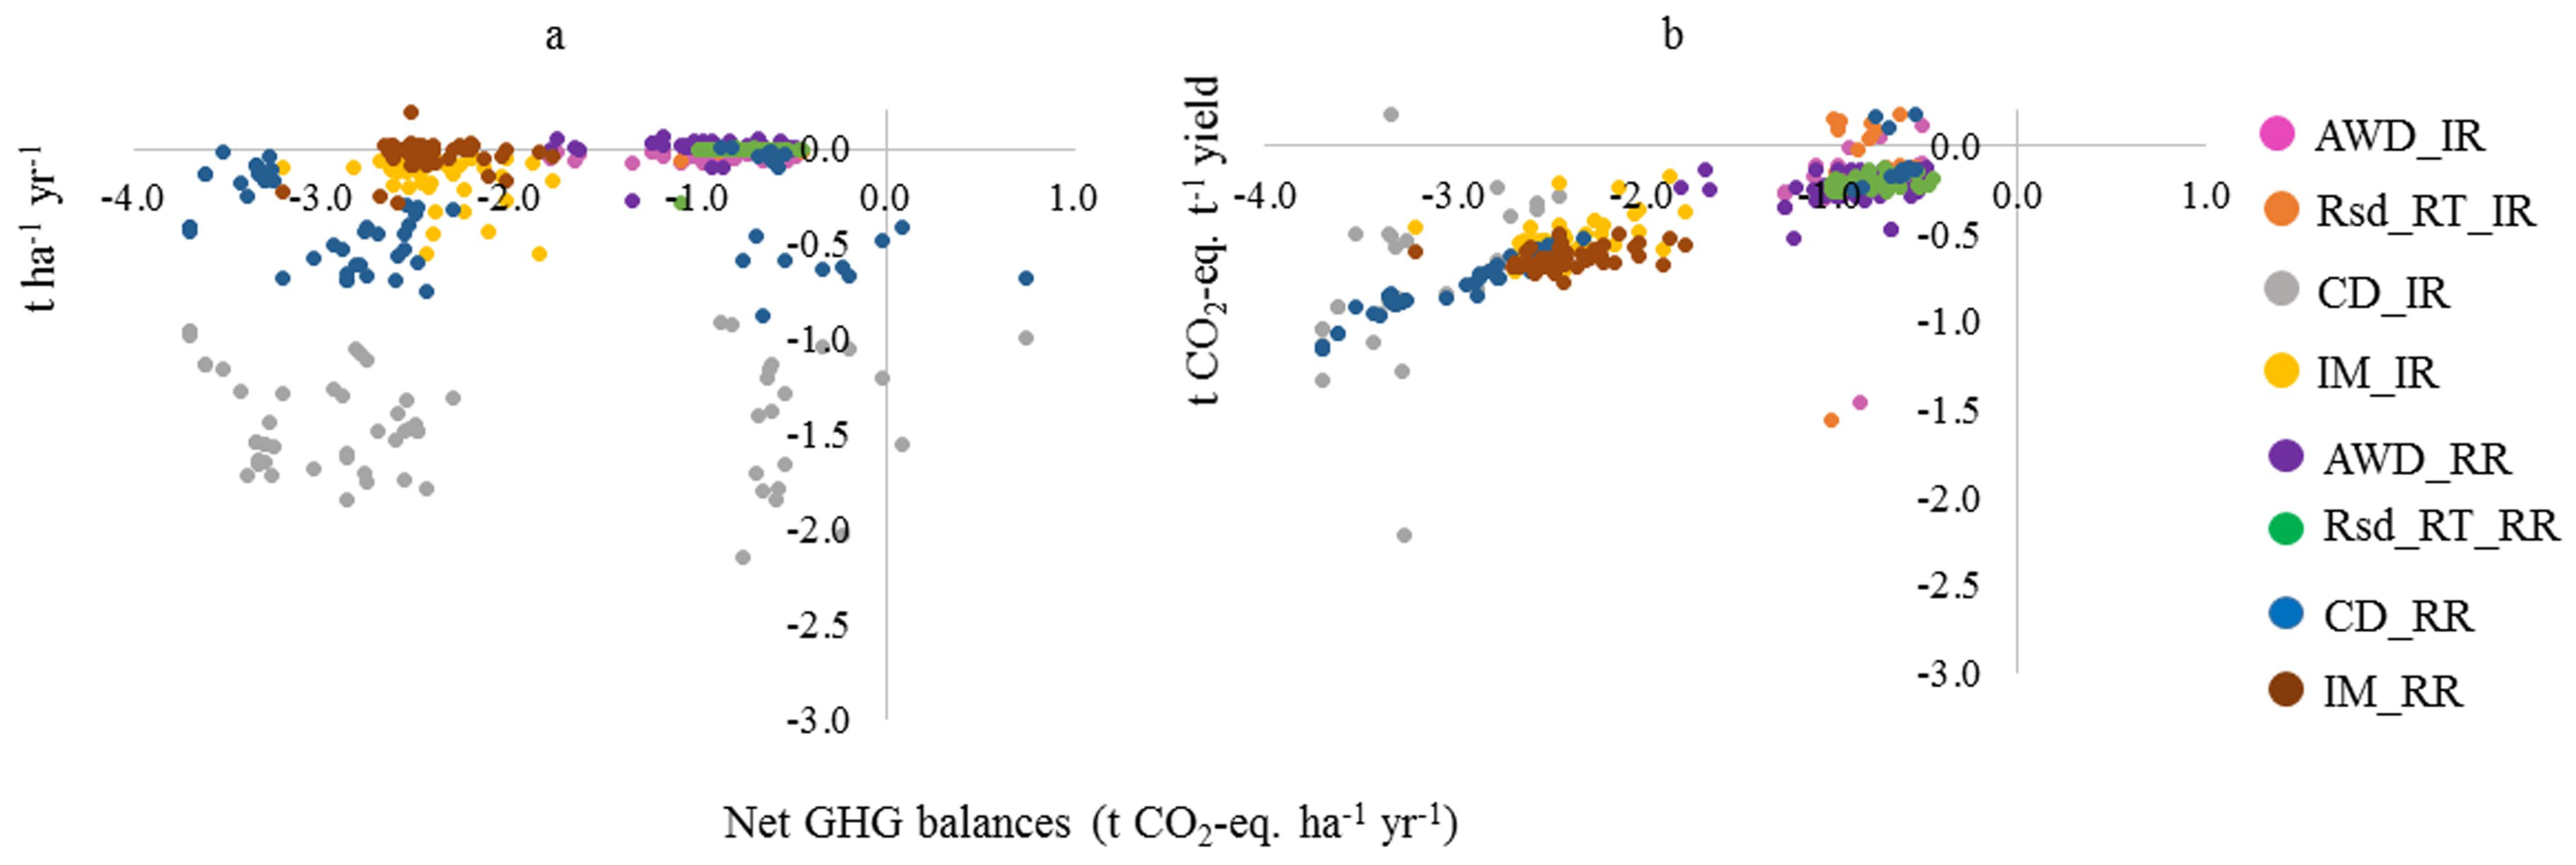
  • Water management: Alternate wetting and drying (AWD).
  • Residue and tillage management: 15% residue return coupled with reduced tillage (Rsd_RT). For RT, no puddling was done but soils were saturated overnight for softening of the soil prior to transplanting. Transplantation was done with less disturbance (low intensity tillage) to the top soil in place of traditional ploughing. In case of RT, soils were saturated overnight for softening, 4–6 cm wide and 5–6 cm deep tilled zones were prepared (that preserved about 75–80% of untilled soil) by 2 wheel tractor mounted Versatile Multi Crop Planter (VMP) with a row spacing of 20 cm [52].
  • Manure management: substitution of baseline mineral N with a cow dung equivalent to approximately 14 t ha−1 manure. Cow dung expressed in this paper as CD or simply as manure, composition is 1.33% N with C/N ratio 31.50 [53].
  • Integrated management (IM): Combination of AWD in Boro rice, Rsd_RT, CD with 40% less N, coupled with 15% less mineral N fertilizer compared to the current rate.
For the two cropping seasons, the mitigation practices were implemented for the irrigated rice season, based on information found in the literature [43,44]. Manure was applied before transplanting irrigated rice to the field and the AWD management was applied.
Management in the baseline was constant from 1996 to 2015, while for the alternative scenarios, one management practice was modified relative to the baseline conditions and a number of practices were changed for the integrated management scenario. The equation for GHG emission and emission intensity was estimated using the approach of [4]. For quantification of the mitigation potential, annual SOC changes were calculated as the difference between the final SOC for the mitigation scenario and the final SOC for the baseline scenario, divided by the number of years in the projection. Mean GHG emissions (CH4 and N2O) between 1996 and 2015 were calculated for mitigation and baseline management. The net GHG balances were (t CO2-eq. ha−1 year−1) estimated using global warming potential (GWP) (CO2-eq.) over a 100-year time span [53] with the following equation.
GHG = (25 ×[CH4]) + (298 ×[N2O] + (−3.667 × ∆SOC))
where GHG is the net balance in t CO2 eq. ha−1 year1 and ∆SOC is the SOC change in t CO2-eq. ha−1 year1. The final SOC value in a particular mitigation management scenario was deducted from baseline management and then divided by time (here 20 years). The GWP for CH4 and N2O are 25 and 298 over a 100-year time span [54]. Positive values represent increased net GHG balances or decreases in SOC sequestration (removal of CO2), negative values represent an increase in SOC sequestration or a decrease in GHG emissions. Net GHG balances were obtained by deducting emissions under mitigation management from those under baseline GHG emissions using the following equation and expressed in t CO2 eq. ha−1 year1.
∆GHG = (GHGMiti − GHGBL)
where ∆GHG is the change of emissions associated with different management options. GHGMiti is the value for emissions under the mitigation scenario and GHGBL is the values for baseline emissions. Negative values suggest an alternative scenario could mitigate GHG emissions; positive values indicate that they increase GHG emissions relative to the baseline. GHG emission intensity values were also calculated so that the combined impact of management change on both yield and GHG emissions could be evaluated using the following equation.
GHGI = GHG/yield
where GHGI is the GHG emission intensity (t CO2 eq. t1 yield), GHG is the net GHG balance (t CO2 eq. ha−1 year1) and yield denotes simulated crop production (t ha−1 year1). The changes in GHGI under different mitigation options compared to those under the baseline were calculated to determine net mitigation potential of the selected mitigation measures using the following equation.
∆GHGI = (GHGIMiti − GHGIBL)
where GHGIMiti and GHGIBL denote GHG emission intensities under mitigation and baseline management, respectively.
For the extrapolation of results to a district, the modelled output, for example, annualized SOC stock changes, N2O and net GHG balances, was multiplied by total rice area harvested for irrigated and rainfed rice, respectively (the area covered with Sundarbans and reserved forest has been excluded) [18]. Based on the findings of Khan and Saleh [25], CH4 emissions for irrigated rice seasons were approximately 3 times greater to that of rainfed rice season. Therefore, on extrapolation, 75% of total emissions simulated by the model was multiplied separately by the irrigated rice harvested area and 25% with rainfed rice harvested area. The results of CH4 emissions for individual cropping season was then summed to get total CH4 emissions from respective districts.

3. Results

Among the selected management, AWD has negligible impact on SOC increase therefore, the contribution of net balances due to increase SOC was minimal (Figure 1a). AWD management contribute to reduced overall balances, approximately −0.90 t CO2-eq. ha−1 year−1, by reducing CH4 emissions (up to 20% to those under baseline management) (Figure 1b). Changing water management only in the irrigated rice had a negligible impact on overall N2O emissions (±5%) (Figure 1c). SOC sequestration under the management of Rsd_RT, averaged −0.67 t CO2-eq. ha−1 year−1, which is nearly 10% higher than SOC under baseline management. Net balances associated with this management led to a change in net GHG emissions of −1.09 t CO2-eq. ha−1 year−1. On average, CH4 emissions increased slightly by 3% with improved Rsd_RT but its contribution to net GHG balance was small. Nitrous oxide emissions with Rsd_RT decreased on average by −0.20 t CO2-eq. ha−1 year−1, which is about a 10% reduction of GHG emissions relative to the baseline. Among the selected scenarios, SOC changes were the greatest under manure application (CD). Although the SOC stocks varied slightly by region (−4.97 to −5.93 t CO2-eq. ha−1 year−1) (removal of CO2), the net GHG balance was found to be between 0.14 to −4.14 t CO2-eq. ha−1 year−1, with most values clustered between >−1.5 and <−2.5 t CO2-eq. ha−1 year−1, under this management. In contrast to AWD management, Application of CD to rice fields increased CH4 emissions up to 60% compared to baseline conditions, ranging from 2.45 to 6.19 t CO2-eq. ha−1 year−1. N2O emissions decreased up to 60% with CD management, which is in the range between −0.68 and −1.41 t CO2-eq. ha−1 year−1, with an average of −1.07 t CO2-eq. ha−1 year−1. This led to an overall decrease in net GHG emissions for the CD scenario (Figure 1c). Integrated management increased SOC stocks by 34%, ranging between −1.27 and −1.73 t CO2-eq. ha−1 year−1, with an average of −1.59 t CO2-eq. ha−1 year−1. Overall, net GHG balances under IM were observed to be −1.77 to −3.20 t CO2-eq. ha−1 year−1 with an average of −2.43 t CO2-eq. ha−1 year−1. Practising IM decreased CH4 emissions by 4%. Nitrous oxide emissions were reduced up to 30% under IM, which contributes to net GHG balances ranging from −0.81 to –0.26 t CO2-eq. ha−1 year−1, with an average of −0.53 t CO2-eq. ha−1 year−1. Overall decreases in net GHG balance under IM were attained by increasing SOC sequestration and decreasing CH4 and N2O emissions. The overall net GHG balances were reduced with all four alternative management scenarios, except for one region under the management associated with manure application.
Although net balances were negative, the use of manure in place of mineral N fertilizer reduced yield by more than half (Figure 2a). In contrast, yield under water and residue management remained stable, with a reduction of net GHG balance. On average, a slight crop yield reduction was observed (<3%) during the first growing seasons under IM. The yield-scaled emission intensity decreases for both growing seasons under this integrated approach (Figure 2b).
Overall, the variation in SOC sequestration rate under IM across the entire country ranges from −1.37 to −1.73 t CO2-eq. ha−1 year1. Relatively lower SOC increases (up to −1.5 t CO2-eq. ha−1 year1) were observed in northern and south-western parts of Bangladesh as presented in Figure 3a. However, there was more than an 85% increase in SOC content, estimated to be greater than −1.5 t CO2-eq. ha−1 year1 in other regions. Methane emission reductions were lower in south-western districts compared to other parts of the country (Figure 3b), whereas the opposite trend was observed for N2O emissions (Figure 3c). Overall, net GHG emissions were reduced under IM by over −2 t CO2-eq. ha−1 year1, except in one district located in northern sites—Jamalpur—and three districts located in the south and central regions—Patuakhali, Cox’s bazar and Narsingdi (Figure 3c).
On the basis of total SOC changes estimated for each district, relatively higher (>−0.6 Tg CO2-eq. year−1) SOC sequestration rates were estimated in central (Mymensingh) and northern districts (Bogra, Dinajpur), while relatively lower SOC changes (−0.05 Tg CO2-eq. year−1) were observed in the south (Rangamati, Bandarban) of Bangladesh (Figure 4a). Similar trends were found for net GHG balance for each district (Figure 4b). Net GHG balances of about −0.8 Tg CO2-eq. year−1 were estimated for northern and central regions compared to −0.05 Tg CO2-eq. year−1 in the south.
Total change in SOC stocks, N2O and CH4 emissions and overall GHG balances for all mitigation options (in CO2-eq. year−1) are summarized in Figure 5. For the whole rice area, it is projected that around −16 Tg CO2-eq. year1 could be sequestered in soils under IM. AWD and IM practices tend to reduce CH4 emissions by nearly −4 Tg and −2 Tg (CO2-eq. year−1), which is 12% and 6% less than baseline emissions, respectively. Adoption of IM reduced N2O emissions by nearly −5 Tg CO2-eq. year1, which is 28% lower than emissions under current baseline conditions. Overall, a net reduction of GHG emissions was estimated for all four selected mitigation options. These were greatest for CD (−29 Tg CO2-eq. year1) and IM (−24 Tg CO2-eq. year−1). Based on the simulations, on average, around 40 Mt rice is produced under current management from both rice growing seasons which is close to the reported values for the year 2015–2016 of 35 Mt [18]. Rice production for the selected mitigation options was about the same as the baseline, except under CD management, which reduced rice production by 20% (not presented).

4. Discussion

Our analysis suggests there is potential to reduce net GHG emissions in double rice cropping systems in Bangladesh by increasing SOC or reducing non CO2 GHGs by modifying current agricultural practices. SOC sequestration can be increased by organic amendments, for example, residue return, manure amendments, or in combination. Non-CO2 GHG mitigation is possible through improved water and manure management. Without increasing SOC, a meta-analysis in Chinese rice-based cropland GHG emissions could be reduced by approximately 1 t CO2-eq. ha−1 year−1 under reduced water management [1] and this result is consistent with our findings (0.90 t CO2 eq. ha-1 year−1). However, our results suggest lower N2O emission reductions with AWD estimated at 0.01 t CO2 eq. ha−1 year−1, compared to 0.8 t CO2 eq. ha−1 year−1 of N2O emissions reductions reported for Chinese rice cropland [1]. Irrigated rice fields have N2O emissions approximately 36% higher than emissions under CF conditions in DayCent simulations [36]. In this study, by observing N2O emissions separately for both growing seasons, simulated N2O emissions under irrigated rice, where AWD was applied only for this season, increased by 40% compared to CF conditions (not shown) but no change (or a reduction of 10%) was observed during the second cropping season. Therefore, compared to baseline, the impact of AWD management on N2O emissions was lower when calculated as the total emissions for both growing seasons. Mitigation associated with residue return and reduced tillage management increased CH4 emissions but this effect was offset by increasing SOC and reduced N2O emissions. The simulated increase in SOC of −0.67 t CO2-eq. ha−1 year−1 is in agreement with the IPCC suggested value of −0.70 t CO2-eq. ha−1 year−1 for croplands in the warm moist climatic region [6]. In Chinese rice soils, application of rice straw increased overall GHG emissions whereas reduced tillage led to reduced GHG emissions (−2 CO2-eq. ha−1 year−1) by increasing SOC and reducing N2O emissions [1].
Based on our modelled outcomes for manure management, climate change mitigation appears to be driven by SOC sequestration, consistent with previous studies [2,13]. Manure application tends to increase SOC and CH4 emissions but reduces N2O emissions, which is in line with the meta-analysis of [1] but the overall reduction in net GHG emissions in our simulations contrasts to increasing net GHGs found in other experimental and modelling studies [1,6,55]. The greater SOC sequestration with manure application suggested by our study is around 5 times greater than the estimate provided for Chinese rice systems [1] and is the underlying reason for a net reduction in GHG emissions. The amount, type and C/N ratio of manure has a large impact on SOC dynamics and GHG emissions [1,53]. For our study, approximately 14 t ha−1 of manure was equivalent to mineral N application for the baseline management. Prolonged submergence due to double rice cultivation may also contribute to increases in SOC, by reducing the decomposition rate of SOM [56].
Similar results were obtained for IM for Bangladesh as the Chinese study of rice-based cropland (−0.19 to −1.70 t CO2-eq. ha−1 year−1) [4] and from the meta-analysis of Chinese studies (−0.21 to −1.42 t CO2-eq. ha−1 year−1) [1]. The mitigation potential in our study is a higher because improved water management was applied in only one season. The mitigation potential in our study is a little higher because the overall changes of N2O emissions for two rice growing seasons under improved water management was minimal compared to baseline emissions. Under IM management, our results suggest a reduction in both N2O and CH4 emissions (CH4 emissions reduced −0.31 t CO2-eq. ha−1 year−1) and an increase in SOC sequestration. Whereas combined application of chemical fertilizer and livestock manure under reduced water conditions in China suggested an increase in CH4 emissions of, on average, 0.65 t CO2-eq. ha−1 year1 [4]. The reduction in N2O emissions for IM in Bangladesh (−0.53 CO2-eq. ha−1 year−1) was greater than the reduction reported for Chinese rice croplands (−0.2 CO2-eq. ha−1 year1) [4].
Food security is a critical issue for a developing country like Bangladesh so we also assessed yield impacts of different management practices. The simulated yield under current management in different districts was estimated to range between 3.9 and 4.8 t ha−1 year1, with average of 4.3 t ha−1 for irrigated rice and 2.7–3.8 t ha−1 year1 with an average of 3.1 t ha−1 year1 for rainfed rice. The values were close to reported yields from the Bangladesh Bureau of Statistics [18], which are 2.1–4.5 t ha−1 year−1 with an average of 3.97 t ha−1 year−1 for irrigated rice and 1.3–3.0 ha−1 year−1 with an average of 2.4 t ha−1 year−1 for rainfed rice, in 2015–2016 [18]. The yield predicted by DayCent under manure application with N substitution was half that of the baseline yield, due to less N mineralization available for crop uptake [35], so manure application alone cannot be considered as an effective option. Besides, it would be challenging to apply only manure at the high rates in the field that were simulated because there is not enough manure available to cover vast cultivated areas and there are other uses for cow dung in Bangladesh, including fuel and biogas [15,57]. Under IM, simulated values of yield in the first growing season in some regions were slightly lower but yield scaled GHG intensity appeared to be reduced for both cropping seasons compared to baseline conditions. A 12–20% yield reduction under integrated management for rice was reported for China [4] but the GHG emission intensity was also reduced in all regions. When considering impacts on improving soil quality, mitigating GHGs and maintaining yields, IM appears to be the best approach among the mitigation scenarios.
Application of IM to all districts increases SOC sequestration and reduces net GHG emissions. Relatively smaller changes in some parts of northern and south-western regions can be attributed to soil type. Our model results showed that higher sand content >30% and lower clay (<20%) in those regions leads to smaller gains in SOC under IM practices. Relatively larger changes in SOC also occur in the region associated with lower sand (<10%) and higher clay (>45%) content in some parts of the south-western region. The result is consistent with Six et al. [58] who described the importance of the silt and clay protected C for SOM stabilization. In addition, low initial SOC contents (located in northern and central site) showed greater than average (up to 50%) SOC sequestration potential, consistent with previous findings [11,13,57].
Initially, CH4 emissions in sandy soils in the northern region were higher with baseline management but adoption of the IM leads to reduced emission from those sites. However, the absolute changes of CH4 in one district, Jamalpur, with the soil sand content <20%, shows the maximum reduction potential (−1.12 t CO2 eq. ha−1 year−1), which we attribute to the rainfall distribution following additional model tests. For instance, total rainfall in Jamalpur is only 140 cm, less than the average rainfall in Bangladesh, with relatively lower rainfall observed at the pre-harvesting stage of boro rice and therefore AWD practices have a large impact in this region. In contrast, the south (e.g., Cox’s bazar) receives annual rainfall of 400 cm. With greater rainfall at the pre harvesting stage of boro rice and with higher sand content (>30%), which leads to enhanced methanogenic activity, AWD was less effective in reducing CH4 emissions. A similar pattern was observed in western parts of the country (e.g., Sirajgonj, Kushtia) and southern parts (e.g., Pirojpur, Patuakhali) where rainfall exceeds 300 cm. Soil type also impacts CH4 emissions with manure management. Overall, our results suggest that soil texture and water status are important in determining CH4 emissions and the effectiveness of management changes to reduce emissions, similar to field studies [45,59,60,61].
Lower sand and higher clay content leads to higher N2O emissions under current baseline conditions, while reduced mineral N fertilizer associated with manure application under IM leads to reduced emissions. Based on the total harvested rice area in each district, a relatively higher SOC sequestration potential is observed for northern and central Bangladesh, whereas a relatively lower mitigation potential is observed for western and south eastern parts of Bangladesh, due to smaller areas of rice cultivation. Similar patterns are also found for net GHG balances, since SOC sequestration is the dominant factor in the overall net GHG balance.
The average SOC sequestration rate under adoption of IM was 0.43 t C ha−1 year1. This estimate is slightly higher than the value given in Smith et al. [6] for nutrient and agronomic management for the warm-moist cropland region (−0.003–0.35 t C ha−1 year1) and slightly higher than 0.2–0.3 t C ha−1 year1 for Bangladeshi soils under adoption of management practices suggested by Lal [10]. It is slightly lower than the value reported for China under combined treatment of inorganic fertilizer and manure application practised in dry cropland and paddy soil of 0.62–0.89 t C ha−1 year1 [13]. Our modelled estimates are comparable with estimated SOC sequestration potentials of 0.21–0.50 t C ha−1 year−1 in Indian paddy rice [7,62]. To achieve the targets of the “4 per mille” initiative arising from the Paris Climate Agreement, a SOC gain of 4 parts per thousand (=0.4%) is approximately equivalent to an annual increase in SOC of 0.11 t C ha−1 year1 [13]. Our results suggest that this goal could be achieved with modification only of current tillage and residue management practices (0.18 t C ha−1 year1). The sequestration rate achieved under IM across all rice croplands in Bangladesh would be equivalent to 10–26 parts per thousand at 0–15 cm depth, which is higher than the rates for dry cropland and paddy soils in China at 0–15 cm depth of 7–11 parts per thousand [13]. In the UK, the Broadbalk long term (>150 years) winter wheat experiment, where farmyard manure has been applied at a rate of 35 t ha−1 year1, showed average annual increases in SOC of 43 parts per thousand to 23 cm depth during the first 20 years and remained at 7 parts per thousand for 40–60 years [14].
Estimates of CH4 emissions by DayCent are 1.29 Tg (32 Tg CO2-eq. ha−1 year1) from Bangladesh rice field, which is higher the values estimated by [25] using CH4MOD2.5 but similar to the values reported by FAOSTAT of 1.17 Tg [17]. Yan et al. [63] report a value of 1.66 Tg and Manjunath et al. [64] report a value of 1.22 Tg. Khan and Saleh [25] estimated emissions of 1.07 Tg from 7 Mha rice harvested area in Bangladesh using IPCC default emission factors (EF) for CH4 and country specific EFs for organic amendments and water management. The lack of consistency in CH4 emissions may be due to differences in methodological approach, consideration of water status for both cropping seasons and assumptions about organic amendments and other factors. For instance, Khan and Saleh [25] based the agronomic information and management activity on focus group discussions. In contrast, Manjunath et al. [64] used remote sensing and GIS approaches to determine CH4 emissions. Seasonally integrated fluxes for CH4 emission factors for Bangladesh were derived from Indian emission factors on the basis of similarity between the rice cultural type and cropping calendar between India and Bangladesh. In contrast, the FAOSTAT estimates are based on a simple EF of 9.94 g m−2, without considering scaling factors or EFs and simulated emissions in DayCent were based on the influence of diverse soil types, climatic variability and soil organic amendments. Further analysis of CH4 and N2O emissions could be conducted in the future to improve estimates for Bangladesh. IM
Uncertainty in our modelled results arises from the fact that Bangladesh very often faces other natural challenges that affect rice areas differently, such as drought, flooding, salinity intrusion, soil erosion, land degradation, formation of plough pan, all of which adversely affect the land use pattern in Bangladesh [15] and are not represented in the DayCent simulations. For example, six severe floods occurred in Bangladesh from 1984–2007 [65]. Further, many croplands in the southern coastal area have been converted to shrimp culture fields and are no longer suitable for crop production due to salinity intrusion. Another issue might be the initialization of the model with data that were extrapolated from 15 cm to the 20 cm data that was simulated by DayCent. Generally, pH, SOM and soil texture were estimated in Bangladesh soil up to 15 cm depth, therefore we compared the SOC values by adjusting modelled output to a similar depth. It is stated here that, Previous long term analysis on SOC stock calculations were done by adjusting standard soil weight or by adjusting model outputs due to changing BD [35]. Bulk density cannot be altered during model simulations [35]. Without adjusting modelled SOC stock, DayCent (DailyDayCent) was applied in the plot receiving manure from the period of 1843 onwards on the well-documented long term Rothamsted Broadbalk monoculture wheat site and a highly significant positive relationship between modelled and measured SOC was found (r = 0.87), without significant bias [28,35]. Bulk density in Bangladesh rice soils is shown to change by approximately 20% in the manure applying filed [35]. However, applying DayCent with fixed BD in that test sites showed a highly significant correlation between model and measured SOC [35]. Their modelling experiment revealed that changing BD will not have greatly changed SOC, confirming earlier finding with the same model [28] and can therefore be used to predict SOC changes and emission reductions under various combinations of management practices. Further refinement is possible with collection of new data on soil characteristics.
The limitations to changes in current agricultural practices and implementation of alternative management practices, listed for temperate regions by Poulton et al. [14] are also applicable, partially or fully, for developing countries like Bangladesh. For instance, cow dung has alternative uses as previously mentioned. Additionally, if a proportion of the cow dung is already applied to cropland, then SOC increases would not be possible. Similarly, crop residues are used for fuel and fodder for animals. Furthermore, we assume that equal amount of residue left in the field after the harvesting of rice in both growing seasons, whereas around 50% lower residues were found after harvesting of rainfed rice compared to irrigated rice, due to variation of the gap between the growing seasons and active decomposition processes [25]. Ultimately, the decision about incorporating residues left in the field depends upon labour cost, distance of the field from the house and water status of the field after harvesting [66]. Farmers sometimes burn residues in the field and the decision to burn mainly depends on the distance of the field, residue price and height and quality of residues [66]. These decisions will influence the potential for mitigation through improved residue management.
There are also other mitigation strategies that need further investigation, such as deep placement of urea instead of application using the broadcast method [67], biochar application, or a change in the composition of mineral fertilizer to increase yields while reducing N2O emissions [45]. Future studies can build upon our analysis and investigate these options for rice systems in Bangladesh.
In our study, the cost of mitigation actions are not considered but due to cheap labour costs and water savings, the options are likely to be cost effective. To maintain or increase yield while reducing GHG emissions through SOC sequestration, it is crucial to maintain the improved management for at least 20 years and to maintain it thereafter, which might be challenging for small farm holders [68]. Initial costs are likely to be higher due to the need for weeding but overall labour costs could decrease compared to traditional systems [69]. This approach will also lead to water savings, which may be important as the climate continues to change in Bangladesh [23].
The study focussed on SOC sequestration and GHG mitigation potential along with yield for the first time for rice based agriculture in Bangladesh. We tested the model against long term data and showed that model performance is adequate. We then used the model to explore management options to increase SOC stocks and mitigate climate change—and discuss the limitations in the discussion. Both single and combined approaches were considered to determine the most effective scenario. As food security is the main issue in such a densely-populated country, the modelled study pointed out the best management option whilst also considering yield. Although there is data limitations on measured SOC, we used the best (and only) long term data available for rice sites in Bangladesh where the model was applied. AWD, one of the most important strategies for Bangladeshi rice systems, was tested by DayCent at one of these sites. However, applying AWD over large areas is limited by soil type and rainfall. Uncertainties can be reduced in the future with further data collection and application of optimization but this is not possible with the limited data currently available in Bangladesh. Our results could be considered as preliminary until further evidence is gathered. Clearly, further study and refinement is needed if farmers and the government decide to pursue these mitigation options as part of policy programmes to reduce emissions, such as a programme to contribute emission reductions to international efforts such as the Paris Agreement. However, this study acts as a starting point for further research in this area.

5. Conclusions

Applying the process-based agroecosystem model DayCent in Bangladesh, a rice dominated country, shows that there is scope to reduce net GHG emissions from the agriculture sector. SOC sequestration is the main component in the net GHG emission reduction, followed by CH4 reductions. Because trade-offs can exist between different GHGs, SOC sequestration and impacts on CH4 and N2O emissions need to be considered together over the long term. Along with net GHG balances, this study also considered the impact on crop yield. We found that DayCent is a useful tool to evaluate variation in mitigation potentials across Bangladesh. Spatial variability in SOC sequestration rates and CH4 and N2O emissions was driven mainly by soil properties and climatic variability. There is scope to improve model estimation by considering water level and land type to accurately estimate of SOC and CH4 emissions. The simulated impact of methanogens for different land types, as well as in different growing seasons, could help to improve the estimation of CH4 emissions and thereby overall GHG balances. This paper reports the first application of a process based model for predicting net GHG emissions and mitigation potentials under different management in a sub-tropical rice-dominated country, Bangladesh. This study could provide a basis for improving the national GHG inventory and a mitigation management strategy at national level for paddy rice systems, which could be further improved with new field measurements and additional high resolution spatial datasets.

Author Contributions

Conceptualization, all authors.; Methodology, K.B., J.Y., M.K. and P.S.; Formal Analysis, all authors; Investigation, all authors; Writing-Original Draft Preparation, K.B.; Writing-Review & Editing, all authors; Supervision, P.S., M.K., J.Y.; Project Administration, P.S.; Funding Acquisition, K.B. and P.S.

Funding

This research was funded by Bangabandhu Fellowship on Science and ICT project, Ministry of Science and Technology, People’s Republic of Bangladesh.

Acknowledgments

We are grateful to the model developers at the Natural Resource Ecology Laboratory, Colorado State University for providing the new version of the DayCent model and assisting with its application.

Conflicts of Interest

The authors declare no conflicts of interest.

References

  1. Nayak, D.; Saetnan, E.; Cheng, K.; Wang, W.; Koslowski, F.; Cheng, Y.; Zhu, W.Y.; Wang, J.; Liu, J.; Moran, D.; et al. Management opportunities to mitigate greenhouse gas emissions from Chinese agriculture. Agric. Ecosyst. Environ. 2015, 209, 108–124. [Google Scholar] [CrossRef] [Green Version]
  2. Smith, P.; Martino, D.; Cai, Z.; Gwary, D.; Janzen, H.; Kumar, P.; McCarl, B.; Ogle, S.; O’Mara, F.; Rice, C.; et al. Agriculture. Chapter 8 of Climate Change 2007: Mitigation. In Contribution of Working Group III to the Fourth Assessment Report of the Intergovernmental Panel on Climate Change; Cambridge University Press: Cambridge, UK; New York, NY, USA, 2007. [Google Scholar]
  3. Stocker, T. Climate Change 2013: The Physical Science Basis: Working Group I Contribution to the Fifth Assessment Report of the Intergovernmental Panel on Climate Change; Cambridge University Press: Cambridge, UK; New York, NY, USA, 2014. [Google Scholar]
  4. Cheng, K.; Ogle, S.M.; Parton, W.J.; Pan, G. Simulating greenhouse gas mitigation potentials for Chinese Croplands using the DAYCENT ecosystem model. Glob. Chang. Biol. 2014, 20, 948–962. [Google Scholar] [CrossRef] [PubMed]
  5. Lal, R. Beyond COP 21: Potential and challenges of the “4 per Thousand” initiative. J. Soil Water Conserv. 2016, 71, 20A–25A. [Google Scholar] [CrossRef]
  6. Smith, P.; Martino, D.; Cai, Z.; Gwary, D.; Janzen, H.; Kumar, P.; McCarl, B.; Ogle, S.; O’Mara, F.; Rice, C.; et al. Greenhouse gas mitigation in agriculture. Philos. Trans. R. Soc. Lond. B Biol. Sci. 2008, 363, 789–813. [Google Scholar] [CrossRef] [PubMed] [Green Version]
  7. Nayak, A.; Gangwar, B.; Shukla, A.K.; Mazumdar, S.P.; Kumar, A.; Raja, R.; Kumar, A.; Kumar, V.; Rai, P.; Mohan, U. Long-term effect of different integrated nutrient management on soil organic carbon and its fractions and sustainability of rice–wheat system in Indo Gangetic Plains of India. Field Crop. Res. 2012, 127, 129–139. [Google Scholar] [CrossRef]
  8. Babu, Y.J.; Li, C.; Frolking, S.; Nayak, D.R.; Adhya, T. Field validation of DNDC model for methane and nitrous oxide emissions from rice-based production systems of India. Nutr. Cycl. Agroecosyst. 2006, 74, 157–174. [Google Scholar] [CrossRef]
  9. Wang, Y.; Hu, N.; Xu, M.; Li, Z.; Lou, Y.; Chen, Y.; Wu, C.; Wang, Z. 23-year manure and fertilizer application increases soil organic carbon sequestration of a rice–barley cropping system. Biol. Fertil. Soils 2015, 51, 583–591. [Google Scholar] [CrossRef]
  10. Lal, R. Soil carbon sequestration impacts on global climate change and food security. Science 2004, 304, 1623–1627. [Google Scholar] [CrossRef] [PubMed]
  11. Xu, S.; Shi, X.; Zhao, Y.; Yu, D.; Li, C.; Wang, S.; Tan, M.; Sun, W. Carbon sequestration potential of recommended management practices for paddy soils of China, 1980–2050. Geoderma 2011, 166, 206–213. [Google Scholar] [CrossRef]
  12. Chabbi, A.; Lehmann, J.; Ciais, P.; Loescher, H.W.; Cotrufo, M.F.; Don, A.; SanClements, M.; Schipper, L.; Six, J.; Smith, P.; et al. Aligning agriculture and climate policy. Nat. Clim. Chang. 2017, 7, 307–309. [Google Scholar] [CrossRef]
  13. Minasny, B.; Malone, B.P.; Mcbratney, A.B.; Angers, D.A.; Arrouays, D.; Chambers, A.; Chaplot, V.; Chen, Z.; Cheng, K.; Das, B.S.; et al. Soil carbon 4 per mille. Geoderma 2017, 292, 59–86. [Google Scholar] [CrossRef] [Green Version]
  14. Poulton, P.; Johnston, J.; MacDonald, A.; White, R.; Powlson, D. Major limitations to achieving “4 per 1000″ increases in soil organic carbon stock in temperate regions: Evidence from long-term experiments at Rothamsted Research, UK. Glob. Chang. Biol. 2018, 24, 2563–2584. [Google Scholar] [CrossRef] [PubMed]
  15. Huq, S.I.; Shoaib, J.M. The Soils of Bangladesh; Springer: Dordrecht, The Netherlands; Heidelberg, Germany; New York, NY, USA; London, UK, 2013; Volume 1, ISBN 978-94-007-1127-3. [Google Scholar] [CrossRef]
  16. MOEF. Ministry of Environment and Forest. Government of the People’s Republic of Bangladesh, Dhaka. Bangladesh. 2016. Available online: http://www.moa.gov.bd/site/page/4fb627c0-d806-4a7e-a1cd-b67d4bc85159/Bangladesh-Agriculture-at-a-Glance (accessed on 28 March 2018).
  17. FAOSTAT. Food and Agriculture Organization of the United Nations. 2018. Available online: http://www.fao.org/faostat/en/#data/ (accessed on 2 April 2018).
  18. BBS. Yearbook of Agricultural Statistics. 28th Series. Bangladesh Bureau of Statistics. Statistics and Informatics Division, Ministry of Planning. Government of the People’s Republic of Bangladesh. 2016. Available online: www.bbs.gov.bd (accessed on 20 December 2017).
  19. FRG. Fertilizer Recommendation Guide, Bangladesh Agricultural Research Council (BARC), Farmgate, Dhaka 1215. 2016. Available online: http://www.barc.gov.bd (accessed on 20 March 2018).
  20. Jilani, T.; Hasegawa, T.; Matsuoka, Y. The future role of agriculture and land use change for climate change mitigation in Bangladesh. Mitig. Adapt. Strateg. Glob. Chang. 2015, 20, 1289–1304. [Google Scholar] [CrossRef]
  21. MOEF. Intended Nationally Determined Contributions (INDC); Ministry of Environment and Forests, Government of the People’s Republic of Bangladesh: Dhaka, Bangladesh, 2015.
  22. Hussain, S.K.G.; Rashid, M.A. UNDP. Bangladesh: Third National Communication to the United Nations Framework Convention on Climate Change (UNFCC) Project; Draft Report. Component 3: Programme. Containing Measures to mitigate GHG emission (Project Ref. TNC/2014/03); Centre for Environmental and Geographic Information Services: Gulshan, Dhaka, Bangladesh, 2016. [Google Scholar]
  23. Price, A.H.; Norton, G.J.; Salt, D.E.; Ebenhoeh, O.; Meharg, A.A.; Meharg, C.; Islam, M.R.; Sarma, R.N.; Dasgupta, T.; Ismail, A.M. Alternate wetting and drying irrigation for rice in Bangladesh: Is it sustainable and has plant breeding something to offer? Food Energy Secur. 2013, 2, 120–129. [Google Scholar] [CrossRef] [Green Version]
  24. Nash. Mitigation Co-Benefits of Increased Water and Nutrient Efficiency in Irrigated Rice in Bangladesh. CCAFS LOW Emission Agriculture. 2016. Available online: https://ccafs.cgiar.org/blog/mitigation-co-benefits-increased-water-and-nutrient-efficiency-irrigated-rice-bangladesh#.WrprfMPwbmF (accessed on 12 October 2017).
  25. Khan, R.; Saleh, A.F.M. Model-based estimation of methane emission from rice fields in Bangladesh. J. Agric. Eng. Biotechnol. 2015, 3, 125–137. [Google Scholar] [CrossRef]
  26. Bell, M.; Jones, E.; Smith, J.; Smith, P.; Yeluripati, J.; Augustin, J.; Juszczak, R.; Olejnik, J.; Sommer, M. Simulation of soil nitrogen, nitrous oxide emissions and mitigation scenarios at 3 European cropland sites using the ECOSSE model. Nutr. Cycl. Agroecosyst. 2012, 92, 161–181. [Google Scholar] [CrossRef]
  27. Parton, W.J.; Hartman, M.; Ojima, D.; Schimel, D. DAYCENT and its land surface submodel: Description and testing. Glob. Planet. Chang. 1998, 19, 35–48. [Google Scholar] [CrossRef]
  28. Begum, K.; Kuhnert, M.; Yeluripati, J.; Glendining, M.; Smith, P. Simulating soil carbon sequestration from long term fertilizer and manure additions under continuous wheat using the DailyDayCent model. Nutr. Cycl. Agroecosyst. 2017, 109, 291–302. [Google Scholar] [CrossRef] [Green Version]
  29. Senapati, N.; Chabbi, A.; Giostri, A.F.; Yeluripati, J.B.; Smith, P. Modelling nitrous oxide emissions from mown-grass and grain-cropping systems: Testing and sensitivity analysis of DailyDayCent using high frequency measurements. Sci. Total Environ. 2016, 572, 955–977. [Google Scholar] [CrossRef] [PubMed] [Green Version]
  30. Cameron, D.; van Oijen, M.; Werner, C.; Butterbach-Bahl, K.; Haas, E.; Heuvelink, G.B.M.; Grote, R.; Kiese, R.; Kuhnert, M.; Kros, J.; et al. Environmental change impacts on the C-and N-cycle of European forests: A model comparison study. Biogeosci. Discuss. 2012, 9, 11041–11101. [Google Scholar] [CrossRef]
  31. Parton, W.; Scurlock, J.; Ojima, D.; Gilmanov, T.; Scholes, R.; Schimel, D.S.; Kirchner, T.; Menaut, J.; Seastedt, T.; Garcia Moya, E.; et al. Observations and modeling of biomass and soil organic matter dynamics for the grassland biome worldwide. Glob. Biogeochem. Cycles 1993, 7, 785–809. [Google Scholar] [CrossRef]
  32. Stehfest, E.; Heistermann, M.; Priess, J.A.; Ojima, D.S.; Alcamo, J. Simulation of global crop production with the ecosystem model DayCent. Ecol. Model. 2007, 209, 203–219. [Google Scholar] [CrossRef]
  33. Cheng, K.; Ogle, S.M.; Parton, W.J.; Pan, G. Predicting methanogenesis from rice paddies using the DAYCENT ecosystem model. Ecol. Model. 2013, 261, 19–31. [Google Scholar] [CrossRef]
  34. US EPA. Inventory of US Greenhouse Gas Emissions and Sinks: 1990–2015; United States Environmental Protection Agency: Washington, DC, USA, 2017.
  35. Begum, K.; Kuhnert, M.; Yeluripati, J.; Ogle, S.; Parton, W.; Kader, M.A.; Smith, P. Soil organic carbon sequestration and mitigation potential in a rice cropland in Bangladesh—A modelling approach. Field Crop. Res. 2018. accepted. [Google Scholar]
  36. Begum, K.; Kuhnert, M.; Yeluripati, J.; Ogle, S.; Parton, W.; Williams, S.A.; Pan, G.; Cheng, K.; Ali, M.A.; Smith, P. Modelling greenhouse gas emissions and mitigation potentials in fertilized paddy rice fields in Bangladesh. Agric. Ecosyst. Environ. 2018. under review. [Google Scholar]
  37. Hartmann, M.D.; Parton, W.J.; Del Grosso, S.J.; Hendryx, J.; Hilinski, T.; Kelly, R.; Keough, C.A.; Killian, K.; Lutz, S.; Marx, E.; et al. DayCent Ecosystem Model. User Manual, Scientific Basis, and Technical Documentation; Colorado State University: Fort Collins, CO, USA, 2016. [Google Scholar]
  38. Del Grosso, S.; Parton, W.; Ojima, D.; Keough, C.; Riley, T.; Mosier, A. DAYCENT Simulated Effects of Land Use and Climate on County Level N Loss Vectors in the USA. In Publications from USDA-ARS/UNL Faculty; U.S. Department of Agriculture: Agricultural Research Service: Lincoln, NE, USA, 2008; p. 255. [Google Scholar]
  39. BARC. Bangladesh Agricultural Research Council. Khamar Road, Dhaka, Bangladesh. 2018. Available online: http://maps.barcapps.gov.bd/index.php (accessed on 20 March 2018).
  40. SRDI. Soil Resource Development Institute, Khamar Bari, Dhaka. 2008. [Google Scholar]
  41. BMD. Bangladesh Meteorological Department. Dhaka. 2016. Available online: http://www.bmd.gov.bd/Document/climateofBangladesh.doc (accessed on 14 September 2016).
  42. Asaduzzaman, M.; Qamar Munir, M.; Ghulam Hussain, S.; Khan, M.F.A.; Abdur Rashid, M.; Rahaman, A.Z.; Akand, M. An Action Plan for Adaptation in Bangladesh Agriculture under Climate Change; Center for Environmental and Geographic Information Services: Dhaka, Bangladesh, 2016. [Google Scholar]
  43. Egashira, K.; Han, J.; Satake, N.; Nagayama, T.; Mian, M.J.A.; Moslehuddin, A.Z.M. Field experiment on long-term application of chemical fertilizers and farmyard manure in floodplain soil of Bangladesh. J. Fac. Agric. Kyushu Univ. 2005, 50, 861–870. [Google Scholar]
  44. Kader, M.A.; Yeasmin, S.; Solaiman, Z.; De Neve, S.; Sleutel, S. Response of hydrolytic enzyme activities and nitrogen mineralization to fertilizer and organic matter application in subtropical paddy soils. Eur. J. Soil Biol. 2017, 80, 27–34. [Google Scholar] [CrossRef]
  45. Ali, M.A.; Hoque, M.A.; Kim, P.J. Mitigating global warming potentials of methane and nitrous oxide gases from rice paddies under different irrigation regimes. Ambio 2013, 42, 357–368. [Google Scholar] [CrossRef] [PubMed]
  46. Mahmood, R.; Meo, M.; Legates, D.R.; Morrissey, M.L. The CERES-Rice model-based estimates of potential monsoon season rainfed rice productivity in Bangladesh. Prof. Geogr. 2003, 55, 259–273. [Google Scholar]
  47. Saxton, K.E.; Rawls, W.J. Soil water characteristic estimates by texture and organic matter for hydrologic solutions. Soil Sci. Soc. Am. J. 2006, 70, 1569–1578. [Google Scholar] [CrossRef]
  48. Manrique, L.; Jones, C. Bulk density of soils in relation to soil physical and chemical properties. Soil Sci. Soc. Am. J. 1991, 55, 476–481. [Google Scholar] [CrossRef]
  49. De Souza, E.; Fernandes Filho, E.I.; Schaefer, C.E.G.R.; Batjes, N.H.; dos Santos, G.R.; Pontes, L.M. Pedotransfer functions to estimate bulk density from soil properties and environmental covariates: Rio Doce basin. Sci. Agric. 2016, 73, 525–534. [Google Scholar] [CrossRef] [Green Version]
  50. Del Grosso, S.; Parton, W.; Keough, C.; Reyes-Fox, M. Special features of the DayCent modeling package and additional procedures for parameterization, calibration, validation, and applications. In Methods of Introducing System Models into Agricultural Research; American Society of Agronomy, Crop Science Society of America, Soil Science Society of America: Madison, WI, USA, 2011; pp. 155–176. [Google Scholar]
  51. Kuddus, M.A.; Talukder, M.N.I. Krishitotter Mouloniti; Bangla Academy: Dhaka, Bangladesh, 1981. (In Bangla) [Google Scholar]
  52. Haque, M.; Bell, R.; Islam, M.; Rahman, M. Minimum tillage unpuddled transplanting: An alternative crop establishment strategy for rice in conservation agriculture cropping systems. Field Crop. Res. 2016, 185, 31–39. [Google Scholar] [CrossRef] [Green Version]
  53. Ali, M.A.; Sattar, M.; Islam, M.N.; Inubushi, K. Integrated effects of organic, inorganic and biological amendments on methane emission, soil quality and rice productivity in irrigated paddy ecosystem of Bangladesh: Field study of two consecutive rice growing seasons. Plant Soil 2014, 378, 239–252. [Google Scholar] [CrossRef]
  54. Forster, P.; Ramaswamy, V.; Artaxo, P.; Berntsen, T.; Betts, R.; Fahey, D.W.; Haywood, J.; Lean, J.; Lowe, D.C.; Myhre, G. Chapter 2: Changes in atmospheric constituents and in radiative forcing. In Climate Change 2007: The Physical Science Basis; 2007: Contribution of Working Group I to the Fourth Assessment Report of the Intergovernmental Panel on Climate Change; Solomon, S., Qin, D., Manning, M., Chen, Z., Marquis, M., Averyt, K., Tignor, M., Miller, H.L., Eds.; Cambridge University Press: Cambridge, UK; New York, NY, USA, 2007; pp. 130–234. [Google Scholar]
  55. Bhatia, A.; Aggarwal, P.K.; Jain, N.; Pathak, H. Greenhouse gas emission from rice- and wheat-growing areas in India: Spatial analysis and upscaling. Greenh. Gases Sci. Technol. 2012, 2, 115–125. [Google Scholar] [CrossRef]
  56. Sahrawat, K. Fertility and organic matter in submerged rice soils. Curr. Sci. 2005, 88, 735–739. [Google Scholar]
  57. BLRI. Bangladesh Livestock Research Institute. Ministry of Fisheries and Livestock. Government of the People’s Republic of Bangladesh, Savar, Dhaka, Bangladesh. 2017. Available online: http://www.asti.cgiar.org/node/171 (accessed on 14 February 2017).
  58. Six, J.; Conant, R.; Paul, E.A.; Paustian, K. Stabilization mechanisms of soil organic matter: Implications for C-saturation of soils. Plant Soil 2002, 241, 155–176. [Google Scholar] [CrossRef]
  59. Zhang, W.; Yu, Y.; Li, T.; Sun, W.; Huang, Y. Net greenhouse gas balance in China’s croplands over the last three decades and its mitigation potential. Environ. Sci. Technol. 2014, 48, 2589–2597. [Google Scholar] [CrossRef] [PubMed]
  60. Brye, K.R.; Rogers, C.W.; Smartt, A.D.; Norman, R.J. Soil texture effects on methane emissions from direct-seeded, delayed-flood rice production in Arkansas. Soil Sci. 2013, 178, 519–529. [Google Scholar] [CrossRef]
  61. Sass, R.; Fisher, F.; Lewis, S.; Jund, M.; Turner, F. Methane emissions from rice fields: Effect of soil properties. Glob. Biogeochem. Cycles 1994, 8, 135–140. [Google Scholar] [CrossRef]
  62. Bhattacharyya, P.; Roy, K.; Neogi, S.; Chakravorti, S.; Behera, K.; Das, K.; Bardhan, S.; Rao, K. Effect of long-term application of organic amendment on C storage in relation to global warming potential and biological activities in tropical flooded soil planted to rice. Nutr. Cycl. Agroecosyst. 2012, 94, 273–285. [Google Scholar] [CrossRef]
  63. Yan, X.; Akiyama, H.; Yagi, K.; Akimoto, H. Global estimations of the inventory and mitigation potential of methane emissions from rice cultivation conducted using the 2006 Intergovernmental Panel on Climate Change Guidelines. Glob. Biogeochem. Cycles 2009, 23. [Google Scholar] [CrossRef] [Green Version]
  64. Manjunath, K.; More, R.; Chauhan, P.; Vyas, A.; Panigrahy, S.; Parihar, J. Remote Sensing Based Methane Emission Inventory Vis-A-Vis Rice Cultural Types of South Asia. In Proceedings of the International Archives of Photogrammetry, Remote Sensing and Spatial Information Sciences, Hyderabad, India, 9–12 December 2014; pp. 821–826. [Google Scholar]
  65. MOEF. Bangladesh Climate Change Strategy and Action Plan 2008; Ministry of Environment and Forests, Government of the People’s Republic of Bangladesh: Dhaka, Bangladesh, 2008.
  66. Haider, M.Z. Determinants of rice residue burning in the field. J. Environ. Manag. 2013, 128, 15–21. [Google Scholar] [CrossRef] [PubMed]
  67. Gaihre, Y.K.; Singh, U.; Islam, S.M.; Huda, A.; Islam, M.; Satter, M.A.; Sanabria, J.; Islam, M.R.; Shah, A. Impacts of urea deep placement on nitrous oxide and nitric oxide emissions from rice fields in Bangladesh. Geoderma 2015, 259, 370–379. [Google Scholar] [CrossRef]
  68. Ghimire, R.; Lamichhane, S.; Acharya, B.S.; Bista, P.; Sainju, U.M. Tillage, crop residue, and nutrient management effects on soil organic carbon in rice-based cropping systems: A review. J. Integr. Agric. 2017, 16, 1–15. [Google Scholar] [CrossRef]
  69. Rejesus, R.M.; Palis, F.G.; Rodriguez, D.G.P.; Lampayan, R.M.; Bouman, B.A. Impact of the alternate wetting and drying (AWD) water-saving irrigation technique: Evidence from rice producers in the Philippines. Food Policy 2011, 36, 280–288. [Google Scholar] [CrossRef]
Figure 1. Simulated net greenhouse gas (GHG) balances (t CO2-eq. ha−1 year−1) related to changes from the baseline management in (a) soil organic carbon (SOC) stock (carbon dioxide, CO2 removal), (b) methane (CH4) and (c) nitrous oxide (N2O) emissions (all are in t CO2-eq. ha−1 year1) for 64 districts in Bangladesh. Each point represents the change in one district (n = 64). AWD: Alternate wet and drying, Rsd_RT: 15% residue removal with reduced tillage, CD: Cow dung, IM: Integrated management practices. Note that the scale of both x and y axes differ.
Land 07 00082 g001
Figure 2. Simulated net greenhouse gas (GHG) balances with (a) yield in two crop growing seasons and (b) GHG emission intensity under different management activity in Bangladeshi double rice cropland soil. Each point represents the change in one district (n = 64). Y_IR: Yield for irrigated rice, Y_RR_Yield for rainfed rice. AWD: Alternate wet and drying, Rsd_RT: 15% residue removal with reduced tillage, CD: cow dung, IM: Integrated management practices.
Land 07 00082 g002
Figure 3. District map of Bangladesh showing values of (a) annual soil organic carbon (SOC) stock changes (Carbon dioxide, CO2 removal), (b) annual average change in methane (CH4) emissions, (c) annual average change in nitrous oxide N2O emissions and (d) annual net greenhouse (GHG) balances under integrated management (IM) for the period of 1996–2015. IM practices include a combination of AWD, Rsd_RT, cow dung with 40% less N, coupled with 15% less mineral N fertilizer compared to the current rate. AWD: Alternate wet and drying, Rsd_RT: 15% residue removal with reduced tillage. CD: cow dung. The unit are t CO2-eq. ha−1 year−1.
Land 07 00082 g003aLand 07 00082 g003b
Figure 4. Map of Bangladesh showing (a) annual soil organic carbon (SOC) stock changes (Tg carbon dioxide CO2-eq. year−1) and (b) average net greenhouse gas (GHG) balances (Tg CO2-eq. year−1) from total rice harvested area under integrated management practices (IM) for the period 1996–2015. Unit and legend for Figure 4b is similar to Figure 4a.
Land 07 00082 g004
Figure 5. Annual balances (Tg carbon dioxide, CO2-eq. year−1) considering soil organic carbon (SOC) stock changes (represented as a CO2 removal), methane and nitrous oxide emissions under the four selected mitigation scenarios in the harvested rice area of Bangladesh. Negative values indicate an increase in SOC sequestration or a decrease in net greenhouse gas (GHG) emissions; positive values indicate a decrease in SOC sequestration or an increase in net GHG emissions. AWD: Alternate wet and drying, Rsd_RT: 15% residue removal with reduced tillage, CD: Cow dung, IM: Integrated management practices.
Land 07 00082 g005
Table 1. Baseline information as input data for simulations in Bangladesh double rice-based cropland.
Input ValuesInformation
Baseline year1996
Cropping systemsIrrigated rice-fallow-rainfed rice
Sowing/harvesting (months)1 January–May/July–November
Crop duration (days)120-0-120
N (kg ha−1 year−1)1 110/80
Water managementContinuous flood (CF)
Residue5%
Tillage systemConventional, applying tractor plough after saturated soil (5–6 cm standing water) called puddle to make the soil soft
1 for irrigated rice and rainfed rice respectively.

