Analysis of Super-Gentrification Dynamic Factors Using Interpretative Structure Modeling


1
School of Economics and Management, Tongji University, Shanghai 200092, China
2
Hospitality Management School, Shanghai Business School, Shanghai 201400, China
*
Author to whom correspondence should be addressed.
Land 2020, 9(2), 45; https://doi.org/10.3390/land9020045
Submission received: 19 January 2020
/
Revised: 29 January 2020
/
Accepted: 1 February 2020
/
Published: 8 February 2020
(This article belongs to the Special Issue Land Management in Territorial Planning: Analysis, Appraisal, Strategies for Sustainability)
Abstract
:The driving force of super-gentrification shapes a complex system in which multiple dynamic factors interact with each other. This paper takes the dynamic factor system of super-gentrification as the research object and uses the Interpretative Structure Modeling (ISM) to analyze these dynamic factors. The levels of these dynamic factors and the interaction between them are determined. The Cross Impact Matrix Multiplication Applied to a Classification (MICMAC) analysis is also conducted to determine the dependence power and driving power of these dynamic factors. Through analysis, it is concluded that the dynamic factors of super-gentrification are distributed on six levels. Among these dynamic factors, Transformation of Industrial Structure and Occupational Structure in Urban Central Areas, Housing Needs of Overseas Elites, Investment Needs, Development of the Real Estate Market, and Unique Areas and Lifestyle Preferences are the fundamental dynamic factors affecting super-gentrification. The findings of this paper can enrich the existing theoretical research on the driving force of super-gentrification and can provide a reference for policy makers to promote urban landscape sustainability to some extent.
1. Introduction
The term ‘gentrification’ was coined by Ruth (1964) based on her London research [1]. She provided a long-term unified definition of gentrification, describing the phenomenon that the middle-class residents come to the city center of London, enter the declining working-class communities and transform their living environment. Since then, gentrification has become a research hotspot and has attracted widespread attention from experts and scholars in the field of urban planning, urban geography, urban management, and so on. Davidson and Lees (2005) summarized four basic characteristics of early gentrification as: (1) the reinvestment of capital in an urban center; (2) landscape change; (3) local social upgrading with the entry of high-income groups; and (4) indirect or direct displacement of low-income groups [2].
With the acceleration of globalization and the expansion of global financial capital, a new phenomenon (i.e., super-gentrification), has emerged in the core areas of international metropolises, such as Paris [3], London [4] and New York [5]. Super-gentrification is the conversion process of prosperous, already gentrified and solid upper-middle-class neighborhoods into much more expensive and exclusive enclaves. This type of intensified re-gentrification is happening in some specific areas of megacities, such as New York and London, which have become the focus of conspicuous consumption and intense investment by a new generation of super-rich ‘financifiers’ who are fed by fortunes from the corporate service industries and global finance [5]. Unlike earlier forms of gentrification, super-gentrification has obvious driving power and effects. Super-gentrification will affect the economic and sociocultural structure of the original local community greatly. It is currently reshaping some major global urban landscapes in many ways.
At present, the research on super-gentrification is mainly concentrated in European and American countries. According to Lees’ (2003) seminal case study on Brooklyn Heights neighborhood in New York [5] and Butler and Lees’ (2006) case analysis of Barnsbury neighborhood in London [4], the majority of super-gentrifiers is constituted by corporate lawyers, investment bankers, and high-income finance managers. Rofe’s (2004) qualitatively research on Newcastle, the Australia’s famous steel city, found that the rich and power class replaced the residents who originally lived in the inner city and transformed the original landscape into a cosmopolitan landscape suitable for them to live in [6]. In their qualitative research around gentrification and super-gentrification in Houston, Podagrosi et al. (2011) found that very wealthy homebuyers, who are supposed to be located in the suburbs, begin to purchase property nearer to downtown, and transform already prosperous areas into even more exclusive enclaves [7]. Monare et al. (2014) found that Parkhurst, a Johannesburg surburb in South Africa, has passed a peak of the first gentrification cycle and was undergoing the process of super-gentrification [8]. Halasz (2018) made a quantitative analysis on the changes of residents’ income, demographic data, and housing affordability in the Park Slope neighborhood of Brooklyn, New York, since 1970, and described the super-gentrification landscape and how to identify super-gentrification [9]. Mendes and Jara (2018) studied Colina de Santana, in the historic center of Lisbon, and believed that the financialization of the built environment and of the real estate sector are important driving forces at the root of the super-gentrification wave [10]. Morris (2019) qualitatively studied the super-gentrification of Millers Point (a downtown area in Sydney, Australia) and pointed out that, under certain circumstances, super-gentrification may occur in areas that have not been gentrified [11].
In general, scholars mainly study super-gentrification from qualitative and case studies in terms of research methods, and the research on super-gentrification is currently only focused on the question of “what” is the characteristic of super-gentrification, while the question of “why” super-gentrification happens has not been sufficiently explored yet. Besides, the existing research on super-gentrification are mainly from western countries, while few scholars discuss super-gentrification from a perspective of east country. Under this situation, this paper adopts a systematic analysis approach to analyze the super-gentrification dynamic factors from a Chinese perspective, which is conductive to understanding “why” super-gentrification happens. With the help of 11 Chinese experts’ views, we construct the Interpretative Structure Model of super-gentrification dynamic factors firstly, and then divide each dynamic factor into different levels, so as to determine the effect relationship between the dynamic factors. The Cross Impact Matrix Multiplication Applied to a Classification (MICMAC) analysis is also performed to determine the driving power and dependence power of the dynamic factors. The findings of this paper can enrich the existing theoretical research on the driving force of super-gentrification and can provide reference for policy makers to promote urban landscape sustainability to some extent.
2. Methodology
2.1. Interpretive Structural Modeling
Considering the complexity and variety of dynamic factors of super-gentrification, it would be very useful to give a realistic picture of the situation of these dynamic factors. Traditional methods for analyzing factors (e.g., weighted score and mean value methods) relies on the collection of data from a large sample of questionnaire surveys. They cannot shed light on the interactive relationships among factors. Besides, there are few experts with sufficient experience and knowledge about super-gentrification in China. It is therefore hard to approach a sufficient sample of valid respondents for data survey. Fortunately, the application of Interpretive Structural Modeling (ISM) can overcome these limitations. In applying the ISM approach, emphasis is given to the quality of respondents rather than quantity [12]. The number of quality experts does not need to be very large, but can be as few as two experts [13]. Hence, this approach is adopted in this paper. ISM was proposed in 1974 by an American professor Warfield [14]. The characteristic of this method is to divide a quite complicated system into several subsystems by combining people’s practical experience and knowledge and the assistance of a computer, and finally build the complicated system into a multi-level hierarchical interpretive structural model.
The ISM model can express those vague opinions and ideas intuitively, and it is especially applicable to systems with many constituent elements, complex relationships, and fuzzy structures. Presenting these specific interrelationships and the overall system structure in a directed graph model can help determine the orders and directions of the complex interrelationships between different factors of the system. As a method of system structure modeling, the ISM method plays an increasingly important role in the analysis of complex system problems, and has been successfully applied in many research fields [15,16,17,18,19,20,21,22].
The modeling steps of the ISM for super-gentrification dynamic factors are as follows:
Step 1: Define the set of dynamic factors that affect the system.
Step 2: Construct the interrelationships between the dynamic factors.
Step 3: Construct the adjacency matrix.
The adjacency matrix is used to quantify the interrelationships between the super-gentrification dynamic factors, and the numbers are used to represent the interrelationships between each of the dynamic factors. The interrelationships between the dynamic factors are constructed according to the rules as follows: if Si has a direct effect on Sj, then the matrix element aij is 1; if Si has no direct effect on Sj, then the matrix element aij is 0. Namely:
Step 4: Calculate the accessibility matrix from the adjacency matrix.
The accessibility matrix is generated by summing the adjacency matrix A and the identity matrix I (the same order as matrix A) and then performing a power operation on the matrix A + I until the formula holds. Then, M is the accessibility matrix of A, which indicates that there is a connection path from one dynamic factor to another one.
Step 5: Divide the accessibility matrix into different levels.
Enumerate the accessibility set R(Si) (the set of all dynamic factors that may be reached from Si), antecedent set A(Si) (the set of all dynamic factors that may reach Si), and common set C(Si) (C(Si) = R(Si) ∩ A(Si)) of each dynamic factor according to the accessibility matrix M. Find out the same dynamic factors in the accessibility set and common set and take them as the first level of the Interpretive Structural Model. Then, delete the rows and columns of all the dynamic factors of the first level from the accessibility matrix to form a new accessibility matrix. Subsequently, continue to find the dynamic factors in the second level of the Interpretive Structural Model from the new accessibility matrix in the same way. By analogy with this way, find out all the dynamic factors for each level [17].
Step 6: Construct the inter-level accessibility matrix.
According to the results of stratification, reorder the dynamic factors in the accessibility matrix in a hierarchical order to get the inter-level accessibility matrix R0. The inter-level accessibility matrix helps to quickly and intuitively see the hierarchical position and relationship between the dynamic factors.
Step 7: Extract the reduced accessibility matrix and draw a directed graph and replace the variable symbols in the graph to form an Interpretive Structural Model.
According to the inter-level accessibility matrix, some strongly connected blocks [23] (referring to the mutually accessible factors in the same level within a region) may be found. The correlation between the dynamic factors in the same strongly connected blocks in the process of super-gentrification is very strong and these factors can affect each other. When a dynamic factor in a strongly connected block is strengthened or weakened, other dynamic factors in the same strongly connected block will also be strengthened or weakened. Therefore, the reduced accessibility matrix can be obtained by randomly selecting a factor from these strongly connected blocks to simplify the inter-level accessibility matrix. Subsequently, a directed graph can be drawn based on the reduced accessibility matrix to form an Interpretive Structural Model.
2.2. Cross Impact Matrix Multiplication Applied to a Classification (MICMAC) Analysis
Cross Impact Matrix Multiplication Applied to a Classification (MICMAC) analysis is a method proposed by Duperrin and Godet to analyze the relationships and interactions between different factors in a system [24]. It is commonly used to identify variables with high dynamic and high dependence in a system.
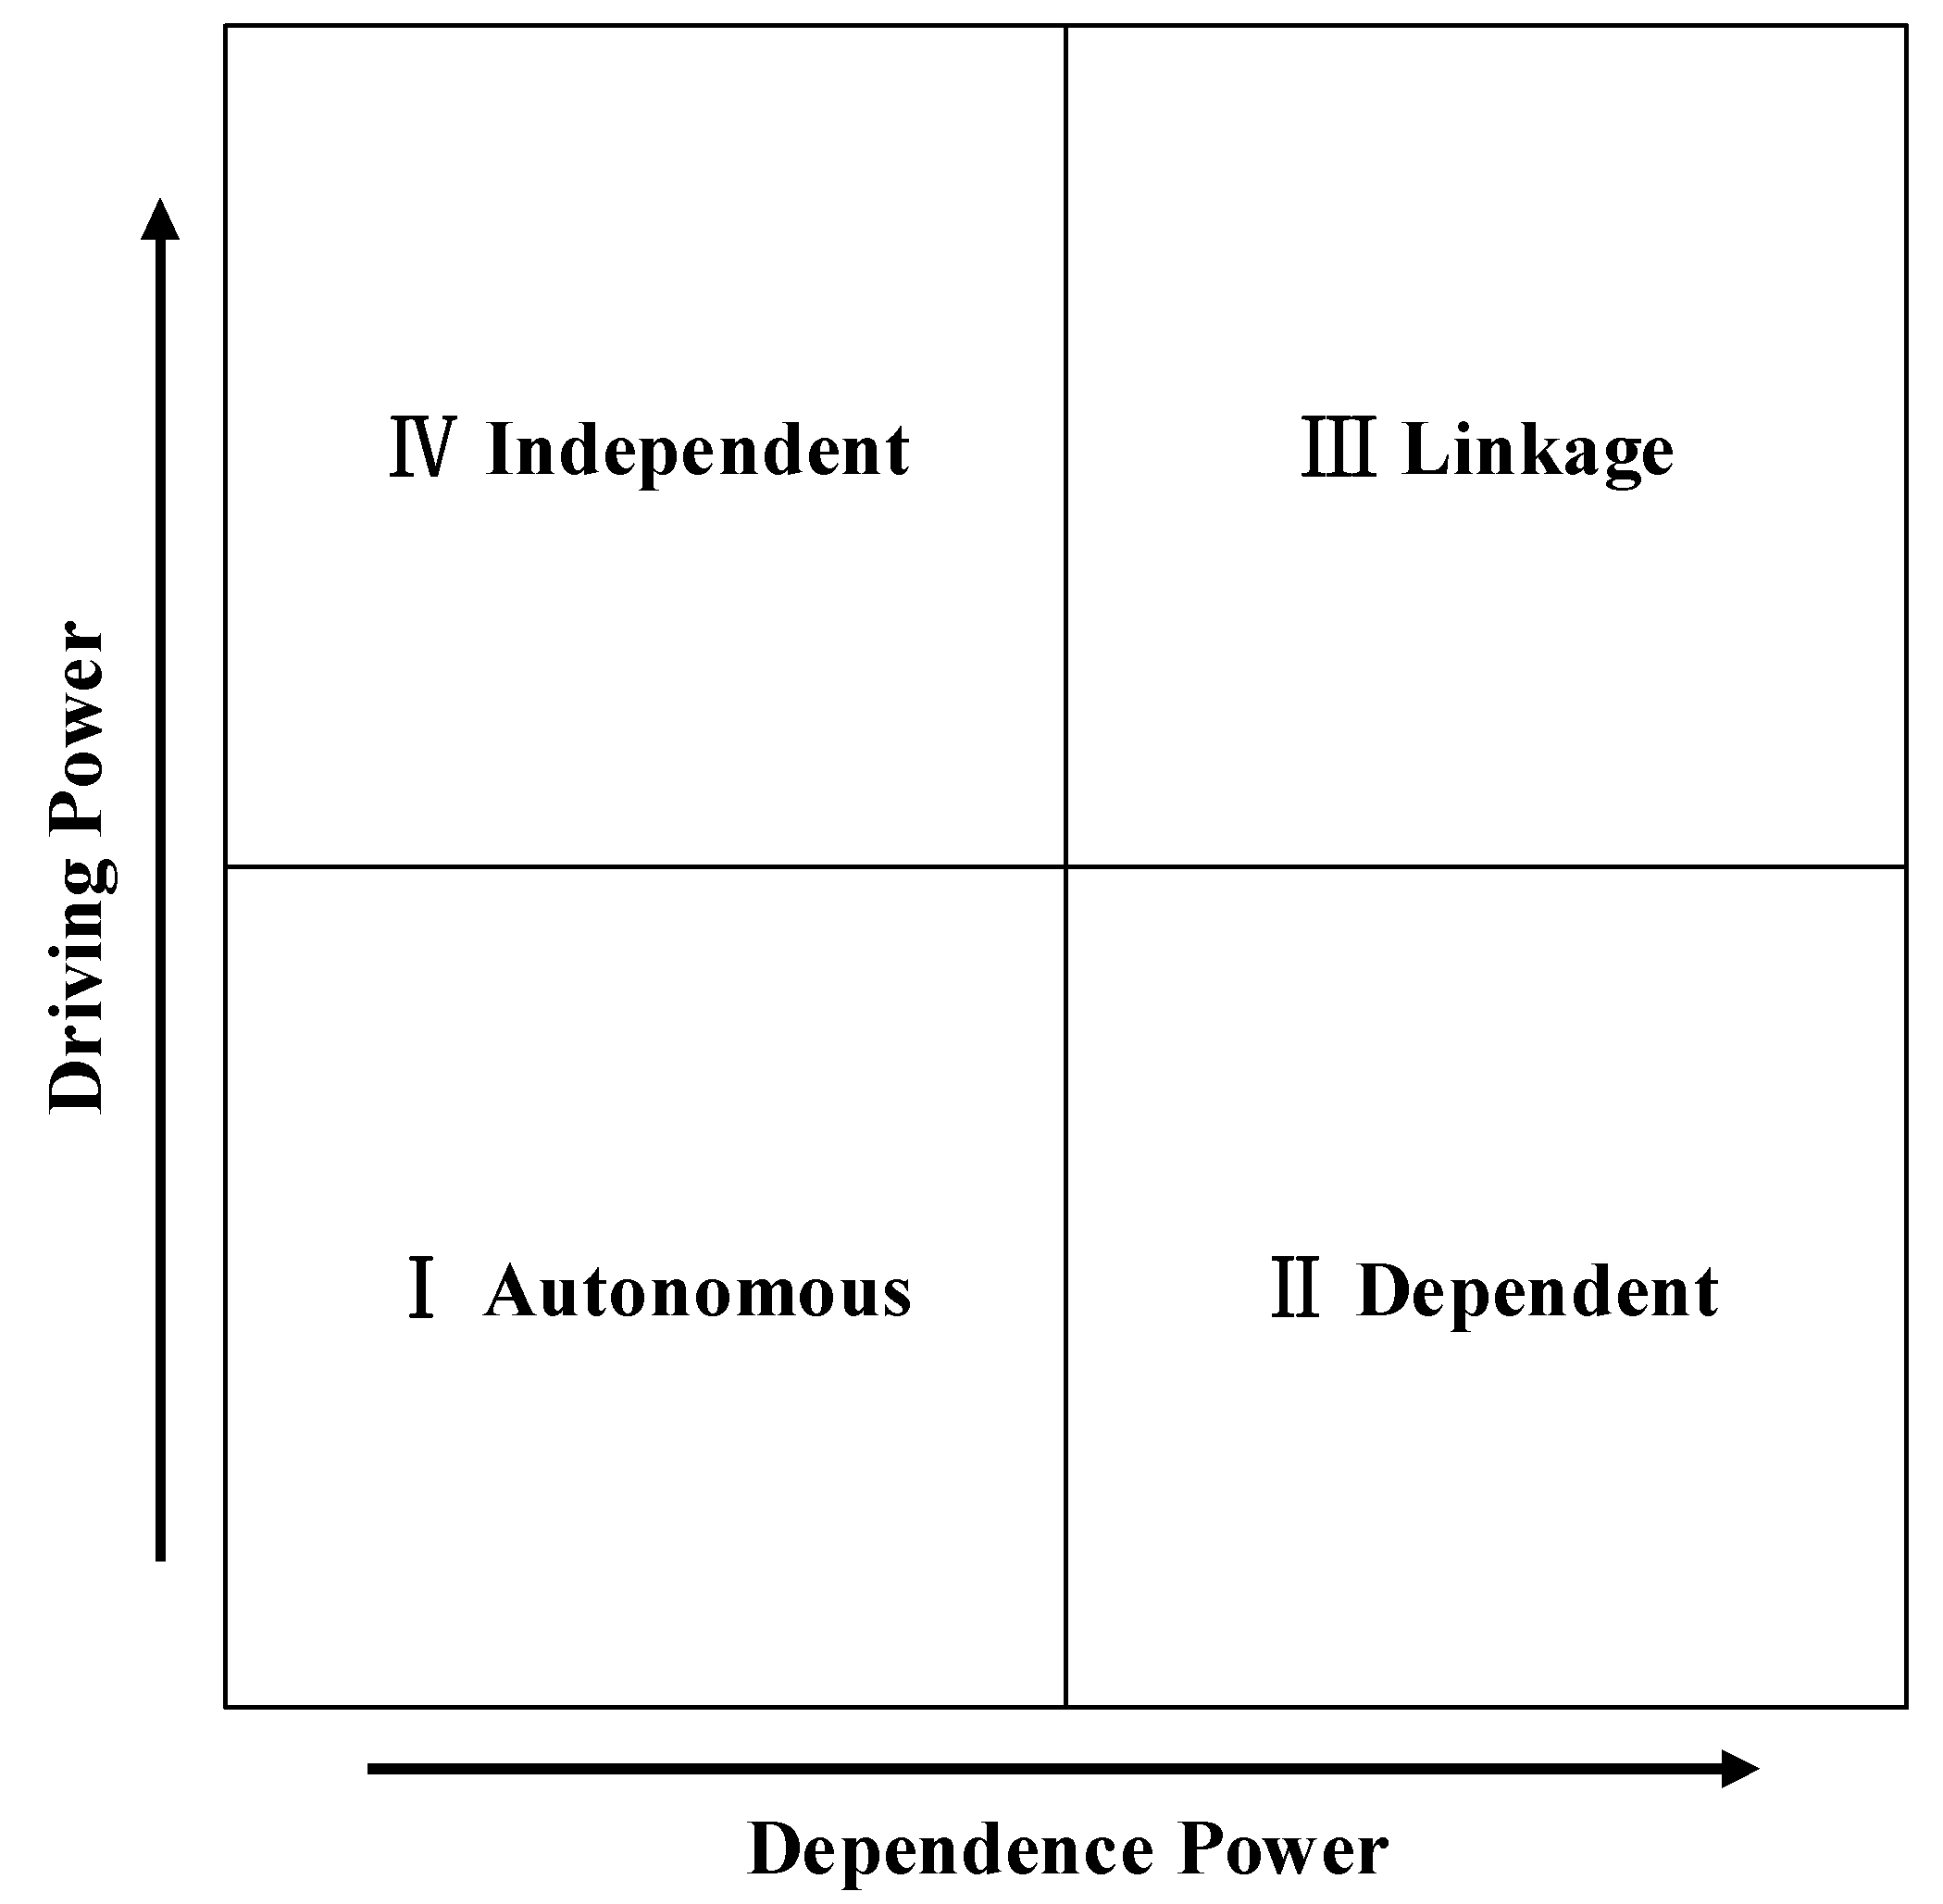
Unlike ISM, which can only judge the direct relationship between factors, MICMAC can assess the degree to which factors interact with each other. The analysis result of MICMAC can be expressed in the form of a quadrant diagram. The ordinate of the quadrant diagram represents the driving power of the dynamic factors, and the abscissa represents the dependence power, so it is also called the driving–dependence matrix. The driving power is determined by the number of factors that each factor can reach, and the dependence power is determined by the number of factors that reach each factor. Accordingly, these factors can be divided into four quadrants: I Autonomous cluster, II Dependent cluster, III Linkage cluster, and IV Independent cluster, as shown in Figure 1.
Generally speaking, the dynamic factor with a strong dependence power means that it depends on a large number of other relevant dynamic factors, while the dynamic factor with a strong driving power means that a large number of dynamic factors can work through its promotion.
The dynamic factors can be divided into four categories corresponding to the four quadrants of the coordinate system, i.e., quadrant I, quadrant II, quadrant III and quadrant IV. The explanation of each quadrant is as follows:
Quadrant I (Autonomous cluster): Both the dependence power and driving power of the dynamic factors in quadrant I are very weak, these dynamic factors are disconnected from the system and have few connections to the system, but it does not indicate that the factors in this quadrant are unimportant.
Quadrant II (Dependent cluster): The dynamic factors in quadrant II have a strong dependence power but a weak driving power. They depend largely on other factors. Generally, if other factors are addressed, the factors in this quadrant will be addressed accordingly. Hence, it is usually accepted that these dynamic factors are not crucial.
Quadrant III (Linkage cluster): Both the dependence power and driving power of the dynamic factor in quadrant III are very strong. These dynamic factors are actually sensitive, and any effect they are subjected to will affect other dynamic factors as well as themselves. They are at the intermedium level in the hierarchy structure.
Quadrant IV (Independent cluster): The driving power of the dynamic factor in quadrant IV is strong but the dependence power is weak. These factors have more capability to influence other factors. They are usually regarded as fundamental dynamic factors accountable to drive the entire system. Hence, they should be given with the highest priority for decision making.
3. Interpretative Structure Model of Super-Gentrification Dynamic Factors and Cross Impact Matrix Multiplication Applied to a Classification (MICMAC) Analysis
3.1. Dynamic Factors Identification
The research object of this paper is the dynamic factor of super-gentrification. The first step in the ISM methodology is to identify key dynamic factors involved in the system being analyzed. Comprehensively considering the model principle and working process of ISM, this paper mainly uses literature research and the Delphi method to identify the main dynamic factors. Firstly, on the basis of an in-depth literature study, 26 references related to super-gentrification dynamic factors were selected, and 28 dynamic factors affecting super-gentrification were initially identified.
Then, using the Delphi method, the alternative dynamic factor set were given to 11 experts (including nine university professors, one sociologist, and one government official) in form of tables. All the nine university professors are from famous universities in China, such as Tsinghua University, Nanjing University, Xi’an Jiaotong University, Tongji University, and South China University of Technology. These professors and the sociologist are all experts in the field of gentrification who have publications and practices related to gentrification. Some of them are from the field of sociology, and some of them are from urban planning or urban regeneration. The government official was selected as the expert because he has enough working experience in gentrification cases. University professors and sociology and government officials have enough authority in the theoretical and practical determination of the key dynamic factors of super-gentrification. They can also evaluate the dynamic factors from a local contextual perspective as they are all from China. These experts were asked to conduct several rounds of evaluation of the alternative dynamic factors and screen out the most important dynamic factors affecting super-gentrification. Finally, based on the consistent feedback from these 11 experts, 23 key dynamic factors affecting super-gentrification were finally identified. These 23 dynamic factors and their explanations are shown in Table 1.
3.2. Construction of the Interpretative Structure Model of Super-Gentrification Dynamic Factors
3.2.1. Construction of the Adjacency Matrix of Super-Gentrification Dynamic Factors
After a comprehensive evaluation and a full demonstration of the opinions of the 11 experts, the direct effect relationship between the 23 dynamic factors was initially confirmed. In view of the inconsistency of experts’ opinions in determining whether a direct effect relationship exists between the dynamic factors, the threshold value of 90% is set in this study, that is, when more than 90% of the 11 experts believe that there is a direct effect relationship between two dynamic factors, the direct effect relationship can be established. Finally, the unique adjacency matrix A () is determined, which is a matrix with only elements of 0 and 1, as shown in Table 2.
3.2.2. Construction of the Accessibility Matrix of Super-Gentrification Dynamic Factors
Calculate A + I, (A + I)2, …, (A + I)k in turn according to the formula . Based on this, the accessibility matrix M is calculated via Matlab programming, as shown in Table 3.
3.2.3. Construction of the Inter-Level Accessibility Matrix of Super-Gentrification Dynamic Factors
Calculate the accessibility set R(Si) and antecedent set A(Si) of all factors according to the accessibility matrix M. If R(Si) ∩ A(Si) = R(Si), then R(Si) is the top-level factors set. Once the top-level factors set is found, the corresponding rows and columns of the top-level factors in the accessibility matrix can be crossed out accordingly and then the second-level factors can be calculated from the new matrix. The calculation is repeated until the factors contained in each level are found. Table 4 shows the final level division results.
According to the sequence of the six-level factors obtained in Table 4, an inter-level accessibility matrix R0 is constructed (see Table 5).
In this study, {S12, S13, S16}, {S3, S4, S19}, {S11, S14, S21, S22}, and {S2, S9, S15} are strongly connected blocks [23]. According to Step 7 (mentioned above), we select S12 from {S12, S13, S16}, S3 from {S3, S4, S19}, S11 from {S11, S14, S21, S22}, and S2 from {S2, S9, S15} to obtain the ordered reduced accessibility matrix R1 to simplify the inter-level accessibility matrix, as shown in Table 6.
Finally, according to the level division of the dynamic factors and the effect relationship between the dynamic factors reflected by the accessibility matrix, the interpretative structure model of the dynamic factors of super-gentrification is constructed. In order to make the hierarchical structure of the model more clear, only the direct effect relationship between the dynamic factors is considered in the model. The ISM graph is shown in Figure 2.
3.3. Cross Impact Matrix Multiplication Applied to a Classification (MICMAC) Analysis
On the basis of the level division results of each dynamic factor, the status and function of each dynamic factor are further analyzed by the MICMAC method in this section.
The main function of the MICMAC analysis method is to evaluate the dependence power and driving power of each dynamic factor in the process of super-gentrification. The driving power and dependence power of each dynamic factor can be calculated from the accessibility matrix M in Table 3. The value of the driving power is the sum of “1” for each row corresponding to each dynamic factor in the accessibility matrix, and the value of the dependence power is the sum of “1” for each column corresponding to each dynamic factor in the accessibility matrix. The calculation results are shown in Table 7.
According to Table 7, the mean value of both Driving Power and Dependence Power is 7.65 (178/23). Taking this mean value as the quadrant dividing line [15], we draw the driving–dependence power classification chart of the super-gentrification dynamic factors, and divide all the dynamic factors into the four quadrants of the driving–dependence power space, as shown in Figure 3.
4. Results Analysis
Firstly, from the Interpretative Structure Model, it can be seen that the dynamic factors of super-gentrification are distributed on six levels, and the dynamic factors of each level are closely related. Each dynamic factor affects the super-gentrification through different paths and patterns. By establishing a system structure model, the internal relationship and importance of dynamic factors can be seen at a glance.
Secondly, S23 Transformation of Industrial Structure and Occupational Structure in Urban Central Areas, S2 Housing Needs of Overseas Elites, S9 Investment Needs, S15 Development of the Real Estate Market, and S7 Unique Areas and Lifestyle Preferences are located at the 4th, 5th, and 6th levels of the Interpretative Structure Model, indicating that these factors are the fundamental dynamic factors of super-gentrification. In the process of super-gentrification, more attention should be paid to these dynamic factors. At the same time, in the MICMAC driving power and dependence power matrix analysis, the five dynamic factors S23, S2, S9, S15, and S7 belong to the independent clusters (Quadrant IV). Their driving power is strong but their dependence power is weak and they are less affected by other factors. From another perspective, it is proved that these five dynamic factors need to be paid more attention in the process of super-gentrification.
Thirdly, the four dynamic factors S11 Further Improvement of the Market Economy System, S14 Commercialization of Urban Governance, S21 Diversity of Urban Development Investors and S22 Marketization of Urban Land Use System and Housing System belong to the linkage cluster (Quadrant III). Both of their driving power and dependence power are strong. They often play the role of transmitting the influence of the bottom dynamic factors to the top dynamic factors in the interpretative structure model. However, these dynamic factors are actually unstable, and they have a complicated relationship of mutual influence. Meanwhile, they are likely to adversely affect themselves.
Fourthly, taking the five dynamic factors S23, S2, S9, S15, and S7 as the root, all the dynamic factors constitute an inseparable system. Among all the 23 dynamic factors, S1 Economic Globalization, S5 Cultural Attraction, S8 Close to Commercial and Recreational Facilities, S12 Uneven Distribution of Educational Resources and School District Policy, S13 Government Policy Guidance and S16 Popularization of University Education are in the first level of the ISM digraph (Figure 2), so they can be regarded as the direct dynamic factors of super-gentrification. Besides, in addition to S1, S12, S13, S16, S3 Urban Social Stratification, S4 Widening Gap between Rich and Poor, and S19 Early Gentrification in the Region belong to the dependent cluster (Quadrant II). These dynamic factors have strong dependence power but weak driving power, and they are not crucial in the process of super-gentrification.
Fifthly, the driving power and dependence power of the five dynamic factors (S5 Cultural Attraction, S6 Identity Pursuit, S8 Close to Commercial and Recreational Facilities, S10 Demographic Change, and S18 Continuous Expansion of Global Financial Capital) are very weak. They belong to the autonomous cluster (Quadrant I). In the interpretative structure model, most of them are located in the middle level and play a connecting role in the interaction between the dynamic factors of super-gentrification.
5. Conclusions
The issue of gentrification has always been a concern of worldwide scholars. As a type of intensified re-gentrification, super-gentrification has also gradually attracted the attention of researchers recently. By studying the literature on super-gentrification in recent years, it can be seen that scholars mainly study super-gentrification from qualitative and case studies in terms of research methods, and the research on super-gentrification is currently only focused on the question of “what” is the characteristic of super-gentrification, while the question of “why” super-gentrification happens has not been sufficiently explored yet. Besides, the existing studies on super-gentrification are mainly from western countries, while few scholars discuss super-gentrification from a perspective of an eastern country. Under this situation, in this paper, 23 dynamic factors of super-gentrification were screened out through literature research and the Delphi method, and the direct and indirect influence relationship between these dynamic factors are further explored by using the ISM and MICMAC methods.
According to the ISM and MICMAC analysis of the dynamic factors, it can be seen that S23 Transformation of Industrial Structure and Occupational Structure in Urban Central Areas, S2 Housing Needs of Overseas Elites, S9 Investment Needs, S15 Development of the Real Estate Market, and S7 Unique Areas and Lifestyle Preferences are the fundamental dynamic factors affecting super-gentrification; S1 Economic Globalization, S5 Cultural Attraction, S8 Close to Commercial and Recreational Facilities, S12 Uneven Distribution of Educational Resources and School District Policy, S13 Government Policy Guidance, and S16 Popularization of University Education are the direct dynamic factors affecting super-gentrification.
In summary, on the basis of summing up the viewpoints of many experts and scholars, this paper summarizes the key dynamic factors of super-gentrification and uses the ISM and MICMAC methods to quantitatively analyze and clarify the correlation and hierarchy of the dynamic factors of super-gentrification. Compared with previous studies concerning super-gentrification, this paper is the very first attempt to apply the ISM method to analyze the dynamic factors of super-gentrification. Traditional studies on factor analysis related to super-gentrification usually only provide a list of relative important factors, while this paper provides a distinct profile between individual dynamic factors by demonstrating their dependence power and driving power. The findings of this paper can enrich the existing theoretical research on the driving force of super-gentrification and can provide reference for policy makers to promote urban landscape sustainability to some extent. Specifically, the identification of the dynamic factors provides valuable reference for establishing the assessing indicator system of super-gentrification in the Chinese context. Furthermore, the profile of dynamic factors supplies essential information for decision makers to identify the focal fields and take due actions to promote healthy urban development. Understanding these dynamic factors and their interrelationships helps the top-level authorities make effective regulations and policies to guide landscape planning and urban development. At the same time, this paper also enriches the application fields and research perspectives of the ISM method. The limitation of this paper lies in its research scope and universality. This study mainly focuses on the super-gentrification from a Chinese perspective, as the experts consulted are all from China. Hence, the research results seem to be only reliable in the Chinese context. Whether these results are applicable to other countries or regions still remains to be tested. In the future, we can take the super-gentrification in other countries or regions as the research object for further research.
Author Contributions
J.S. and K.D. conceived and designed the study; Q.X. completed the paper in English and revised it critically for important intellectual content; J.L. gave many good research advices and revised the manuscript. All authors have read and agreed to the published version of the manuscript.
Acknowledgments
This study is supported by the National Social Science Foundation of China (19BGL274). We would like to thank the Editor and the anonymous reviewers for their helpful suggestions and comments.
Conflicts of Interest
The authors declare no conflicts of interest.
References
- Ruth, G. Aspects of Change; MacGibbon & Kee: London, UK, 1964. [Google Scholar]
- Davidson, M.; Lees, L. New-build ‘gentrification’ and London’s riverside renaissance. Environ. Plan. A 2005, 37, 1165–1191. [Google Scholar] [CrossRef] [Green Version]
- Gravari-Barbas, M. Super-Gentrification and Hyper-Tourismification in Le Marais, Paris; Routledge: London, UK; New York, NY, USA, 2017. [Google Scholar]
- Butler, T.; Lees, L. Super-gentrification in Barnsbury, London: Globalization and gentrifying global elites at the neighbourhood level. Trans. Inst. Br. Geogr. 2006, 31, 467–487. [Google Scholar] [CrossRef]
- Lees, L. Super-gentrification: The Case of Brooklyn Heights, New York City. Urban Stud. 2003, 40, 2487–2509. [Google Scholar] [CrossRef]
- Rofe, M.W. From ‘Problem City’ to ‘Promise City’: Gentrification and the Revitalisation of Newcastle. Aust. Geogr. Stud. 2004, 42, 193–206. [Google Scholar] [CrossRef]
- Podagrosi, A.; Vojnovicô, I.; Pigozzi, B. The diversity of gentrification in Houston’s urban renaissance: From cleansing the urban poor to supergentrification. Environ. Plan. A 2011, 43, 1910–1930. [Google Scholar] [CrossRef]
- Monare, P.T.; Kotzé, N.; Mckay, T.M. A second wave of gentrification: The case of Parkhurst, Johannesburg, South Africa. Urbani Izziv 2014, 25, 108–121. [Google Scholar] [CrossRef] [Green Version]
- Halasz, J.R. The super-gentrification of Park Slope, Brooklyn. Urban Geogr. 2018, 39, 1366–1390. [Google Scholar] [CrossRef]
- Mendes, L.; Jara, A. Super-gentrification and financialized capitalism: The new frontiers of space-capital in Colina de Santana, Lisbon. Cad. Metrópole 2018, 20, 769–796. (In Portuguese) [Google Scholar] [CrossRef] [Green Version]
- Morris, A. ‘Super-gentrification’ triumphs: Gentrification and the displacement of public housing tenants in Sydney’s inner city. Hous. Stud. 2019, 34, 1071–1088. [Google Scholar] [CrossRef]
- Shen, L.; Song, X.; Wu, Y.; Liao, S.; Zhang, X. Interpretive Structural Modeling based factor analysis on the implementation of Emission Trading System in the Chinese building sector. J. Clean. Prod. J. 2016, 127, 214–227. [Google Scholar] [CrossRef]
- Ravi, V.; Shankar, R. Analysis of interactions among the barriers of reverse logistics. Technol. Forecast. Soc. Chang. 2005, 72, 1011–1029. [Google Scholar] [CrossRef]
- Warfield, J.N. Developing Interconnection Matrices in Structural Modeling. IEEE Trans. Syst. Man Cybern. 1974, 4, 81–87. [Google Scholar] [CrossRef] [Green Version]
- Miao, X.; Chen, Y.; Mi, C. Study on consumer satisfaction on Tangshan hot springs based on ISM and online reviews. Chin. J. Manag. Sci. 2019, 27, 186–194. (In Chinese) [Google Scholar]
- Yue, H.; Dong, M. An analysis of Interpretation Structural Modeling for influencing factors of social science achievements transformation system. East China Econ. Manag. 2019, 33, 176–184. (In Chinese) [Google Scholar]
- Zou, J.; Zhu, Q.; Liu, P. The vulnerability factors of tourism traditional villages based on the Interpretation Structural Model. Econ. Geogr. 2018, 38, 219–225. (In Chinese) [Google Scholar]
- Qin, X.; Mauro, M.; Agnese, T.; Lyu, K.; Wang, M. A comparative study on barries between China and Italy in BIM adoption from the construction market perspective. Chinese J. Manag. 2016, 13, 1718–1727. (In Chinese) [Google Scholar]
- Rajesh, R. Technological capabilities and supply chain resilience of firms: A relational analysis using Total Interpretive Structural Modeling (TISM). Technol. Forecast. Soc. Chang. 2017, 118, 161–169. [Google Scholar] [CrossRef]
- Ma, G.; Jia, J.; Ding, J.; Shang, S.; Jiang, S. Interpretive Structural Model Based Factor Analysis of BIM Adoption in Chinese Construction Organizations. Sustainability 2019, 11, 1982. [Google Scholar] [CrossRef] [Green Version]
- Janssen, M.; Rana, N.P.; Slade, E.L.; Dwivedi, Y.K. Trustworthiness of digital government services: Deriving a comprehensive theory through interpretive structural modelling. Public Manag. Rev. 2018, 20, 647–671. [Google Scholar] [CrossRef] [Green Version]
- Tan, T.; Chen, K.; Xue, F.; Lu, W. Barriers to Building Information Modeling (BIM) implementation in China’s prefabricated construction: An interpretive structural modeling (ISM) approach. J. Clean. Prod. 2019, 219, 949–959. [Google Scholar] [CrossRef]
- Peng, J.; Peng, X.; Zhang, J. An analysis of the factors affecting the development of rural tourism industrialization: Based on Interpretative Structural Model. J. Tech. Econ. Manag. 2019, 8, 124–128. (In Chinese) [Google Scholar]
- Duperrin, J.C.; Godet, M. SMIC-74-Method for constructing and ranking scenarios. Futures 1975, 7, 302–312. [Google Scholar] [CrossRef]
- Xu, Y.; Wang, C.; Zhang, T.; Zhang, W.; Liu, J. Advances and prospects in tourism gentrification research home and abroad. Hum. Geogr. 2019, 2, 8–16. (In Chinese) [Google Scholar]
- He, S. State-sponsored gentrification under market transition: The case of Shanghai. Urban Aff. Rev. 2007, 43, 171–198. [Google Scholar]
- He, S. New-Build Gentrification in Central Shanghai: Demographic Changes and Socioeconomic Implications. Popul. Sp. Place 2010, 16, 345–361. [Google Scholar] [CrossRef]
- Chen, J.; He, S. Classical gentrification and its mechanism in Guangzhou old town: A case study of Yaohua Street, Liwan district. Hum. Geogr. 2012, 27, 37–43. (In Chinese) [Google Scholar]
- Dai, X. Gentrification: An urban socio-spatial restructuring process. Urban Plan. Forum 2007, 2, 25–31. (In Chinese) [Google Scholar]
- Dai, X. Gentrification of Inner City of Metropolis in Transitional China, a Case of Shanghai. Ph.D. Thesis, Tongji University, Shanghai, China, 2007. [Google Scholar]
- Zhao, Y.; Gu, C.; Li, D.; Huang, M. Tourism gentrification: Concept, type and mechanism. Tour. Trib. 2006, 11, 70–74. (In Chinese) [Google Scholar]
- He, S.; Qian, J.; Deng, S. Various forms of gentrification in transitional period in China: A case study of six communities in Guangzhou. Hum. Geogr. 2011, 26, 44–49. (In Chinese) [Google Scholar]
- Huang, X.; Yang, Y. The research progress of gentrification in western countries and China with the implications for China’ s urban planning. Urban Plan. Int. 2012, 27, 54–60. (In Chinese) [Google Scholar]
- Lu, S.; Zhang, H.; Rao, X. Research progress of rural gentrification in western countries. Hum. Geogr. 2019, 34, 1–6. (In Chinese) [Google Scholar]
- Zhong, Y.; Taylor, Y.; Theriault, V. School district houses as super-gentrification: A case study of Wuhan. In DEStech Transactions on Social Science Education and Human Science; SOCIAL SCIENCE, EDUCATION and HUMAN SCIENCE: Lancaster, PA, USA, 2017; pp. 68–72. [Google Scholar]
- Chen, P. Jiaoyufication and its socio-spatial consequences in Urban China. Urban Dev. Stud. 2015, 22, 55–60. (In Chinese) [Google Scholar]
- Wu, Q.; Edensor, T.; Cheng, J. Beyond space: Spatial (Re)production and middle-class remaking driven by Jiaoyufication in Nanjing City, China. Int. J. Urban Reg. Res. 2018, 42, 1–19. [Google Scholar] [CrossRef]
- Zhang, J.; Wang, M. The characteristics of the life space remodeling of tourisom village during rural gentrification: The case of Cuandixia in Beijing. Hum. Geogr. 2017, 32, 137–144. (In Chinese) [Google Scholar]
- Song, W. Theoretical disputes and enlightenment on gentrification in western cities. Hum. Geogr. 2013, 28, 32–35. (In Chinese) [Google Scholar]
- Wu, Q.; Zhang, X.; Waley, P. Jiaoyufication: When gentrification goes to school in the Chinese inner city. Urban Stud. 2016, 53, 3510–3526. [Google Scholar] [CrossRef] [Green Version]
- Yu, S.; Zhu, X.; Sun, J. Analysis on community studentization phenomenon from the perspective of sense of place: A case of a new community near Zhejiang University. Urban Probl. 2018, 6, 36–42. (In Chinese) [Google Scholar]
- Zhu, X.; Zhou, Q.; Jin, J. The gentrification and urban renew: In case of Nanjing. Urban Stud. 2004, 11, 33–37. (In Chinese) [Google Scholar]
Figure 1.
The schematic diagram of the Cross Impact Matrix Multiplication Applied to a Classification (MICMAC) analysis.
Figure 1.
The schematic diagram of the Cross Impact Matrix Multiplication Applied to a Classification (MICMAC) analysis.

Figure 2.
Interpretative Structure Modeling (ISM) digraph for the dynamic factors.

Figure 3.
Driving power and dependence power diagram.


Table 1.
Super-gentrification dynamic factors and their explanations.
| Factors | Description | References |
|---|---|---|
| S1 Economic Globalization | Cross-national and cross-regional flow of production elements, including commodities, information, currency, technology, personnel, capital, services, and management experience, which made the world economy an increasingly integrated whole. | [1,4,5,25,26,27,28,29,30,31,32,33,34,35] |
| S2 Housing Needs of Overseas Elites | Housing needs of international elites who have rich assets, high social status, and are highly educated in metropolis due to their work or living needs. | [4,5,29,30,36] |
| S3 Urban Social Stratification | Stratification of urban residents due to the different possession of social resources such as income, prestige, and rights. | [2,7,27,29,30,31,35,37,38] |
| S4 Widening Gap between Rich and Poor | Income and wealth gap between rural and urban areas, industries, regions, and social groups is gradually widening. | [1,2,4,5,27,29,31,32,35,36,37,39,40] |
| S5 Cultural Attraction | Unique cultural attributes of a certain region, such as architecture and humanities, which attract super-gentrifiers to move into. | [2,5,26,28,29,31,32,34,35,36,37,38,39,40] |
| S6 Identity Pursuit | Living in a certain area in order to show personal wealth and social status. | [2,5,9,39] |
| S7 Unique Areas and Lifestyle Preferences | Preferences of super-gentrifiers for certain areas and lifestyles in metropolis. | [1,5,7,9,25,26,28,29,30,32,34,35,39] |
| S8 Close to Commercial and Recreational Facilities | There are convenient commercial facilities and entertainment facilities nearby for the consumption and entertainment of super-gentrifiers. | [4,5,9,26,35,36] |
| S9 Investment Needs | Super-gentrifiers buying real estate in certain areas of the city in order to preserve and increase their assets. | [4,5,25,28,29,34,40] |
| S10 Demographic Change | Changes in the overall gender structure and age structure of the population in a certain region and at a certain point in time. | [3,5,7,9,25,27,29,34,38,41,42] |
| S11 Further Improvement of the Market Economy System | Continuous improvement of the economic system in which the market plays a fundamental role in regulating resource allocation. | [26,27,32] |
| S12 Uneven Distribution of Educational Resources and School District Policy | Due to the uneven distribution of high-quality education resources in primary and secondary schools, high-quality education resources are linked to commercial housing through the division of school districts. | [35,36,37,39,40] |
| S13 Government Policy Guidance | A series of laws and policies formulated by the state or political party to guide people to strive for the realization of tasks in a certain historical period. | [2,4,7,25,26,27,28,31,35,36,37,38,39,40,42] |
| S14 Commercialization of Urban Governance | The state governs the city in accordance with the principles of independent economic accounting. | [26,29,30] |
| S15 Development of the Real Estate Market | Improving the living conditions and living standards of residents by building new houses or renovating old houses, thereby driving the development of many industries, such as the construction industry and the building materials industry. | [2,5,6,9,25,26,27,28,29,31,32,42] |
| S16 Popularization of University Education | The expansion of enrollment in higher education institutions and the increase in university enrollment rate. | [9,32,36,41] |
| S17 The Rapid Growth of High-Paying Employment Opportunities | A substantial increase in high-paying jobs. | [4,5,9,29,34,35,39,42] |
| S18 Continuous Expansion of Global Financial Capital | The transfer of capital from one country or region to another, that is, the flow of capital between countries. | [4,5,9,28,29,31,33] |
| S19 Early Gentrification in the Region | The region has already experienced a round of gentrification in which the middle class displaced the working-class residents. | [3,4,5,6,9,33,35] |
| S20 Re-Urbanization | The process of re-urbanizing a city’s central area that has been declining due to counter-urbanization. | [5,7,25,26,35,39] |
| S21 Diversity of Urban Development Investors | In the process of urban development, the main body of investment gradually shifts from the single investment of the state to the cooperative investment of the state, enterprises, and individuals. | [7,26,29] |
| S22 Marketization of Urban Land Use System and Housing System | The realization of the adequate and reasonable allocation of housing and land resources to achieve the goal of maximizing efficiency guided by market demand. | [5,26,29,30,36,37,40] |
| S23 Transformation of Industrial Structure and Occupational Structure in Urban Central Areas | Fundamental transformation of the proportion of agriculture, industry and service industry in urban economic structure and the fundamental change in the occupational composition and hierarchical characteristics of the population in urban central areas. | [4,5,28,29,30,36,39,42] |
Table 2.
The adjacency matrix of super-gentrification dynamic factors.
| S1 | S2 | S3 | S4 | S5 | S6 | S7 | S8 | S9 | S10 | S11 | S12 | S13 | S14 | S15 | S16 | S17 | S18 | S19 | S20 | S21 | S22 | S23 | |
|---|---|---|---|---|---|---|---|---|---|---|---|---|---|---|---|---|---|---|---|---|---|---|---|
| S1 | 0 | 0 | 0 | 0 | 0 | 0 | 0 | 0 | 0 | 0 | 0 | 0 | 0 | 0 | 0 | 0 | 0 | 0 | 0 | 0 | 0 | 0 | 0 |
| S2 | 1 | 0 | 0 | 0 | 0 | 0 | 0 | 0 | 0 | 0 | 0 | 0 | 0 | 0 | 1 | 0 | 0 | 1 | 0 | 0 | 0 | 0 | 0 |
| S3 | 1 | 0 | 0 | 1 | 0 | 0 | 0 | 0 | 0 | 0 | 0 | 0 | 0 | 0 | 0 | 0 | 0 | 0 | 1 | 0 | 0 | 0 | 0 |
| S4 | 0 | 0 | 1 | 0 | 0 | 0 | 0 | 0 | 0 | 0 | 0 | 0 | 0 | 0 | 0 | 0 | 0 | 0 | 0 | 0 | 0 | 0 | 0 |
| S5 | 0 | 0 | 0 | 0 | 0 | 0 | 0 | 0 | 0 | 0 | 0 | 0 | 0 | 0 | 0 | 0 | 0 | 0 | 0 | 0 | 0 | 0 | 0 |
| S6 | 0 | 0 | 1 | 0 | 0 | 0 | 0 | 0 | 0 | 0 | 0 | 0 | 0 | 0 | 0 | 0 | 0 | 0 | 0 | 0 | 0 | 0 | 0 |
| S7 | 0 | 1 | 0 | 0 | 0 | 1 | 0 | 0 | 0 | 0 | 0 | 0 | 0 | 0 | 0 | 0 | 0 | 0 | 0 | 0 | 0 | 0 | 0 |
| S8 | 0 | 0 | 0 | 0 | 0 | 0 | 0 | 0 | 0 | 0 | 0 | 0 | 0 | 0 | 0 | 0 | 0 | 0 | 0 | 0 | 0 | 0 | 0 |
| S9 | 1 | 1 | 0 | 0 | 0 | 0 | 0 | 1 | 0 | 0 | 1 | 0 | 0 | 0 | 1 | 0 | 0 | 0 | 0 | 1 | 0 | 1 | 0 |
| S10 | 1 | 0 | 0 | 0 | 0 | 0 | 0 | 0 | 0 | 0 | 0 | 0 | 0 | 0 | 0 | 0 | 0 | 0 | 0 | 0 | 0 | 0 | 0 |
| S11 | 1 | 0 | 0 | 0 | 0 | 0 | 0 | 0 | 0 | 0 | 0 | 0 | 1 | 0 | 0 | 0 | 0 | 0 | 0 | 0 | 1 | 1 | 0 |
| S12 | 0 | 0 | 0 | 0 | 0 | 0 | 0 | 0 | 0 | 0 | 0 | 0 | 1 | 0 | 0 | 1 | 0 | 0 | 0 | 0 | 0 | 0 | 0 |
| S13 | 0 | 0 | 0 | 0 | 0 | 0 | 0 | 0 | 0 | 0 | 0 | 1 | 0 | 0 | 0 | 0 | 0 | 0 | 0 | 0 | 0 | 0 | 0 |
| S14 | 0 | 0 | 0 | 0 | 0 | 0 | 0 | 0 | 0 | 0 | 1 | 0 | 0 | 0 | 0 | 0 | 0 | 0 | 0 | 0 | 0 | 0 | 0 |
| S15 | 1 | 1 | 0 | 0 | 0 | 0 | 0 | 0 | 1 | 0 | 1 | 1 | 1 | 1 | 0 | 0 | 0 | 0 | 1 | 1 | 1 | 1 | 1 |
| S16 | 0 | 0 | 0 | 0 | 0 | 0 | 0 | 0 | 0 | 0 | 0 | 0 | 1 | 0 | 0 | 0 | 0 | 0 | 0 | 0 | 0 | 0 | 0 |
| S17 | 1 | 0 | 0 | 0 | 0 | 0 | 0 | 0 | 0 | 0 | 1 | 0 | 0 | 0 | 0 | 0 | 0 | 0 | 0 | 0 | 0 | 0 | 0 |
| S18 | 1 | 0 | 0 | 0 | 0 | 0 | 0 | 0 | 0 | 0 | 0 | 0 | 1 | 0 | 0 | 0 | 0 | 0 | 0 | 0 | 0 | 0 | 0 |
| S19 | 0 | 0 | 1 | 0 | 0 | 0 | 0 | 0 | 0 | 0 | 0 | 0 | 0 | 0 | 0 | 0 | 0 | 0 | 0 | 0 | 0 | 0 | 0 |
| S20 | 0 | 0 | 0 | 0 | 0 | 0 | 0 | 0 | 0 | 0 | 1 | 0 | 0 | 0 | 0 | 0 | 0 | 0 | 0 | 0 | 0 | 0 | 0 |
| S21 | 0 | 0 | 0 | 0 | 0 | 0 | 0 | 0 | 0 | 0 | 1 | 0 | 1 | 1 | 0 | 0 | 0 | 0 | 0 | 0 | 0 | 0 | 0 |
| S22 | 0 | 0 | 0 | 0 | 0 | 0 | 0 | 0 | 0 | 0 | 1 | 0 | 1 | 1 | 0 | 0 | 0 | 0 | 0 | 0 | 0 | 0 | 0 |
| S23 | 1 | 0 | 0 | 0 | 0 | 0 | 0 | 0 | 0 | 0 | 1 | 0 | 0 | 0 | 0 | 0 | 1 | 1 | 0 | 1 | 0 | 0 | 0 |
Table 3.
The accessibility matrix of super-gentrification dynamic factors.
| S1 | S2 | S3 | S4 | S5 | S6 | S7 | S8 | S9 | S10 | S11 | S12 | S13 | S14 | S15 | S16 | S17 | S18 | S19 | S20 | S21 | S22 | S23 | |
|---|---|---|---|---|---|---|---|---|---|---|---|---|---|---|---|---|---|---|---|---|---|---|---|
| S1 | 1 | 0 | 0 | 0 | 0 | 0 | 0 | 0 | 0 | 0 | 0 | 0 | 0 | 0 | 0 | 0 | 0 | 0 | 0 | 0 | 0 | 0 | 0 |
| S2 | 1 | 1 | 1 | 1 | 0 | 0 | 0 | 1 | 1 | 0 | 1 | 1 | 1 | 1 | 1 | 1 | 1 | 1 | 1 | 1 | 1 | 1 | 1 |
| S3 | 1 | 0 | 1 | 1 | 0 | 0 | 0 | 0 | 0 | 0 | 0 | 0 | 0 | 0 | 0 | 0 | 0 | 0 | 1 | 0 | 0 | 0 | 0 |
| S4 | 1 | 0 | 1 | 1 | 0 | 0 | 0 | 0 | 0 | 0 | 0 | 0 | 0 | 0 | 0 | 0 | 0 | 0 | 1 | 0 | 0 | 0 | 0 |
| S5 | 0 | 0 | 0 | 0 | 1 | 0 | 0 | 0 | 0 | 0 | 0 | 0 | 0 | 0 | 0 | 0 | 0 | 0 | 0 | 0 | 0 | 0 | 0 |
| S6 | 1 | 0 | 1 | 1 | 0 | 1 | 0 | 0 | 0 | 0 | 0 | 0 | 0 | 0 | 0 | 0 | 0 | 0 | 1 | 0 | 0 | 0 | 0 |
| S7 | 1 | 1 | 1 | 1 | 0 | 1 | 1 | 1 | 1 | 0 | 1 | 1 | 1 | 1 | 1 | 1 | 1 | 1 | 1 | 1 | 1 | 1 | 1 |
| S8 | 0 | 0 | 0 | 0 | 0 | 0 | 0 | 1 | 0 | 0 | 0 | 0 | 0 | 0 | 0 | 0 | 0 | 0 | 0 | 0 | 0 | 0 | 0 |
| S9 | 1 | 1 | 1 | 1 | 0 | 0 | 0 | 1 | 1 | 0 | 1 | 1 | 1 | 1 | 1 | 1 | 1 | 1 | 1 | 1 | 1 | 1 | 1 |
| S10 | 1 | 0 | 0 | 0 | 0 | 0 | 0 | 0 | 0 | 1 | 0 | 0 | 0 | 0 | 0 | 0 | 0 | 0 | 0 | 0 | 0 | 0 | 0 |
| S11 | 1 | 0 | 0 | 0 | 0 | 0 | 0 | 0 | 0 | 0 | 1 | 1 | 1 | 1 | 0 | 1 | 0 | 0 | 0 | 0 | 1 | 1 | 0 |
| S12 | 0 | 0 | 0 | 0 | 0 | 0 | 0 | 0 | 0 | 0 | 0 | 1 | 1 | 0 | 0 | 1 | 0 | 0 | 0 | 0 | 0 | 0 | 0 |
| S13 | 0 | 0 | 0 | 0 | 0 | 0 | 0 | 0 | 0 | 0 | 0 | 1 | 1 | 0 | 0 | 1 | 0 | 0 | 0 | 0 | 0 | 0 | 0 |
| S14 | 1 | 0 | 0 | 0 | 0 | 0 | 0 | 0 | 0 | 0 | 1 | 1 | 1 | 1 | 0 | 1 | 0 | 0 | 0 | 0 | 1 | 1 | 0 |
| S15 | 1 | 1 | 1 | 1 | 0 | 0 | 0 | 1 | 1 | 0 | 1 | 1 | 1 | 1 | 1 | 1 | 1 | 1 | 1 | 1 | 1 | 1 | 1 |
| S16 | 0 | 0 | 0 | 0 | 0 | 0 | 0 | 0 | 0 | 0 | 0 | 1 | 1 | 0 | 0 | 1 | 0 | 0 | 0 | 0 | 0 | 0 | 0 |
| S17 | 1 | 0 | 0 | 0 | 0 | 0 | 0 | 0 | 0 | 0 | 1 | 1 | 1 | 1 | 0 | 1 | 1 | 0 | 0 | 0 | 1 | 1 | 0 |
| S18 | 1 | 0 | 0 | 0 | 0 | 0 | 0 | 0 | 0 | 0 | 0 | 1 | 1 | 0 | 0 | 1 | 0 | 1 | 0 | 0 | 0 | 0 | 0 |
| S19 | 1 | 0 | 1 | 1 | 0 | 0 | 0 | 0 | 0 | 0 | 0 | 0 | 0 | 0 | 0 | 0 | 0 | 0 | 1 | 0 | 0 | 0 | 0 |
| S20 | 1 | 0 | 0 | 0 | 0 | 0 | 0 | 0 | 0 | 0 | 1 | 1 | 1 | 1 | 0 | 1 | 0 | 0 | 0 | 1 | 1 | 1 | 0 |
| S21 | 1 | 0 | 0 | 0 | 0 | 0 | 0 | 0 | 0 | 0 | 1 | 1 | 1 | 1 | 0 | 1 | 0 | 0 | 0 | 0 | 1 | 1 | 0 |
| S22 | 1 | 0 | 0 | 0 | 0 | 0 | 0 | 0 | 0 | 0 | 1 | 1 | 1 | 1 | 0 | 1 | 0 | 0 | 0 | 0 | 1 | 1 | 0 |
| S23 | 1 | 0 | 0 | 0 | 0 | 0 | 0 | 0 | 0 | 0 | 1 | 1 | 1 | 1 | 0 | 1 | 1 | 1 | 0 | 1 | 1 | 1 | 1 |
Table 4.
Dynamic factors hierarchical iteration.
| Si | R(Si) | A(Si) | R(Si) ∩ A(Si) | Level (Li) |
|---|---|---|---|---|
| S1 | 1 | 1,2,3,4,6,7,9,10,11,14,15,17,18,19,20,21,22,23 | 1 | L1 |
| S2 | 2,9,15 | 2,7,9,15 | 2,9,15 | L5 |
| S3 | 3,4,19 | 2,3,4,6,7,9,15,19 | 3,4,19 | L2 |
| S4 | 3,4,19 | 2,3,4,6,7,9,15,19 | 3,4,19 | L2 |
| S5 | 5 | 5 | 5 | L1 |
| S6 | 6 | 6,7 | 6 | L3 |
| S7 | 7 | 7 | 7 | L6 |
| S8 | 8 | 2,7,8,9,15 | 8 | L1 |
| S9 | 2,9,15 | 2,7,9,15 | 2,9,15 | L5 |
| S10 | 10 | 10 | 10 | L2 |
| S11 | 11,14,21,22 | 2,7,9,11,14,15,17,20,21,22,23 | 11,14,21,22 | L2 |
| S12 | 12,13,16 | 2,7,9,11,12,13,14,15,16,17,18,20,21,22,23 | 12,13,16 | L1 |
| S13 | 12,13,16 | 2,7,9,11,12,13,14,15,16,17,18,20,21,22,23 | 12,13,16 | L1 |
| S14 | 11,14,21,22 | 2,7,9,11,14,15,17,20,21,22,23 | 11,14,21,22 | L2 |
| S15 | 2,9,15 | 2,7,9,15 | 2,9,15 | L5 |
| S16 | 12,13,16 | 2,7,9,11,12,13,14,15,16,17,18,20,21,22,23 | 12,13,16 | L1 |
| S17 | 17 | 2,7,9,15,17,23 | 17 | L3 |
| S18 | 18 | 2,7,9,15,18,23 | 18 | L2 |
| S19 | 3,4,19 | 2,3,4,6,7,9,15,19 | 3,4,19 | L2 |
| S20 | 20 | 2,7,9,15,20,23 | 20 | L3 |
| S21 | 11,14,21,22 | 2,7,9,11,14,15,17,20,21,22,23 | 11,14,21,22 | L2 |
| S22 | 11,14,21,22 | 2,7,9,11,14,15,17,20,21,22,23 | 11,14,21,22 | L2 |
| S23 | 23 | 2,7,9,15,23 | 23 | L4 |
Table 5.
The inter-level accessibility matrix of super-gentrification dynamic factors.
| S1 | S5 | S8 | S12 | S13 | S16 | S3 | S4 | S19 | S10 | S11 | S14 | S21 | S22 | S18 | S6 | S17 | S20 | S23 | S2 | S9 | S15 | S7 | |
|---|---|---|---|---|---|---|---|---|---|---|---|---|---|---|---|---|---|---|---|---|---|---|---|
| S1 | 1 | 0 | 0 | 0 | 0 | 0 | 0 | 0 | 0 | 0 | 0 | 0 | 0 | 0 | 0 | 0 | 0 | 0 | 0 | 0 | 0 | 0 | 0 |
| S5 | 0 | 1 | 0 | 0 | 0 | 0 | 0 | 0 | 0 | 0 | 0 | 0 | 0 | 0 | 0 | 0 | 0 | 0 | 0 | 0 | 0 | 0 | 0 |
| S8 | 0 | 0 | 1 | 0 | 0 | 0 | 0 | 0 | 0 | 0 | 0 | 0 | 0 | 0 | 0 | 0 | 0 | 0 | 0 | 0 | 0 | 0 | 0 |
| S12 | 0 | 0 | 0 | 1 | 1 | 1 | 0 | 0 | 0 | 0 | 0 | 0 | 0 | 0 | 0 | 0 | 0 | 0 | 0 | 0 | 0 | 0 | 0 |
| S13 | 0 | 0 | 0 | 1 | 1 | 1 | 0 | 0 | 0 | 0 | 0 | 0 | 0 | 0 | 0 | 0 | 0 | 0 | 0 | 0 | 0 | 0 | 0 |
| S16 | 0 | 0 | 0 | 1 | 1 | 1 | 0 | 0 | 0 | 0 | 0 | 0 | 0 | 0 | 0 | 0 | 0 | 0 | 0 | 0 | 0 | 0 | 0 |
| S3 | 1 | 0 | 0 | 0 | 0 | 0 | 1 | 1 | 1 | 0 | 0 | 0 | 0 | 0 | 0 | 0 | 0 | 0 | 0 | 0 | 0 | 0 | 0 |
| S4 | 1 | 0 | 0 | 0 | 0 | 0 | 1 | 1 | 1 | 0 | 0 | 0 | 0 | 0 | 0 | 0 | 0 | 0 | 0 | 0 | 0 | 0 | 0 |
| S19 | 1 | 0 | 0 | 0 | 0 | 0 | 1 | 1 | 1 | 0 | 0 | 0 | 0 | 0 | 0 | 0 | 0 | 0 | 0 | 0 | 0 | 0 | 0 |
| S10 | 1 | 0 | 0 | 0 | 0 | 0 | 0 | 0 | 0 | 1 | 0 | 0 | 0 | 0 | 0 | 0 | 0 | 0 | 0 | 0 | 0 | 0 | 0 |
| S11 | 1 | 0 | 0 | 1 | 1 | 1 | 0 | 0 | 0 | 0 | 1 | 1 | 1 | 1 | 0 | 0 | 0 | 0 | 0 | 0 | 0 | 0 | 0 |
| S14 | 1 | 0 | 0 | 1 | 1 | 1 | 0 | 0 | 0 | 0 | 1 | 1 | 1 | 1 | 0 | 0 | 0 | 0 | 0 | 0 | 0 | 0 | 0 |
| S21 | 1 | 0 | 0 | 1 | 1 | 1 | 0 | 0 | 0 | 0 | 1 | 1 | 1 | 1 | 0 | 0 | 0 | 0 | 0 | 0 | 0 | 0 | 0 |
| S22 | 1 | 0 | 0 | 1 | 1 | 1 | 0 | 0 | 0 | 0 | 1 | 1 | 1 | 1 | 0 | 0 | 0 | 0 | 0 | 0 | 0 | 0 | 0 |
| S18 | 1 | 0 | 0 | 1 | 1 | 1 | 0 | 0 | 0 | 0 | 0 | 0 | 0 | 0 | 1 | 0 | 0 | 0 | 0 | 0 | 0 | 0 | 0 |
| S6 | 1 | 0 | 0 | 0 | 0 | 0 | 1 | 1 | 1 | 0 | 0 | 0 | 0 | 0 | 0 | 1 | 0 | 0 | 0 | 0 | 0 | 0 | 0 |
| S17 | 1 | 0 | 0 | 1 | 1 | 1 | 0 | 0 | 0 | 0 | 1 | 1 | 1 | 1 | 0 | 0 | 1 | 0 | 0 | 0 | 0 | 0 | 0 |
| S20 | 1 | 0 | 0 | 1 | 1 | 1 | 0 | 0 | 0 | 0 | 1 | 1 | 1 | 1 | 0 | 0 | 0 | 1 | 0 | 0 | 0 | 0 | 0 |
| S23 | 1 | 0 | 0 | 1 | 1 | 1 | 0 | 0 | 0 | 0 | 1 | 1 | 1 | 1 | 1 | 0 | 1 | 1 | 1 | 0 | 0 | 0 | 0 |
| S2 | 1 | 0 | 1 | 1 | 1 | 1 | 1 | 1 | 1 | 0 | 1 | 1 | 1 | 1 | 1 | 0 | 1 | 1 | 1 | 1 | 1 | 1 | 0 |
| S9 | 1 | 0 | 1 | 1 | 1 | 1 | 1 | 1 | 1 | 0 | 1 | 1 | 1 | 1 | 1 | 0 | 1 | 1 | 1 | 1 | 1 | 1 | 0 |
| S15 | 1 | 0 | 1 | 1 | 1 | 1 | 1 | 1 | 1 | 0 | 1 | 1 | 1 | 1 | 1 | 0 | 1 | 1 | 1 | 1 | 1 | 1 | 0 |
| S7 | 1 | 0 | 1 | 1 | 1 | 1 | 1 | 1 | 1 | 0 | 1 | 1 | 1 | 1 | 1 | 1 | 1 | 1 | 1 | 1 | 1 | 1 | 1 |
Table 6.
The ordered reduced accessibility matrix of super-gentrification dynamic factors.
| S1 | S5 | S8 | S12 | S3 | S10 | S11 | S18 | S6 | S17 | S20 | S23 | S2 | S7 | |
|---|---|---|---|---|---|---|---|---|---|---|---|---|---|---|
| S1 | 1 | 0 | 0 | 0 | 0 | 0 | 0 | 0 | 0 | 0 | 0 | 0 | 0 | 0 |
| S5 | 0 | 1 | 0 | 0 | 0 | 0 | 0 | 0 | 0 | 0 | 0 | 0 | 0 | 0 |
| S8 | 0 | 0 | 1 | 0 | 0 | 0 | 0 | 0 | 0 | 0 | 0 | 0 | 0 | 0 |
| S12 | 0 | 0 | 0 | 1 | 0 | 0 | 0 | 0 | 0 | 0 | 0 | 0 | 0 | 0 |
| S3 | 1 | 0 | 0 | 0 | 1 | 0 | 0 | 0 | 0 | 0 | 0 | 0 | 0 | 0 |
| S10 | 1 | 0 | 0 | 0 | 0 | 1 | 0 | 0 | 0 | 0 | 0 | 0 | 0 | 0 |
| S11 | 1 | 0 | 0 | 1 | 0 | 0 | 1 | 0 | 0 | 0 | 0 | 0 | 0 | 0 |
| S18 | 1 | 0 | 0 | 1 | 0 | 0 | 0 | 1 | 0 | 0 | 0 | 0 | 0 | 0 |
| S6 | 1 | 0 | 0 | 0 | 1 | 0 | 0 | 0 | 1 | 0 | 0 | 0 | 0 | 0 |
| S17 | 1 | 0 | 0 | 1 | 0 | 0 | 1 | 0 | 0 | 1 | 0 | 0 | 0 | 0 |
| S20 | 1 | 0 | 0 | 1 | 0 | 0 | 1 | 0 | 0 | 0 | 1 | 0 | 0 | 0 |
| S23 | 1 | 0 | 0 | 1 | 0 | 0 | 1 | 1 | 0 | 1 | 1 | 1 | 0 | 0 |
| S2 | 1 | 0 | 1 | 1 | 1 | 0 | 1 | 1 | 0 | 1 | 1 | 1 | 1 | 0 |
| S7 | 1 | 0 | 1 | 1 | 1 | 0 | 1 | 1 | 1 | 1 | 1 | 1 | 1 | 1 |
Table 7.
Driving power and dependence power values of super-gentrification dynamic factors.
| Dynamic Factor | Driving Power | Dependence Power | Dynamic Factor | Driving Power | Dependence Power |
|---|---|---|---|---|---|
| S1 | 1 | 18 | S13 | 3 | 15 |
| S2 | 19 | 4 | S14 | 8 | 11 |
| S3 | 4 | 8 | S15 | 19 | 4 |
| S4 | 4 | 8 | S16 | 3 | 15 |
| S5 | 1 | 1 | S17 | 9 | 6 |
| S6 | 5 | 2 | S18 | 5 | 6 |
| S7 | 21 | 1 | S19 | 4 | 8 |
| S8 | 1 | 5 | S20 | 9 | 6 |
| S9 | 19 | 4 | S21 | 8 | 11 |
| S10 | 2 | 1 | S22 | 8 | 11 |
| S11 | 8 | 11 | S23 | 12 | 5 |
| S12 | 3 | 15 | Total | 178 | 178 |
© 2020 by the authors. Licensee MDPI, Basel, Switzerland. This article is an open access article distributed under the terms and conditions of the Creative Commons Attribution (CC BY) license (http://creativecommons.org/licenses/by/4.0/).
Share and Cite
MDPI and ACS Style
Shi, J.; Duan, K.; Xu, Q.; Li, J. Analysis of Super-Gentrification Dynamic Factors Using Interpretative Structure Modeling. Land 2020, 9, 45. https://doi.org/10.3390/land9020045
AMA Style
Shi J, Duan K, Xu Q, Li J. Analysis of Super-Gentrification Dynamic Factors Using Interpretative Structure Modeling. Land. 2020; 9(2):45. https://doi.org/10.3390/land9020045
Chicago/Turabian StyleShi, Jiangang, Kaifeng Duan, Quanwei Xu, and Jiajia Li. 2020. "Analysis of Super-Gentrification Dynamic Factors Using Interpretative Structure Modeling" Land 9, no. 2: 45. https://doi.org/10.3390/land9020045
Note that from the first issue of 2016, this journal uses article numbers instead of page numbers. See further details here.