Vegetation Structure, Species Composition, and Carbon Sink Potential of Urban Green Spaces in Nagpur City, India


1
United Nations University Institute for the Advanced Study of Sustainability (UNU-IAS), Tokyo 150-8925, Japan
2
Independent Researcher, Tokyo 136-0073, Japan
3
Jawaharlal Nehru University, New Delhi 110067, India
4
Institute for Global Environmental Strategies (IGES), Kanagawa 240-0115, Japan
*
Author to whom correspondence should be addressed.
Land 2020, 9(4), 107; https://doi.org/10.3390/land9040107
Submission received: 24 February 2020
/
Revised: 29 March 2020
/
Accepted: 30 March 2020
/
Published: 1 April 2020
(This article belongs to the Special Issue Nature-based solutions (NBS) in Cities and Their Interaction with Urban Land, Ecosystems, Built Environment and People: Debating Societal Implications)
Abstract
:Nagpur is rapidly urbanizing, and in the process witnessing decline in its green status which is one of the identities of the city. The study aims to understand the current species diversity, composition and structure in different classes of greens prevalent in the city. As urban green spaces (UGS) are also reservoirs of carbon stock, the study estimates their biomass. Through rigorous field work, data were collected from 246 sample plots across various UGS classes as pre-stratification. Then the biomass was estimated using non-destructive method with species-specific equation. The diversity of tree species recorded in UGS varies, with high diversity recorded in avenue plantation and institutional compounds. The overall variation in species composition among UGS classes was 36.8%. While in managed greens the species composition was similar, in institutional greens and forest it was different. Particularly, in forest the evenness was high with low diversity and low species richness. The structural distribution indicate lack of old trees in the city, with high number of tree species between diameter classes of 10–40 cm. Biomass was recorded high in road-side plantations (335 t ha−1) and playgrounds (324 t ha−1), and trees with bigger girth size where the main contributors. The dominant species indicates that high growth rate, tolerance to drought and pollution are the key attributes considered for species selection by local authorities. Though the city holds green image, vegetation along the avenues and institutions are stressed, exposed, and threatened by felling activities for grey infrastructure expansions. In such scenario, protection and preservation of older trees is crucial to maintain the carbon stock of the city. In addition, local authorities need to focus on effective afforestation programs through public participation to achieve high survival rate and reduce the maintenance cost. For species selection in addition to phenology and growth rate, tree biomass and life span needs to be considered to significantly enhance the urban environment and increase the benefits derived from UGS.
1. Introduction
Urban green spaces (UGS) act as “lungs of city” and reservoirs of “carbon stock.” The vegetation patches in and around the urban areas sequester and store large amount of carbon [1,2]. UGS also contribute toward mitigation of climate change impacts via carbon sequestration and provide various benefits [3]. UGS provide a broad range of ecosystem benefits [4], and through application of nature-based solutions the urban vegetation can generate co-benefits [5,6] by restoring ecological flow in urban areas and strengthen sustainable urbanization with stimulated economic growth as well as improved environment [7,8]. For example, organic farming in urban vacant patches can allow to sequester carbon from the atmosphere through increased organic matter content in soil [9]. Further, though the accumulated carbon of these “non-forested” areas are lower as compared to forested areas, they are important to maintain the local and national carbon balances [10]. With increasing urban areas, even the smaller share of carbon sink from the urban vegetation is playing an important role and is also increasing significantly in size [11]. However, in developing countries the urban carbon reservoirs are significantly affected by fast pace urbanization which leads to alteration in land-cover and change in overall vegetation structure [12,13].
Particularly in India, urbanization is engulfing significant portion of peri-urban arable land, causing substantial loss in green spaces [14]. In the emerging urban centers (1 million population and above) the urban planning efforts are disproportionate as compared to the metropolitan cities, with less priority toward UGS provisions against other infrastructure demands like housing, water and sanitation, energy supply, which accelerates the challenges. In these emerging urban centers, though the benefits of UGS are recognized [15], in general they are undervalued and are facing either destruction or degradation in all major cities of India [16]. The increasing urban sprawl and infrastructure development make the UGS vulnerable [17]. In such scenario, urban planning efforts to save hectares of arable land [18] are urgently needed to save these reservoirs of carbon. Hence, Government of India (GOI) has launched missions like National Mission of Green India and National Mission on Sustainable Habitat under National Action Plan on Climate Change (NAPCC). The aim of the missions is to enhance carbon sink potential of urban areas by undertaking afforestation programs [19]. However, at present, scanty information of carbon sink potential of urban areas and non-availability of local vegetation data of the urban trees hinder afforestation and mass-planting programs. Thus emerges the need of more local level studies to record vegetation structure and carbon sink potential of greens to achieve low carbon scenario envisioned by NAPCC [20] mission [21].
In developed countries, like North America and Europe vegetation data are recorded for many urban forest and urban greens because of freely available assessment and modelling tools like i-Tree Eco and UFORE (urban forest effects model). The tools provide detailed plant inventory and species-specific data, which makes carbon stock assessment process easier and faster, hence widely applied in local areas. However, these tools are not applicable in other areas because of substantial difference in pattern of urbanization, biophysical variable, vegetation type and structure [22]. Thus, lack of local species data and unavailability of modelling tools make the vegetation studies dependent on intensive field work with high resource requirements. Also, most of these studies are limited to national and regional forest reserves. Only a few studies of urban forest carbon assessment are carried out so far; further, a limited tree inventory data and biomass assessment of Indian cities lead to immense gap in this research area [23]. These few and limited studies include, vegetation study of Bangalore, urban forest of Vishakhapatnam, Chandigarh’s urban vegetation, Delhi and Gandhinagar’s biomass data [12,24,25,26,27,28]. Some local carbon stock studies are also available for Bhopal, Delhi, and Pune [29,30,31] however, the studies used low-resolution remotely sensed data which fail to capture the finely grained mosaic of land-covers represented by cities [32]. Moreover, most of these studies have focused on vegetation survey with the inventory list, which provides valuable information about local flora. However, this does not account for the variation in vegetation structure and composition associated with different land ownership aspect prevalent in the city landscapes [33].
For the selected study area “Nagpur city,” the available vegetation data have been recorded in the form of an inventory list devoid of any compositional, structural, or biomass assessment. The carbon sink potential of the urban forest has also not been recorded so far. The ecosystem assessment of NEERI urban forest [34] was conducted a decade ago and the floral diversity of the city was captured in 2013 by Chaturvedi et al. However, the authors have identified the need of quantification of species diversity and carbon stock in different land use. The earlier cited studies of Indian cities also indicate the necessity of focusing on non-forested but tree-dominated areas of the city like institutional campuses, reserved public greens, and road-side plantation for carbon assessment [23]. Additionally, Tripathi and Bedi have highlighted the importance of measuring carbon sink potential of urban greens along with the detailed inventory of species composition and distribution within different green spaces [21]. Further, within the studied city, the UGS are fragmented and discontinuously dispersed throughout the built-up matrix. The urbanization and urban sprawl studies clearly indicate changing land cover of city and reduction in green cover area of the city [35,36]. Thus, in urban transition scenario it is vital to understand the vegetation composition prevalent in UGS classes and based on their potential understand their relevant importance to act as carbon sink areas. The quantified data on UGS carbon sink potential based on UGS classes could act as one the benefits derived from UGS, thus helping in prioritization of UGS planning in urban policy reforms to a more granular level in the urban mosaic. Taking this and the identified gaps in literature into consideration, the overarching aim of the study is to record the much-needed local vegetation data and evaluate the carbon sink potential of UGS for their effective management. The record of local vegetation data is aimed to develop local greening strategies by understanding the species distribution, diversity, and composition among different UGS classes with their current carbon stock. The main objectives are: (1) Understanding the tree species structure, diversity, and composition differences among UGS classes; (2) estimating the biomass and carbon stock of UGS; (3) establishing linkage between vegetation structure, species diversity, and carbon stock to guide strategic vegetation planting and management for enhancement of urban carbon sink. Thus, through the adopted approach of capturing the details of urban vegetation the research hypothesizes that the diversity and carbon sink potential of UGS varies among UGS classes.
2. Materials and Methods
2.1. Introduction to Study Area
Nagpur city, the 13th largest urban area in India and the third biggest in the state of Maharashtra, is selected for phytosociology and biomass assessment (Figure 1a). The city is situated at a latitude of 21◦9’ N and 79◦6’ E with the average elevation of 303 m above sea level. The city has tropical savannah climate (Aw in Köppen climate classification) with typically hot, dry, and tropical weather with an average annual rainfall of 1162 mm, where summer temperature escalates to 48 °C and the winter temperature dips to 10 to 12 °C. With several identities “zero-mile city,” “orange city,” and “garden city of Maharashtra,” Nagpur is an interesting case for vegetation assessment. The district records rich plant composition of 1136 plant species [37] and 124 tree species at city scale [38]. The public UGS classes present in the city are recreational UGS, open UGS, public institutionalized greens, infrastructure and utility corridor greens, and vacant lands [39].
2.2. Sampling and Data Collection
UGS are the combination of both public and private types of green spaces. Among these different classes, the vegetation and landscape character differ depending upon the ownership, management, and available resources [40]. Private greens also contribute toward urban environment; however, because of accessibility issue as well as relatively less predictability over their future development, only public UGS are considered for this study. Among the ten administrative zones present in the city, three representative zones were selected from east, west, and center as highlighted in Figure 1b. The identified zones fairly represent the overall vegetation conditions of the city, population density, per-capita green space availability, and public UGS classes [41]. The UGS classes present in each zone are indicted in Table 1.
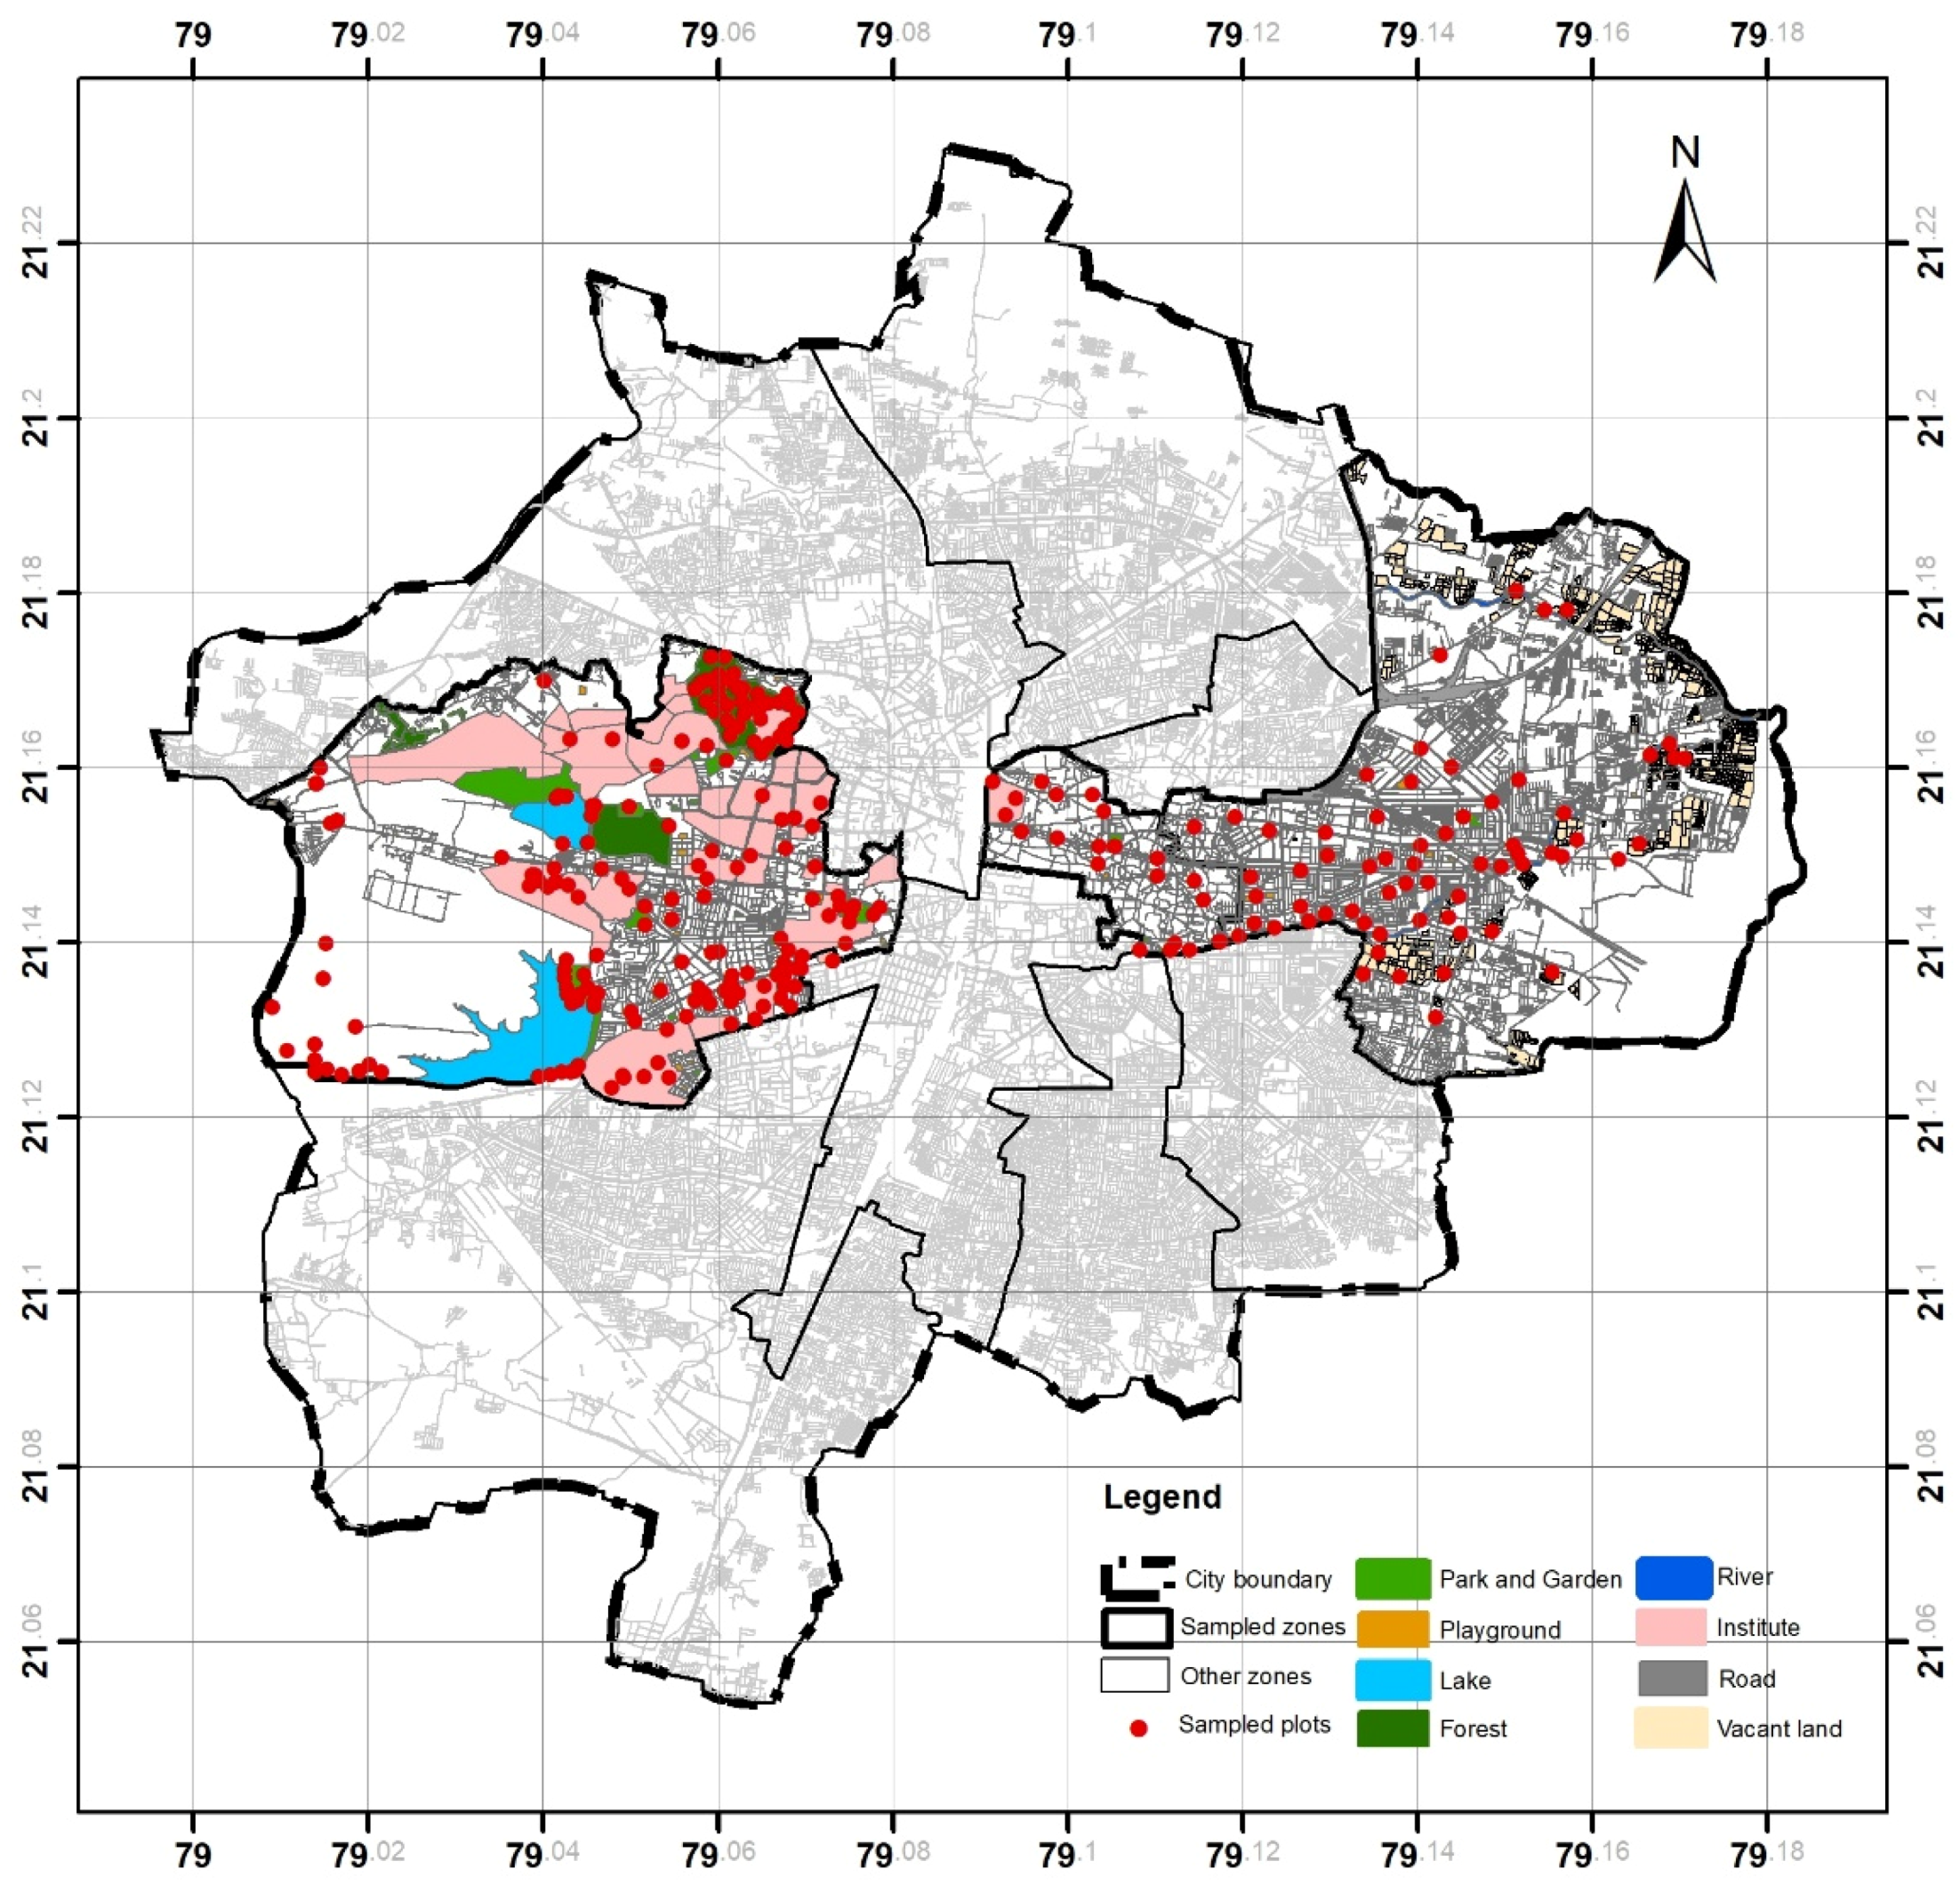
For the field work, stratified random sampling was carried out using UGS classes as pre-stratification. This allowed increased efficiency as variation among the stratum is lower and hence smaller sample data can represent larger parcel of the entire stratum [42]. For pre-stratification, thematic map of UGS with an overall accuracy of 95% and kappa statistic as 0.93 was used [39]. For informal greens, as prior permission was required from Governing bodies, some of the institutes were pre-identified; however, sample plots were randomly selected. The field work was conducted between 10th December 2018 to 25th January 2019, by a group of botanist and landscape planners. Tree species with diameter above 10 cm at breast height (DBH) of 1.3 m within each plot were identified at species level. The height was measured by clinometer and DBH for trees was measured considering multiple stems. The plot locations as per field GPS points for respective zones are shown in Figure 2.
The plot size, plot shape, and number of sampled plots varied as per UGS classes as indicated in Table 1. For circular plots, 10 m radius was considered, while for road network a rectangular plot of 100 m × 1.5 m on both side of the road was used and for edges of lakes and river rectangular plot of 100 m × 3 m was considered. The number of sample plots under each stratum varied considering the vegetation structure and composition [42], based on observations from previous field visit (February-April 2018). For example, in zone 2 of the forest the sampled plots were high (n = 50), while for vacant land and playgrounds the sampled plots were lower. For rough calculation of number of plots to be inventoried i-Tree manual was referred, which mentions a general rule of minimum 20 plots in each stratum to represent the whole city with a standard error of 10%.
2.3. Data Analysis
The basal area (BA) for each tree was calculated using Equation (1) and the aggregate BA (m2 ha−1) was calculated by multiplying BA with the scaling factor of the UGS class. The importance value index (IVI) of tree species for each UGS class was calculated by summation of total relative abundance, relative density, and relative frequency [43]. IVI is mainly for understanding the share of individual tree in UGS class. Tree species diversity Shannon (H’) and Simpson’s (1/D) index were calculated using the below Equations (2) and (3) (Borah et al. 2013). The Pielou’s evenness (J) was determined by comparing the diversity (H’) with the maximum diversity (ln of total number of species). For species richness Menhinick’s index was used, where number of different species found in a sample is divided by square root of total number of species found in the sample.
Basal area (m2) = π* DBH (cm)2/40000
In Equation (1), basal area is in m2 and DBH is in cm2. In Equations (2) and (3), H′ is Shannon-Wiener diversity index, D is Simpson index, p is the proportion (n/N) of individuals of one particular species found (n) divided by the total number of individuals found (N), ln is the natural log, Σ is the sum of the calculations, and s is the number of species.
The species accumulation curve was plotted to cross-check the sample size, and the composition of the tree species was analyzed using multivariate analysis. Using ordination method, a canonical correspondence analysis (CCA) was performed in PAST software (3.24 version). The two-dimensional diagram of CCA graphically depicts the similarity in vegetation composition among UGS classes. The structural composition of tree species was studied through DBH class distribution.
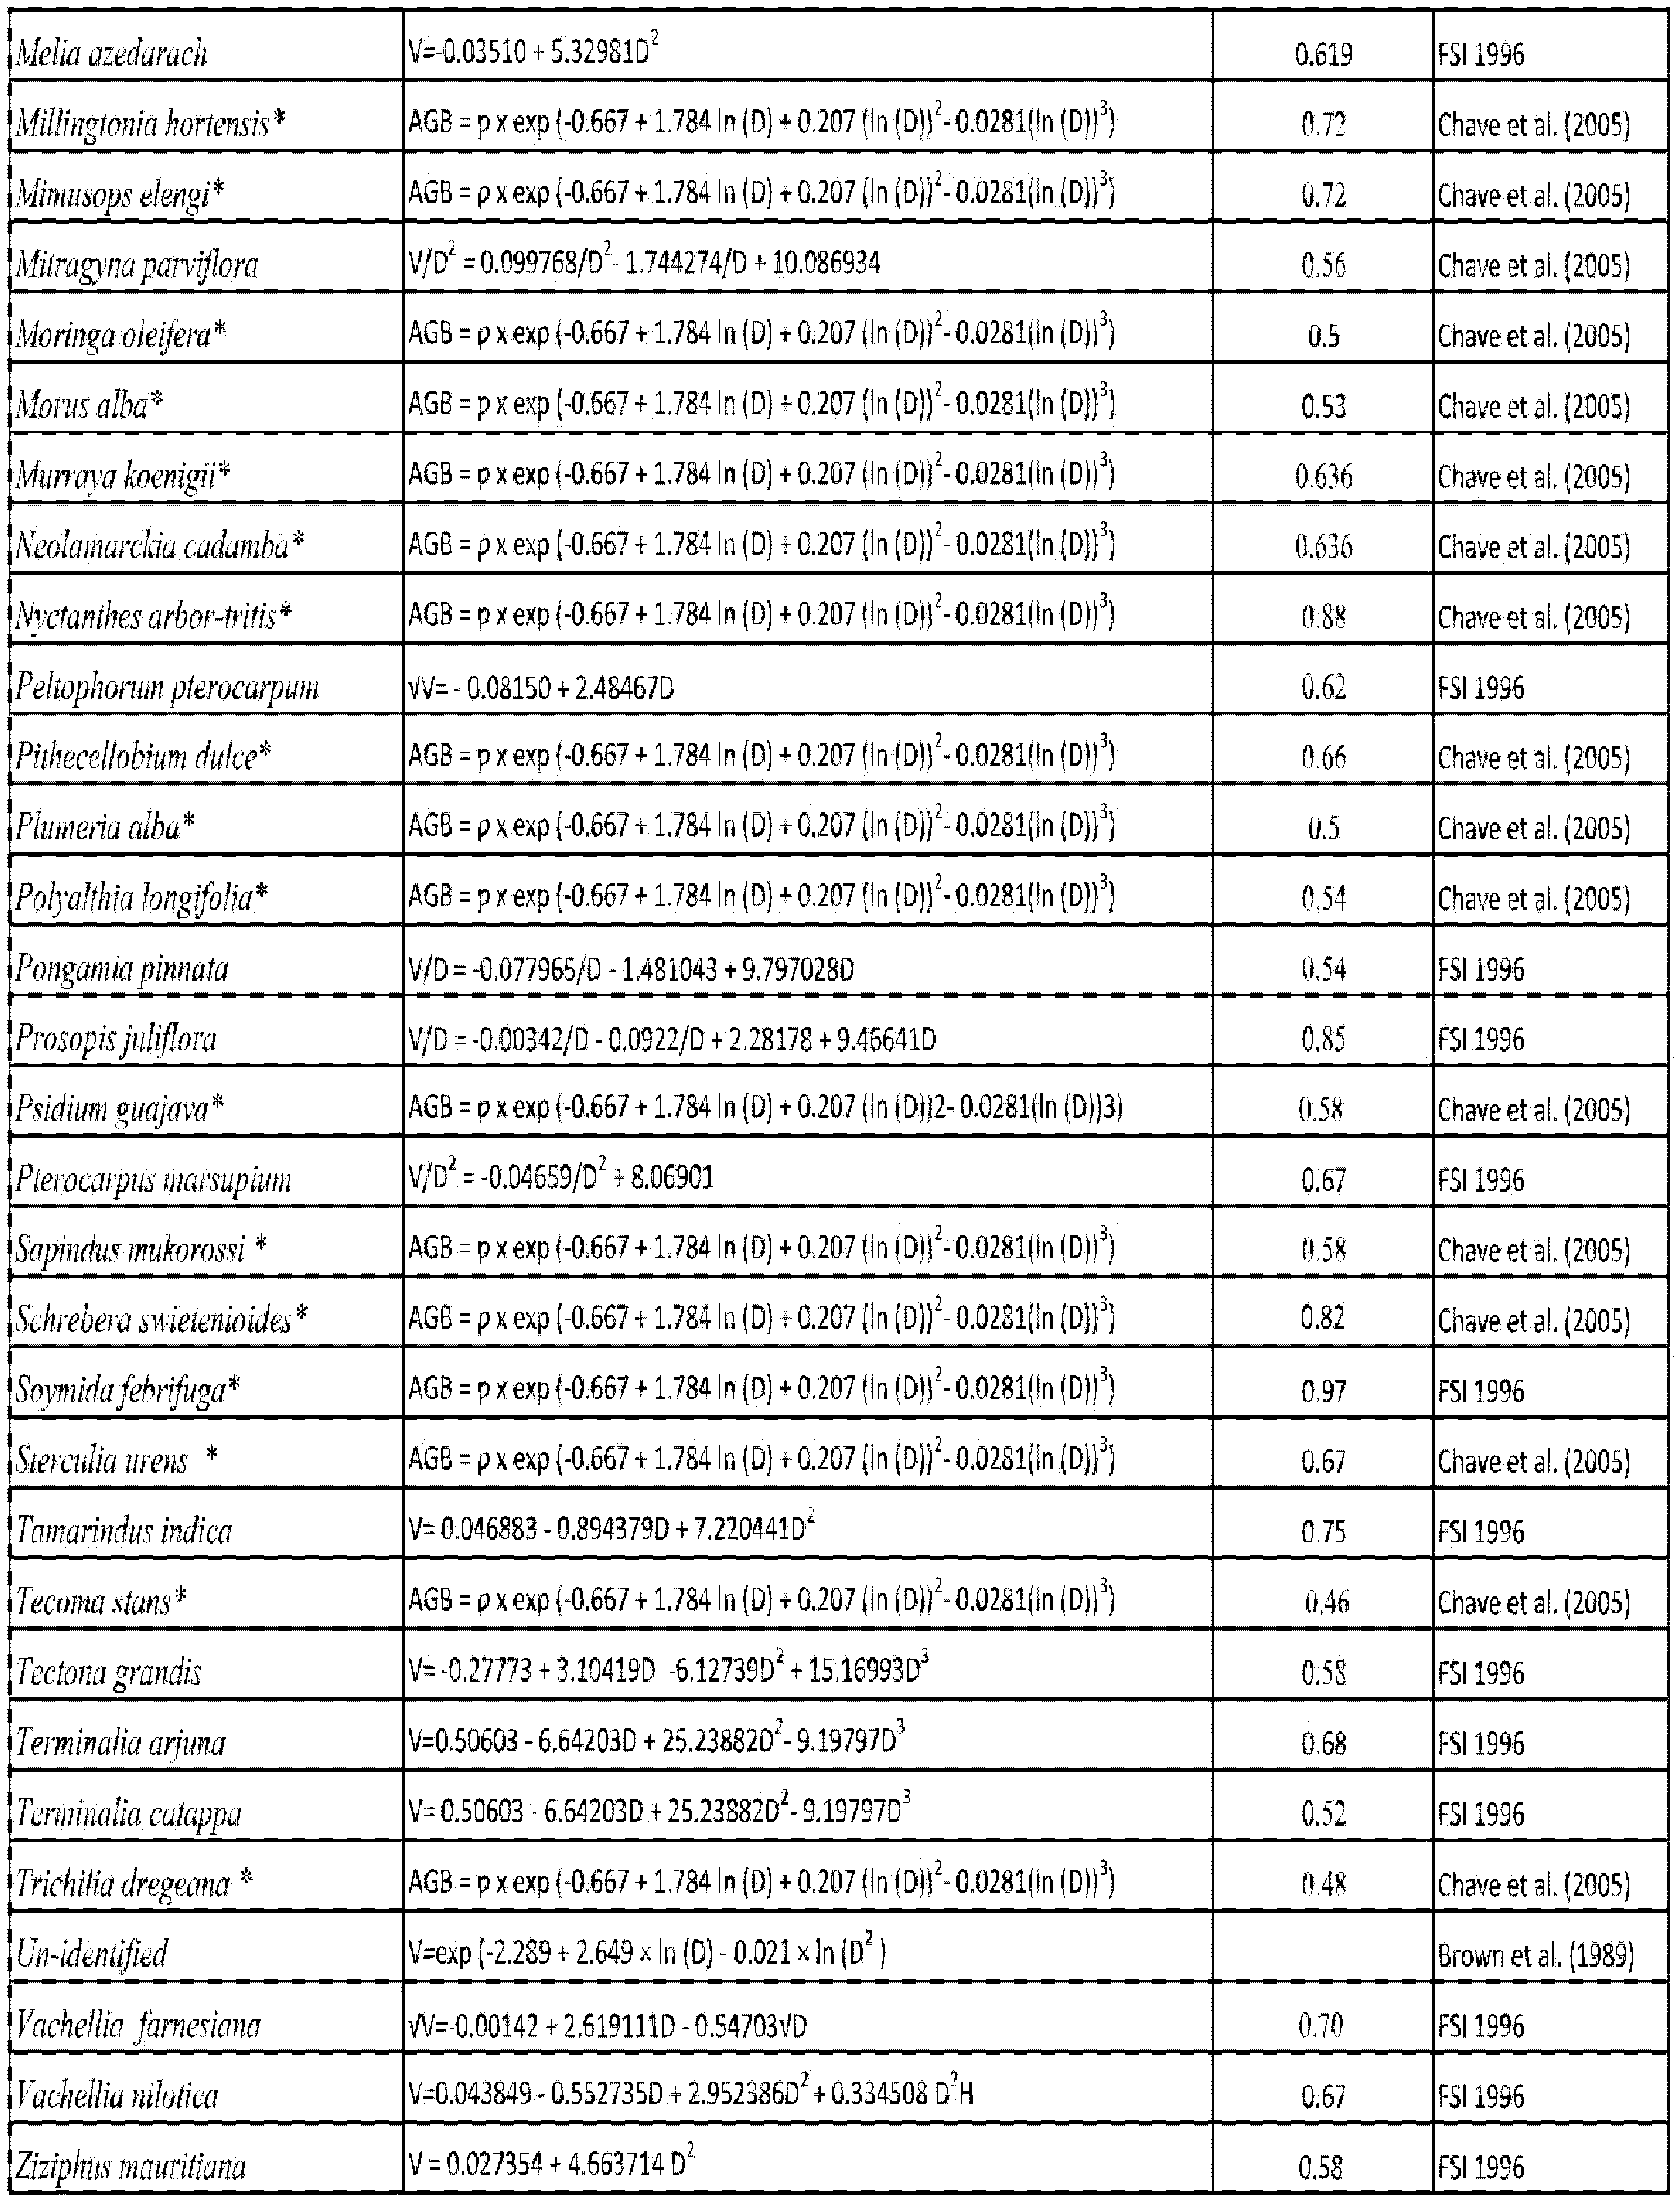
For biomass assessment, field sample method is preferred over remote sensing method because of the accuracy [44], following non-destructive biomass estimation. By using species-specific volumetric equation with the measured biophysical variables, the biomass of tree was calculated [45,46,47,48]. The equations consider measurable parameters like DBH, height of tree, and wood density [49]. All the volumetric equation for the inventoried tree species were derived from literature and are recorded in Appendix A. In case of unavailability of species-specific equation, generalized equation by Chave [50] or equation for same species group was used [1,2]. For unidentified trees regression equation derived by Brown et al. was used [45]. The volume of tree biomass (m3 ha−1) is calculated by using species-specific volumetric equation by inputting field data (DBH and height) [51]. The above ground biomass (AGB) was calculated by multiplying the tree biomass and wood density of tree species obtained from Forest Survey of India [52]. As urban trees have different surroundings than natural forest trees, to adjust the variation in biomass derived by using forest tree equation, the estimated AGB is multiplied by a factor of 0.8 [48,50,53,54]. For estimation of below ground biomass (BGB), regression equation suggested by Cairns et al. (1997) as in Equation (4) is used. Total biomass was derived by adding AGB and BGB, and to calculate the complete dry weight carbon stock (Cstock), a conversion factor of 0.475 is applied [55,56,57]. The above multiple equation is combined and used for individual species (with different DBH) for biomass (AGB+BGB) and Cstock estimation.
BGB = EXP(−1.059 + 0.884 × ln(AGB) + 0.284)
3. Results
In all, 2362 individuals belonging to 86 species were recorded among eight UGS classes of Nagpur. The identified 73 species belonged to 58 genus and 22 family. In all, 13 species were unidentified and in 9 plots no trees were recorded. The plots with no vegetation were also considered in biomass assessment for which the woody biomass was considered zero. The largest tree identified was Mitragyna parvifolia along the road with DBH of 175 cm, followed by Ficus religiosa with 143 cm DBH in institution and Azadirachta indica with 127 cm DBH in playground. Among the UGS classes the mean DBH was highest in institutions (36.6 ± 13 cm) and lowest in vacant land (22.4 ± 15 cm). Apart from institutions, parks and garden and playgrounds had relatively higher mean DBH of 32.0 ± 16 cm and 32.5 ± 19 cm. Forest on the contrary had lower mean DBH value of 26.0 ± 9 cm. Analysis of tree species indicates that few species were unique to particular UGS classes only (31 out of 87 which is 36%). In forest, 11 species (13%) were found that were not recorded in another classes. Likely, the uniqueness was high is road and institutions with 9% and 7% respectively.
3.1. Species Richness and Diversity
The diversity was high in roads with 46 species, followed by institutions and parks and garden (as in Table 2). The same was reflected through the dominance index (Simpson) where high diversity was in road followed by parks and garden and river. While as per the Shannon index that considers even rare species, highly diverse stratum was road followed by institutions and parks and garden (Table 2). Thus, road is significantly diverse based on both Shannon and Simpson index, followed by institutions. Forest on the other side is low in diversity with lower evenness and high variation in abundance of species. Considering the sample sizes of both forest and road were same, road is less homogeneous. While vacant land has high degree of evenness where all species are equally common with very low variation in abundance followed by river and playground. Species richness (S) varied among UGS classes. The highest species richness was found in institutions (2.72) and the lowest was in forest (1.2).
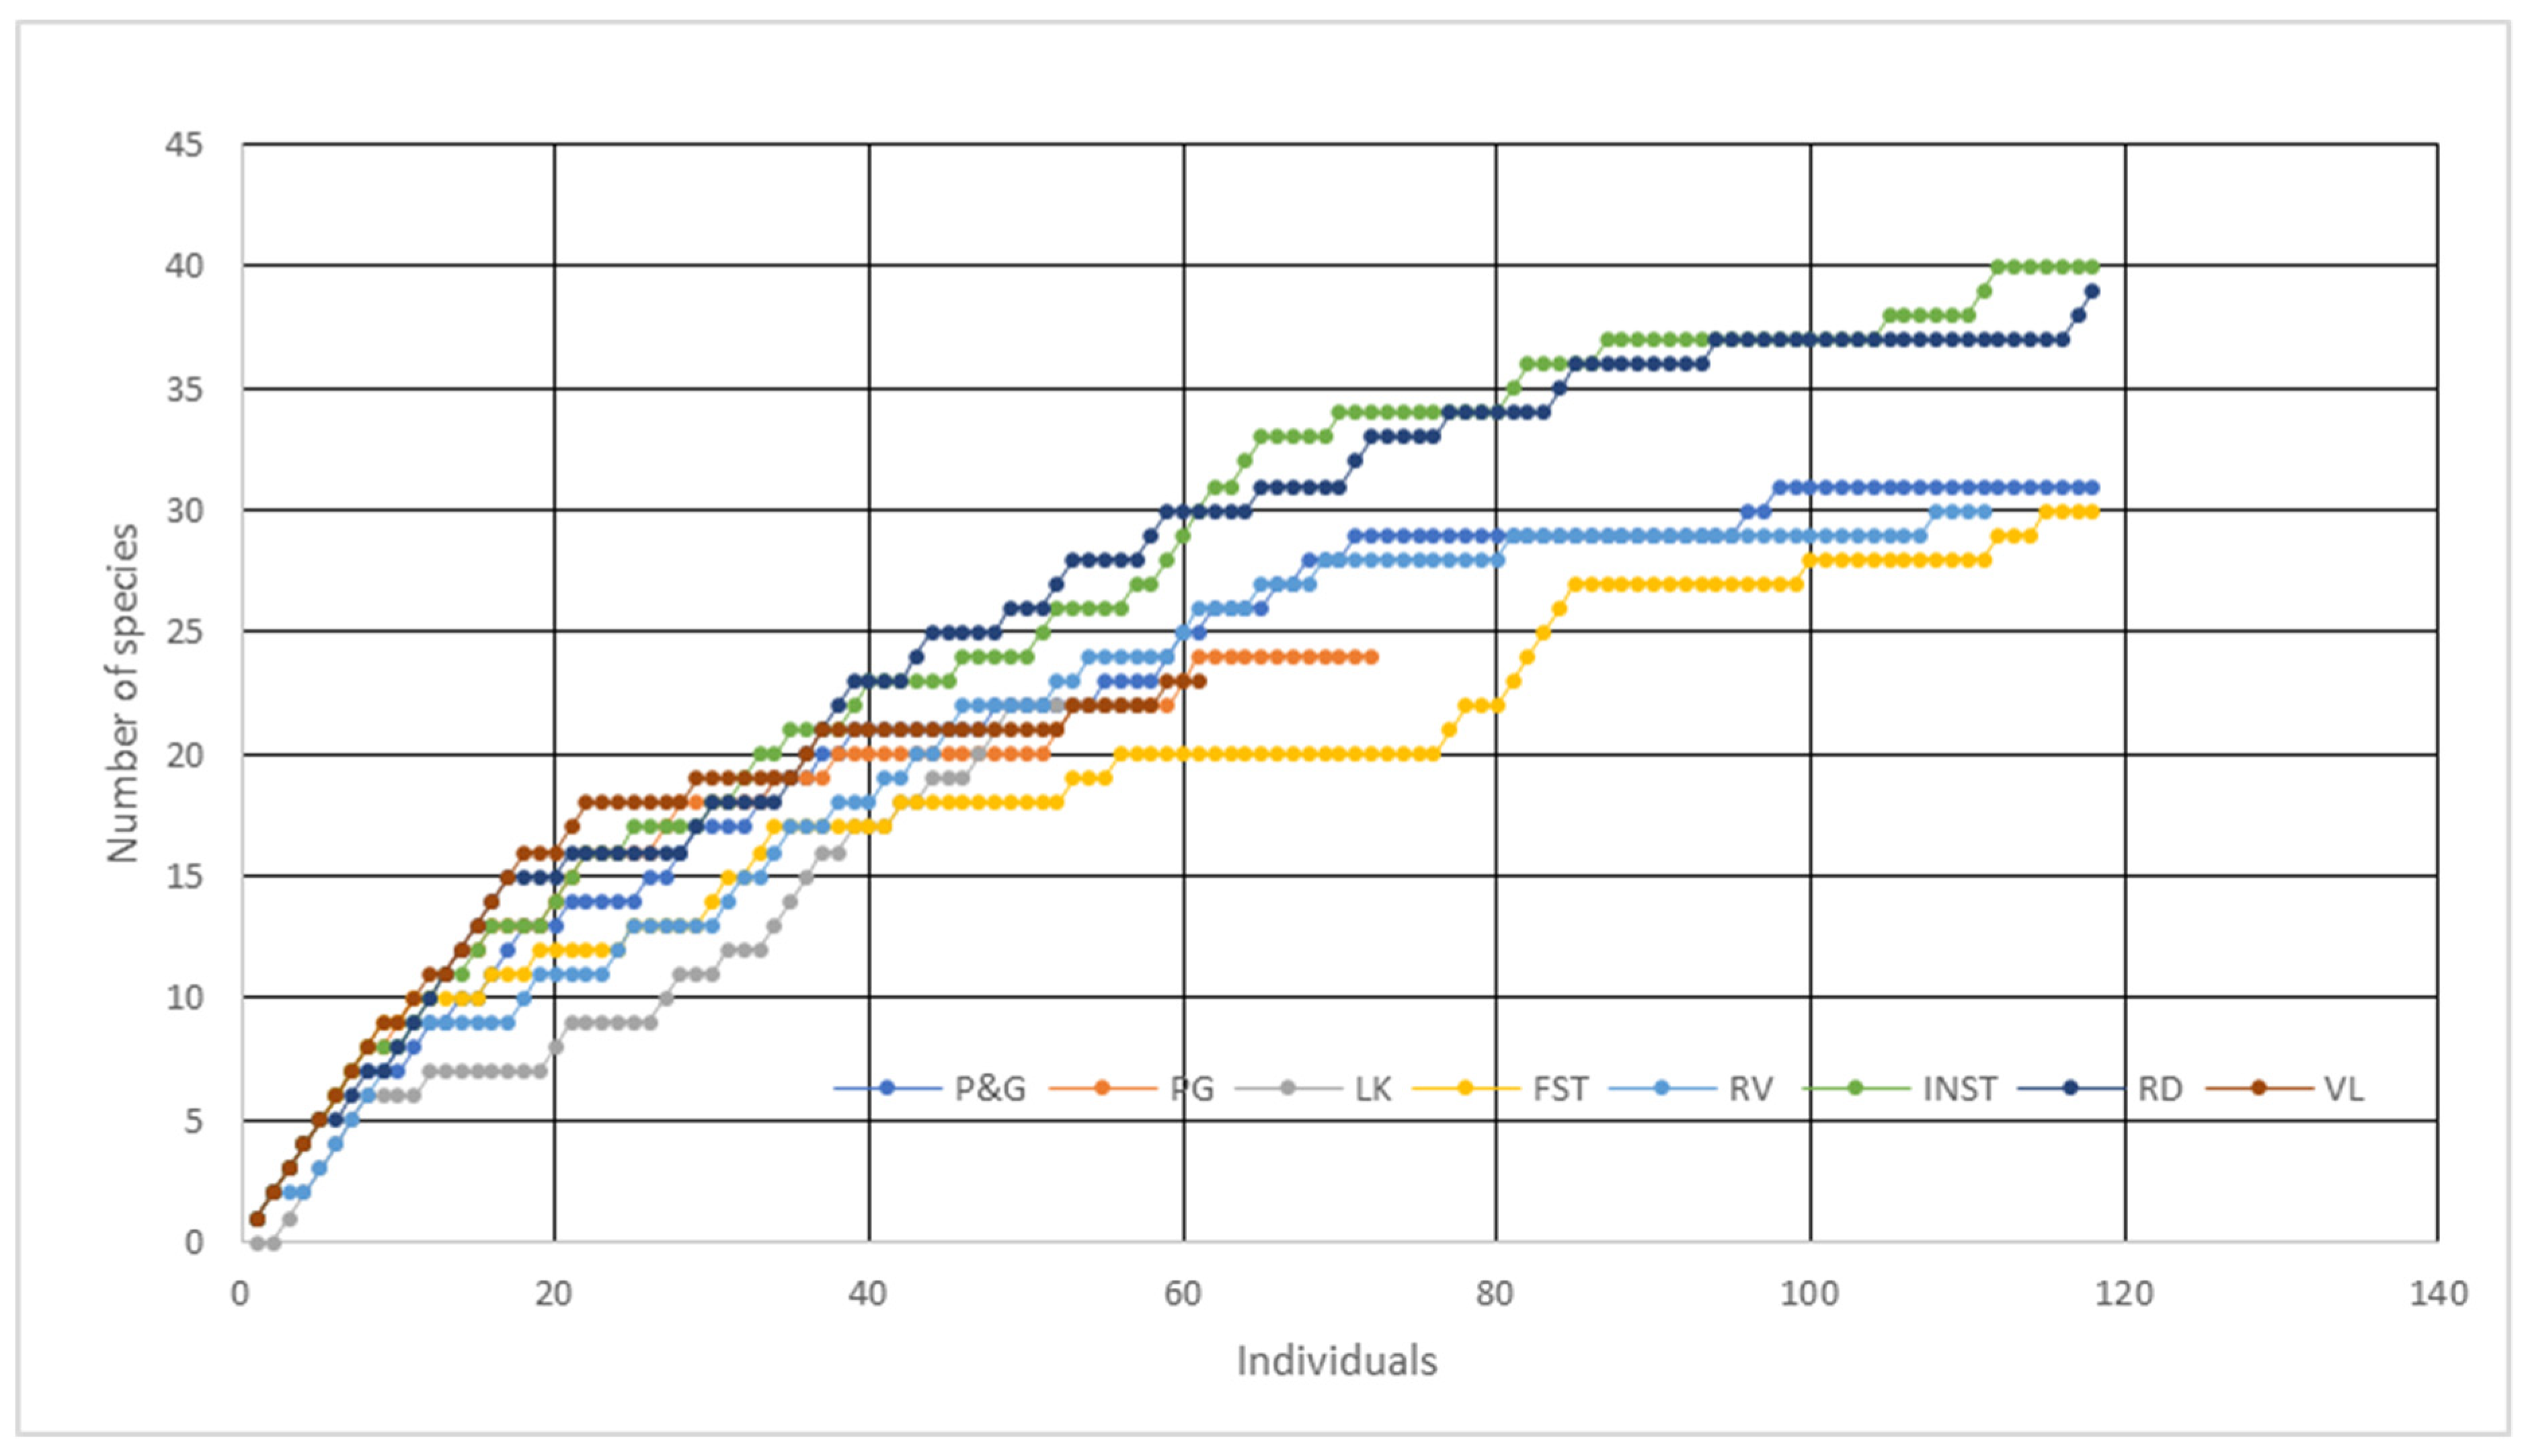
The plotted species accumulation curve (Figure 3) indicates an increasing trend in number of individuals. The number of species saturated with increased number of plots for park and garden, playground, forest, river, and vacant land which indicates the sufficiency of sampled plot. However, for lake, road and institutions, as the curve is progressive more sampling would have revealed more species richness. The lowest rate of species accumulation was observed in forest, which was also reflected in lowest species richness, while institutions class showed highest rate of accumulation throughout with highest richness (as in Table 2). Though lake had low rate of species accumulation over first few plots it raised and was progressive indicating more sampling efforts needed.
3.2. Species Composition and Structure in UGS Class
CCA ordination analysis further identified the similarity and dissimilarity in composition of species among different UGS classes [58]. CCA performed on species IVI collected from 246 sampled plots showed 57% of association along two axes (Figure 4). UGS classes shown along axis 1 explained 36.8% of the variation. The similarity in species composition was observed among the managed greens like park and garden, playground, lake, institutions, and road. The unmanaged greens like river and vacant land; and forest, where composition is indicated by closeness of points and aggregation of species between two points. In axis 2, tree species total variation was found to be 20%. The most significant deviation is recorded around lake with species like Butea frondosa, Dalbergia sissoo, Ceiba pentandra, Gmelina arborea, Mimusops elengi, Mitragyna parvifolia, Plumeria alba, Sapindus mukorossi, and Soymida febrifuga. The next most prominent deviation is near vacant land with invasive species like Prosopis juliflora and Ziziphus mauritiana. The last most important deviation is in cluster forest, which is dominated by Boswellia serrata, Hardwickia binate, and Tectona grandis.
The structure of vegetation is the city is studied through tree diameter class distribution among different UGS classes. Overall, the number of individuals decreased with increasing in diameter class as shown in Figure 5. In all the classes, the highest frequency of individuals belonged to >20–30 cm diameter class (33%) followed by >10–20 cm diameter class (30%). Thus, the dominant diameter class is of young trees between >10–30 diameter class (63%). The lowest frequency is of >90–120 (1%) and >60–90 diameter class with 5% share which clearly indicates lack of old trees in the city. The retained old trees were mainly found in park and garden and playground with high number of >60–90 diameter class trees. Along the water bodies (lake and river), the trees with high diameter class are relatively low. The diameter class analysis of forest indicated a reverse J shaped curve, where the number of individuals between diameter class of >10–20 cm is very low, however it picks at 20–30 (44%) and gradually decreases. This vegetation structure indicates that forest is regenerating forest with less old trees, as share of trees with DBH above 40 cm is below 6%. Overall, the DBH class in >60–120 cm has in total BA of 65 m2 ha−1. Among >30–40 cm class the BA is highest (46 m2 ha−1) while lowest BA is in >10–20 (14 m2 ha−1).
3.3. Tree Biomass and Carbon Stock
The biomass stored in UGS classes varied significantly between 70.42 t ha−1 in river and 334.61 t ha−1 in road (Figure 6a). Playground follows road with 323.68 t ha−1 of biomass. Institutions though rich in diversity has relatively low biomass and Cstock. Unmanaged greens like river and vacant land has lowest share in cities biomass with 70.42 t ha−1 and 110.40 t ha−1 respectively. In playground though the tree frequency is lower, biomass is high owing to the presence of trees of high DBH class (>60–90 cm and >90–120 cm). This proves that BA has positive correlation with AGB as found in other studies [59,60,61,62]. Though the correlation between BA and AGB varies, in forest and road it is significant (R2 = 0.90 and R2 = 0.94 respective) and for other classes as well it is positive (Supplementary Materials). In Nagpur, the main contributing DBH class toward biomass and Cstock among eight UGS classes is >30–40 cm followed by >60–90 cm and >20–30 cm (Figure 6b). Though the lower DBH class has high tree frequency the share of Cstock is lowest. Overall trees between 20–40 cm hold 40% share and trees above 60 cm DBH hold 32% of Cstock share. Study by Nero et al. indicates similar pattern of exponential increase in carbon frequency with girth size of trees [3].
The high biomass of institutions in Nagpur (137 t ha−1) is comparable to Pune University campus (108 t ha−1) studied by Waran and Patwardhan, while in park and garden (150 t ha−1) have higher biomass as compared to gardens studied in Pune (110 t ha−1) [31]. For road, estimated biomass ranged from the value 56.75–380.11 t ha−1 recorded by Rahman et al. in Bangladesh [63]. As for the estimate of biomass (236 t ha−1) in forest, the value is within the identified national range for tropical dry deciduous forest 83–370 t ha−1 and 33–315 t ha−1 as studied Joshi et al. and Gandhi et al. respectively [64,65]. The Cstock by forest (105. 16 t ha−1) is also comparable to Delhi urban forest biomass range 107–169 t ha−1 [66]. However, the Cstock of forest is on the higher side as compared to forest plantation in Italian cities (99 t ha−1) studied by [67] and Shenyang urban forests with 33 t ha−1 studied by Liu and authors [68]. Study by Nero et al. on carbon sink potential of different UGS estimated that overall Kumasi has a 228-t ha−1 of carbon in different greens [3].
3.4. Characteristics of Dominant Species
The tree species showed positive correlation between IVI and AGB (R2 = 0.75), thus based on IVI dominant tree species among all UGS classes were identified and their AGB is represented in Figure 7. Azadirachta indica is the most dominant species with high biomass and IVI. Followed by Azadirachta indica is Tectona grandis which has high biomass, but density is higher only in forest, owing to its mass plantation. Following this the dominant species are Mitragyna parvifolia, Ficus Religiosa, Delonix regia, Polyalthia longifolia, Albizia Lebbeck, and Bauhinia variegate. For the other identified species, though the AGB value is moderate (Figure 7) they have high IVI with high abundance across the city. Mitragyna parvifolia, Bauhinia variegate, and Mimusops elengi particularly have low IVI but the AGB is very high, as recorded by [69]. Particularly, Ficus benghalensis, Tamarindus indica, and Dalbergia sissoo are high-biomass yielding species. The characteristic of dominant species indicates that tolerance to weather condition and functional attributes are the main criteria considered by local authorities for planting the identified trees. In addition, growth rate and phenology are considered. Further, it is evident that the outstanding old trees in the city have cultural and religious significance, thus being a strong reason for their protection against all odds.
4. Discussion
The study records species diversity, composition, structure, and Cstock stored in UGS classes in the rapidly urbanizing city of Nagpur. Though the city was once recognized as one of the greenest city [70], so far local vegetation data and carbon sink data have not been recorded. However, with increasing grey infrastructure expansion the urban trees are declining with reduction in green cover [13], thus the study complies much-needed local vegetation data of urban trees in UGS and in the process explores ways to enhance the carbon sink of the city.
4.1. Vegetation Diversity, Species Composition, and Structure in UGS Classes
The city is rich in floristic diversity, in contrast to other global cities like Oakland and Athens where the density is high but urban tree assemblage is dominated by few species [48,71]. The tree diversity varies among the UGS classes studied, however is found to be lower than the floral diversity previously recorded by Chaturvedi et al. in 2013 [38]. Also as compared to Bangalore’s public and private greens tree diversity captured by Sudha and Ravindranath [24], Nagpur showed low diversity. However, Nagpur’s tree diversity was found to be close to Delhi’s and Bangalore’s managed greens tree diversity [12,72]. In comparison to other tier cities like Allahabad, the diversity was high [73]. Further within Nagpur’s UGS classes the highest diversity was recorded in avenue plantation. However, when compared with Lutyen’s Delhi and Bangalore roadside plantation, Nagpur’s avenues showed lower diversity [12,74]. While the institutional compounds of Nagpur hold high diversity and high species richness as observed in the campuses of Pune and Bangalore [24,31]. Among the studied UGS classes, the reserve forest has the lowest species richness and diversity, even lower that the local urban forest of NEERI [34]. The low diversity indicates the mass plantation strategy of certain species adopted by forest department. The data about locally available tree diversity indicate that more species can be introduced to enhance the diversity, particularly along the water bodies, parks and playgrounds, and in the reserve forest area.
The tree diameter class indicates vegetation structure [75], and in Nagpur this structure is dominated by tree species below 40 cm DBH with record of very few old trees. The vegetation structure is more like Mexico [76] and Bangkok [77]. Because of varying level of maintenance, exposure to pollution, disturbance, and stress, the occurrence of old trees varies significantly among UGS classes. In managed greens like parks and playground the old trees are protected, while along the avenues the old trees have been cleared because of expansion of grey infrastructure projects like road widening and metro corridor creation, as witnessed in other Indian cities [78,79]. Further lack of planting effort in newly established road network has further increased the vulnerability of the green corridor of the city. The declining number of old and mature trees in the city is altering the vegetation structure and this effects the carbon sink potential of UGS, as mature and old trees have been identified as the reservoirs of biomass and carbon sink. Hence, felling trees in name of development is adversely impacting the city’s environment and hence overall development.
Further, the built-up expansion within institutional compounds is leading to tree felling of old trees as reported by the local media. The negligence on part of authorities, lack of stringent policies, and un-availability of monitoring tools, altogether are leaving the avenue plantation and institutional greens in a highly vulnerable state. Thus, these UGS classes need more attention in terms of preservation action and compensatory planting efforts along with their monitoring. The forest structure is dominated by similar species young trees with occurrence of saplings which indicates the mass planting efforts done by forest department in recent years. However, the lack of old trees because of the severity of fire incidences occurred in past warrants for immediate measures for control over fire occurrences along with enhancement in the diversity and trees structure in reserve forest. The study of girth class distribution with high number of young trees shows recent efforts made by the local authority, however the peripheries and eastern areas of city showcase less planting efforts and need immediate attention for greening interventions.
4.2. Tree Biomass and Carbon Sink Potential of UGS
Tree biomass and Cstock data indicate significance of old trees in carbon accumulation. Although playground contributes less toward the tree diversity, the presence of old trees which have higher BA leads to increased Cstock in playgrounds. Similarly, abundance of mature and old trees along the roads, park, and institutional compounds enhances the carbon sink potential of these UGS and the city. Overall, in comparison to other studies Nagpur has good Cstock among the managed greens. While the unmanaged greens like lake peripheries, nag river corridor, and vacant lands which lack trees are recommended as potential areas for afforestation programs, which has also been acknowledged in the proposed city development plan [70]. The Cstock of urban forest is within the range identified for dry deciduous forest [64], however through effective maintenance and management the carbon sink can also be enhanced. As forests are being regenerated by planting high number of young trees of similar species, maintaining the structural diversity, controlling the disturbance and sporadic unwanted event can lead to increased Cstosk [80].
The evaluated Cstcok values can be used by local authorities to safeguard the existing trees and prioritize planting efforts in the identified UGS classes. The established correlation between BA and biomass as well the role of DBH structure in carbon accumulation can guide the local authorities toward species selection to enhance the overall carbon sink of the city. Hence, the recorded data and the Cstock evaluation acts as a reference data set to develop local greening strategies based on specific UGS classes requirement and guide toward strategic planting and afforestation efforts. Further, as the old trees are reservoirs of high carbon, the study recommends implementation of stringent policies for protection and conservation of old trees.
4.3. Tree Species Selection, Management and Maintainance
Trees in urban areas need to withstand “pollutants, high temperatures as a result of heat island effects, limited rooting space, and less water availability in compacted soil” [81,82]. Thus, different attributes of trees play important role in plant selection. Like dense and broad canopy trees lead to more AGB with enhanced aesthetic values, while the thick foliaged trees allow removal of air pollutants as well as give shade which leads to temperature amelioration [83,84,85]. Hence, species selection is an important aspect in urban greening, as an appropriate choice of species could significantly enhance the urban environment and increase the benefits derived from UGS. In Nagpur, the vegetation is composed of both native and introduced species with a mix of evergreen and deciduous trees. The most common native species in all classes is Azadirachta indica which has high tolerance, fast growth rate, and dense canopy. The highly abundant introduced specie recorded is Polyalthia longifolia which is mainly planted in parks and gardens because of its thick foliage to create a screening and fast growth rate. Among the ornamental trees Delonix regia, Cassia siamea, Peltophorum petrocarpum, and Bahunia variagata are obvious choices owing to the flowering characteristics of the species, the fast growth rate, and the shady canopy. These species are dominant in managed greens, as also identified in studies of other Indian cities [24,86,87].
In forest area, deciduous tree species with high drought tolerance dominates the tree species characteristics, making Tectona grandis, Hardwickia binate, and Boswellia serrata as the obvious choice for mass plantation. The species recorded with higher DBH class where mainly identified as species with cultural and religious significance. This characteristics has significantly resulted in their preservation and conservation as identified in other cities [88]. Overall, growth rate, phenology, canopy type, tolerance to drought, and resistance to pollution are identified as key attributes considered by local authorities for species selection. Another study in Bangalore also indicated that growth rate is considered as an important criterion for species selection [24], while some researcher have also highlighted the importance of productive trees with longer life span to mitigate the carbon concentrations in cities [11]. Selection of native tree species like Azadirachta indica, Ficus religiose, Ficus benghalensis, Dalbergi sissoo, Alistonia scholaris, Bahunia variegate, and Mitrangya parvifolia with high biomass and high efficiency of carbon fixation as well as other ecological benefits are highly recommended. From management and maintenance perspective it is critical to protect the old trees from further felling, thus local authorities need to focus on both preservation of existing tree along with afforestation efforts. The compensatory planting within same areas and same class should be made mandatory, and the same should be monitored and reported periodically. Further learning and adopting ideas from the successive initiatives in other Indian cities like “Green Leap Delhi” and “Tree Ambulance” is recommended [13]. Moreover, public participation and residents’ involvement at every stage is recommended as it allows high survival rate of planted saplings and reduced maintenance cost.
The study is novel in terms of using UGS class as a basis to understand the variation in vegetation structure and carbon stock at a granular level in the complex urban mosaic. However, because of classes-based data, comparison of finding and validation was limited because of lack of biomass studies in Indian context [23]. Though for some classes international cases were reviewed, however because of the difference in methodology used to determine the carbon sink, direct comparison was difficult. In the study, only tree biomass has been considered, while ground cover biomass, litter biomass, and soil biomass are recommended for future detailed studies. Further, to understand the dynamic behavior of ecosystem, a thorough understanding of biophysical systems including soil as a carbon pool [89], role of properly functioning soil to enhance ecosystem benefits [90], as well as role played by UGS in addressing the sustainable development goals (SDGs) is recommended for future studies. Also, generating spatial data using high resolution satellite imagery and use of unmanned aerial vehicle is recommended to allow frequent assessment of vegetation carbon data, monitor structural change in urban vegetation over time, keep an account on tree felling and compensatory planting, and guide toward effecting afforestation programs [91]. We also recommend recording vegetation data of private greens for future works.
5. Conclusions
The green city of Nagpur is witnessing urbanization. The increase in grey infrastructure is leading to a decline in existing urban tree cover. Because of scanty information about city’s vegetation structure and carbon sink potential, a rigorous field work was conducted to record vegetation data for phytosociology and carbon sink assessment of different UGS classes in the city. Focusing on the UGS classes, the research tries to understand how the vegetation density, diversity, composition, and their structure vary among urban greens. The findings highlight that avenue plantation and institutional greens are highly diverse with high tree density. Cstock is also high in avenue plantation and playgrounds. The managed greens have higher girth trees, which contributes toward increased Cstock, however trees along the road and institutions are subjected to felling in road widening and other infrastructural demands and are under threat. In the forest area, low diversity is recorded with a lack of higher girth tree species; additionally, the sporadic fire events reported by local media highlights the need of more strategic planting, monitoring, and maintenance policies. The city’s tree structure is dominated by young and mature trees that indicate that afforestation efforts have been made in recent past. However, lack of saplings along the new road networks and lower tree frequency along the river and playground highlight them as potential areas for future afforestation efforts. In addition to phenology and growth rate, tree biomass and life span are recommended to be consider for species selection to significantly enhance the urban environment and increase the benefits derived from UGS. Large canopy tree with high basal area has the ability to mitigate future climate challenges, thus should also be considered in species selection in addition to functional and tolerance levels. Lastly, local level spatial data of vegetation including private greens as future research are highly recommended.
Supplementary Materials
The following are available online at https://www.mdpi.com/2073-445X/9/4/107/s1, Figure S1. Correlation between BA and AGB of tree species in different UGS typology.
Author Contributions
S.L. has conceptualized the original idea and carried out the field work. The methodology and data analysis were also conceived by S.L., R.K.J. and O.S. supervised for data analysis. S.L. worked on the writing of original draft preparation. A.L. provided critical feedback throughout to finetune the manuscript and proofread the final draft. All authors have read and agree to the published version of the manuscript.
Funding
This research received no external funding.
Acknowledgments
We are thankful to Dhiraj Buradkar, Khusbu Singh, Deepika Sarda, Ashwini Rangari, Harsha Nandurkar, and Pooja Fulwadhani for their support in conducting the field work.
Conflicts of Interest
The authors declare no conflict of interest with respect to the research, authorship, and/or publication of this article.
Appendix A
Figure A1.
Species specific volumetric equations.


References
- Strohbach, M.W.; Haase, D. Above-ground carbon storage by urban trees in Leipzig, Germany: Analysis of patterns in a European city. Landsc. Urban Plan. 2012, 104, 95–104. [Google Scholar] [CrossRef]
- Nowak, D.J.; Crane, D.E.; Stevens, J.C.; Hoehn, R.E.; Walton, J.T.; Bond, J. A Ground-Based Method of Assessing Urban Forest Structure and Ecosystem Services. Arboric. Urban For. 2008, 34, 347–358. [Google Scholar]
- Nero, B.; Callo-Concha, D.; Anning, A.; Denich, M. Urban Green Spaces Enhance Climate Change Mitigation in Cities of the Global South: The Case of Kumasi, Ghana. Procedia Eng. 2017, 198, 69–83. [Google Scholar] [CrossRef]
- Kabisch, N. Ecosystem service implementation and governance challenges in urban green space planning-The case of Berlin, Germany. Land Use Policy 2015, 42, 557–567. [Google Scholar] [CrossRef]
- Nesshöver, C.; Assmuth, T.; Irvine, K.N.; Rusch, G.M.; Waylen, K.A.; Delbaere, B.; Krauze, K. The science, policy and practice of nature-based solutions: An interdisciplinary perspective. Sci. Total Environ. 2017, 579, 1215–1227. [Google Scholar] [CrossRef]
- Raymond, C.M.; Frantzeskaki, N.; Kabisch, N.; Berry, P.; Breil, M.; Nita, M.R.; Calfapietra, C. A framework for assessing and implementing the co-benefits of nature-based solutions in urban areas. Environ. Sci. Policy 2017, 77, 15–24. [Google Scholar] [CrossRef]
- Frantzeskaki, N. Seven lessons for planning nature-based solutions in cities. Environ. Sci. Policy 2019, 93, 101–111. [Google Scholar] [CrossRef]
- Lafortezza, R.; Chen, J.; Bosch, C.K.; Thomas, B.R. Nature-based solutions for resilient landscapes and cities. Environ. Res. 2018, 165, 431–441. [Google Scholar] [CrossRef]
- Novara, A.; Pulido, M.; Rodrigo-Comino, J.; Di Prima, S.; Smith, P.; Gristina, L.; Keesstra, S. Long-term organic farming on a citrus plantation results in soil organic matter recovery. Cuad. De Investig. Geográfica 2019, 45, 271–286. [Google Scholar] [CrossRef] [Green Version]
- Jenkins, J.C.; Chojnacky, D.C.; Heath, L.S.; Birdsey, R.A. National-scale biomass estimators for United States tree species. For. Sci. 2003, 49, 12–35. [Google Scholar]
- Nowak, D.J.; Crane, D.E. Carbon storage and sequestration by urban trees in the USA. Environ. Pollut. 2002, 116, 381–389. [Google Scholar] [CrossRef]
- Nagendra, H.; Gopal, D. Street trees in Bangalore: Density, diversity, composition and distribution. Urban For. Urban Green. 2010, 9, 129–137. [Google Scholar] [CrossRef]
- Imam, A.U.K.; Banerjee, U.K. Urbanisation and greening of Indian cities: Problems, practices, and policies. Ambio 2016, 45, 442–457. [Google Scholar] [CrossRef] [PubMed] [Green Version]
- Govindarajulu, D. Urban green space planning for climate adaptation in Indian cities. Urban Climate 2014, 10, 35–41. [Google Scholar] [CrossRef]
- Alberti, M.; Marzluff, J.M.; Shulenberger, E.; Bradley, G.; Ryan, C.; Zumbrunnen, C. Integrating humans into ecology: Opportunities and challenges for studying urban ecosystems. BioScience 2003, 53, 1169–1179. [Google Scholar] [CrossRef] [Green Version]
- Rao, P.; Puntambekar, K. Evaluating the Urban Green Space benefits and functions at macro, meso and micro level: Case of Bhopal City. Int. J. Eng. Res. Technol. 2014, 3, 359–369. [Google Scholar]
- Anguluri, R.; Narayanan, P. Role of green space in urban planning: Outlook towards smart cities. Urban For. Urban Green. 2017, 25, 58–65. [Google Scholar] [CrossRef]
- Vittal, I.; Dobbs, R.; Mohan, A.; Gulati, A.; Ablett, J.; Gupta, S.; Kim, A.; Paul, S.; Sanghvi, A.; Sethy, G. India’s Urban Awakening: Building Inclusive Cities, Sustaining Economic Growth. Available online: https://www.mckinsey.com/featured-insights/urbanization/urban-awakening-in-india (accessed on 15 January 2018).
- Kumar, V. Coping with Climate Change: An Analysis of India’s State Action Plans on Climate Change; Centre for Science and Environment, 2018; Available online: http://cdn.cseindia.org/attachments/0.40897700_1519110602_coping-climate-change-volII.pdf (accessed on 15 January 2019).
- Chaudhary, P.; Tewari, V.P. Managing urban parks and garden in developing countries, a case from an Indian cities. Int. J. Leis. Tour. Mark. 2010, 1, 248–256. [Google Scholar] [CrossRef]
- Tripathi, N.G.; Bedi, P. IOP Conference Series: Earth and Environmental Science 18. In Digital Earth for Manipulating Urban Greens towards Achieving a Low Carbon Urban Society; IOP Publishing: Bristol, UK, 2014; pp. 1–5. [Google Scholar] [CrossRef] [Green Version]
- Davies, Z.G.; Edmondson, J.L.; Heinemeyer, A.; Leake, J.R.; Gaston, K.J. Mapping an urban ecosystem service: Quantifying above-ground carbon storage at a city-wide scale. J. Appl. Ecol. 2011, 48, 1125–1134. [Google Scholar] [CrossRef] [Green Version]
- Ugle, P.; Rao, S.; Ramachandra, T. Carbon Sequestration Potential of Urban Trees. In Proceedings of the Lake 2010: Wetlands, Biodiversity and Climate Change, Bangalore, India, 22–24 December 2010. [Google Scholar]
- Sudha, P.; Ravindranath, N.H. A study of Bangalore urban forest. Landsc. Urban Plan. 2000, 47, 47–63. [Google Scholar] [CrossRef]
- Meyer, B.; Grabaum, R. MULBO—model framework for multi critieria landscape assessment and optimisation. A support system for spatial land use decisions. Landsc. Res. 2008, 33, 155–179. [Google Scholar] [CrossRef]
- Mitra, S. Some aspects of ecology of walls at Vishakhapatnam. Ph.D. Thesis, Andhara University, Waltair, India, 1993. [Google Scholar]
- Madan, M.S. Composition of the ground vegetation of Visakhapatnam. J. Natcon 1993, 5, 77–82. [Google Scholar]
- Chaudhary, P. Valuing recreational benefits of urban forestry- A case study of Chandigarh city. Ph.D. Thesis, FRI Deemed University, Dehradun, India, 2006. [Google Scholar]
- Dwivedi, P.; Rathore, C.S.; Dubey, Y. Ecological benefits of urban forestry: The case of Kerwa Forest Area (KFA), Bhopal, India. Appl. Geogr. 2009, 29, 194–200. [Google Scholar] [CrossRef]
- Khera, N.; Mehta, V.; Sabata, B.C. Interrelationship of birds and habitat features in urban greenspaces in Delhi, India. Urban For. Urban Green. 2009, 8, 187–196. [Google Scholar] [CrossRef]
- Waran, A.; Patwardhan, A. Urban Carbon Burden of Pune City: A Case Study from India. Master’s Thesis, Department of Environmental Sciences, University of Pune, Pune, IN, USA, 2001. [Google Scholar]
- Gill, S.E.; Handley, J.F.; Ennos, A.R.; Pauleit, S. Characterising the urban environment of UK cities and towns: A tem- plate for landscape planning. Landsc. Urban Plan. 2008, 87, 210–222. [Google Scholar] [CrossRef]
- Whitford, V.; Ennos, A.R.; Handley, J.F. “City form and natural process”–indicators for the ecological performance of urban areas and their application to Merseyside, UK. Landsc. Urban Plan. 2001, 57, 91–103. [Google Scholar] [CrossRef]
- Gupta, R.B.; Chaudhari, P.; Wate, S. Floristic diversity in urban forest area of NEERI Campus, Nagpur, Maharashtra (India). J. Environ. Sci. Eng. 2008, 50, 55–62. [Google Scholar] [PubMed]
- Surawar, M.; Kotharkar, R. Assessment of Urban Heat Island through Remote Sensing in Nagpur Urban Area Using Landsat 7 ETM+. Int. J. Civ. Environ. Struct. Constr. Archit. Eng. 2017, 11, 851–857. [Google Scholar]
- Dhyani, S.; Lahoti, S.; Khare, S.; Pujari, P. Verma; Ecosystem based Disaster Risk Reduction approaches (EbDRR) as a prerequisite for inclusive urban transformation of Nagpur City, India. Int. J. Disaster Risk Reduct. 2018, 32, 95–105. [Google Scholar] [CrossRef]
- Ugemuge, N.R. Flora of Nagpur District, Maharashtra State; Shree Prakashan: Nagpur, India, 1986. [Google Scholar]
- Chaturvedi, A.; Kamble, R.; Patil, N.G.; Chaturvedi, A. City–forest relationship in Nagpur: One of the greenest cities of India. Urban For. Urban Green. 2013, 12, 79–87. [Google Scholar] [CrossRef]
- Lahoti, S.; Kefi, M.; Lahoti, A.; Saito, O. Mapping Methodology of Public Urban Green Spaces Using GIS: An Example of Nagpur City, India. Sustainability 2019, 11, 2166. [Google Scholar] [CrossRef] [Green Version]
- Threlfall, C.G.; Ossola, A.; Hahs, A.K.; Williams NS, G.; Wilson, L.; Livesley, S.J. Variation in Vegetation Structure and Composition across Urban Green Space Types. Front. Ecol. Evol. 2016, 4, 1–12. [Google Scholar] [CrossRef] [Green Version]
- Lahoti, S.; Lahoti, A.; Saito, O. Benchmark Assessment of Recreational Public Urban Green Space Provisions: A Case of Typical Urbanizing Indian City, Nagpur. Urban For. Urban Green. 2019, 44, 126424. [Google Scholar] [CrossRef]
- Tree. In I-Tree Eco User’s Manual v.6.0; Available online: https://www.itreetools.org/resources/manuals/Ecov6_ManualsGuides/Ecov6_UsersManual.pdf (accessed on 4 January 2019).
- Curtis, J.; McIntosh, R.P. An upland forest continuumin the prairie forest border re gion of Wisconsin. Ecology 1951, 32, 476–496. [Google Scholar] [CrossRef]
- Lu, D.S. The potential and challenge of remote sensing based biomass estimation. Int. J. Remote Sens. 2006, 27, 1297–1328. [Google Scholar] [CrossRef]
- Brown, S.; Gillespie, A.; Lugo, A. Biomass estimation methods for tropical forests with applications to forest inventory data. For. Sci. 1989, 35, 881–902. [Google Scholar]
- Hughes, R.F.; Kauffman, J.B.; Jaramillo, V.J. Biomass, carbon, and nutrient dynamics of secondary forests in a humid tropical region of Mexico. Ecology 1999, 80, 1897–1907. [Google Scholar]
- Henry, M.; Bombelli, A.; Trotta, C.; Alessandrini, A.; Birigazzi, L.; Sola, G.; Santenoise, P.E. GlobAllomeTree: International platform for tree allometric equations to support volume, biomass and carbon assessment. Iforest Biogeosci. For. 2013, 6, 326–330. [Google Scholar] [CrossRef] [Green Version]
- Nowak, D.J. Air pollution removal by Chicago’s Urban Forest. In Chicago’s Urban Forest Ecosystem: Results of the Chicago Urban Forest Climate Project; US Department of Agriculture, Forest Service, Northeastern Forest Experiment Station: Upper Darby, PA, USA, 1994; pp. 63–83. [Google Scholar]
- Ravindranath, N.H.; Ostwald, M. Carbon Inventory Methods. 2008. Available online: https://www.springer.com/cn/book/9781402065460 (accessed on 1 May 2018).
- Chave, J.; Andalo, C.; Brown, S.; Cairns, M.A.; Chambers, J.Q.; Eamus, D.; Yamakura, T. Tree allometry and improved estimation of carbon stocks and balance in tropical forests. Oecologia 2005, 145, 87–99. [Google Scholar] [CrossRef]
- Pandya, I.Y.; Salvi, H.; Chahar, O.; Vaghela, N. Quantitative analysis on carbon storage of 25 valuable tree species of Gujarat, India. Indian J. Sci. Res. 2013, 4, 137–141. [Google Scholar]
- Forest Survey of India (FSI). Volume Equations for Forests of India, Nepal and Bhutan. Forest Survey of India; Ministry of Environment and Forests, Govt. of India: Dehradun, India, 1996.
- Aguaron, E.; McPherson, E.G. Comparison of Methods for Estimating Carbon Dioxide Storage by Sacramento’s Urban Forest. In Carbon Sequestration in Urban Ecosystems; Lal, R., Augustin, B., Eds.; Springer Science: Dordrecht, The Netherlands, 2012. [Google Scholar] [CrossRef]
- Ngo, K.M.; Lum, S. Aboveground biomass estimation of tropical street trees. J. Urban Ecol. 2018, 4, jux020. [Google Scholar] [CrossRef] [Green Version]
- Chow, P.; Rolfe, G.L. Carbon and hydrogen contents of short-rotation biomass of five hardwood species. Wood Fiber Sci. 1989, 21, 30–36. [Google Scholar]
- Magnussen, S.; Reed, D. Modelling for Estimation and Monitoring. FAO-IUFRO 2004, 1, 111–136. [Google Scholar]
- Brack, C.L. Pollution Mitigation and Carbon Sequestration by an Urban Forest. Environ. Pollut. 2002, 116, 195–200. [Google Scholar] [CrossRef]
- Kent, M. Vegetation Description and Data Analysis: A Practical Approach, 2nd ed.; Wiley-Blackwell: Hoboken, NJ, USA, 2011; ISBN 978-0-471-49093-7. [Google Scholar]
- Mani, S.; Parthasarathy, N. Above-ground biomass estimation in ten tropical dry evergreen forest sites of peninsular India. Biomass Bioenergy 2007, 31, 284–290. [Google Scholar] [CrossRef]
- Murali, K.S.; Bhat, D.M.; Ravindranath, N.H. Biomass estimation equations for tropical and evergreen forests. Int. J. Agri.-Cult. Resour. Gov. Ecol. 2005, 4, 81–92. [Google Scholar] [CrossRef] [Green Version]
- Kumar, A.; Sharma, M.P. Estimation of carbon stocks of Balganga Reserved Forest, Uttarakhand, India. For. Sci. Technol. 2015, 11, 177–181. [Google Scholar] [CrossRef]
- Borah, N.; Nath, A.J.; Das, A.K. Aboveground Biomass and Carbon Stocks of Tree Species in Tropical Forests of Cachar District, Assam, Northeast India. Int. J. Ecol. Environ. Sci. 2013, 39, 97–106. [Google Scholar]
- Rahman, M.M.; Kabir, M.E.; Jahir Uddin Akon AS, M.; Ando, K. High carbon stocks in roadside plantations under participatory management in Bangladesh. Glob. Ecol. Conserv. 2015, 3, 412–423. [Google Scholar] [CrossRef] [Green Version]
- Joshi, R.K.; Dhyani, S. Biomass, carbon density and diversity of tree species in tropical dry deciduous forests in Central India. Acta Ecol. Sin. 2018, 39, 289–299. [Google Scholar] [CrossRef]
- Gandhi, S.D.; Sundarapandian, S. Large-scale carbon stock assessment of woody veg- etation in tropical dry deciduous forest of Sathanur reserve forest, Eastern Ghats India Environ. Monit. Assess. 2017, 189, 187–196. [Google Scholar] [CrossRef] [PubMed]
- Meena, A.; Bidalia, A.; Hanief, M.; Dinakaran, J.; Rao, K. Assessment of above- and belowground carbon pools in a semi-arid forest ecosystem of Delhi, India. Ecol. Process. 2019, 8, 8. [Google Scholar] [CrossRef] [Green Version]
- Sallustio, L.; Quatrini, V.; Geneletti, D.; Corona, P.; Marchetti, M. Assessing land take by urban development and its impact on carbon storage: Findings from two case studies in Italy. Environ. Impact Assess. Rev. 2015, 54, 80–90. [Google Scholar] [CrossRef] [Green Version]
- Liu, Y.; Meng, Q.; Zhang, J.; Zhang, L.; Jancso, T.; Vatseva, R. An effective Building Neighborhood Green Index model for measuring urban green space. In International Journal of Digital Earth; Taylor and Francis: Milton Park, UK, 2015. [Google Scholar] [CrossRef]
- Devi, R. Carbon storage by trees in urban parks: A case study of Jammu, Jammu and Kashmir, India. Int. J. Adv. Res. Dev. 2017, 2, 250–253. [Google Scholar]
- Ministry of Urban Development (MoUD). City Development Plan for Nagpur, 2041; Government of India, 2015. Available online: http://www.metrorailnagpur.com/pdf/FinalCDP_Nagpur-Mar15ofNMC.pdf (accessed on 1 December 2018).
- Profous, G.V.; Rowntree, R.A.; Loeb, R.E. The urban forest land- scape of Athens, Greece: Aspects of structure, planning and management. Arboric. J. 1998, 12, 83–108. [Google Scholar] [CrossRef]
- Mishra, A.K.; Sharma, M.P.; Singh, H.B. Addition to the Flora of Delhi. Indian J. Plant Sci. 2015, 4, 1–6. [Google Scholar]
- Pandey, R.K.; Kumar, H. Tree Species Diversity And Composition In Urban Green Spaces Of Allahabad City (U.P). Plant Arch. 2018, 18, 2687–2692. [Google Scholar]
- Bhalla, P.; Bhattacharya, P. Urban Biodiversity and Green Spaces in Delhi: A Case Study of New Settlement and Lutyens’ Delhi. J. Hum. Ecol. 2017, 52, 83–96. [Google Scholar] [CrossRef]
- Magurran, A.E. Measuring Biological Diversity; Blackwell Science Ltd.: Cornwall, UK, 2004. [Google Scholar]
- Chacalo, A.; Aldama, A.; Grabinsky, J. Street tree inventory in Mexico City. J. Arboric. 1994, 20, 222–226. [Google Scholar]
- Thaiutsa, B.; Puangchit, L.; Kjelgren, R.; Arunpraparut, W. Urban green space, street tree and heritage large tree assessment in Bangkok, Thailand. Urban For. Urban Green. 2008, 7, 219–229. [Google Scholar] [CrossRef]
- Sudhira, H.S.; Ramachandra, T.V.; Subrahmanya, M.H.B. City profile Bangalore. Cities 2007, 24, 379–390. [Google Scholar] [CrossRef]
- Nair, J. The Promise of the Metropolis: Bangalore’s Twentieth Century; Oxford University Press: Oxford, UK, 2005. [Google Scholar]
- Baishya, R.; Barik, S.K.; Upadhaya, K. Distribution patter of aboveground biomass in natural and plantation forests of humid tropics in north-east India. Trop. Ecol. 2009, 50, 295–304. [Google Scholar]
- Mansell, M.G. Rural and Urban Hydrology; Thomas Telford Ltd.: London, UK, 2003. [Google Scholar]
- Watson, G.W.; Kelsey, P. The impact of soil compaction on soil aera- tion and fine root density of Quercus palustris. Urban For. Urban Green. 2006, 4, 69–74. [Google Scholar] [CrossRef]
- Jim, C. Sustainable urban greening strategies for compact cities in developing & developed economies. Urban Ecosyst. 2012, 16, 741–761. [Google Scholar]
- McPherson, E.G.; Nowak, D.; Heisler, G.; Grimmond, S.; Souch, C.; Grant, R.; Rowntree, R. Quantifying urban forest structure, function and value: The Chicago Urban Forest Climate Project. Urban Ecosyst. 1997, 1, 49–61. [Google Scholar] [CrossRef]
- Pauleit, S.; Duhme, F. Assessing the environmental performance of landcover types for urban planning. Landsc. Urban Plan. 2000, 52, 1–20. [Google Scholar] [CrossRef]
- Anamika, A.; Pradeep, C. Urban Vegetation and Air Pollution Mitigation: Some Issues from India. Chin. J. Urban Environ. Stud. 2016, 4, 1650001. [Google Scholar] [CrossRef]
- Chaudhry, P.; Bagra, K.; Singh, B. Urban Greenery Status of Some Indian Cities: A Short Communication. Int. J. Environ. Sci. Dev. 2011, 2, 98–101. [Google Scholar] [CrossRef]
- Tengö, M.; Gopal, D. Nagendra H (NA) Sacred Trees in the Urban Landscape of Bangalore, India. Current Conservation, Issue 8.1. Available online: https://www.currentconservation.org/?s=issue+8.1 (accessed on 1 April 2019).
- Keesstra, S.D.; Bouma, J.; Wallinga, J.; Tittonell, P.; Smith, P.; Bardgett, R.D. The significance of soils and soil science towards realization of the United Nations Sustainable Development Goals. Soil 2016, 2, 111–128. [Google Scholar] [CrossRef] [Green Version]
- Keesstra, S.; Mol, G.; de Leeuw, J.; Okx, J.; de Cleen, M.; Visser, S. Soil-related sustainable development goals: Four concepts to make land degradation neutrality and restoration work. Land 2018, 7, 133. [Google Scholar] [CrossRef] [Green Version]
- Lahoti, S.; Lahoti, A.; Saito, O. Application of Unmanned Aerial Vehicle (UAV) for Urban Green Space Mapping in Urbanizing Indian Cities. In Unmanned Aerial Vehicle: Applications in Agriculture and Environment; Ram, A., Teiji, W., Eds.; Springer: Basel, Switzerland, 2020; ISBN 978-3-030-27156-5. [Google Scholar] [CrossRef]
Figure 1.
(a) Geographic Location of Study Area Nagpur District, Maharashtra, India; (b) Nagpur city administrative boundary with ten administrative zone and the selected typical zones.
Figure 1.
(a) Geographic Location of Study Area Nagpur District, Maharashtra, India; (b) Nagpur city administrative boundary with ten administrative zone and the selected typical zones.

Figure 2.
Urban green spaces (UGS) map showing different classes and sampled plots.

Figure 3.
Species accumulation curve for UGS class: Parks and Garden (P&G), Playground (PG), Lake (LK), Forest (FST), River (RV), Institutional greens (INST), Road network (RD), and Vacant land (VL).
Figure 3.
Species accumulation curve for UGS class: Parks and Garden (P&G), Playground (PG), Lake (LK), Forest (FST), River (RV), Institutional greens (INST), Road network (RD), and Vacant land (VL).

Figure 4.
Outcome of canonical correspondence analysis (CCA) for UGS classes in study area, where axis 1 represents green space class and axis 2 represents tree species. Abbreviation used for tree species: AC, Acacia catechu; AA, Acacia arabica; AL, Acacia Lecophloea; AE, Ailanthus excelsa; AL, Albizia Lebbeck; Aod, Albizia odoratissima; AS, Alstonia scholaris; Asq, Annona squamosa; AI, Azadirachta indica; BV, Bauhinia variegata; BC, Bombax ceiba; BS, Boswellia serrata; BF, Butea frondosa; CV, Callistemon viminalis; CF, Cassia fistula; CS, Cassia siamea; CP, Ceiba pentandra; CSw, Chloroxylon swietenia; DL, Dalbergia latifolia; DP, Dalbergia paniculata; DS, Dalbergia sissoo; DR, Delonix regia; DM, Diospyros melanoxylon; EG, Eucalyptus globulus; EJ, Eugenia jambolana; FB, Ficus benghalensis; FE, Ficus elastica; FG, Ficus glomerata; FR, Ficus Religiosa; FSp, Ficus sp.; GR, Gardenia resinifera; GP, Garuga pinnata; GA, Gmelina arborea; HB, Hardwickia binata; KP, Kigelia pinnata; LP, Lagerstroemia parvifolia; LS, Lagerstroemia speciosa; LC, Lannea coromandelica; LL, Leucaena leucocephala; ML, Madhuca latifolia; MI, Mangifera indica; MH, Manilkara hexandra; MA, Melia azedarach; MHo, Millingtonia hortensis; ME, Mimusops elengi; MP, Mitragyna parvifolia; MO, Moringa oleifera; MAl, Morus alba; MK, Murraya koenigii; NC, Neolamarckia cadamba; NA, Nyctanthes arbortritis; PP, Peltophorum pterocarpum; PD, Pithecellobium dulce; PA, Plumeria alba; PL, Polyalthia longifolia; PPi, Pongamia pinnata; PJ, Prosopis juliflora; PG, Psidium guajava; PM, Pterocarpus marsupium; SM, Sapindus mukorossi; SS, Schrebera swietenioides; SF, Soymida febrifuga; SU, Sterculia urens; TI, Tamarindus indica; TS, Tecoma stans; TG, Tectona grandis; TA, Terminalia arjuna; TC, Terminalia catappa; TD, Trichilia dregeana; UI1; UI2; UI3; UI4; UI5; UI6; UI7; UI8; UI9; UI10; UI11; UI12; UI13; VF, Vachellia farnesiana; VN, Vachellia nilotica, ZM, Ziziphus mauritiana; ZSp, Ziziphus sp.

Figure 5.
Size class distribution of tree frequency and basal area (BA) (m2) in different UGS classes (X-axis represent the diameter class of trees and on Y-axis number of trees and basal area is represented. For the UGS classes the number of individuals varied and hence Y axis in the bar chart varied between range of 0–160 for park and garden (a), institutions (b), road (c) and for playground (d), river (e), lake (f) and vacant land (g) between 0–60, while for forest (h) it is between 0–350).

Figure 6.
(a) Above ground biomass (AGB), biomass (TB), and Cstock distribution in different UGS classes. (b) Distribution of TB and Cstock with no. of individuals in tree with different diameter class along with BA (m2) in different UGS classes.
Figure 6.
(a) Above ground biomass (AGB), biomass (TB), and Cstock distribution in different UGS classes. (b) Distribution of TB and Cstock with no. of individuals in tree with different diameter class along with BA (m2) in different UGS classes.

Figure 7.
(a) Correlation between importance value index (IVI) and AGB (b) IVI and AGB of dominant species identified in cities UGS.
Figure 7.
(a) Correlation between importance value index (IVI) and AGB (b) IVI and AGB of dominant species identified in cities UGS.


Table 1.
Urban green space classes used as pre-stratification along with the number of samples within each representative zone, the plot size and plot shape used in sampling.
Table 1.
Urban green space classes used as pre-stratification along with the number of samples within each representative zone, the plot size and plot shape used in sampling.
| Green Space Classes | Number of Plots | Plot Size (m2) | Plot Shape |
|---|---|---|---|
| Parks and Garden | 30 | 314 | Circular |
| Playground | 18 | 314 | Circular |
| Lake | 20 | 300 | Linear |
| Forest | 50 | 314 | Circular |
| River | 25 | 300 | Linear |
| Institution | 32 | 314 | Circular |
| Road | 53 | 300 | Linear |
| Vacant land | 18 | 314 | Circular |
Table 2.
Phytosociology and diversity attributes of eight UGS classes of Nagpur city.
| UGS Classes | No. of Species | No. of Families | S (Species Richness) | Shannon (H) | Simpson (1-D) | Pielou J (Evenness) | Basal Area (m2 ha−1) |
|---|---|---|---|---|---|---|---|
| Parks and Garden | 31 | 29 | 1.89 | 3.06 | 0.94 | 0.55 | 32.06 |
| Playground | 24 | 19 | 2.08 | 2.77 | 0.92 | 0.57 | 31.90 |
| Lake | 22 | 20 | 1.91 | 2.7 | 0.92 | 0.55 | 31.30 |
| Forest | 33 | 25 | 1.20 | 1.84 | 0.64 | 0.28 | 28.99 |
| River | 30 | 25 | 2.36 | 2.98 | 0.94 | 0.59 | 17.38 |
| Institutions | 46 | 35 | 2.72 | 3.14 | 0.93 | 0.55 | 29.30 |
| Road | 49 | 39 | 2.11 | 3.3 | 0.95 | 0.53 | 37.55 |
| Vacant land | 23 | 20 | 2.52 | 2.7 | 0.92 | 0.67 | 11.91 |
© 2020 by the authors. Licensee MDPI, Basel, Switzerland. This article is an open access article distributed under the terms and conditions of the Creative Commons Attribution (CC BY) license (http://creativecommons.org/licenses/by/4.0/).
Share and Cite
MDPI and ACS Style
Lahoti, S.; Lahoti, A.; Joshi, R.K.; Saito, O. Vegetation Structure, Species Composition, and Carbon Sink Potential of Urban Green Spaces in Nagpur City, India. Land 2020, 9, 107. https://doi.org/10.3390/land9040107
AMA Style
Lahoti S, Lahoti A, Joshi RK, Saito O. Vegetation Structure, Species Composition, and Carbon Sink Potential of Urban Green Spaces in Nagpur City, India. Land. 2020; 9(4):107. https://doi.org/10.3390/land9040107
Chicago/Turabian StyleLahoti, Shruti, Ashish Lahoti, Rajendra Kumar Joshi, and Osamu Saito. 2020. "Vegetation Structure, Species Composition, and Carbon Sink Potential of Urban Green Spaces in Nagpur City, India" Land 9, no. 4: 107. https://doi.org/10.3390/land9040107
Note that from the first issue of 2016, this journal uses article numbers instead of page numbers. See further details here.